Expanded Construction One Portfolio enables an end-to-end digital experience for heavy civil and infrastructure contractors to enhance productivity, profitability and sustainability
Trimble has acquired privately held B2W Software, a provider of estimating and operations solutions for the heavy civil construction industry. Financial terms were not disclosed.
With the passage of the U.S. Infrastructure Investment and Jobs Act (IIJA) and other infrastructure legislation across the globe, construction organizations are fast-tracking the digitization of their processes and operations. As infrastructure projects become increasingly complex, data-driven insights and analytics will be imperative to improve productivity, increase efficiency and drive sustainability.
“Seamlessly connected workflows are key to unlocking the true potential of an organization’s data,” said Elwyn McLachlan, vice president of Trimble’s Civil Solutions Division. “With the acquisition of B2W, Trimble will be able to provide an unparalleled end-to-end digital experience — connecting the digital to the physical — for heavy civil and infrastructure contractors.”
The addition of B2W’s comprehensive suite of pre-construction and operations capabilities will expand Trimble’s already extensive civil infrastructure portfolio and Trimble Construction One, a purpose-built connected construction management platform.
Photo: Trimble
B2W’s integrated suite of applications includes estimating, scheduling, field tracking, equipment maintenance, data capture and business intelligence. By combining these capabilities with Trimble’s field data, project management, finance and human capital management solutions, civil contractors will be able to bridge the gap between office and field in new ways, promoting transparency, efficiency and ultimately profitability.
“B2W has helped thousands of heavy civil contractors increase their bid accuracy and operational efficiency,” said Paul McKeon, B2W founder and CEO. “Now with Trimble, we can realize the next chapter of our story. By linking the planned with the executed, we will provide civil contractors with a truly connected construction experience, unlocking valuable new insights for our customers across their entire operation.”
B2W will be reported as part of the Buildings and Infrastructure segment.
Perkins Coie LLP acted as legal advisor to Trimble. Piper Sandler & Co. acted as a financial advisor and Foley Hoag LLP acted as legal advisor to B2W Software.
With Congressional approval of $17 billion in infrastructure funding, the largest single allocation ever, the scramble to win contracts is about to get red hot and AEC firms are gearing up. In this very competitive game, top engineering firms are relying on their experience, technology, business acumen and ability to execute.
Advances in aerial mapping play a key role in how AEC firms pursue these contracts. Savvy firms have been using this technology for years. Rather than rely on lower resolution satellite imagery or local drone imagery, they use wide-area-coverage aerial maps to clearly display the detail needed to plan and execute.
Over the past decade, maps made using aerial photogrammetry have played an important role in the AEC space. Using high-performance cameras, fleets of planes capture hundreds of square miles per plane per day, provided that the weather is clear. The imagery is processed and made available to engineering companies within days of capture, allowing them to see very clear imagery.
AEC organizations use different forms of aerial maps to evaluate sites, improve their survey designs, and build and maintain infrastructure (roads, highways, bridges, tunnels, overpasses, rail, airports, housing, commercial building development, water resources, parks, pavement and more). Imagine you’re a state or local government that needs to build a bridge, or a developer who wants to contract with an engineering and construction firm to build affordable housing. Why travel to perform time-consuming site evaluations when you can meet with engineering teams in your office and review hundreds of potential sites instantly using current aerial photos that show change over time?
The engineering teams point out elevation changes, the presence and height of vegetation, neighboring communities, bodies of water, ponding and more. They easily navigate from one location to another as you discuss where the entrance to the community could be, how the road network might be configured, and the proximity to retail, schools and healthcare. Within minutes you measure risk, understand the landscape, make decisions, and begin to estimate the project costs. Your teams collaborate, discuss the pros and cons, measure distances and navigate across the terrain virtually.
Aerial mapping provides a competitive advantage for AEC companies to win their fair share of the infrastructure bill. It also gives governments and developers the confidence they need to make the right decisions. Typically, this involves looking at sites from all angles. The classic form of aerial mapping used by engineers is a top-down perspective. Increasingly, these organizations have used oblique imagery captured at an angled perspective, which shows height.
Artificial Intelligence and Aerial Photography
Starting a few years ago, 3D imagery and digital surface models began to allow engineers to navigate through the imagery and query it based on elevation. More recently, aerial mapping has leveraged artificial intelligence (AI) to classify properties and the landscape. Do you need to see nearby construction sites? AI applied to aerial photography can do that automatically. This rich set of data includes attributes such as tree overhang, roof condition, roof material, building footprints, vegetation height, surface material, swimming pools and even solar panels.
The blend of all these imagery types and AI into a single solution makes everything discoverable. Users can search by address, city, location or point of interest. They can visualize the imagery along with lat/long coordinates and quickly switch from top-down views to obliques to 3D. As they learn more about the landscape, they begin to turn on AI attributes, gaining deeper insights.
Sometimes, the analyses go even further. Engineering organizations export the imagery to tools of their choice from such companies as Autodesk, Esri or Bentley Systems, use field-collected ground control points to ensure that it is survey grade, then use it as a base layer for their designs. They even create marketing presentations and video content to help them win the business. Current high-resolution aerial maps have become a cornerstone of how these organizations operate.
This approach provides unique advantages for engineering firms. For example, they can combine geospatial and construction datasets in a common operating environment to reduce complexity, streamline communication, ensure that all stakeholders are up to date, and check their progress toward meeting contractual obligations.
Planners have current, contextual designs and models to make accurate decisions about planning and development activities. They can view asset locations and conditions to facilitate maintenance and upgrades, leverage aerial maps inside other platforms to improve work orders and reduce field visits, and ensure regulatory compliance.
Whether it’s improving highway safety, constructing ferry terminals, improving transportation systems, developing land or building a network of recreational trails, aerial imagery provides engineering and construction companies with a competitive advantage to win new business, improve client satisfaction and meet growth targets. With $17 billion on the line, sophisticated firms are finding a way to secure their fair share of the pie.
Net Insight’s sync solution becomes fully PTP-standard compliant with synchronization module for 5G and other mission-critical networks
Net Insight has selected Meinberg’s precision time protocol (PTP) software stack — Precision TimeNet — to implement full PTP functionality in all of its platforms.
The Precision TimeNet solution offers a GNSS-independent delivery of high-accuracy timing across any IP vendor network, which can significantly reduce the cost and rollout times of 5G and other mission-critical networks.
In 2021, Meinberg also delivered a synchronization module to Net Insight’s Nimbra MSR 300 series, providing full PTP IEEE 1588v2 interoperability and GNSS integration for 5G networks. The new module is part of the Nimbra Time Node, an important component of the Precision TimeNet solution.
Net Insight licensed the PTP stack from Oregano Systems, owned by Meinberg, to deliver network synchronization for both media and 5G networks. Meinberg leverages Net Insight’s network synchronization capabilities to serve customers across the telecom, fintech, government, and power telecom industries. The expansion into a strategic technology partnership means that both companies will utilize their expertise in time synchronization to deploy solutions that remove the challenges of reliable precision timing over any IP network.
“The shift to IP is accelerating, making precision timing key to the successful deployment of new applications,” said Heiko Gerstung, managing director of Meinberg. “Net Insight’s Precision TimeNet offers a unique solution on the market that we see a strong and growing need for, across multiple industries. We’re excited to be working with Net Insight, a leader in mission-critical IP transport, to drive innovation and enable our customers to benefit from GNSS-independent time synchronization.”
“Net Insight has been developing time transfer for nearly two decades, delivering industry-leading time accuracy and resilience over IP networks,” said Per Lindgren, CTO and co-founder at Net Insight. “When expanding our synchronization business into new markets, integrating with the IEEE 1588 PTP standard was key to enhancing our interoperability. Teaming up with Meinberg, a leader in time and frequency synchronization, was the obvious choice.. We’re excited that our joint expertise in IP networking and time synchronization will enable us to reinvent precision timing for our customers.”
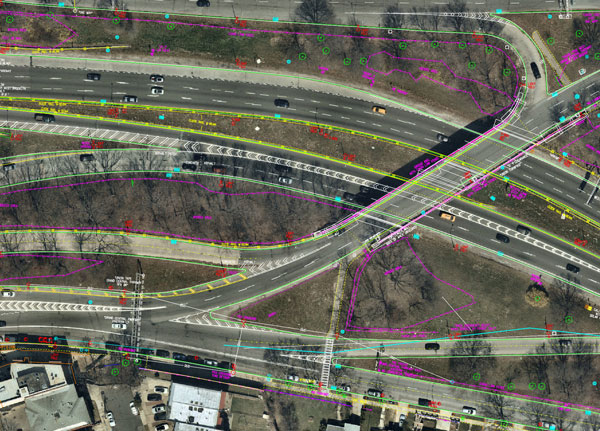
Nearmap aerial imagery is used as a basis for survey linework. Photo: Nearmap
With Congressional approval of $17 billion in infrastructure funding, the largest single allocation ever, the scramble to win contracts is about to get red hot and AEC firms are gearing up. In this very competitive game, top engineering firms are relying on their experience, technology, business acumen and ability to execute.
Advances in aerial mapping play a key role in how AEC firms pursue these contracts. Savvy firms have been using this technology for years. Rather than rely on lower resolution satellite imagery or local drone imagery, they use wide-area-coverage aerial maps to clearly display the detail needed to plan and execute.
Over the past decade, maps made using aerial photogrammetry have played an important role in the AEC space. Using high-performance cameras, fleets of planes capture hundreds of square miles per plane per day, provided that the weather is clear. The imagery is processed and made available to engineering companies within days of capture, allowing them to see very clear imagery.
AEC organizations use different forms of aerial maps to evaluate sites, improve their survey designs, and build and maintain infrastructure (roads, highways, bridges, tunnels, overpasses, rail, airports, housing, commercial building development, water resources, parks, pavement and more). Imagine you’re a state or local government that needs to build a bridge, or a developer who wants to contract with an engineering and construction firm to build affordable housing. Why travel to perform time-consuming site evaluations when you can meet with engineering teams in your office and review hundreds of potential sites instantly using current aerial photos that show change over time?
The engineering teams point out elevation changes, the presence and height of vegetation, neighboring communities, bodies of water, ponding and more. They easily navigate from one location to another as you discuss where the entrance to the community could be, how the road network might be configured, and the proximity to retail, schools and healthcare. Within minutes you measure risk, understand the landscape, make decisions, and begin to estimate the project costs. Your teams collaborate, discuss the pros and cons, measure distances and navigate across the terrain virtually.
Aerial mapping provides a competitive advantage for AEC companies to win their fair share of the infrastructure bill. It also gives governments and developers the confidence they need to make the right decisions. Typically, this involves looking at sites from all angles. The classic form of aerial mapping used by engineers is a top-down perspective. Increasingly, these organizations have used oblique imagery captured at an angled perspective, which shows height.
Artificial Intelligence and Aerial Photography
Starting a few years ago, 3D imagery and digital surface models began to allow engineers to navigate through the imagery and query it based on elevation. More recently, aerial mapping has leveraged artificial intelligence (AI) to classify properties and the landscape. Do you need to see nearby construction sites? AI applied to aerial photography can do that automatically. This rich set of data includes attributes such as tree overhang, roof condition, roof material, building footprints, vegetation height, surface material, swimming pools and even solar panels.
The blend of all these imagery types and AI into a single solution makes everything discoverable. Users can search by address, city, location or point of interest. They can visualize the imagery along with lat/long coordinates and quickly switch from top-down views to obliques to 3D. As they learn more about the landscape, they begin to turn on AI attributes, gaining deeper insights.
Sometimes, the analyses go even further. Engineering organizations export the imagery to tools of their choice from such companies as Autodesk, Esri or Bentley Systems, use field-collected ground control points to ensure that it is survey grade, then use it as a base layer for their designs. They even create marketing presentations and video content to help them win the business. Current high-resolution aerial maps have become a cornerstone of how these organizations operate.
This approach provides unique advantages for engineering firms. For example, they can combine geospatial and construction datasets in a common operating environment to reduce complexity, streamline communication, ensure that all stakeholders are up to date, and check their progress toward meeting contractual obligations.
Planners have current, contextual designs and models to make accurate decisions about planning and development activities. They can view asset locations and conditions to facilitate maintenance and upgrades, leverage aerial maps inside other platforms to improve work orders and reduce field visits, and ensure regulatory compliance.
Whether it’s improving highway safety, constructing ferry terminals, improving transportation systems, developing land or building a network of recreational trails, aerial imagery provides engineering and construction companies with a competitive advantage to win new business, improve client satisfaction and meet growth targets. With $17 billion on the line, sophisticated firms are finding a way to secure their fair share of the pie.
A PNT expert suggested that my piece titled “Opposite and Complementary: eLoran is part of the solution to GNSS vulnerability” in our November 2021 issue could be augmented with information not currently available on the proposed eLoran capability. This expert also questioned my statement that eLoran “does not have any common failure modes with GNSS” and pointed to potential common threats such as from cyberattacks, physical attacks, and space weather.
Matteo Luccio
I welcome such feedback on the contents of these pages — and agree that in this case some hard questions are warranted. So, in the interest of further exploring the use of eLoran, I pose some questions, hoping that its advocates will provide answers. I know that at least some of them will not shy away from this challenge.
Please note that I wish to keep the discussion on positioning, not the easier question of timing, because that was the primary focus of my article. I also wish to address long-term outages (weeks or months), which would have a greater impact on the United States.
Some of these questions have been addressed, at least in part, in various studies and proposals, most of them now more than a decade old. So, it would be helpful to update those answers and consolidate them in the pages of this magazine.
1. Accuracy specifics. While my November article stated that eLoran would have a two-dimensional accuracy of “better than 20 meters, and in many cases, better than 10 meters,” is that RMS, 95%, or some other statistic?
2. Performance standard. GPS provides a commitment to users in a published performance standard. What specific measures of positioning accuracy, integrity and continuity would you recommend the proposed eLoran system be committed to provide (using the architecture described in the answer to Question 6)?
3. Coverage. Would you recommend this eLoran positioning performance hold for the entire United States (including Alaska, Hawaii, Puerto Rico and other territories), only for the “lower 48” states, or only parts of these 48 states?
4. Current users. By number of users, the predominant common current civil uses of GNSS for positioning are consumer devices (mostly cellphones). By contribution to the U.S. economy, the predominant uses are high-precision applications. For what fraction of these uses would eLoran positioning be adequate? Could an eLoran receiver and antenna fit in today’s consumer devices?
5. Future uses. Emerging civil uses of GPS for positioning include autonomous ground and air vehicles, navigation to space and in space, and lane-accurate car navigation. Which of these could be served by eLoran?
6. Architecture. To maintain accuracy during a prolonged GPS outage, eLoran would require reference stations to calibrate time-varying propagation errors, as well as a certain number of transmitters for good nationwide geometry and for redundancy, ensuring service even if a transmitter is attacked or is taken off-line for maintenance. What architecture would you recommend to achieve this?
7. Infrastructure cost. What would be the cost of installing the required transmitters, power supplies, reference stations, communication links and control system for the architecture described in the answer to Question 6? Can you reference a recent and independent estimate? To a ballpark figure, what cost fixed-price contract would you accept to implement it? Similarly, what would be the annual costs for operating and maintaining this infrastructure?
8. Impact. eLoran transmitters are large and high-power. Providing positioning across the United States could require building some of them from scratch or significantly reconstructing old Loran sites. What issues — such as environmental, aviation safety and security — would this raise, and how would you recommend they be addressed?
9. Receivers. Assuming all the above were achieved, it would accomplish nothing unless eLoran receivers were widely purchased, installed and used. How much would that cost? Who would pay? Should we assume that “if we build it, they will come”?
10. Alternatives. Given the widespread development of other positioning technologies over the past decade, much has changed since the earlier recommendations for eLoran. How do we know that eLoran is the right investment — or even a needed part of the solution or needed system in a system of systems — for the future of U.S. PNT?
Common threats to GNSS and eLoran could include the following:
1. Cyber attacks. Given that GPS’s OCX is said to be the most cybersecure system built by the U.S. Department of Defense, how would eLoran’s control system be even more cybersecure than OCX, to avoid a common cyber-vulnerability?
2. Physical attacks. Given concerns about possible physical attacks on GPS satellites, which move at multiple km/sec 20,000 km from Earth, would it not be easier to physically attack eLoran transmitters, which are stationary, terrestrial, in remote locations, and hundreds of feet tall and require massive power sources?
3. Space weather. GPS is potentially vulnerable to severe space weather that could damage satellites or temporarily hinder signal propagation from space to Earth. However, severe space weather could also damage the power grid upon which megawatt eLoran transmitters rely. How would eLoran service be protected from the effects of severe space weather, such as a Carrington Event?
Send me your thoughts at the e-mail address below, with “eLoran” in the subject line.
The surveying profession has experienced a plethora of advancing technology over the past two decades and it does not look like there will be a slowdown any time soon. From robotic total stations to laser scanning to the use of multiple GNSS constellations, the profession is constantly adapting these emerging technologies into a useful tool for daily applications. For most practicing surveyors, it is a challenge to keep up with not just the hardware of these advancements, but also with software, which is being developed in parallel. Have you tried to open and draw a simple figure in any of the industry standard CAD programs lately?
The complexity of these programs, while advancing the capability of many technical professions, forces even the casual user to maintain a regular habit of software education and training. While it may seem primitive to say that a practitioner is a “practicing” surveyor, on-the-job training never stops. Just when the profession thinks there are no more significant advancements, something comes out of left field that truly blindsides us. (See the adoption of UAVS by the surveying profession compared to the public sector…) What do I think will be one of the next “big things” to revolutionize surveying? The technology is already here, and we need to seriously get on board with adoption before we miss another opportunity to highlight the expertise of the profession.
VIRTUAL REALITY and AUGMENTED REALITY (VR & AR)
First, we need to know that virtual reality (VR) and augmented reality (AR) are different, even though many people use these terms interchangeably. The differences are as follows:
Virtual Reality (VR)
VR is a virtual world generated by computers and programming.
VR is a closed environment that is fully immersive.
VR requires a device (specialized glasses and/or a headset).
Users in the VR experience are limited by the programming and their computer’s abilities.
The VR experience may be based upon real-world conditions but is a fictional setting.
Users of VR can travel and experience conditions in real and fictitious places.
VR can allow users to have experiences that are not physically possible in the real world.
VR is 75% virtual + 25% real (industry “rule of thumb”)
Augmented Reality (AR)
AR is typically based on actual physical places.
AR is an open environment that is partly immersive.
In AR, the user controls the environment.
AR combines virtual elements and experiences with real world conditions.
Experiences in AR can be accessed by computer, tablet, and smartphones.
AR is useful for product visualization and evaluation.
AR is 75% real + 25% virtual (industry “rule of thumb”)
It is important to know these difference between the two technologies in order to implement the correct one for the task at hand. However, both will play an important in surveying for generations to come.
One of the surveyor’s biggest responsibilities is to complete an accurate site conditions model by topographic methods. Once the topographic survey is completed, site designers will utilize this information to create a unique project that works with the existing site conditions. Advances in CAD software and technology allow engineers and architects to design in 3D and blend the new site with the existing conditions, drainage, and utilities. These designs can be further refined into virtual reality models to give the project’s stakeholders a better indication of what the final product will be when construction is completed.
The key takeaway here is that the surveyor is responsible for delivering the existing conditions model. A model that accurately represents the subject site but in digital form enables the design of the project to be more efficient and realistic to meet the client’s expectation. Surveyers, however, will not use virtual reality as much as augmented reality, for many good reasons.
USES OF AUGMENTED REALITY TECHNOLOGY FOR SURVEYING
AR is still in its infancy. Because surveyors have an interest in the existing and proposed conditions of sites, the use of AR becomes an important tool for the future. Merging proposed information with existing site conditions can become the norm, but like many emerging technologies, the profession will need to learn how to embrace it.
To get a better idea of how the technology works and why surveyors need to consider using it, let us look at an application that showcases AR: Pokémon Go. Yes, the smartphone game app that took the world by storm in 2016 and captivated many “trainers” to search the streets for Ultra Balls and characters. (There are still more than 100 million active players worldwide.) Players of all ages have continued to search for elusive items and characters in a high-tech scavenger hunt that is constantly changing, and all based upon the real world around us. By merging a real-time view with game entities at random geographic locations, players move about our world using one of the best examples of AR.
How does this apply to the surveying profession? Surveyors could utilize AR in everyday tasks but that would require having a fully developed 3D design model that could merge with the existing conditions in their visual device. There are a variety of devices for utilizing AR, including smartphones and tablets. Many of the new data collectors running Windows and Android operating systems can also be used for incorporating AR into the field operation. Here are some examples of AR how can be utilized for surveying tasks:
While construction staking, AR can be used to assist with structure and improvement location. A quick visual check can help confirm staking calculations are consistent with engineering design.
Use AR to visually check installed improvements, including curbs, utility structures, and paving. Any deviation from the proposed design should be quite evident.
When establishing property corners, AR will help the field crew quickly determine whether the calculated location is accessible. This can be used for staking out pre-calculated boundary points and/or proposed lot corners in a new subdivision.
Here are a few ideas as to how surveyors could utilize AR in everyday tasks in the future:
As public utilities are becoming more available within GIS shape files with geographic locations, they could be utilized with AR to help visually establish locations in the field. Mainline utilities and service lines would become easier to physically verify using AR.
Another GIS shapefile entity, the parcel line layer, could be used to help the surveyor understand where the property owner believes the line(s) to be as opposed to the actual monumented location.
All reference monuments and benchmarks established by public agencies using geographic location information could enhance the “treasure hunt” of confirming local datum points.
SURVEYING USING AR TO PROTECT THE PUBLIC
Geospatial information has revolutionized our world, so using AR to help when trouble strikes can potentially be a lifesaver. Recently, an oceanfront condominium in Florida collapsed due to structural failure. While the age of the structure precluded it from having any digital geographic location data, any new similar development could be measured and recorded to assist with future emergency needs. Almost all new development has digital surveying, engineering, and architecture and must use local horizontal and vertical datums. Using the proposed information and verifying with post-construction record drawings, the digital record can be created.
It doesn’t take a design flaw to create a public hazard. For instance, a gas leak could render any building, such as the Florida condo, susceptible to catastrophic damage. By having a digital model of the underground structure, emergency crews could use AR to help locate potential open spaces in the building. As is the case with installing fire suppression systems and emergency exits, the cost to create a digital model of a completed building will be well worth it to save lives.
Underground utility corridors within cities, campuses, or manufacturing facilities could also utilize geospatial locations to establish a digital map for future use with AR. It will take time and significant cost to map existing facilities, yet it should be required for new sites to provide this information for emergencies and for use when designing expansions within the site. Having this utility information to use with AR during the design phase could lead to identifying potential problems before construction starts.
Haiti after an earthquake. (Photo: 1001nights/E+/Getty Images)
Another reason to plan for future safety is how much uncertainty we face in today’s society. At press time, we are coming up on the 20th anniversary of 9/11. We also just watched Haiti suffer another devastating earthquake. The 2021 hurricane season has also been very active, so that danger looms large, too. Disasters happen all the time with little to no warning. Our world is much more advanced than we were at the turn of the century, so we can use these advancements to map our infrastructure. Let us hope we never need to use the digital information for another disaster akin of 9/11. Instead, let us use it to ensure that we can get to someone in a remote spot if necessary.
THE ROAD TO FUTURE MAPPING AND AUTOMATION
As previously discussed, establishing a digital twin of our world could help provide a better map for establishing parcel ownership, reducing construction conflicts, and offering better planning tools for future expansion. Will it be completed within my lifetime? No, and I doubt it will be done within the next couple of generations after me.
We can, however, get a significant start on capturing the necessary information to begin the process of digitization. Technology has exceeded my expectations just within the past decade, so I can only hope that more advancements will help with building this digital beast. More architects and engineers are utilizing BIM (building information modeling) for 3D design and collaboration. Most municipalities and counties have built some form of GIS that uses one of the standard geographic datums. Surveyors have fully embraced GNSS technology so state plane and national geographic coordinate systems have become the norm. In addition, we are seeing a wide number of consultants use autonomous vehicles (aerial, hydro, and terrestrial) with photogrammetry, LiDAR, and SLAM remote sensing. Another bit of good news is that computing power is higher than ever and that storage space is cheap for all this data. We should also include how 5G has expanded our reach and, with cloud storage, we can work from just about anywhere. We can do so much more than most of us ever dreamed of, so we need to leverage that into creating a digital entity that can be helpful.
Photo: RyanJLane/E+/Getty Images
HOW TO IMPLEMENT THE LATEST TECHNOLOGY
Augmented reality is one of many new technologies surveyors need to introduce into their toolbox. Many of you may be asking where to begin; my answer, depending on your age, may offend you.
Hire a Gen Zer. Really.
As a Gen Xer, I have come to realize my limitations on technology and being able to fully implement it. The Z generation, while lacking the experience of us wily old guys, see things much differently. The smartphone/tablet/computer, and even the latest data collectors, are designed with them in mind. They grew up playing computer games based in virtual reality, developed excellent hand-eye coordination, and find efficient ways of getting things done. Our surveying world is almost completely digital (when is the last time a client only wanted paper copies of a plat?), so now is the time to make the leap and ditch the drafting table. We have as much to learn from them as they do from us. Together, we can get the surveying profession ready for the next generations. It has been a great profession for us, so let us hand it off to the Z generation. They will (eventually) be glad we did.
Deal makes data from 40 Chinese satellites available through UP42 now, another 40 by late 2021
UP42 has signed an agreement with HEAD Aerospace of Beijing to make image data from more than 40 Chinese Earth Observation satellites available on the UP42 marketplace.
The broad selection of imaging capabilities from the constellations dramatically expands the range of applications in multiple sectors, with the most significant benefits expected in infrastructure, transportation, utilities, agriculture and government.
The UP42 marketplace contains more than 50 geospatial data sets, including satellite imagery from six international organizations. The newly added satellites’ diverse and often unique imaging capabilities include wide-swath imaging at very high resolution, nighttime acquisitions, frequent intraday revisits, tri-stereo collection and hyperspectral imaging.
“This partnership is an important milestone for us as a company but, more importantly, for our customers. By diversifying our data sets, we are unlocking a broader spectrum of use cases for our users in multiple sectors. This is the true meaning of ‘democratizing access to Earth insights’,” said UP42 CEO Sean Wiid.
HEAD Aerospace is an international distributor of satellite imagery collected by commercial Earth Observation missions. The UP42-HEAD agreement includes imagery from multiple constellations, including SuperView, Earthscanner, Gaofen-7, DailyVision, NightVision, Hyperscan, and Tri-Stereo ZY3. These seven constellations will total more than 80 satellites by the end of 2021.
“Sharing a similar approach facilitating users’ easy access to an agnostic data source by a centralized portal with a wide choice of satellite attributes, we are glad to have partnered with UP42. This partnership represents another new milestone for us in expanding our global network.” said Kammy Brun, managing director of HEAD Aerospace.
While each satellite constellation was designed with one or more imaging specialties, a remarkable variety of operational capabilities are shared across the constellations to support numerous applications and industries. Examples include:
Large-Area Very High-Resolution Mapping – Planning and monitoring critical infrastructure, including utility transmission grids and transportation networks, can be performed for entire states, countries and regions. Up to 40,000 square kilometers can be covered with wide-swath (136 km) imagery captured at a half-meter spatial resolution on a single pass.
Intraday and Early Morning Monitoring – The EarlyEye tasking product leverages multiple HEAD Aerospace constellations to deliver early-morning frequent images, an hour earlier than usual commercial offer at 10:30 a.m. Designed for frequent monitoring of critical assets and rapidly changing situations related to energy security, defense/intelligence and infrastructure management, a high-resolution revisit schedule of four times per day is possible, with 15-minute revisit between 09:00 and 13:30 anywhere on Earth to be possible by the end of 2021.
High Vertical Accuracy Mapping – Multiple satellites perform stereo imaging at high resolution for high-quality land use and cadastral mapping. One constellation captures single-pass tri-stereo imagery validated with onboard laser altimetry data, generating digital elevation models (DEMs), digital terrain models (DTMs), and other large-scale 3D mapping products with vertical accuracy of 5 meters. Additionally, the SuperView constellation captures daily stereo imagery with vertical accuracy of better than 2 m.
Hyperspectral Imaging – Imaging in 25 spectral bands spanning the visible, near-infrared, and mid-infrared portions of the spectrum is designed for regional natural resource management: detecting crop stress and planning pesticide/fertilizer applications, species mapping of forests and vegetative land cover, and protecting environmentally sensitive areas. These data sets can also be used in agriculture monitoring, mineral exploration and water-quality monitoring.
Nighttime Imaging – Monitoring and surveillance activities by government entities, energy utilities and security organizations can be carried out around the clock with true-color, high-resolution at 1 m optical and video imaging during daylight and dark of night. Nighttime collection is suitable for surveillance such as illegal camping, border surveillance, change detection (especially in rapidly evolving events), powerline incidents and designing streetlight placement in urban settings. Day and night video can detect vehicle and ship movement.
UP42 users have a growing selection of satellite imagery to choose from on the geospatial marketplace. UP42 technical experts are available to assist customers in selecting the best data set to meet the needs of specific end-use applications in all industries and sectors. These experts can also help in tasking a satellite for new image acquisition or querying the archive to obtain existing imagery.
Firefighters in Slovenia. (Photo: tomazl/E+/Getty Images)
Public Safety Communication Europe (PSCE) and the European Space Agency (ESA) have signed a Memorandum of Intent (MoI) to support the use of satellite applications for public safety.
ESA and PSCE will work together under the new MoI towards establishing interoperable public safety communications systems.
The MoI will support the emergence of space-based applications in the public-safety domain such as public safety services relying on secure mobile broadband communication solutions. These include applications within disaster preparedness, response and resilience, situational awareness, assessments of damages, navigation-based services for tracking and coordinating rescue forces on-site and for emergency vehicles.
“ESA Space Solutions and the 4S Strategic Programme Line will support through this agreement the emergence of solutions making use of secure satellite communications for institutional public safety user communities,” said Rita Rinaldo, ESA. “This can be achieved as of today through existing satellite telecommunications infrastructures. In the future it will be possible to make use of new and innovative infrastructures with enhanced capabilities. Early pilots and demonstrations will showcase the unique benefits granted by satellites to the user communities and early adopters.”
“The cooperation with ESA will help to explore complementary solutions that will contribute to cover capability gaps and needs for public safety. It is of extreme importance to improve public safety communication systems with cutting-edge and rapidly deployable solutions that will facilitate PPDR missions,” explained Marie-Christine Bonnamour, PSCE.
The first step for ESA and PSCE cooperation will be PSCE participation in ongoing user studies on “Satellite Applications for Public Safety.” PSCE will help identify the needs of public safety stakeholders such as emergency services, fire brigades and law enforcement.
The physical and digital world are integrating. We are nearing the edge of the analog universe. Physical immersion is giving way to virtual immersion. It is the virtualization of products and services in the evolution of technology. Michael Saylor calls it the sixth wave of software engineering. We are moving away from externally experiencing data and are moving towards actively interfacing with data directly in virtual space.
“You can Zoom anywhere at the speed of light and bend time and space.” — Michael Saylor
The world of tomorrow is already here. We are waking up to it. The blips of information at the fringes are coming nearer. The horizons of time are as far as one can see into the future and the past. How far can you see? From wherever you are there are others who can see a little further. Look forward. Look back. Others are ahead and behind. They exist where time is most comfortable for them. Some take up positions living in the past. Some stake their place as far into the future as they are able. Look towards those early adopters. Ask them what they think. They see more clearly the blips of information out on the horizon.
What are those blips? How will they impact the geospatial community? How can you position yourself to take advantage of the coming trends?
America needs to go back to work and America’s infrastructure is old and in disrepair. In 2019, Congress introduced H.R.4687, the SMART Infrastructure Act, a $2 trillion bill but it never made it out of the House. However, that bill is being reintroduced. This time it will become a bill putting America back to work and its price tag will likely eclipse the previous bill. It will address infrastructure — all types of infrastructure: physical, data, cybersecurity, health, financial, transportation, energy, and communications. It will be a primary theme for the next two decades. Get ready! Change can happen fast and it’s about to accelerate.
“The future happens slowly and then all at once.” — Kevin Kelly
Rebuilding this infrastructure will require geospatial technologies. STEM has been the siren call for the past 30 years and for good reason. Those who heeded the call and invested their education into coding, engineering, data science, geospatial technologies, mathematics, artificial intelligence, and other STEM related fields are going to lead the coming workforce. Now is the time to get certified and establish your credentials.
Take the case of architectural design and construction. It used to be blueprints drawn on light tables. That is how I learned to do it back in the 1970s. Then it all moved to computer aided design (CAD) drawings. Now, urban planners and architects create immersive 3D virtual reality (VR) visualizations. That is becoming standard practice.
Project managers used to spend their day making their rounds walking the site ensuring the project was being built to specifications. However, that is changing. Soon, each worker’s safety glasses will have built-in augmented reality (AR). They will build their portion of a project exactly to plan. Project managers will connect with workers in the field and see the project they are working on progress in real-time while in their office on 3D models.
When the project manager does walk the site he or she will be wearing augmented reality (AR) head-up displays and able to compare the physical construction to the digital model in real-time. Backhoe and excavator operators will grade to exact precision. Robots will be common at construction sites assisting operations and enhancing current capabilities. Unmanned aerial vehicles (UAV) will fly regular patterns over construction sites. Heavy-lift UAVs will supplement cranes for some operations. Subsurface structures, whether buried beneath the ground or behind a wall will be digitized with precise location data making future replacements and repairs swift and easy. The uses of geospatially dependent technologies will continue to grow. The construction worker of tomorrow will be very different than the one of today.
Photo: Trimble
The new infrastructure will be built with smart technologies and incorporate renewables and “green energy” initiatives with a responsible approach to sustainability; for example, roadways will have embedded peizo-electric crystals in the asphalt to generate electricity from passing vehicles. The electricity will charge batteries that will power smart sensors embedded in the street and provide power to street lights with sensors and 5G networks along the roadways. Excess power will transfer to other microgrids for use elsewhere. Energy will also come from capturing wind on top and along the sides of buildings, along roadways, and at tunnel exits and entrances. Thermocouples will capture heat and generate electricity.
Solar power will be generated from panels, windows, films, and even paint surfaces. All of these sources together will feed into microgrids. Some of this renewable energy will convert water to hydrogen for fuel cells, and some will power carbon dioxide (CO2) converters to extract CO2 from the atmosphere and create synthetic fuels. In 2010, Sunexus submitted a geospatial study of the solar reforming process to the Office of Scientific & Technical Information (OSTI). The study showed that nearly 58% of industrial CO2 waste from power plants, cement plants, ethanol production, and natural gas processing could be converted to synthetic diesel fuel.
Image: U.S. Office of Energy Efficiency and Renewable Energy
Besides energy, other smart materials will be used such as small sensors that are geospatially sensitive nanodevices embedded in roads, bridges, tunnels, buildings and other structures. They are wirelessly connected to one another creating a 3D mesh network. These nanodevices continuously report their structural health. This 3D mesh network can detect vibrations passing through it that cause distortions in the mesh framework.
Geospatial artificial intelligence (GeoAI) will profile devices based on their normal statistical ranges. If any data such as location, temperature, humidity, pressure, acoustics or health status exceed the device’s standard deviation the GeoAI will analyze surrounding nodes in the mesh network to depict patterns. Suspect events will immediately come to the attention of emergency services. These microdevices can provide early detection of cracks in a structure or deterioration of a surface protection layer.
The use of these devices extends beyond structural monitoring. More broadly, they have societal applications too, such as for security purposes. When fitted with acoustic sensors they can detect sounds, and by geospatially analyzing the data from many thousands of devices the epic center of a noise event can immediately be located. Take for example a gun shot, fireworks, an explosion, or a vehicle accident. The increased acoustic signal would trigger the GeoAI monitoring the devices to plot a spatial analysis of the acoustic report. The map would alert area would flash red on the monitor at the control center and nearby cameras would zoom in on the location providing images and live video feeds all within moments of the triggering event. The analysts at the control center could immediately assess the situation and dispatch the proper response units.
Embedded devices also serve as seismic sensors blanketing broad areas and are able to record surface vibrations moving through the mesh network. An earthquake would appear as a moving wave field along the network.
Additionally, data from the mesh network can integrate with other devices. It can provide smartphones with precise location data. Imagine no longer standing on a street corner turning in circles trying to figure out which way to go. When connected with the mesh network and looking through AR glasses or the smartphone view screen the path will be illuminated. Autonomous vehicles will connect with the mesh network and have absolute positional accuracy and have awareness of other vehicles, bikes, and pedestrians ensuring a more safe and efficient experience for everyone.
The mesh network can be used as a base layer for georeferencing the world. Notifications, warnings and requests for information can be sent to smartphones within an exact georeferenced location. Imagine being in your third-floor apartment sitting in your chair, listening to music on your headphones and reading an ebook. You are oblivious to the noise outside. An audible alert is sent to your phone and calls your attention. You look at your phone and a message is requesting information related to a possible gunshot at DD°MM’SS.sss N, DD°MM’SS.sss W. You click on the notification and a map opens up. You see it is right outside your window. You go to the window, look outside and see two people duck into a car. You watch as red tail lights drive away. You look back at the location on the street where the vehicle had been and a person is slumped over leaning against a stairwell.
On your phone you press the red alert button on the map application triggering a distress signal and confirming the incident may have been a gunshot and someone has possibly been injured. Emergency services immediately dispatch. Others nearby received the same alert message because it was automatically generated and sent out to all phone numbers within the area defined by the geospatial acoustic solution. Surveillance cameras on the corner of buildings were also triggered by the alert and automatically focused on the origin of the noise. Images of the assailants were captured along with the license plate of the vehicle. As the vehicle drove away a network of surveillance cameras continued following it turn by turn until it was finally intercepted and the occupants apprehended.
This world is nearer than it seems. The technologies are already here. Once the infrastructure bill is passed construction projects will begin and our physical world will begin to integrate with the digital world. The engineers design it. The construction workers and robots will build it. And it will be geospatial technologies holding it all together.
William Tewelow works for the Federal Aviation Administration. He is a graduate of the FAA management fellowship program. He served on special assignment to the U.S. Department of Transportation leading a national strategic geospatial initiative for the White House Open Data Partnership. He is a Geographic Information Systems Professional (GISP) and a speaker for the Maryland STEMnet Scholar program. He was among the first in the nation to earn a Geospatial Specialist Certification from the U.S. Department of Labor while working at NASA Stennis Space Center. He has degrees in Geographic Information Technology, Intelligence Studies, and is completing a masters degree in Organizational Management. William is a 23 year veteran for the U.S. Navy serving as a Geospatial Specialist, Imagery Intelligence Specialist, a Naval Aviator, a Meteorologist, and a Tactical Oceanographer. He is married, enjoys writing and traveling. His favorite quote is, “A man’s mind changed by a new idea can never go back to its original dimension.” — Oliver Wendell Holmes
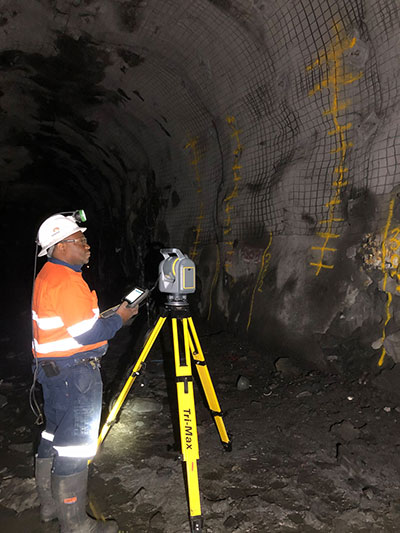
Trimble has introduced its SX12 Scanning Total Station, the next iteration of its 3D scanning total station that provides fast and efficient data capture for surveying, engineering and geospatial professionals.
New features include a high-power laser pointer and high-resolution camera system, expand capabilities in surveying, and complex 3D modeling. The SX12 enables enable new workflows in tunneling and underground mining, Trimble said.
The Trimble SX12 merges high-speed 3D laser scanning, Trimble VISION imaging technology and high-accuracy total station measurements into familiar field and office workflows for surveyors.
A new green, focusable Class 1M laser pointer — safe for viewing with the naked eye — offers high-power visibility and makes it easy to see at a distance. An improved camera system provides enhanced pointing and site documentation capabilities.
“The new SX12 adds more features and applications to an already widely adopted, field-proven scanning total station,” said Gregory Lepere, marketing director of Optical and Imaging for Trimble Geospatial. “The addition of a premium laser pointer completes the picture for surveyors wanting an instrument that can operate as an everyday high-end total station with the added value of scanning and imagery.”
Tunnels and underground mining
The Trimble SX12 allows users to quickly and easily operate with common survey workflows, including new versions of Trimble’s field and office software.
With Trimble Access 2021 Field Software, users can harness the full potential of the Trimble SX12, whether performing accurate measurements or comparing 3D scanning as-built data in the field. The combination is designed for infrastructure projects such as utilities, roads, rail, water, transportation and telecom.
The laser pointer enables new applications for laser-guided drilling and excavation guidance, rock bolt and blast hole set out, and as-built verification for underground tunnel and mine construction.
By integrating rich data from the Trimble SX12 into intuitive office workflows, Trimble Business Center version 5.40 enables users to quickly create complete customer deliverables. With its enhanced point-cloud management, eCogAI automated information extraction, and interoperability to leading CAD and GIS packages, the solution empowers users to exceed even the toughest client demands.
The combination also enables the capture of tunnel point clouds for as-built comparison, automated tunnel extraction routines and detailed 3D mesh inspection resulting in intuitive reporting deliverables for construction verification.
“Tunneling projects are highly dependent on accurate positioning to precisely control equipment and track progress in difficult underground construction environments,” said Boris Skopljak, marketing director of Monitoring and Tunneling for Trimble Geospatial. “The combination of the SX12 and new software workflows, simplifies the capture of site conditions, enabling tunneling and mining surveyors to make accurate and informed decisions without the complexity and additional cost of multiple systems.”
The COVID-19 pandemic has brought uncertainties to all businesses, and the mapping industry has been no exception.
Slowdowns were observed during the first few months of 2020 as lockdowns were gradually enforced in Asia, then Europe, and finally the Americas.
As expected, projects were delayed during that initial period as companies were reorganizing their operations to allow for remote work.
Once that transition was overcome, a great number of projects resumed, and the geospatial field has been gradually coming back to normal since then. That can be explained by different factors, including, for example, several governments accelerating infrastructure projects to stimulate the economy.
A lot of mapping firms have turned the pandemic into an opportunity to improve their processes. Slower times allow reviewing production workflows and assessing bottlenecks. Once identified, new hardware and software solutions can be evaluated to optimize production.
Interestingly, the resulting investments into new solutions has been significant. Companies are seeing a quick payoff as their workload is rapidly accelerating, leading to an increase in their bottom line.
Overall, the mapping industry was able to rapidly adjust to the new reality caused by the pandemic. The changes that are being made in performing projects not only allow us to minimize risks in the short term, but also to increase profitability in the longer term.
SimActive is the developer of Correlator3D software, a patented end-to-end photogrammetry solution for the generation of high-quality geospatial data from satellite and aerial imagery, including drones. Correlator3D performs aerial triangulation (AT) and produces dense digital surface models (DSM), digital terrain models (DTM), point clouds, orthomosaics, 3D models and vectorized 3D features.
Powered by GPU technology and multi-core CPUs, Correlator3D ensures high processing speed to support rapid production of large datasets.
SimActive has been selling Correlator3D to leading mapping firms and government organizations around the world, offering cutting-edge photogrammetry software backed by exceptional customer support.
Bentley Systems‘ Year in Infrastructure 2020 conference will be hosted in a digital format.
The virtual Year in Infrastructure 2020 conference will provide complimentary access to a wide range of content relevant to infrastructure professionals in every role and at every phase of the infrastructure lifecycle, the company said.
Highlights of the 2020 conference will include the Year in Infrastructure 2020 awards finalists’ presentations, which will be held Oct. 5-16; the Year in Infrastructure 2020 Executive Perspectives, which will be held Oct. 20-21; a TwinTalks premier on Oct. 20; the Year in Infrastructure 2020 awards ceremony on Oct. 21; and Accelerate Sessions, which will take place Oct. 27 and beyond.
During the Executive Perspectives session, Bentley Systems CEO Greg Bentley will be joined joined by leading infrastructure executives for an interactive discussion on the resilience challenges they face and how to meet those challenges through digital advancement. In addition, Bentley Systems Founder and Chief Technology Officer Keith Bentley will discuss the company’s open strategy for digital twins.
The TwinTalks will feature leading industry figures as they discuss the implications of digital twins for digital cities, design and construction, digital plants, energy utilities, rail and transit, and roads and bridges.
The Accelerate sessions will feature Bentley product executives, including Dustin Parkman (project delivery), Robert Mankowski (digital cities), Ken Adamson (design integration), and Alan Kiraly (asset and network performance), as they and their leadership teams review the latest advancements in Bentley applications and cloud services.
Bentley Systems, headquartered in Exton, Pennsylvania, provides comprehensive software and digital twins services for advancing the design, construction and operations of infrastructure.