Tag: insurance

  • u-blox SARA-U260 Module Receives AT&T Approval

    u-blox SARA-U260 Module Receives AT&T Approval

    The u-blox SARA-U260 module.
    The u-blox SARA-U260 module. Photo: Swiss u-box

    Swiss u‑blox says that its SARA-U260 dual-band 3G/2G module has achieved AT&T network compatible status.

    The certification allows customers to design SARA-U260 modems into M2M devices operating over AT&T’s extensive 3G network in the USA. Typical applications include small tracking boxes, usage-based insurance devices, smart metering, wearable electronics, and connected fitness watches.

    SARA-U260 is a complete 3G/2G voice/data module for applications that still require roaming ability with 2G using AT&T’s extensive 3G network coverage. The SARA-U260 provides full voice and data capability as well as a full suite of IP protocol stacks. The module features have been selected to give customers specific features they need for telematics units, handheld devices, communications modules, point-of-sale terminals, vehicle “black boxes,” and utility meters.

    SARA-U260 provides efficient and cost-effective mobile connectivity in a miniature 16 x 26 mm2 LGA form factor. The module is pin-compatible with SARA-G3 GSM/GPRS modules, as well as layout-compatible with LISA-U2 (HSPA) and TOBY-L2LTE modules to support future-proof 4G LTE designs.

    All SARA modules share the same form-factor and footprint and are designed based on u-blox’ “nested design” philosophy. This allows engineers to develop one hardware/software platform to support GSM/GPRS, HSPA, or LTE, depending on their end customer requirements.

    SARA-U260 hosts multiple embedded IP protocols, such as TCP/IP, UDP/IP, HTTP, and FTP. In-band modem support for automotive emergency calls like eCall and ERA/GLONASS are also integrated. With extremely low-power consumption, the SARA-U260 is designed for battery-powered and handheld devices.

    With direct A-GPS support for accelerated positioning and u-blox’ CellLocate hybrid positioning technology, SARA-U260 is designed to match u-blox advanced GNSS positioning capabilities, including indoor positioning.

    “u-blox is proud that AT&T certified our SARA-U260 module for its network,” said Nikolaos Papadopoulos, president of u-blox America. “Our robust voice and data modules deliver powerful 3G connectivity with 2G fallback in the smallest package on the market, at a price that customers recently paid for a 2G module.”

    For Europe and Asia, u-blox also offers the pin- and software compatible certified version SARA-U270.

    RIL software for Android and Embedded Windows is available free of charge from u-blox.

  • CoreLogic Identifies 6.5M U.S. Homes at Risk of Hurricane Storm Damage

    CoreLogic — a global property information, analytics and data-enabled services provider — has released its 2014 storm surge analysis featuring estimates on both the number and reconstruction value of single-family homes exposed to hurricane-driven storm surge risk within the United States.

    According to the findings, more than 6.5 million homes along the U.S. Atlantic and Gulf coasts are at risk of storm surge inundation, representing nearly $1.5 trillion in total potential reconstruction costs. More than $986 billion of that risk is concentrated within 15 major metro areas. This exposure could constitute significant risk for homeowners and financial services companies, as many at-risk homes lack protection from insurance coverage. 

    The analysis examined homes along the coastlines of 19 states and the District of Columbia in the Gulf and Atlantic regions, extending as far west as Texas and as far north as Maine. Florida ranks number one for the highest number of homes at risk of storm surge damage, with nearly 2.5 million homes at various risk levels and $490 billion in total potential exposure to damage.  At the local level, the New York metropolitan area, which encompasses northern New Jersey and Long Island as well, contains not only the highest number of homes at risk for potential storm surge damage (687,412), but also the highest total reconstruction value of homes exposed, at more than $251 billion.

    To enhance accuracy, the 2014 CoreLogic storm surge analysis has been expanded from prior years’ reports to encompass additional categories of single-family residential structures including mobile homes, duplexes, manufactured homes and cabins, among other non-traditional home types. The addition of these categories, along with new construction, contributed to a higher number of total homes identified within potential surge areas. The values represent estimates of reconstruction costs, taking into account labor and materials, and are based on 100-percent or total destruction of the residential structure. Depending on the amount of surge water from a given storm, there may be less than 100 percent damage to the residence, which would result in a lower realized reconstruction cost.

    While scientific predictions are pointing to lower-than-normal storm activity for 2014, the risk of significant damage to homes is a constant threat. “Though the 2013 hurricane season will be remembered for the fact that no storms made landfall along the U.S. coast, this reprieve from hurricane-related damage should not lead to complacency in preparing for future storms and the potential life-threatening conditions they can bring,” said Dr. Thomas Jeffery, senior hazard scientist for CoreLogic Spatial Solutions. “This year’s season is projected to be slightly below normal in hurricane activity, but the early arrival of Hurricane Arthur on July 3 is an important reminder that even a low-category hurricane or strong tropical storm can create powerful riptides, modest flooding and cause significant destruction of property.”

    The 2014 analysis shows that total exposure varies significantly from state to state given differences in population, trends in residential development, geographic risk factors, length of coastline and other distinguishing factors. Florida and Texas, for example, are within the top five states for number of properties at risk primarily because of their extensive coastlines. Louisiana and New Jersey, on the other hand, have a smaller coastal area overall, yet are included in the top five list as a result of relatively low elevation that allows storm surge inundation to extend farther inland and affect more homes. 

    The concepts in this analysis also complement Federal Emergency Management Agency (FEMA) flood zone information to provide a snapshot of potential damage exposure at the property level, as many properties located outside designated FEMA flood zones are still at risk for storm surge damage. The standard FEMA flood zones are designed to identify areas at risk for both freshwater flooding as well as storm surge based on the likelihood of either a 100-year or a 500-year flood event. They do not differentiate risk based on storm severity, and as a result, do not effectively define the total extent of the risk possible along coastal areas.

    To illustrate varying degrees of flood risk exposure, Table 6 compares homes that are not located within FEMA 100-year floodplains against the number of homes located in surge inundation zones, as well as those located in both surge and FEMA Special Flood Hazard Areas (SFHA). Homeowners who live outside the FEMA flood zones typically do not carry flood insurance, given that there is no mandate to do so, and therefore may not be aware of the potential risk storm surge poses to their properties.

    Among select major metro areas, Virginia Beach-Norfolk-Newport News, VA-NC, has the highest percentage of homes (86 percent) at risk of storm surge, but not designated in a FEMA flood zone. Philadelphia-Camden-Wilmington, PA-NJ-DE-MD and Jacksonville, Florida, also top the list at 85 percent and 76 percent, respectively. Even in New York-Newark-Jersey City, NY-NJ-PA, 68 percent of homeowners at risk of flood or surge inundation would not be required to carry flood insurance because they are not located within a designated FEMA 100-year floodplain.

    Additional findings in the CoreLogic storm surge analysis include:

    • The five states with the highest total number of properties at risk include: Florida (2,488,277), Louisiana (738,165), New York (466,919), New Jersey (445,928) and Texas (434,421).
    • The five states (including the District of Columbia) with the lowest total number of properties at risk include: the District of Columbia (3,895), New Hampshire (10,853), Maine (23,439), Rhode Island (26,558) and Delaware (48,534).
    • The five states with the highest value of reconstruction costs for homes at risk include: Florida ($490,403,653,377), New York ($182,474,294,695), Louisiana ($161,062,467,382) New Jersey ($134,194,963,314) and Virginia ($92,001,482,217).
    • The five states with the lowest value of reconstruction costs for homes at risk include: District of Columbia ($394,437,173), New Hampshire ($2,649,086,294), Maine ($6,629,856,369), Rhode Island ($7,389,384,876) and Alabama ($10,333,310,460).     
    • The reconstruction value of the homes exposed to storm surge damage in the Gulf is much less than the reconstruction value of homes in the Atlantic region, as indicated in Table 2. The total reconstruction cost value of homes along the Atlantic coast is nearly $951 billion, which is approximately double the value of at-risk properties in the Gulf region at just over $545 billion. 

    CoreLogic releases storm surge data to enhance understanding of the risk that hurricane-driven storm surge poses to homes, institutions and economies that are prone to tropical storms. Fully understanding the number of homes and financial impact of sustaining storm surge damage is critically important for financial institutions, corporate entities and local governments to make better informed risk management decisions. Storm surge data is highly useful for insurance providers and financial services companies, as it enhances the understanding of potential exposure to water damage for homes, including those that do not fall within the designated FEMA flood zones. Recent regulatory guidelines are compelling financial services companies subject to federal stress testing to understand under-insured or uninsured risks like storm surge flooding, since exposed properties have a significant risk for default following an event. More granular insight into storm surge impact is necessary for preparation and mitigation efforts that can help reduce the amount of damage and loss, and also improve safety and disaster response. 

  • CoreLogic Expands Insurance Offerings with Hail, Wind and Lightning Weather Forensics

    CoreLogic, a global property information, analytics and data-enabled services provider, has expanded its natural-hazard risk-management capabilities through the addition of Weather Fusion hail, wind and lightning weather forensics to provide near real-time property-specific weather event verification.

    The combination of proprietary CoreLogic data and analytics with Weather Fusion weather peril verification will enable the insurance and other industries to more reliably identify loss shortly after a weather event occurs through single-source access to multiple weather data sets and solutions.

    CoreLogic offers more than 30 weather peril verification and natural hazard risk reports nationwide, helping risk managers across all industries proactively manage risk and loss associated with extreme weather, natural hazard and catastrophe events. According to the Insurance Information Institute, insured losses due to hail and thunderstorms alone totaled $25 billion in 2011 and $14 billion in 2012. The new CoreLogic hail, wind and lightning reports will enable insurers, underwriters, property managers and owners to confidently verify the cause and date of damage and losses near real time, saving critical time and money. A product performance assessment completed by the top five Insurance Carrier’s Claims Department concluded that the Weather Fusion hail algorithm is four times more effective at identifying address-level hail fall than current hail detection algorithm-based hail data.

    CoreLogic analysis indicates that hail and wind claims are among the most significant categories of property damage expense. Insurance Information Institute data shows from 2007 to 2011, the average claim totaled $7,177, with $30 out of every $100 collected in a homeowner’s insurance premium typically going toward wind and hail claim payments. Credibly verifying damages caused by wind, hail and lightning at the property level has traditionally been a challenge for insurers. The addition of Weather Fusion science and weather forensic reports helps CoreLogic solve this challenge by delivering:

    • Historical address-level weather event insight for underwriter examination that ultimately results in smarter, more informed policy decisions.
    • The ability to accurately distinguish what areas were actually impacted and what size hail fell during a weather event.
    • Hail reports shortly after a severe weather event occurs, with maps updated as frequently as every hour.
    • Timely notifications of hail activity for custom addresses, as well as the previous day’s hail activity.
    • The ability to reduce fraudulent claims attributed to severe weather and accelerate the claims verification process by provisioning information directly after a weather event.
    • A Hail Risk Score, which compares address-specific historical hail events against historical claim experience for all relevant hail locations in the U.S., refreshed daily.
    • Digital plots of hail paths for impacted geographic areas and color-coded by quarter-inch increments illustrating hail from three-quarters of an inch to four inches in diameter.
    • Historical hailstorm data at a custom address-specific location, including hail claim verification with the dates and sizes of hail for each hailstorm, within one, three and ten miles of the address.
    • Address-specific lightning strike analysis, along with date and time (to the nearest millisecond), including count of individual lightning strokes, custom maps, latitude/longitude, polarity (negative or positive) and amplitude of a stroke.
    • Wind Risk Scores, designed to verify maximum wind gust and direction at an individual address level.

    “Traditionally, wind event verification has been considered an unsolvable problem and was based on public safety algorithms or relied on hand-drawn maps and single-point data observations collected from the nearest airport locations,” said Jay Kingsley, senior vice president for CoreLogic Insurance and Spatial Solutions. “Now, the unique weather science and data techniques behind our wind, hail and lightning solutions will provide insurance carriers with a more scientific approach to understanding individual property damage from storms,” continued Kingsley.  “Though billions of dollars are paid out every year for exterior damage to homes, up until now there has been no real way to credibly verify these losses. CoreLogic now provides a more powerful, data-driven approach to this problem through weather peril verification reports.”

  • PayGo’s Auto Insurance Solution to Be Based on Telit GSM/GPRS Tech

    Telit Wireless Solutions and PayGo Systems, an Israel-based telematics service provider (TSP) have announced that PayGo’s new TTM Type B family of PAYD solutions will include Telit’s ultra-compact GSM/GPRS cellular module, the GE865-QUAD. The solutions include self-contained consumer installable data collection devices for high-growth application area — UBI/PAYD — in the automotive insurance industry. PayGo and Telit plan to expand connected automotive data collectors into new and existing markets made possible by PayGo’s self-powered product concept.

    The TTM Type B is a self-powered peel-and-place product family with a multi-year internal battery power source. Smart energy consumption algorithms in conjunction with Telit’s energy efficient GE865-QUAD module, which is fully certified by mobile network operators worldwide, allow PayGo to deploy the TTM Type B family in any regional market its customers offer auto insurance, Telit said.

    The TTM Type B family incorporates a feature set designed to address specific insurance industry application requirements beyond basic UBI including distance traveled, minutes of use, trip start and end time and geo-zones where vehicle was driven in a continuous data collection stream. It is also able to notify appropriate service centers in real time about crashes and crash location, and to provide trip summaries (time, distance, etc.) via text message for each trip as well as curfew violations (time and geo-zone). The PayGo device is packaged in a cellphone-size enclosure requiring no external wires and  is ready to be affixed, out of the box, to the inside of the car’s windshield like a traditional toll-pass module. The unit is self-powered and completely independent of any vehicle system, including power. To meet requirements from the insurance industry, the TTM Type B senses and reports installation of the device as well as tampering or post-installation removal. The products are fully FCC and CE certified.

    The GE865-QUAD isfor embedded cellular applications where small size and energy efficiency are crucial. Measuring 22 x 22 x 3 miilimeters, the GE865-QUAD is significantly smaller than most cellular modules in the industry. It features an optimized power consumption profile with very low standby current compared to the majority of current competing products. Because of its extremely compact form factor and a rich set of features, including an on-board Python interpreter, it is well positioned for vertical application areas such as telemetry, mobile asset tracking telematics and telemedicine.

  • CoreLogic Maps 63,000 Completed Foreclosures in May

    CoreLogic released its National Foreclosure Report for May, which provides monthly data on completed foreclosures and the overall foreclosure inventory. According to the report, there were 63,000 completed foreclosures in the U.S. in May 2012 compared to 77,000 in May 2011 and 62,000* in April 2012.

    According to the announcement, since the financial crisis began in September 2008, there have been approximately 3.6 million completed foreclosures across the country. Completed foreclosures are an indication of the total number of homes actually lost to foreclosure.

    Approximately 1.4 million homes, or 3.4 percent of all homes with a mortgage, were in the national foreclosure inventory as of May 2012 compared to 1.5 million, or 3.5 percent, in May 2011 and 1.4 million, or 3.4 percent, in April 2012. The foreclosure inventory is the share of all mortgaged homes in some stage of the foreclosure process.

    “There were more than 819,000 completed foreclosures over the past year, or an average of 2,440 completed foreclosures every day over the last 12 months,” said Mark Fleming, chief economist for CoreLogic. “Although the level of completed foreclosures remains high, it is down 27 percent from a peak of 1.1 million in all of 2010.”

    “Though the national foreclosure inventory levels remain steady, around 1.4 million homes, there have been dramatic shifts at the state level,” said Anand Nallathambi, president and CEO of CoreLogic. “Nevada, Arizona and Michigan, for example, each experienced at least a 20-percent decline in the foreclosure inventory from a year ago. While foreclosure inventories in most states are declining, the foreclosure inventory is still rising in many judicial states, such as Hawaii, New York and Connecticut.”

    Highlights as of May 2012

    The five states with the highest number of completed foreclosures for the 12 months ending in May 2012 were: California (133,000), Florida (92,000), Michigan (60,000), Texas (58,000) and Georgia (57,000). These five states account for 48.8 percent of all completed foreclosures nationally.

    The five states with the lowest number of completed foreclosures for the 12 months ending in May 2012 were: South Dakota (48), District of Columbia (74), North Dakota (547), West Virginia (620) and Hawaii (623).

    The five states with the highest foreclosure inventory as a percentage of all mortgaged homes were: Florida (11.9 percent), New Jersey (6.6 percent), Illinois (5.3 percent), New York (5.0 percent) and Nevada (4.9 percent).

    The five states with the lowest foreclosure inventory were: Wyoming (0.7 percent), Alaska (0.8 percent), North Dakota (0.8 percent), Nebraska (1.0 percent) and South Dakota (1.3 percent).

    *April data was revised. Revisions are standard, and to ensure accuracy CoreLogic incorporates newly released data to provide updated results.

    To download a copy of the National Foreclosure Report, please visit www.corelogic.com/ForeclosureReport-May2012.

    Methodology

    The data in this report represents foreclosure activity reported through May 2012.

    This report separates state data into judicial vs. non-judicial foreclosure state categories. In judicial foreclosure states, lenders must provide evidence to the courts of delinquency in order to move a borrower into foreclosure, while in non-judicial foreclosure states lenders can issue notices of default directly to the borrower without court intervention. This is an important distinction since judicial states as a rule have longer foreclosure timelines thus affecting foreclosure statistics.

    A completed foreclosure occurs when a property is auctioned and results in the purchase of the home at auction by either a third party, such as an investor, or by the lender.  If the home is purchased by the lender, it is moved into the lender’s Real Estate Owned (REO) inventory.  In “foreclosure by advertisement” states, a redemption period begins after the auction and runs for a statutory period, e.g., six months.  During that period the borrower may regain the foreclosed home by paying all amounts due as calculated under the statute.  For purposes of this Foreclosure Report, because so few homes are actually redeemed following an auction, it is assumed that the foreclosure process ends in “foreclosure by advertisement” states at the completion of the auction. 

    The foreclosure inventory represents the number and share of mortgaged homes that have been placed into the process of foreclosure by the mortgage servicer.  Mortgage servicers start the foreclosure process when the mortgage reaches a specific level of serious delinquency as dictated by the investor for the mortgage loan.  Serious delinquency is typically defined as 90, 120, or 150 days delinquent (sometimes more), in foreclosure or in REO. Once a foreclosure is “started,” and absent the borrower paying all amounts necessary to halt the foreclosure, the home remains in foreclosure until the completed foreclosure results in the sale to a third party at auction or the home enters the lender’s REO inventory. The data in this report accounts for only first liens against a property and does not include secondary liens. The foreclosure inventory is measured only against homes that have an outstanding mortgage. Homes with no mortgage liens can never be in foreclosure and are therefore excluded from the analysis. Approximately one-third of homes nationally are owned outright and do not have a mortgage. CoreLogic has approximately 85 percent coverage of U.S. foreclosure data.

    1The number of mortgages per completed foreclosure nationally is calculated by dividing the number of homes with a mortgage by the number of completed foreclosures in the month. By State and CBSA, it’s calculated by dividing the number of homes with a mortgage in each area by the sum of completed foreclosures for the prior 12 months. The slight difference in the calculation between national and state and CBSA helps to account for data volatility.

  • Telematic Future: eCall, Insurance, Drive-Share

    By Moni Malek

    Consider two notable developments in 2011 that will influence the development of consumer transportation:

    • China became the largest manufacturer of automobiles, producing more than 18 million vehicles, easily overtaking Europe and North America.
    • Smartphone volume shipments surpassed the volume of laptops and desktop PCs combined.

    Reflecting these two rising economic rockets, the November Munich Telematics show drew its largest attendance yet, 500-plus participants, and a greatly expanded exhibit area.

    The rising dominance of smartphones — one participant observed that they are taking over the world —will have a big impact on how users expect to access or view their telematics data; that is, any wireless information accessed by them while in their car. Developers and manufactures used to have a problem regarding which system to support, but with Android now at more than 50 percent of smartphones share, it is becoming the de facto first-choice standard and will probably become the user interface model.

    eCall. Also in 2011, the European Union finally mandated eCall, the emergency call system in automobiles that sends vehicle position to emergency services after a crash. Unfortunately, the mandate is for 2015. I guess this gives them a chance to use the European satnav system Galileo, which hopefully may have something to offer hopefully by then.

    This year the Russians leapfrogged the Western Europeans and mandated their own version of eCall, known as ERA, for 2013. It will use GLONASS, the Russian satnav system, which unlike Galileo is operational now. Of course, GPS is still employed, and the real benefit today is using GLONASS plus GPS in a multi-constellation fix mode for higher reliability especially in urban areas compared to GPS alone.

    Malek-1A . Credit: Moni Malek
    Malek-2B . Credit: Moni Malek

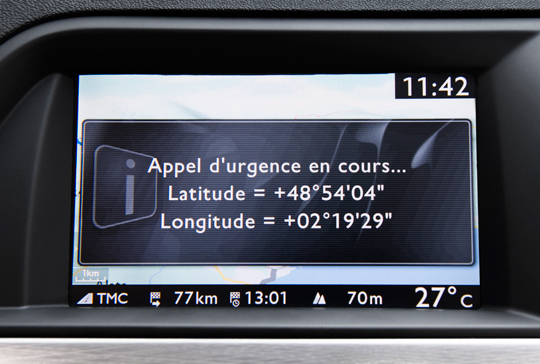
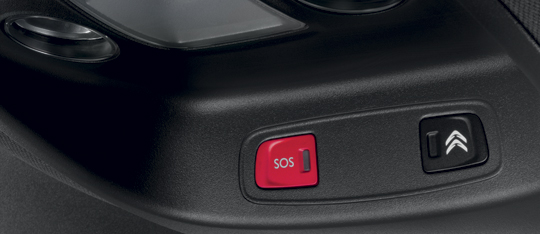
    Emergency call in progress, triggered by SOS button in PSA Peugeot Citroen’s roof panel (bottom photo).

    At the Munich Telematics show it was clear that the Russian mandate has put wind into the telematics emergency call market’s sails. From the Russian company Cesar’s presentation, we learned that following road accidents in Russia, 14 percent of car occupants die, compared to 2 percent in the United States. Getting emergency support to the scene more quickly is critical to reducing fatalities, and on this basis Russia has got some catching up to do.

    You would think that everyone would be rushing to get more safety, and as one market research presenter said, it comes high on the user wish list. Another presenter stated that while people may desire it, they seem reluctant to pay for it at first. As an historical example, initially when people had the option of paying for airbags as an extra, it was practically never taken as an option. Now it is standard in all cars for drivers and passengers.Think about it — would you now buy a car without an airbag?

    PSA Peugeot Citroen, the big French car company, shows the way with a version of eCall in their cars that doesn’t lose money! There is a big debate about who gets called when a crash happens. Is it the public service access points (PSAPs) or third-party services (TPS). Peugeot favours the TPS model, which can filter the more common breakdown and false alarms from true crash calls to be forwarded to the emergency services at PSAPs. While eCall initially favoured PSAP, the trend seems to support Peugeot’s decision and TPS.

    The PSA eCall also does not support the so-called in-band modem, which allows crash-position data to be sent over a voice call on the eCall box by encoding the data into a speech-like signal. The modem theory is, you need to keep the voice call open to keep talking to the person in the automobile. According to PSA, apart from the issue of patents with the in-band modem, it seems that 30 percent of the data is lost, and 40 percent of the PSAPs in Germany cannot handle it.

    GPRS is the best way of sending crash-position data with SMS text message as a back-up. As for voice, most people get out of their car after an accident and do not speak on the eCall box. I guess if people are unconscious and are not able to get out of the car, they won’t speak either.

    While smartphones dominate in many areas, they have been ruled out for eCall safety apps in cars, as no one can guarantee a smartphone will work after an accident. As for crash detection, that can only work if a device is bolted down to the car frame. Only that way can you sense the high-G forces during a crash.

    Insurance. Until the mandates kick in for eCall/ERA, you can understand why an automobile manufacturer’s marketing imagery does not include one of their car crashing or breaking down. So selling the eCall feature in this mindset is hard. On the other side are guys that do have the image of helping you after a crash: the insurance companies. And true to form, the big business has become insurance telematics.

    Octo Telematics has taken a pole position in this area and had an impressive crashing-car demo that you could sit in at the show. The insurance telematics box then becomes an aftermarket product that is cross-subsidized by the insurance company. In return they receive crash data and get to monitor you to help you improve driving habits to reduce crashes.

    Malek-2 . Credit: Moni Malek
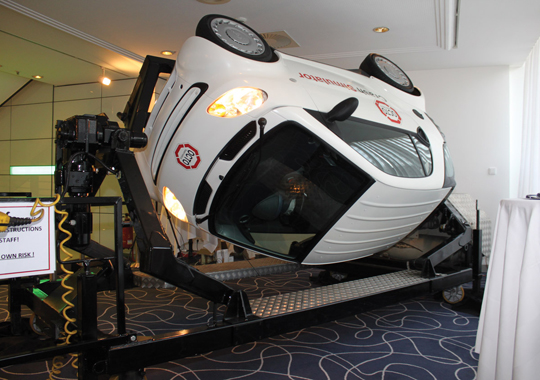
    Octo Telematics crash simulator. Show attendees were taken for a ride! The telematics box sends crash data to the insurance company to help drivers improve driving habits.

    A last word on safety: most accidents now seem to occur when people are texting while driving. Apparently when the Blackberry message service was down for three days in Dubai, there were 20 percent fewer accidents.

    Apart from eCall and insurance telematics, the other famous perennial telematic application is the connected car. As we all expected, we saw a lot of presentations on this. In simple terms, via telematics, a car is connected to the Internet. As the definition of telematics The branch of information technology that deals with long-distance transmission of computerized information, this might seem a no-brainer. But exactly how the car is connected and what value that offers constitute the two key questions for any application and market segment. Today a car buyer will almost certainly be an internet user.

    How Is It Connected? For basic telematic apps like eCall and stolen vehicle recovery, it suffices to connect to the 2G GSM/GPRS wireless network that gives worldwide coverage. Operators like Telenor offer a so called global subscriber identity module (SIM) model that supports worldwide access at a price that makes business real.

    For the so-called infotainment connectivity, the trend is 4G LTE, which offers the high data rates that the car companies dream about and flat-rate smartphone users expect. LTE is a packet mobile phone network already at Verizon and in European trial that is ideal for data. It appears that in the future, the best mobile phone network will be a combo of 4G LTE for infotainment data with 2G GSM for speech and 2G GPRS for global coverage telematic data.

    What Value Does It Offer? The blanket answer is, unless it offers a useful service, it won’t really be used. Today most connected car services drop to a poor 10–20 percent retention after the free trial period. The key is really to look for helpful services. For instance, the connected heater or rather the ability to switch your car heater remotely on in cold winters of Sweden increased Volvo connected usage 50 percent. Saving fuel in this energy conscious low CO2 emission days would seem a useful application. Couple that with a connected car, traffic information, best routes, good driving-habit rewards, social network to let you post your good driving score, and ….

    Fiat showed its eco:Drive solution, helping people save 6 percent on fuel consumption on average. That’s a start.

    At the end of the day, more efficient cars are the answer to that. Getting people to use more efficient small cars for short trips is one of the ideas behind the BMW car-sharing model. Based on the BMW One series and the Minis made by BMW, it offers a service in Munich and Berlin (I have to admit I live in Munich and haven’t tried it yet). When you register, you present your driving license and the service add an RFID. You can use this RFID as a keyless entry into a car share. Of course the cars are connected, and a smartphone app helps you find the next free car. You can pick it up and drop it off where you want. Because they are new, more efficient small cars than your average old gas guzzler, they have done a deal to get free parking in town. It costs a flat 29 cents (Euro cents) per minute to drive, which includes the fuel price. I can remember when a mobile phone call cost that much before!


    Moni Malek is CEO of ML-C MobileLocation-Company GmbH, based in Munich, Germany.