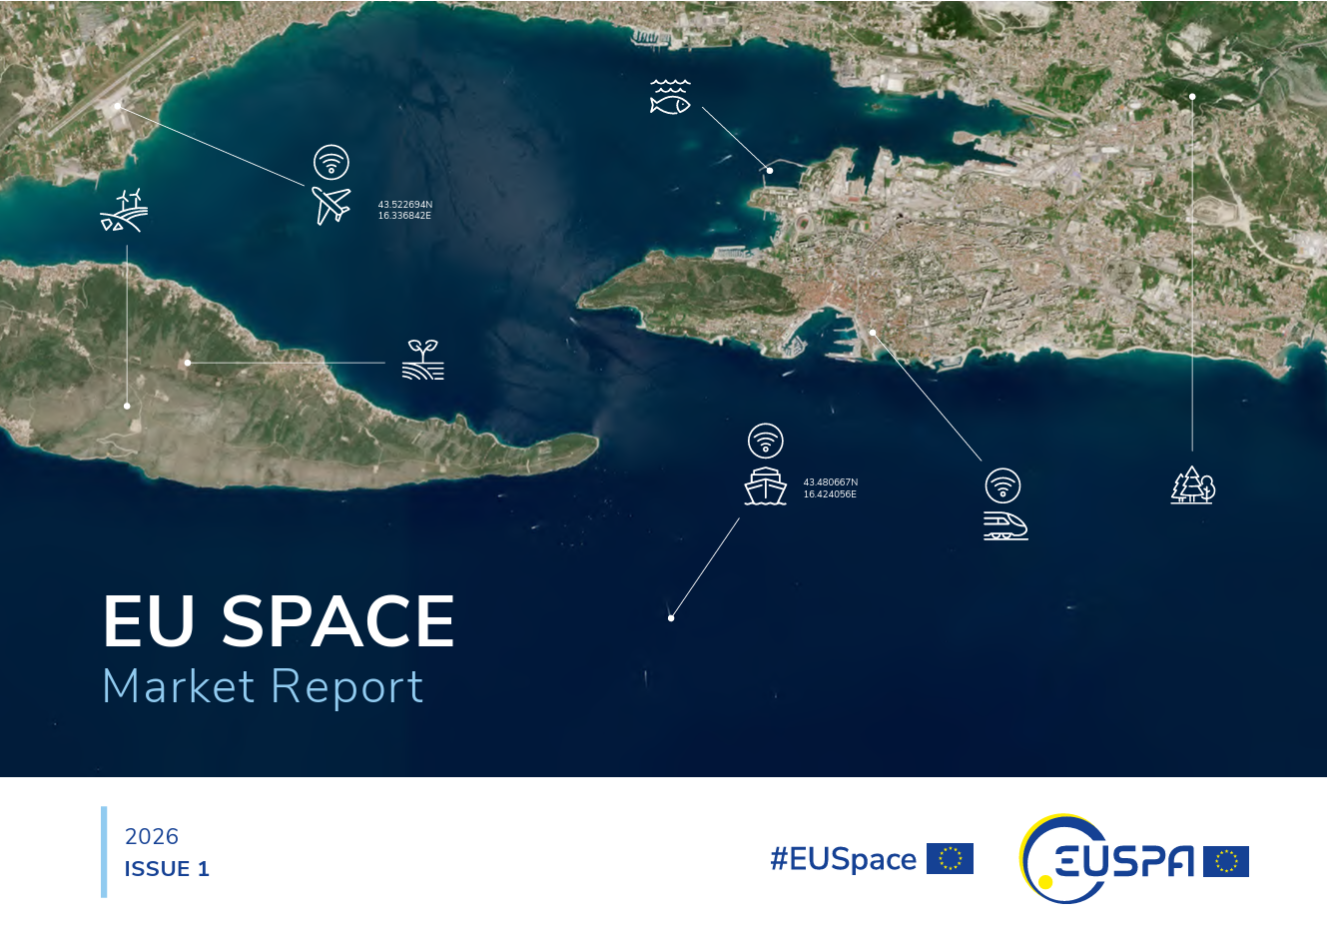
A new edition of the European Union’s Space Market Report is now available. According to the EU’s Agency for the Space Programme (EUSPA), it offers a comprehensive overview of the latest developments, emerging trends, and market dynamics shaping the global space downstream sector.
The report provides a comprehensive overview of the latest developments and trends in GNSS, as well as Earth observation (EO), secure satellite communications (Secure SATCOM), and space situational awareness (SSA) in one place for the first time. It also highlights the evolution of user technologies and the growing synergies between these domains.
“As Europe’s space capabilities become increasingly interconnected, it is essential to move beyond viewing them as standalone technologies,” explained Rodrigo da Costa, EUSPA executive director. The publication “reflects the growing synergies between these domains and their strategic importance for Europe’s economy, resilience and autonomy.
“By providing a comprehensive view of the evolving space ecosystem, EUSPA aims to foster innovation, strengthen collaboration across the sector, and support the development of a more competitive, agile and responsive European Union space economy,” da Costa said.
GNSS and EO
The report highlights sustained growth for both the GNSS and EO markets across all 16 analyzed market segments. The current €3.5 billion of EO market revenue in 2024 is expected to grow to €7.9 billion by 2034 with agriculture representing the largest share.
GNSS revenues are forecast to rise from €300 billion in 2024 to €580 billion by 2034. GNSS service revenues outpace device revenues and confirm the increasing role of digital ecosystems and value-added services in the space economy, the report said.
Revenues are mainly driven by consumer solutions, and road and automotive, with a global installed base of GNSS-enabled devices that will reach almost 10 billion by 2034.
Secure SATCOM
The Secure SATCOM market addresses the needs of surveillance, key infrastructure and crisis management. In this sector, data service revenues generated by EU users are forecast to grow significantly, increasing from more than €200 million in 2025 to nearly €1.2 billion by 2040.
While maritime surveillance drives demand in 2025, by 2040 the market is expected to be led by law enforcement interventions, civil protection and force deployment, fueled by growing security and resilience needs, demand for reliable connectivity, and stronger crisis-response capabilities.
Existing and future synergies
The report also examines how major macroeconomic trends —including climate change, geopolitical instability and rapid urbanization — are reshaping space markets and strengthening synergies between EO, GNSS and Secure SATCOM technologies. Together, these capabilities are becoming increasingly important for security, resilience, disaster response, environmental monitoring, and smarter urban and infrastructure management.
Research shows Internet of Things growing in use; free IoT maturity tool enables miners to measure readiness
Cover: Inmarsat
The latest research study conducted by Inmarsat, a global, mobile satellite communications company, found that the global mining sector is undergoing an internet of things (IoT) revolution with respondents reporting significant increases in adoption of connected technologies.
Inmarsat employed market research company Vanson Bourne to interview 200 respondents with either decision-making or influencing responsibilities for IoT-related initiatives at organizations of more than 500 personnel.
Mining organizations reported successes in implementing projects to safeguard workers via remote tracking, monitor drilling and observing acid mine-drainage remotely. However, despite this progress, a range of challenges are hindering the sector’s ability to reap the rewards IoT has to offer.
‘The Rise of IoT in Mining is the third IoT-focused research project undertaken by Inmarsat and focuses on the use of, attitude to and predictions for IoT across the global mining sector. As part of the initiative, Inmarsat is also offering mining companies the opportunity to measure their IoT readiness versus the 200 respondents to the survey, using their free online IoT maturity tool.
According to the research, most organizations (65%) have fully deployed at least one IoT project, while 33% are trialling or have trialled a project, with only 2% of respondents not having begun an IoT project.
These findings echo the predictions reported in Inmarsat’s 2018 mining research, where only 2% had fully deployed an IoT solution, 29% were trialling one and 69% were planning on beginning IoT projects within the next two years.
Noticeably, there is a considerable geographical variance in IoT adoption and maturity across different regions, with 98% of North American respondents having successfully deployed IoT-enabled projects, compared with only 50% in Africa and 38% in South America.
While this increase in full deployments represents progress, the use cases and data management are on the simple side and there are many challenges to overcome if the mining industry is to fully realise the potential of IoT, particularly in regard to using it as driver for organisational change.
A lack of skills, investment and cultural challenges, as well as unreliable connectivity, patchy cybersecurity processes and underdeveloped data management processes were also highlighted in the report and will all need to be remedied in the coming years.
“Two years on from our last research, Inmarsat wanted to get a measure of what had changed in the mining industry,” said Joe Carr, global mining director at Inmarsat. “IoT has begun to take a foothold in the sector with increased rates of adoption across the board. What we discovered was an industry that — historically slow to adopt radical ideas — is now beginning to embrace the use of IoT, but still working out how to make the most of it.”
The mining industry faces significant challenges around skills, security, connectivity, investment and data management. These will need to be addressed for the industry to progress past a point of using IoT in a simple, siloed capacity, according to the report.
Despite the challenges being faced, mining organizations are looking to increase their investment in IoT and are overwhelmingly positive about the value that IoT can bring to their operations and the benefits it is either already delivering or will deliver in the future.
“We want to help drive IoT adoption in the mining sector and encourage mining companies to plot a route to IoT success using our free online IoT Maturity Tool,” Carr concluded. “The tool allows miners to understand their progress in IoT adoption across a number of areas and to compare this with the 200 respondents who contributed to our research. Using these findings miners can start to develop a roadmap for improvement and provide a tangible proof point for influencing internal conversations.”
The global anti-drone market size is anticipated to reach $1.85 billion by 2024, according to a new report by Grand View Research Inc.
The increase in the adoption of UAVs (drones) has resulted in the commencement of another market that focuses on a solution for rogue drones, complete with net-firing bazookas, electromagnetic shields and anti-drone death rays.
U.S. anti-drone market, by destructive mitigation type, 2014-2024 (USD million).
The steep rise in the adoption of drones for commercial as well as recreational purposes has increased concerns regarding aerials attack and threats. Detection and identification of these unmanned aircraft systems have become a vital factor for the maintenance of the security. Various institutions across the world are increasingly deploying counter drone measures to address the ever-growing need for safety and security.
As UAVs become deadlier, stealthier, faster, agile, smaller, sleeker and cheaper, the nuisance and threats posed by them are expected to grow at numerous levels, ranging from personal/domestic privacy to national security. With that in mind, there is significant effort both in terms of money and technology being invested in the development of anti-drone technologies.
Various national security agencies across the world have started to precisely understand the potential threats from drones and increasingly considering commercial as well as consumer drones as the new major threat to the world. It is only a matter of time before redundant and reliable methods of countering drones become mainstream and widely available.
Several busy airports and hubs across the world are seeking defense measures and regulations to protect their airliners and harbored aircraft from drones straying into commercial airspace and posing innumerable threats of a collision. The detection of a range of drone types is expected to require multiple modalities, data fusion systems to effectively identify and detect target drones amongst a cluttered background.
The full research report with a table of contents is titled “Anti-Drone Market Analysis By Mitigation Type (Destructive, Non-Destructive), By Defense Type (Detection & Disruption, Detection), By End-Use (Military & Defense, Commercial, Government), By Region, And Segment Forecasts, 2014 – 2024.”
The GNSS market landscape is expanding due to the rapid growth of GNSS-enabled wearables and unmanned aerial vehicles (UAVs) coupled with new innovation opportunities around low-cost precision GNSS, according to ABI Research’s latest GNSS IC vendor report.
In its latest GNSS IC vendor competitive analysis, ABI Research determines Broadcom and Qualcomm remain the two top IC vendors for the fourth year in a row with a mere two points separating MediaTek in third from u-blox in fourth.
New threats emerge to shake up the landscape in the years ahead, though, with CEC Huada and Samsung now companies to watch, the report said.
“MediaTek and u-blox once again swapped places,” said Patrick Connolly, Principal Analyst at ABI Research. “U-blox had another stellar year financially and, along with Skytraq, led the way on low-cost precision GNSS with its NEO-M8P module. MediaTek, which showed significant success in wearables and smartphones, transitioned back to third place primarily due to growing market share.”
Broadcom and Qualcomm remain the two top GNSS IC vendors. Within the past year, Broadcom spurred more headlines with its wearables success and its initial work on L1/L5 dual-frequency receivers. Qualcomm continues to lead in total GNSS shipments, as well as innovative new technologies like LED/VLC and LTE Direct, according to the report. Its partnership with Baidu on its IZat platform is also notable and represents the beginning of the era of “always on, ubiquitous location technologies.”
But the incumbents are not the only players to watch in this evolving market. CEC Huada and Samsung sit poised to instill great change in the market landscape, as their innovation over the past 12 months serves to prove.
“CEC Huada developed single frequency RTK GPS, as well as BDS receivers and INS/MEMS receivers, which the company released to select customers in 2016,” Connolly said. “And it is now developing a dual frequency BDS receiver and a receiver for IRNSS. Samsung, meanwhile, launched its first embedded GNSS solution, the Exynos CPU chipset. Given its presence across so many GPS-enabled consumer electronic devices, the company looks set to be a major disruptor in the coming years.”
The new report, “Global and Chinese GPS Industry — 2016,” is an in-depth study on the current state of the global GPS industry with a focus on the Chinese market, offered by Research and Markets.
The report provides key statistics on the market status of the GPS manufacturers and is a valuable source of guidance and direction for companies and individuals interested in the industry.
It provides a basic overview of the industry including its definition, applications and manufacturing technology. Then, the report explores the international and Chinese major industry players in detail. In this part, the report presents the company profile, product specifications, capacity, production value, and 2011-2016 market shares for each company.
Through the statistical analysis, the report depicts the global and Chinese total market of GPS industry including capacity, production, production value, cost/profit, supply/demand and Chinese import/export.
The total market is further divided by company, by country, and by application/type for the competitive landscape analysis The report then estimates 2016-2021 market development trends of GPS industry. Analysis of upstream raw materials, downstream demand, and current market dynamics is also carried out.
In the end, the report makes some important proposals for a new project of GPS Industry before evaluating its feasibility. Overall, the report provides an in-depth insight of 2011-2021 global and Chinese GPS industry covering all important parameters.
It’s getting bigger all the time, GPS/GNSS business. And coming along in its wake, starting to grow like a sproutly little brother, is GPS anti-jamming, to safeguard the signal in various scenarios.
The anti-jamming market for GPS is expected to reach US$4.8 billion in value and 309.2 thousand units in volume by 2022, according to a newly released report by Research and Markets, a Dublin, Ireland-based market research “store.”
Anti-jam technology sales revenue will increase at a compound annual growth rate (CAGR) of 7.0 percent between 2016 and 2022, while volume goes up 10.1 percent. Major drivers at the moment lie in the military sector, but that could well change in the next decade. The proliferation of low-cost GPS jammers is seeing to that.
Meanwhile, any armed force that puts its faith in guided missiles now feels the acute need for a secured weapons system, something not easy to accomplish. Flight-control applications are especially vulnerable.
North America is the largest and most dynamic sector of the anti-jamming market, given its powerful military and the presence of three top players in the anti-jamming market for GPS: Rockwell Collins Inc. (U.S.), The Raytheon Company (U.S.) and NovAtel Inc. (Canada).
Other companies cited by the report, and given each their own subsection, are Cobham, Mayflower Communications, BAE Systems, Furuno Electric Company, Harris Corporation, Lockheed Martin, Thales Group, Boeing and u-blox.
Breaking down by receiver type, the report studies two major categories: military and government grade, and commercial transportation grade. The market is also analyzed geographically, with sub-sub-subsections devoted to “Threat From North Korea and Disputes With China,” “Dispute in the South China Sea,” and “The Crisis in Syria and Isis.”
Aside from looking — or deriving, more often — numbers according to Anti-Jamming Technique (nulling systems, beam-steering systems and civilian systems), the report does not concern itself overly with technical details. These usually are of little interest to investors, the report’s main target. Thus it will have little of interest for engineers, except for those practicing business development.
A market breakdown by application lists:
flight control
surveillance and reconnaissance
position, navigation and timing
targeting
casualty evacuation
timing installations
logistics tracking
law enforcement
From the Executive Summary:
“The nulling systems type of anti-jamming techniques accounted for a share of 70.0% in 2015; the market was valued at USD 2,180.3 million in the same year and is expected to grow at a CAGR of 6.7% between 2016 and 2022. The market for beam steering systems was valued at USD 662.8 million in 2015 and is expected to grow at a CAGR of 6.9% during the forecast period. A major reason for beam steering systems holding such a low market share is that they are comparatively new in the market since the last decades and hence are not widely used. They are very expensive and are used only on high-end military vehicles such as strike aircrafts. For a long time nulling systems was the only known type of GPS anti-jamming technique. However, with the development of beam steering systems and the civilian anti jamming systems, the market for GPS anti-jamming is expected to increase.”
In July, GPS World asked the experts, “What percent of a GNSS designer or manufacturer’s R&D budget should be devoted to mitigation of jamming?”
“Solving for jamming, intentional or unintentional, in the design of any GNSS technology platform is no longer an option. How much any one company spends is largely a function of how much is spent on engineering overall and of how much has already been invested upfront on jamming mitigation. The required level of jamming resistance of any PNT solution also depends very much on the particular application, which in turn influences the budget allocated.”
“GNSS jamming is a growing concern, and an assessment of risks and an element of testing against the most applicable real world threats should be included as part of every developer’s engineering process. Spirent has decades of experience in providing test equipment and services to engineers working to understand and mitigate jamming threats. We have seen increased investment by designers and integrators of PNT systems that are driven to provide robust/resilient solutions to their customers.”
“While some receivers already incorporate jamming protection (e.g., CW excision), more sophisticated methods (for example, against broad-band jamming and spoofing) should be incorporated into perspective products. The percentage of R&D budget depends on a line of business. For manufactures pursuing applications such as military and critical infrastructure, the number can be as high as 50 percent. For many civilian applications a potential impact of jamming is less damaging. Yet, from 10 percent to 20 percent should be still allocated.”
What are your challenges this year? How are you driving business in today’s economy? What issues are you concerned about? How much accuracy do you require?
We want to know, and so does the rest of the industry.
GPS World is asking PNT professionals about the state of their business, the economic climate for GNSS products and services, driving market factors, the effects of jamming, the Issue of the Year — and more! Please take the 2016 State of the Industry Survey. It should take approximately 10 minutes, and your responses are confidential.
A handful of lucky participants drawn at random will win:
TWO $100 gift cards good (virtually) anywhere;
a pair of tickets to GPS World’s 2016 Leadership Dinner held during ION GNSS+ (or a voucher for a comparable dinner in your hometown).
Complete the survey by August 17 — not much time! Then look for a complete report of our findings in the September issue of GPS World. If you have any questions, please don’t hesitate to contact me.
Thank you for taking the time to share your feedback and help us improve our magazine content, industry awareness — and your own business!
ABI Research’s competitive analysis evaluates GNSS IC vendors across innovation and implementation parameters
The GNSS market is slowly shifting in new directions, according to ABI Research. While the smartphone market continues to grow, new opportunities are also emerging in automotive, insurance, wearables, unmanned aerial vehicles (UAVs) and the Internet of Things (IoT).
Overall, the GNSS market is forecast to continue to grow strongly, with ubiquitous location and market-specific IC design as key differentiators.
In its latest competitive analysis of GNSS IC vendors, ABI Research evaluates a variety of innovation and implementation parameters to determine emerging competitive threats and technologies, the companies best positioned for success and those in danger of losing out.
Unchanged for the past three years, the market’s two top IC vendors remain Qualcomm and Broadcom, soon to be acquired by Avago. Both companies continually illustrate the ability to lead the way on cutting-edge innovation, which in turn drives their dominant market-share position, ABI Research said.
Beyond just GNSS, both companies also offer comprehensive location technology platforms in HULA (Broadcom) and Izat (Qualcomm), which will enable smartphone OEMs to begin offering ubiquitous location in 2016. Qualcomm’s work on LED/VLC and LTE Direct illustrates the gap that now exists between it and pure-play GNSS IC vendors.
u-blox, a well-established GNSS IC company, has shown continuous growth each year by implementing new technologies and making acquisitions, culminating in its first ever third place ranking, ABI Research said. The company continues to lead the way in its core markets, while also expanding into the emerging IoT space.
“The big surprise this year has been MediaTek dropping to fourth place,” said Patrick Connolly, principal analyst at ABI Research. “This is primarily due to a lack of new GNSS or indoor location products. However, this did not affect its IC market share, or its ability to win an important GNSS IC win with Fitbit in wearables. MediaTek has a history of delivering when its customers need new innovation. As a result, ABI Research expects new product announcements from the company in 2016, especially around indoor location.”
Ranking fifth, STMicroelectronics is seeing customers migrate to its TESEO III platform. Its modular, high-performance approach should also enable it to move beyond its traditional markets of automotive and recreational/fitness, especially as it has begun to leverage the company’s expertise in sensor fusion.
As new opportunities for GNSS continue to develop in markets such as wearables, IoT, personal tracking and UAVs, there will also be a number of new or emerging companies looking to claim a share in the stakes. Analysis findings point to the Chinese regional market as one such area that has potential to demonstrate strong growth trends in future years.
“There’s big opportunity for emerging Chinese start-ups, such as CEC Huada, to meet new, indigenous, market demand over the next 10 years, while also working their way toward becoming major international competitors,” concluded Connolly. “Additionally, Galileo Satellite Navigation, an emerging company focused in software GPS, is reporting impressive results in trials. As consumer electronics start supporting software GPS, it will be interesting to watch whether or not it can achieve volume shipments in 2016.”
These findings are part of ABI Research’s Location Devices Service, which includes research reports, market data, insights and competitive assessments.
The Global Car GPS Industry 2015 Market Research Report is a professional and in-depth study on the current state of the car GPS market spread across 108 pages, profiling 21 companies and supported with 245 tables and figures. The report is divided into 13 major chapters that offer an overview of the current market, as well as forecasts for the car GPS industry.
The report provides a basic overview of the car GPS industry, including definitions, classifications, applications and industry chain structure. Analysis is provided for the international markets, including development trends, competitive landscape analysis and key regions’ development status. Development policies and plans of the car GPS industry are discussed and analyzed, as well as manufacturing processes and cost structures. This report also states import/export consumption, supply and demand figures, cost, price, revenue and gross margins.
The report focuses on major global players in the car GPS industry, providing information such as company profiles, product picture and specification, capacity, production, price, cost, revenue and contact information. Upstream raw materials and equipment and downstream demand analysis is also carried out. Industry development trends and marketing channels are analyzed. Finally, the feasibility of new investment projects are assessed and overall research conclusions offered.
With 245 tables and figures supporting the car GPS industry analysis, the research provides key statistics on the state of the industry and is a source of guidance and direction for companies and individuals interested in the market. Companies profiled include Coagent Electronic S&T Co. Ltd. (Guangdong), Denso (Tianjin), Soling Industrial (Shenzhen), Rotiss Electronics (Huizhou), Shinco (Jiangsu), Skypine Electronics (Shenzhen), UniStrong (Beijing), RoadRover Technology (Shenzhen), Bosch (Shanghai), Newsmy (Beijing), Pioneer (Shanghai), Wanlida Group (Xiamen), BDStar Navigation (Beijing), FlyAudio (Guangzhou), ChanghongIT (Sichuan), Saige GPS (Shenzhen), Panasonic (Beijing), Link Create (Shenzhen), Clarion (Dongguan), Alpine (Beijing) and Aisin (Tianjin).
A related study titled “2015 Deep Research Report on Global Vehicle GPS Industry” provides a basic overview of the industry including definitions, classifications, applications and industry chain structure. The vehicle GPS market analysis is provided for the China markets including development trends, competitive landscape analysis, and key regions development status.
With 147 tables and figures, the report provides key statistics on the state of the industry and is designed to be a valuable source of guidance and direction for companies and individuals interested in the market. The report focuses on China’s major leading industry players, providing information such as company profiles, product picture and specification, capacity, production, price, cost, revenue and contact information. Upstream raw materials and equipment and downstream demand analysis is also carried out.
Vehicle GPS industry development trends and marketing channels are analyzed. Finall,y the feasibility of new investment projects are assessed and overall research conclusions offered. Companies such as Garmin, TomTom, Cobra, GlobalSat, Jensen, Deeper, Dragonpad, PUMPKIN, Pupug, Pyle, Rand McNally, Raymarine, Soundstream, Sourcingbay, Stouch, Uniden, YINUO, Generic and Humminbird are profiled.
The 316-page QYResearch Group report provides a basic overview of the industry including definitions, classifications, applications and industry chain structure. The GNSS market analysis is provided for the United States markets including development trends, competitive landscape analysis, and key regions development status.
Development policies and plans are discussed as well as manufacturing processes and Bill of Materials cost structures are also analyzed. This report also states import/export consumption, supply and demand figures, cost, price, revenue and gross margins.
The report focuses on leading industry players in the U.S., providing information such as company profiles, product picture and specification, capacity, production, price, cost, revenue and contact information. Upstream raw materials and equipment and downstream demand analysis is also carried out. The GNSS industry development trends and marketing channels are analyzed. Finally, the feasibility of new investment projects are assessed and overall research conclusions offered.
With 335 tables and figures, the report provides key statistics on the state of the industry and is directed at companies and individuals interested in the market.
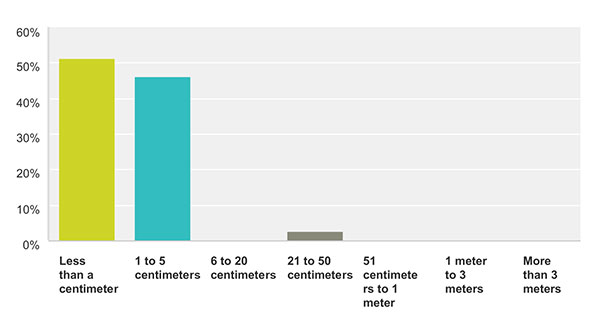
How accurate is good enough for the majority of your market sector? This chart show the answers from those who identified themselves as members of the survey and high-precision community. For more results from this and other sectors, see the 2015 State of the GNSS Industry Report.
Memory fails as to who first said “Accuracy is addictive.” Or perhaps it’s my knowledge base that is deficient. At any rate, I’ll gladly publish documented evidence from anyone who can show the earliest — print or audio — expression of that dictum. It continues to hold as true for this industry as Moore’s Law does for computer technology as a whole.
We have seen the gradual tightening of accuracy requirements across all sectors of the positioning, navigation and timing (PNT) community with each successive iteration of our State of the GNSS Industry Survey, now in its fourth year. This is the first time we have seen it cross the 1-centimeter line. Not in capability; sub-centimeter capability has been available for some time. But now that level of performance is the minimum acceptable “good enough” for more respondents in the survey and high-precision sector than any lesser degree of accuracy; in fact, greater than all other ranges combined. These addicts form the new majority. Their preferences and their behaviors will rule our world.
Other sectors will presumably answer likewise in coming years, following the trail blazed by the high-precision pioneers.
We have crossed the Rubicon. Unlike other obsessive behaviors, there is no going back in our case. This path is a one-way road to — well, not to the various hells entailed by other addictions — but to the promised land of always-on, always-true, near-perfect provision of positioning.
Let’s not kid ourselves, however. The perfect world does not exist. The closer we get to millimetric accuracy, the more obstacles we find in our way. Indoor continuity aka ubiquity, jamming, spoofing, hacking, budget cutbacks, slides to the right — this list will surely grow.
The more acute our addiction, the lower our tolerance for less-than-total fulfillment.
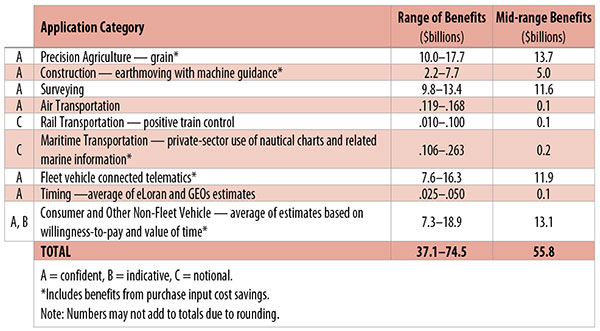
Table 1. Preliminary 2013 U.S. GPS economic benefit estimates. (Chart: GPS World, based on data from author)
This article is based on a presentation to the National Space-Based Positioning, Navigation and Timing Advisory Board in June 2015. The study reported on at the meeting was requested by the National Executive Committee for Space-Based Positioning, Navigation and Timing. It demonstrates the widespread use and importance of GPS to the U.S., with estimated benefits in 2013 of about $56 billion, or 0.3% of GDP for a subset of applications. The study is the first part of an effort that is expected to refine and extend this analysis.
By Irv Leveson
Critical to many civilian applications and innovations, GPS brings great economic benefits. These benefits have grown rapidly with the integration of GPS with other technologies and its wider and deeper infusion into applications. New GPS signals and other improvements in the system will further expand and enhance use. The unmistakable conclusion: GPS is everywhere.
Benefits of GPS to the U.S. will increase with the availability of other GNSS systems, even though GPS will constitute a smaller share of global GNSS benefits. The U.S. will continue to provide leadership, standards and innovation in technology and applications with positive domestic feedback.
GPS and other GNSS and enhancements raise productivity; reduce and avoid costs; save time; enable improved and new production processes, products and markets; increase health and well-being; reduce injury and loss of life; improve the environment; and increase security.
The National Executive Committee for Space-Based Positioning, Navigation and Timing (PNT), which is responsible for maintaining U.S. leadership in GNSS, commissioned a study to assign a quantitative value to the broad economic uses of GPS. The purpose is to inform the public, federal decision makers and critical infrastructure owners/operators on the importance of GPS and the need to protect it from disruption. Assessing the economic implications of actions such as preventing or disallowing interference, spectrum reallocation, developing supplementary or backup systems and/or toughening receivers can be informed by value estimates and the data used to derive them. In addition, economic values can contribute to planning for GPS modernization and analysis of budgets. Baseline estimates facilitate comparisons with future developments. GPS benefit estimates will be “ballpark” no matter how sophisticated the methodology because of limits to the availability of information, but in many cases, knowing orders of magnitude is essential in choosing courses of action.
Widespread, Pervasive Impact. The technological environment is one of rapid changes in information and materials technology and integration of technologies at levels ranging from systems on a chip to large-scale systems. GPS is increasingly integrated with other technologies and systems that build on each other to achieve greater outcomes.
The U.S. Department of Homeland Security counts GPS as an enabling technology because of its crucial role in 14 of the 16 industries that are classified as part of the nation’s critical infrastructure. It is useful to view GPS’ role as being especially important in “enabling the enablers,” industries that particularly support the rest of the economy and are at the forefront of economic growth. The most notable of these are transportation, communications, power and financial services.
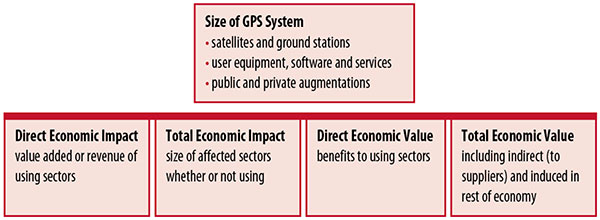
Economic Value versus Impact
Economic value is the addition to the value of the economy from the provision of a good or service, or the introduction of a technology. Benefits are measured relative to what would have been expected if there were no GPS. Direct economic value is the increase in value in using sectors. Total economic value includes increases in value to suppliers and value induced in the rest of the economy.
Direct economic impact, on the other hand, refers to measures of the importance of sectors that are using GPS. Total economic impact is the importance of sectors affected by GPS, whether they are using it or not. Total economic impact of GPS is virtually the size of the whole economy, so it is not very meaningful.
Direct economic impact is measured by value added of using sectors when the purpose is to avoid duplication among sectors that buy from and sell to each other. It may be measured by revenue for a single sector when adding sectors is not involved, so there is no need to avoid duplication.
The distinction between economic value and economic impact is critical. Even if economic impact is measured by value added rather than revenue, the value is not the net addition to the economy from the use of the product or technology. It is only the size of the using sector. See Figure 1.
Figure 1. Measuring GPS economic value and economic impact. (Chart: author)
The GSA Study
The most comprehensive estimates of global GNSS market size come from the European GNSS Agency (GSA), which has released four market reports from 2010 through 2015. The data are measures of economic impact and not economic value. The reports are of great interest because of their comprehensive global look at the sizes of markets and inclusion of forecasts. In contrast, the emphasis in this part of the present study is on current economic value, with U.S. benefits assessed for GPS.
One reason for interest in the GSA reports is that market information and projections often are proprietary and there can be great inconsistency across market research studies. GSA makes use of many confidential studies without revealing which sources contributed to each estimate. It apparently has been allowed to incorporate proprietary information from a number of market research firms since the data is subsumed in GSA’s own estimates and/or presented in graphs for which underlying numbers are not provided — and from which it is often difficult to even roughly extract them.
The 2015 report stated the methodology as: “The underlying forecasting model uses advanced forecasting techniques applied to a wide range of input data, assumptions and scenarios…Where possible, historical values are anchored to actual data.” Results were checked against opinions of market segment experts and market research reports. However, these analyses are not provided in the reports and have not been made available.
A distinction is made between the core market which covers the value of components that provide GNSS functionality in devices and enabled markets which “represent the services and devices enabled by GNSS.” The 2015 report provides global data on both core and enabled market and goes into much more detail on core markets for application sectors. In addition to providing sector information that did not appear previously, the 2015 report presents data on the extent to which each combination of the GNSS constellations was supported by receivers or chipsets offered by suppliers. Additional information on enabled sectors is in earlier reports.
GSA found in its 2015 market report that:
3.6 billion GNSS devices were in use globally in 2014, of which 3.08 billion were smartphones and .26 billion were for road.
North America had about 450 million devices installed (about 80% U.S.).
North America had 1.4 devices per capita in 2014.
North American shipments were 250–300 million in 2013.
Global core revenue was estimated at roughly €62 billion and enabled revenue at €227 billion in 2014. As noted, core revenue includes GNSS device components, software and services, while enabled revenue refers to applications.
Location-based services (LBS) was projected to account for 53.2% of 2013–2023 core revenue growth, and road for 38%.
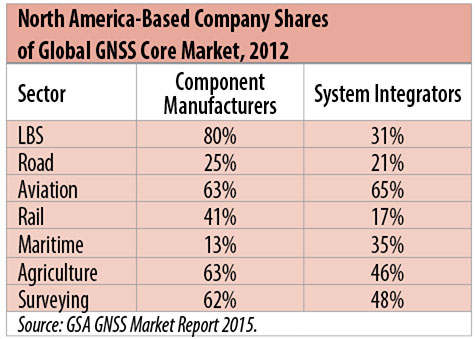
North American-based companies had sizeable shares of the global GNSS core market in 2012, particularly among component manufacturers. (See Table 2). Their market share among system integrators was highest in aviation.
North American-based companies had a 44% market share of value-added services revenue in 2012.
Table 2. North America-based company shares of Global GNSS core market, 2012. (Chart: author)
Markets and Applications
The pervasiveness of GPS-enabled applications is illustrated by the following statistics:
900 million mobile phones that incorporated GPS were sold globally in 2012.
The U.S. had 188 million smartphone subscribers and 263 million Internet users in 2013.
20% of U.S. mobile phone users get up-to-the-minute traffic or transit information.
The new industry category in the 2012 North American Industrial Classification System: “Internet publishing and broadcasting and web search portals” had U.S. revenue of $87 billion and 181,000 employees in 2012.
Google estimated that its search and advertising tools provided $111 billion in economic activity in the U.S. in 2013.
Deloitte estimated that Facebook enabled $104 billion of economic impact and 1.2 million jobs in North America in 2014.
Google Play and the Apple App Store each had more than 1.2 million apps in 2014.
How GPS Is Used. Uses of GPS include:
In agriculture for auto-steering tractors, combines and sprayers for precise operation, variable rate technology for precise placement of seed, fertilizer and pesticides, and for yield monitoring.
Managing forest health and ecological restoration, reducing fire and other hazards, and harvesting forest products.
In commercial fishing, navigation, finding fishing locations and monitoring fish catch by authorities.
In construction to direct the movement of dozers, excavators, pavers, scrapers, compactors and other heavy equipment and the placement of blades to give precise results.
In open-pit mining to guide loaders, dozers, drills and draglines.
In offshore energy exploration and development, for drilling, installations, pipe laying, diving operations, pipe inspection, repair and abandonment.
In surveying, to greatly reduce costs and to improve quality of products that rely on it.
In aviation, for navigation and monitoring positions of aircraft and for satellite-based augmentation systems (WAAS in the U.S.). GPS is the principal source for navigation for aircraft equipped with Area Navigation (RNAV) or Required Navigation Performance (RNP).
Railroad train pacing systems for cruise control, positive train control to keep track of train location and movement authorities, track defect location, and locating trucks with rail workers.
In marine transportation, for navigation, collision avoidance, communications and situational awareness and for monitoring by offshore authorities.
In vehicles, with handheld and embedded devices for navigation and fleet management.
For precise timing and time synchronization and frequency coordination (syntonization). It is used most notably in broadcasting and communications, including both cell phones and traditional telephone applications and the Internet, so packets arrive at the same time, for power generation and distribution to locate problems, and in financial services for time-stamping transactions.
In first responder services for location, navigation and communications and in emergency warnings and evacuations.
In structural monitoring of dams and bridges.
In environmental monitoring, including vegetation growth and sea-level change.
LBS and GIS
Rapid growth is taking place in location-based services (LBS) and geographic information services (GIS), which include everything from indoor location to many aspects of the Internet of Things and the “sharing economy,” and sophisticated systems for information management, analysis and display.
GPS is used for tracking and inventorying assets ranging from heavy machinery on farms and construction and mining sites, to pipes and other materials, containers in trucking sites and ports, and the location of utilities in the ground. In logistics it facilitates planning of product flow and transport.
The growth of same-day delivery — which takes advantage of Internet, cell phone, and location and navigation technologies enabled by GPS — is a continuation of the growth in just-in-time delivery that has been a phenomenon in manufacturing for several decades. Now it is having a profound effect on wholesale trade, retail trade and transportation.
The size of the LBS and GIS sectors is not defined and measured in a consistent way, and except for vehicle use, there is little information on productivity and saving in costs and time. (See sidebar box.)
LBS and GIS Market Size Estimates
For LBS and GIS, definitions and measures can vary greatly and often are not explicit.
Location-Based Services Market Size Estimates
Frost & Sullivan estimated the global LBS market at €22.8 billion in 2012 and forecast €32.0 billion in 2015.
Market and Markets estimated global LBS revenue at $8.1 billion in 2014.
Berg Insight estimated North American LBS revenue at $835 million in 2012.
(The U.S. can be assumed to spend 20–25% of the world value and about 80% of the North American value.)
Geographic information Systems Market Size Estimates
BCG estimated revenue of the U.S. GIS industry at $73 billion in 2011.
The global GIS market will reach $10.6 billion in 2015, according to a report of Global Industry Analysts in 2013.
The Canadian Geomatics study found private-sector spending of $2.3 billion in 2013. If U.S private spending was the same percentage of GDP, it would be $23.6 billion.
International Trade
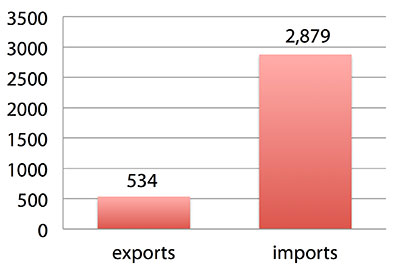
Official data show a $2.3 billion U.S. deficit in trade in GPS equipment in 2013. This gives an incomplete and misleading picture of the role of the U.S. and the benefits that result. See Figure 2.
Figure 2. U.S. trade in GPS equipment, 2013 (millions of dollars). (Chart: author)
The trade numbers for GPS equipment do not include revenue for licensing, international payments received by social media and e-commerce companies, or other Internet-based revenue for which the U.S. may have a substantial net trade surplus and which are an important source of revenue and profits of U.S.-based companies.
Imports of GPS equipment software and services enable the U.S. to gain more efficient production in many applications at home and enable the U.S. to export more goods and service that rely on GPS.
Exports of GPS equipment come back to the U.S. as components that benefit U.S. businesses and consumers with more capable products and lower prices. Exports of GPS equipment enable other countries to build on the technologies and contribute to innovation, while imports enable the U.S. to share in foreign innovations. Exports of GPS equipment and associated knowledge also raise incomes in other countries, creating larger markets for U.S. goods and services.
Scope of Benefit Estimates
The U.S. benefit estimates reported here are the result of an initial effort and are not meant to be comprehensive. More work is expected to be done to fill in some of the gaps.
Sectors were chosen based on availability of information to permit relatively robust estimates and importance to the economy or policy issues. These considerations limited the number of sectors for which estimates could be made. Methods were determined based on the nature of available studies and varied among sectors. Only economic benefits were included, with health and safety and environmental benefits left for later research.
Benefits include the value to users above their costs (consumer surplus). Benefits of GPS are compared with alternatives without GPS or an application using it (counterfactuals). Estimates are gross. They are not reduced by the costs of achieving the benefits. Contributions of augmentations are included, since a quantitative basis for separating them is not available.
Estimates were primarily benefits through productivity and cost savings in operations, with savings in input costs included where their magnitudes were clear. Benefits to the rest of the economy are not included. Illustrative allowances were made for the contributions of other technologies and systems to the outcomes examined.
In the case of GPS timing, the estimates were based on the costs avoided by not having to develop an alternative timing source on the assumption that the type of alternative source possible would have evolved from the time GPS became available. The measure does not represent the value of GPS time and synchronization to the nation and to users relative to the absence of a precise time and frequency source.
Government was included in the estimates for construction, surveying, and fleet and non-fleet vehicles. For timing and non-fleet vehicle benefits, two alternative measures are averaged. Sectors with lower quality estimates — rail and maritime transportation — were included because of their importance to the economy. Shares of benefits attributable to GPS were rough assumptions. More robust estimates would require extensive data collection and interviewing in studies greatly exceeding available time and resources.
The primary focus was on productivity improvements, cost savings and cost avoidance, where costs include users’ time. Productivity increases and cost reductions allow more to be produced with the same amount of resources in the sectors utilizing the technology or allow resources to be freed up for other purposes. In that sense, they are equivalent.
When benefits are measured by productivity gains or cost savings, much of consumer surplus (the value to users above what they pay) is implicitly included. Some sources measure value by willingness-to-pay. Willingness-to-pay includes consumer surplus. It also encompasses costs of the purchase and other costs incurred by the user.
Criteria for Selecting Sectors
The potential for making sector estimates of economic benefits was categorized in three basic levels:
confident: based on robust estimates.
indicative: based on one or more less robust estimates.
notional: illustrative, if major contributions of other technologies are not separated and estimates must be based on a plausible percentage of a larger benefit, or if information is not available and estimates must be based on a percentage of market size.
Choices among categories for estimation and estimation methods depended not only on which of the basic criteria are satisfied but also on the following additional criteria:
The importance of the sector to the economy, for example as an enabler of other activities.
The potential use of benefit estimates for the category as an input into analyses of the effects of signal disruption.
Several dozen studies were assessed to determine categories for inclusion and to select studies that can form the basis of estimation. Studies for use in estimation of benefits in a category were chosen according to how well they met the following criteria:
GPS. A test of introduction of GPS or comparison with and without GPS rather than benefits of a broader service.
Coverage. Estimates that cover a major part of the category.
Robustness of estimates, including the type of review the source is likely to have had.
Consistency. If alternative better estimates are not in such a wide range that an average is less meaningful except where explainable by expected sources of variation.
Timeliness. Preference to a recent period being covered by the estimates.
U.S. Economic Benefit Estimates
Preliminary estimates of economic benefits for included U.S. sectors totaled $55.8 billion in 2013. Averaging the alternative estimates, the sum of the benefits in the two vehicle categories is $25 billion, by far the largest of the sectors estimated. Next were agriculture with $13.7 billion, and surveying with $11.6 billion.
Economic benefits are underestimated for several reasons. Some sectors are not included because of lack of information on productivity and cost savings, namely LBS other than vehicle, including asset tracking and locating people; GIS and mapping other than nautical charts, forestry, fisheries, mining, energy exploration and development, land and coastal management, weather, and scientific applications and space.
Parts of others are not included: non-grain agriculture, construction other than earthmoving, GPS in aviation for some Area Navigation (RNAV) Standard Instrument Departure Routes (SIDs) and Standard Arrival Routes STARS) and Required Navigation Performance (RNP), and rail other than positive train control.
Some estimates are conservative. The value of saved time in non-fleet vehicle transportation is based on the recommendation of the Transportation Research Board rather than the much higher value used by the U.S. Department of Transportation.
Some types of benefits are not included — specifically, benefits of GPS timing applications above the cost of alternatives, and avoided income loss, property damage and medical costs associated with reduced accidents and improved emergency response.
Increases in benefits between 2003 and 2005 are not estimated.
And, as indicated, non-economic benefits such as those to health, safety, security, reduced loss of life and to the environment are not yet addressed.
Benefits as measured thus far are about 0.3% of GDP in one year. If all of the excluded sources of benefits were quantified, the benefits would be much larger.
Estimating Benefits for Sectors
U.S. economic benefits of GPS for grain farming were estimated for farms with grain sales of $250 million or more. The same method as was applied for earthmoving in construction.
A composite range of percentages of productivity gains and cost savings of 18–25% was determined from various studies. In the case of grain farming, benefits also come from yield increases due to improvements in plant health. The productivity gains used in the calculations incorporated both sources of benefits. Productivity was taken together with market size and an estimate of 68% adoption of technologies taking advantage of GPS to compute initial estimates of benefits. A notional adjustment was then made to exclude the contributions of other technologies and GNSSs. While having the adjustment determined by a group of experts would have been preferred, that was not possible with the time and resource constraints of the study.
Benefits of GPS machine guidance with earthmoving in construction were calculated based on an 8–12% share of construction for earthmoving operations, a benefit of 18–22% and a 20–25% adoption rate, relying on a number of sources.
For surveying, an estimate of market size was constructed based on U.S. Bureau of Labor Statistics data on numbers of surveyors, cartographers and photogrammetrists in the engineering services industry vs. the rest of the economy, together with revenue data for private surveying and mapping from the Economic Census. This was combined with a composite estimate of productivity gains over conventional surveying of 45–55% and an assumption of 100% adoption.
The benefit values for air transportation were estimated for the study by the Federal Aviation Administration (FAA) based on effects of WAAS and performance-based navigation (PBN). The rail estimates cover only positive train control, which is in early stages of implementation. Information is highly uncertain, but impacts as of 2013 are small. Maritime benefits were based on updating an earlier estimate of benefits of the private-sector value of nautical charts. The estimates for fleet vehicle-connected telematics were based on savings found in an extensive survey of fleet customers over a five-year period.
Timing benefits were based on the avoided costs from not having to develop an alternative source of timing. Alternatives considered were eLoran and a system of three geostationary satellites. Since there would have been strong pressures to develop an authoritative timing source in the absence of GPS timing, it was assumed that one of the alternatives would have been developed rather than assuming as in other cases that technologies in use when GPS became available would have continued in use.
Two estimates also were made for consumer and other non-fleet vehicle use. One was based on extrapolating results of a study of consumer willingness to pay for navigation services, and the other on time saved by navigation services.
Part of the benefits of LBS other than those that are vehicle-related and for GIS are implicitly included in estimates for sectors that use them.
Data and Research Needs
Additional work would be desirable to extend and refine the GPS economic benefit estimates, quantify safety-of-life and environmental benefits, examine international benefits, assess potential future benefits and consider loss from denial of GPS. Benefits of many new and rapidly growing services are yet to be quantified.
Systematic research is needed to fill in gaps in adoption, productivity and cost savings with comparative before-and-after studies as well as with case studies. Robust studies require major and often multi-year efforts involving targeted data collection, which are rarely done by government or academics for GNSS. Information needs to be much more granular, taking into account specific functions in which GNSS is used (such as plowing, seeding, fertilizing, harvesting), specific GNSS and non-GNSS technologies employed in each function at each site, and extent of their use.
Also, results for GPS might be improved or at least be more acceptable if the contribution of other technologies and GNSSs to measured benefits were assessed by a group of knowledgeable individuals rather than by a single researcher.
Information on market size, penetration and growth from market research firms, which tends to capture recent developments, is based on greatly varying sources and methods, resulting in major gaps and great divergence in estimates, especially in new or rapidly growing areas like LBS and GIS. The North American Industrial Classification System (NAICS) and its application in federal data collection such as in the Economic Census lags far behind in recognizing new categories and providing sufficient detail. Lags in data collection and research lead to understatement of the use and benefits of GPS.
Looking to the Future
Future benefits are expected to be even greater because of evolution of technologies, expansion of GNSS systems, creation of new products and markets, and growth and penetration of markets. The possibilities are suggested by the numerous nascent applications that have been emerging. Many will be enabled by expanding GNSS systems, signals and capabilities in conjunction with geographic expansion and increased capabilities in wireless systems.
The progression of platforms is long and growing: mainframes, PCs, mobile phones and other handheld devices, tablets, game controllers, wearables, TVs, home appliances, air and space — including planes, UAVs, satellites, planets, moons, rovers, rockets and spaceships.
The widespread availability of platforms and the growing ability to utilize them promises a long way to go in developing applications and deriving benefits.
Acknowledgments
The author thanks the PNT Advisory Board and Gov. Jim Geringer, liaison from the board to the study; Jason Kim of the Department of Commerce who oversaw the project; Jim Miller of NASA; and the members of the interagency Economic Study Team that advised the effort. Numerous additional people in and out of government provided information and assistance. Responsibility for the content and findings rests with the author.
IRV LEVESON, who has a Ph.D. in economics from Columbia University, is an economic and strategy consultant and founder of Leveson Consulting. He has done extensive work on GNSS markets and issues for more than 10 years. He is a member of the Institute of Navigation, the American Economic Association and the National Association for Business Economics.