Tag: mobile devices

  • Esri Introduces Collector for ArcGIS App for Android and iOS

    Esri introduced Collector for ArcGIS, which allows users to capture and report spatial and/or tabular information directly from their iPhone or Android smartphone in the field.

    The Collector for ArcGIS application simplifies data collection in the field. Data can be recorded using GPS or by tapping on the map. The Collector app provides the ability to plan routes, generate directions, capture photos and video, and seamlessly integrate information back into an organization’s GIS. The app can also be configured for use with various tools to help tailor data collection workflows to users’ specific needs.

    The Collector for ArcGIS is available for download from the Apple App Store and Google Play (formerly Android Market).

    The Operations Dashboard and Collector applications are available to organizations that have either a 30-day trial or have purchased an ArcGIS Online subscription..

  • Blue Marble Releases Global Energy Mapper Version 14.1

    Blue Marble Geographics has announced the release of Global Energy Mapper 14.1, making available a variety of enhancements in the its GIS tool for energy professionals. This update to the company’s desktop GIS software offers  new and improved features and functions, including a significant improvement in the ability to process massive amounts of LiDAR point cloud data, jumping from tens of millions of points to hundreds of millions. B

    lue Marble’s geospatial data manipulation, visualization and conversion solutions are used worldwide by thousands of GIS analysts at software, oil and gas, mining, civil engineering, surveying, and technology companies, as well as governmental and university organizations.

    Global Energy Mapper 14.1 provides a dramatic increase in LiDAR processing and display speed and the ability to view and process point files in the hundreds of millions range, Blue Marble said. This is beneficial for previewing the data before creating a gridded surface model and includes several options for filtering the data during import and for rendering the point cloud to reflect return type or intensity. Improved metadata access provides a detailed statistical breakdown of the point cloud and customizable point size improves on-screen display. Global Mapper Package (.GMP) files are now able to store LiDAR point clouds in a special compressed format, much smaller than uncompressed LAS data and on par with the best compression available today. This allows LiDAR data to be efficiently archived or shared with other Global Mapper users.

    Global Energy Mapper 14.1 also provides a new tool for creating whisker lines emanating from a selected point or points, useful for seismic survey coverage. Whisker lines are often used to estimate coverage from selected points to see if a point in a seismic survey covers what is needed. There is also a new digitizer tool for easily subdividing an existing area into four separate areas that is useful for subdividing parcels or properties.

    Version 14.1 includes an enhancement to the Site Pad Placement tool so users can create a site pad for a non-level surface. There are also speed improvements when accessing Spatial On Demand data from our partner Spatial Energy, along with new built in point types for oil and gas symbology, Blue Marble said. Additionally USB dongle licensing is now available for GEM with this release.

    “We are excited to be offering this significant upgrade to our Global Energy Mapper customers,” stated Blue Marble President Patrick Cunningham. “We are confident our users in the oil and gas and other energy sectors will be impressed with the improvements in processing LiDAR point clouds along with the new energy specific tools.”

  • Exprodat’s Team-GIS Software Brings Petroleum Workflows to ArcGIS 10.1

    The Exprodat Team-GIS software suite has been updated to support ArcGIS 10.1.

    The widely used ArcGIS for Desktop extensions provide simple access to powerful petroleum workflows. All oil and gas companies on the ArcGIS 10.1 platform can now use Team-GIS software for data transfer, play based exploration, license ranking, reserve estimation and well-pad pattern planning.

    The Exprodat Team-GIS software is used by oil and gas teams for petroleum exploration and production workflow, using Esri’s ArcGIS platform. Because the Exprodat Team-GIS software is data independent, oil and gas companies are able to integrate vendor data with their own in-house datasets. This means that, through this enhanced GIS-based spatial analysis, decisions can be made faster, risk can be managed and technical uncertainty is reduced, Team-GIS said.

    “Our Team-GIS extensions were designed with the geoscientist in mind,” said Exprodat’s Technical Director Chris Jepps. “You don’t need to be a GIS specialist or understand niche spatial terminology in order to achieve many complex spatial analysis workflows common in oil and gas. We’re delighted that our extensions are now available to organisations working on the ArcGIS 10.1 platform.”

    The Team-GIS software suite comprises these extensions:

    • Acreage Analyst – rank exploration blocks, leases and companies
    • Directory – find, preview and add spatial data, increase ArcGIS user adoption
    • KBridge – transfer data between KINGDOM and ArcGIS
    • Segment Analyst – create play chance maps
    • Unconventionals Analyst – estimate reserves and optimize well patterns.

    For more information on the Exprodat Team-GIS software, visit www.exprodat.com/Software.

  • GIS Cloud Technology Automates Geospatial Information for Disasters

    People worried about getting caught in an earthquake will be relieved to know there’s an app for that. The iPhone app, Earthquake Buddy, which was recently featured at an IEEE conference, sends a warning email to those in 5.0 and higher earthquakes to alert them of impending danger. If users fail to respond in a given amount of time, someone sends the cavalry.

    This app, which could be very handy in some parts of the world, is the result of a combination of technologies, including remote sensors, cloud computing and geographic information systems (GIS).

    “The power of GIS technology lies in its ability to combine location-based information with other data to perform complex analyses to gain insights and automate processes in ways never before possible,” said Stephen McElroy, GIS program chair at American Sentinel University. “GIS is used in many phases of disaster management and this starts before an event actually happens.”

    McElroy notes that in the immediate aftermath of a serious disaster, such as an earthquake, the most pressing needs facing GIS managers is to estimate the impact of the disaster on the local population where first responders need to focus their rescue efforts.

    Technicians and geospatial analysts use GIS technology to collect, store, analyze and share geospatial information needed by agencies to effectively support operations, aid disaster relief and restore disaster-affected areas.

    GIS professionals understand how to make the technology work, McElroy said. However, organizations can still see limitations in their abilities to use GIS, particularly in remote offices that might not have the same speedy access to corporate data centers as a headquarters or regional facility.

    GIS technicians can add flexibility and options that are unavailable any other way, largely due to the inherent capabilities of cloud computing. These options include:

    • Centralized resources: Cloud computing can allow a company or its service provider to centrally deploy and manage GIS resources, reducing the cost of management complexity.
    • Service delivery everywhere: When software is deployed locally, users are dependent on being within the reach of the organization’s data center. With cloud delivery, users can be virtually anywhere that an Internet connection exists.
    • Leverage of mobile devices: In a traditional GIS implementation, software might run on a server or a desktop. But in either case, users are bound to the office. With a cloud deployment, it’s possible to provide access through any sort of device, including smartphones and tablets, improving the organization’s operational flexibility.
    • Use of a service provider’s expertise: Having GIS experts on staff doesn’t eliminate the costs and complexities of using the associated software. Companies may need to train IT staff on how to run the applications. With cloud access from a vendor, a company can make use of the capabilities and leave issues of maintenance, configurations, and upgrades to people whose full-time job it is to manage the software in question.
    • Scaling up or down: When a company runs software on its own premises in traditional configurations, adding users can be complicated. The company might have to order new servers and undertake a system upgrade. With cloud computing, a company that needs to ramp up GIS use simply adds users to the monthly contract and can then scale back down to save money.

    “In our technology-hungry world any company that might use GIS internally or for customer applications and cannot afford for the data to be accessible for a long period of time should strongly consider whether a cloud implementation might offer some compelling benefits,” McElroy said.

  • Avenza Releases MAPublisher 9.1 for Adobe Illustrator

    New ability to export HTML5 web maps and enhanced MAPublisher LabelPro features.

    Avenza Systems Inc., producers of the PDF Maps app for iOS and geospatial plugins for Adobe Creative Suite, including Geographic Imager for Adobe Photoshop, has released  MAPublisher 9.1 for Adobe Illustrator.  MAP Web Author now has the ability to export HTML5 web maps (in addition to the already available Flash output), which are suitable for mobile devices such as tablets and smartphones. In addition, the MAPublisher LabelPro extension has been updated to include the ability to use label filters and expressions for even more detailed labeling as well as a redesigned and more flexible user interface.

    “MAPublisher 9.1  now supports the export of HTML5 web maps. We’ve seen a growth in online mapping and the upward trend of using HTML5 technology to make websites more interactive and interesting. More importantly, map makers and webdesigners alike can extend their HTML5 web maps to smartphone and tablet browsers without the need for additional plug-ins,” said Ted Florence, President of Avenza. “With this new version, we are seeing increased labeling performance, detail, and flexibility.”

    Enhancements and new features of MAPublisher 9.1: MAP Web Author HTML5 export; MAPublisher LabelPro redesigned interface, new label filters feature, and improved performance; Various user interface and performance enhancements to improve usability

    MAPublisher for Adobe Illustrator is powerful map production software for creating cartographic-quality maps from GIS data. MAPublisher tools leverage the superior graphics design capabilities of Adobe Illustrator to manipulate GIS data and to produce high-quality maps with accuracy and efficiency.

  • SuperGIS Engine 3.1 Beta Version Released

    SuperGeo’s beta version of SuperGIS Engine 3.1, the collection of COM GIS components for customizing GIS applications, is now available.

    Integrating with map and GIS technologies, SuperGIS Engine 3.1 is the collection of COM-based components developed by SuperGeo. As the product of core components in SuperGIS series software provided for developers, SuperGIS Engine 3.1 can be embedded into programming language under Windows developing environment to integrate with other systems and enhance efficiency of system developing.

    SuperGIS Engine 3.1 provides 32-bit and 64-bit developing components that enable developers to develop GIS applications they need in common development environments such as Visual Studio 2005/2008/2010 Visual Basic, VB.NET, Visual C# and so on.

    Furthermore, SuperGIS Engine contains hundreds of GIS-related objects that allow developers to customize various applications elastically and achieve diverse GIS manipulation functions like layers overlaying, map viewing and querying, geoprocessing, etc.

    SuperGIS Engine 3.1 Beta is released. Users, who are interested in SuperGIS Engine 3.1, please visit SuperGeo website: http://www.supergeotek.com/ProductPage_SE.aspx , or contact us with e-mail: [email protected] .

  • Human Geography at GEOINT

    Could the Connecticut Shootings Speed Human Geography Tools?

    By Art Kalinski, GISP

    During the past few days there has been a stream of talking heads offering advice after the tragic shooting in Newtown, Connecticut.  Some want schools to have airport like screening equipment with full time police officers, others want more aggressive psychological counseling, while others want to ban some or all guns.  Just last August, Norwegian mass killer Anders Breivik was sentenced to 21 years after his 2011 killing of 8 with a car bomb and 69 students in a summer camp with semi-automatic weapons.  That, in a country with some of the strictest gun laws in the world.  So what’s the answer?  I’m not sure but I lean toward more conceal and carry permits.  The cause and effect may only be statistical, but the numbers seem to show less crime where conceal carry permits are common.  Most bullies and killers fear someone fighting back so they almost always pick soft targets.

    There is another possible, longer term path that has the potential to be very beneficial and possibly very sinister, Human Geography.  In the early days of GIS I was thrilled to be able to print a simple zip code map with points plotted within the zip code to measure and display demographic data.  In the mid nineties, when I was the GIS manager of the Atlanta Regional Commission, my GIS team was able to help the Atlanta Fire Department catch a serial arsonist by mapping the arson locations and comparing that distribution to home addresses of know past arsonists.  Although not a perfect match, the plots did help identify and ultimately convict the arsonist.

    We are now well beyond points, lines, and polygons GIS.  Today I use my cell phone for navigation, voice directions as well as a street-level imagery of my destination along with photos, video and hundreds of other web based applications.  The same progress has occurred in the intelligence community as maps, imagery, live video, and “other” sources of information have been merged using “Geospatial Multi-INT fusion” to build pattern of life analysis with the potential to anticipate harmful actions.

    One of those “other” sources of data is social media and human geography which had its genesis with Web 2.0.  The term Web 2.0 was coined in 1999 to describe web sites that use technology beyond the static pages of earlier web sites.  It was not a new version of the World Wide Web but referred to the way web sites evolved to allow users to interact and collaborate with each other such as social networking sites, blogs, etc.  Although the US and Europe lead the world in use of social media, Second and Third World countries also have a strong user base of social media.  Most Third World countries never went through the long technology slog we went through laying miles of phone land lines as the technology evolved.  Many of them went direct to cell-phone technology, bypassing the expense and effort of land lines.  As a result, social media plays a surprisingly strong role in countries that still have limited mass media access.

    It’s no surprise that there was an increase in the number of human geography presentations and exhibitors at GEOINT.

    Geoint 2012 panel 

    There was even a pre-conference day devoted exclusively to Human Geography.  The following is a limited snapshot of exhibitors I saw that focused on human geography and social media.  Most of the big players such as Lockheed Martin, Northrop Grumman, BAE, SAIC and others have been doing significant work in these areas but the below are small companies that focus exclusively on human geography.

    Aptima (www.aptima.com/products/lava ) produced LaVATM , a statistical tool for extracting concepts and patterns using natural language processing.  They use online news, social media and blogs to follow the spread of ideas.

    Berico Technologies (www.bericotechnologies.com) demonstrated CLAVIN (Cartographic Location And Vicinity INdexer) which is an open source software package that derives location names from unstructured text and compares them against a gazetteer.  CLAVIN doesn’t just “look up” location names – it uses intelligent logic paths to identify exactly locations based on the context of the text. CLAVIN also uses fuzzy logic to work its way through misspellings or language translations.  There is a USGIF video taken at GEOINT that explains the process (http://geointv.com/archive/geoint-2012-tech-talks-berico-clavin)

    Courage Services, Inc.  (www.courageservices.com)  does research and analysis related to human geography, Socio-cultural dynamics, social media, risk assessment and mitigation.  Their geospatial services include human geography mapping services, imagery and video analysis, mobile and web based applications.  They have focused heavily on humanitarian assistance, disaster relief and development.  Specifically supply chain logistics, situational awareness, critical infrastructure mapping and emergency response support.

    DataCards (www.datacards.org)  indexes data sources that relate to irregular warfare, assessment, or can be used for socio-cultural modeling.  These cards provide a summary description and evaluation of the content, quality, intended purposes, and potentially appropriate uses of each source

    Ergo (www.ergo.net ) delivers ground truth and actionable intelligence from frontline sources.  Unlike other human geography firms they rely on hands-on experience and feet-on-the-ground rather than electronic media.  They have a network of vetted and trusted team members who are locals. They know the political and business environment, understand the customs, and speak the language.  They specialize in “hard cases” – opaque geographies, obscure topics, and sensitive issues that other firms struggle to address with open source media.  They’ve been in business for 7 years and have completed over 400 projects in 90 countries.

    The HumanGeo Group, LLC (www.thehumangeo.com) developed geospatial applications to synthesize, manage, and exploit large data sets, leading-edge non-traditional cyber security and specialized rapid search capabilities. The HumanGeo Group also brings together experienced special operations and intelligence agency veterans to address security and intelligence needs.  HumanGeo also provides business intelligence, geospatial visualization and innovative enterprise search applications that can help reduce risk.

    Recorded Future (www.recordedfuture.com) is in the business of mining “Big Data” to try to have advance knowledge or improved understanding of what might happen in the near future.  They continuously harvests and perform real time analysis of news from more than 40,000 sources on the web, ranging from big media and government web sites to individual blogs and selected twitter streams.  This analysis ties together countless pieces of information that highlight future events.  They can’t predict the future but they can highlight future events based on analysis of millions of events tied to more than 2 billion facts in their database.  This may sound somewhat Orwellian but does point to where things could be headed.

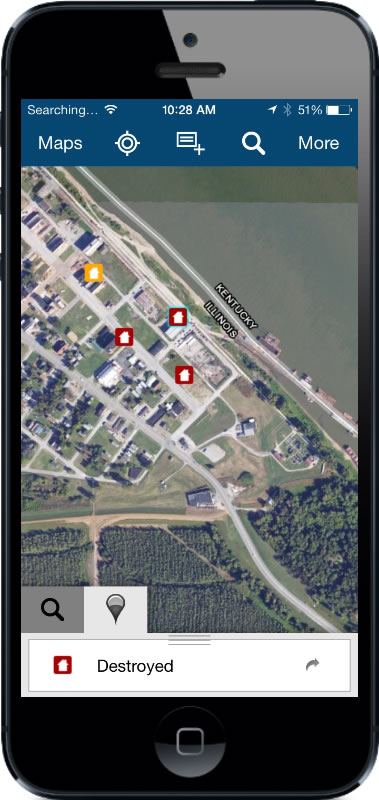
    Fulcrum (www.spatialnetworks.com) is a cloud-based data collection system for iPhone, iPad, and Android devices.  Users can create location-based data collection apps and deploy them to mobile devices within minutes.  It facilitates collaboration so a data collection team can work on the same project collecting data in the field quickly, accurately and with great flexibility.

    fulcrum

    GeoXray (www.terragotech.com) is a web-based software application that allows users to search the internet and social media sites for content relating to a geographic area and filter the results by topic, time and source.  TerraGo, creators of the ubiquitous GeoPDF, demonstrated interoperation by allowing a user to access GeoXray directly from a GeoPDF.  TerraGo’s Michael Bufkin indicated that the next step in this interoperability will be to cache the GeoXray discovered content within the GeoPDF when it is created, thus enabling access to the content directly from the TerraGo Toolbar. Users would then be able to discover GeoXray content even if not connected to the internet while using the same tools that they use for map display and collaboration.

    GeoCOP (www.hmstech.com) is a web-based voice, video, and data overlay service which connects people, applications, and knowledge.  “GEOCOP” stands for “Geospatial Common Operating Picture” and is a Sensitive but Unclassified web-based voice, video, and data overlay technology that instantly connects people, Geospatial Applications, and knowledge.  It was designed by former special agents and law enforcement experts, to provide law enforcement and intelligence agencies with an improved situational awareness tool.  I had a chance to test GeoCOP during a recent exercise where we combined real time earthquake data from USGS with tweets from the affected area verifying the extent of the damage.  I was very impressed with its functionality, broad access to extensive data sets, user friendliness and speed.  GEOCOP users can gather data from multiple online sources, then overlay the results alongside geospatial applications, web video players, live messaging, and other programs.

    geocop

    If your GIS life focuses on points, lines and polygons please look over the cubical wall. There is a silent revolution occurring in the geospatial community that may dwarf traditional GIS.  This has been the most rapidly expanding part of GEOINT as more and more users do a deep dive into all aspects of human geography.  Some of the growing capabilities are quite startling, almost “Big Brother” / “Minority Report” like science fiction.  If I’m still around, it will be interesting to attend GEOINT 2030.  Perhaps we’ll have tools that can use “Big Data” and analysis to anticipate and block damaging events.

    Kalinski photo


    Art Kalinski, GISP

    A career Naval Officer, Art established the Navy’s first GIS.  Completing a post graduate degree in GIS at the University of North Carolina, he joined the Atlanta Regional Commission (ARC) as the GIS Manager from 1993 to 2007.  He pioneered the use of oblique imagery for public safety and Homeland Security.  Art retired early from ARC to join Pictometry International to direct military projects using oblique imagery which led to him joining Soft Power Solutions, LLC.  He also writes a monthly column for GeoSpatial Solutions aimed at federal GIS users.


  • $3.7 Billion Reasons Why GIS Technology is The Future

    Editor’s note: Although GIS adoption is certainly on the rise, it hasn’t reached critical mass for widespread adoption so I think 2012 is too early to be seen as the Year of GIS. When it does, it will be fueled by widespread location apps in smartphones and adoption of mainstream office apps like Maps for Office.


    When technology historians look back on 2012, they might look at this as the GIS year says Dr. Stephen McElroy, GIS program chair at American Sentinel University.

    “2012 is the year of GIS,” says Dr. Stephen McElroy, GIS program chair at American Sentinel University. “The desire to know where everything is located fuels the current trend in location-based services. As GIS is more accessible and consumable on the Web through a variety of mobile devices, the average person is becoming increasingly impacted by the power of GIS. Soon it will become a pervasive technology that is consumed by a wider audience than ever before.”

    The proof is in a new report from Pike Research. Findings indicate that spending on GIS services, software and tools will increase steadily over the next five years, reaching $3.7 billion in 2017.

    This industry momentum toward GIS is what led to K-12 schools in North Carolina to sign a statewide license for unlimited classroom use of Esri’s ArcGIS software.

    According to Dr. McElroy, K-12 educators are increasingly aware that geospatial competencies must now be included among the core proficiencies of reading, writing and arithmetic. He points out that some schools are undertaking initiatives to incorporate geospatial competencies across the curriculum by adding geospatial exercises and experiences into the standard curriculum. The concept of GIS across the curriculum is a trend that is just now beginning to blossom and illustrates the long-term presence of geospatial thinking at the national, state and local levels.

    To demonstrate just how important GIS is to the U.S. government, Esri, the world’s leading provider of GIS software recently released a new book, ‘Mapping the Nation: Government and Technology Making a Difference.’ It includes more than 100 full-color maps produced by 40 government agencies, showing how GIS technology can be used to evaluate and respond to social, economic and environmental concerns at local, regional, national and global levels.

    “Geography is a common denominator in everything the federal government supports,” says Christopher Thomas, director, government markets – federal, state, local at Esri. “The maps in this book attest to the limitless power of geography and GIS technology. They show how government agencies rely on GIS analysis to facilitate initiatives, improve transparency and deliver strong business models.”

    Add this momentum to the fact that new products are released nearly every week, including CHC’s new LT30 series GPS/GIS handheld collector. The LT30 GPS/GIS is a multi-functional solution that includes built-in GPRS phone and data transmission, Bluetooth and Wi-Fi connectivity, a 3.2 megapixel camera with autofocus and a versatile RS232 interface to connect to legacy devices.

    Smart Grids Lead the Charge

    Leading the charge for this GIS enthusiasm is the smart grid.

    According to the Pike report, spatial data underlies everything an electric utility does. An intelligent power grid requires deep situational awareness of power generation, transmission, distribution and customer assets in order to optimize performance and to meet reliability commitments.

    Land-based and street-level data, ownership/real estate, vegetation, network topology, GPS location data, census data, and many other forms of geospatial information are critical to the successful performance of the smart grid.

    GIS is a foundational technology linking every activity of an electric utility – including design and construction, asset management, workforce management, outage management, and increasingly, real-time grid operations.

    “The smart grid has energized electric utilities to think creatively about how to improve the delivery of electrical power and the business and workflow processes that enable it,” says Pike Research vice president Bob Gohn. “As the deployment of intelligent field equipment, particularly advanced metering infrastructure, has surged, the applications leveraging this infrastructure are increasingly dependent on GIS-based data for critical real-time performance.”

    Public and private utility providers will need a comprehensive GIS that they can utilize to make key decisions about system-critical issues such as customer database management, streamlined meter reading and blending of renewable (solar, wind, hydro and geothermal) and non-renewable energy resources from coal and nuclear facilities.

    “These industries are looking for people who understand GIS technology, making it an excellent time to make yourself more marketable and consider an online bachelor’s or master’s degree in GIS technology,” says Dr. McElroy.

    The market for GIS professionals at all skill levels has never been better.

    The Bureau of Labor Statistics indicates that the job outlook (2010-2020) for geographers is growing by 35 percent (much faster than average). For Cartographers and photogrammetrists, the outlook is 22 percent growth (faster than average). For surveying and mapping technicians, the outlook is 16 percent and all of these occupations are expected to grow by 14 percent.

  • Features Added to Free EGNOS Software Development Kit

    Now GNSS smartphone application developers can benefit from a range of new features from Version 2 the European Commission’s free EGNOS Software Development Kit (SDK), reports the European GNSS Agency (GSA). The SDK helps developers to easily implement EGNOS corrections coming from the signal in space or the Internet, and make use of EGNOS advantages when using location-enabled applications.

    The EGNOS SDK is a European Commission project that aims to foster the use of EGNOS in location-based services (LBS) applications for smartphones. It has been designed to allow application developers to take advantage of the benefits of EGNOS, and to use these in software they develop for mobile devices. The EGNOS SDK is the only toolkit — in an open-source library — that implements integrity and EGNOS corrections for a more accurate position than GPS alone can provide.
     
    New EGNOS SDK features and improvements include:

    • Tracking feature: Allows application developers to choose different options to display their GPS and/or EGNOS and/or R&D position over the smartphone’s map.
    • Skyplot view: Enables to display the position of the overhead EGNOS and GPS satellites with a time span of +12h or -12h. This feature shows information about the number of EGNOS satellites available, the number of GPS satellites used for the computation of the R&D, EGNOS and GPS positions, and the number of satellites not used.
    • Advanced Skyplot view: Provides an augmented reality showing a live video streaming of the sky and can identify EGNOS and GPS satellites in real time.
    • R&D Position Type menu: Displays six features proposing innovative ways of computing a position by deviating from the EGNOS standard EGNOS DO-229D, to get  even greater accuracy:
    1. The Increased satellite constellation improving the satellite constellation used by adding GPS satellites not monitored by EGNOS.
    2.  The Best satellite constellation selecting the most suitable GPS satellites geometry for the computation of the position.
    3.  The 2D Positioning displaying the position even if only 3 GPS satellites are in view (4 satellites are normally the minimum needed to compute a position). This is important in urban situations, where surrounding buildings can obstruct a clear view of the sky, making it difficult to track four satellites or more.
    4. The Fast correction with no RRC improving the positioning by eliminating the jumps that the Range Rate Correction (RRC) might cause in the fast corrections applied to the pseudorange (PR) measurements.
    5. The Best Weight Matrix rating the satellites involved in the position computation on the basis of the most beneficial weight matrix.
    6. The SBAS ranging function enabling SBAS geostationary satellites to be used in the same way GPS satellites are used to compute a position

    As far as integrity is concerned, the user can define different levels of integrity to be displayed (Horizontal Protection Level (HPL)): aviation, maritime or 85 percent.
     
    Since its initial release in November 2011, the EGNOS SDK is providing a useful tool to application developers who need the additional accuracy provided by EGNOS accessible in smartphone applications, according to customers:

    “I am interested in the toolkit because I started a project that aims at developing an application based on smartphones” – GeoMatica

    “I found the toolkit interesting, especially SISNet, in Finland the EGNOS signal is low…the corrections I receive with SISNet are more reliable than those I could receive with the satellite” – VTT

    The EGNOS SDK v.2 can be downloaded for free on the EGNOS Portal.
     

  • Esri Acquires ArcPad Developer Maptel

    Esri announced that it has acquired Maptel, the developer of Esri-branded ArcPad and a mobile application development company based in Melbourne, Australia. The addition of Maptel, who has been the developer for Esri’s ArcPad software for several years, will strengthen Esri’s field data collection capabilities and its overall mobile platform.

    “We have worked side-by-side with Esri for many years,” said Elvin Slavik, lead developer and co-founder, Maptel. “We look forward to growing our relationship, and we are excited about delivering reliable geospatial solutions that empower mobile crews and their organizations.”

    “Maptel’s proven talent and experience in mobile application development will be a valuable asset to Esri,” said Euan Cameron, CTO of Apps and Runtime development, Esri. “Merging our teams will help us better serve ArcPad users and advance our entire range of mobile solutions.”

    According to the announcement, Maptel staff will supplement Esri’s global development team from their existing facilities in Melbourne, Australia. They will continue to develop and support ArcPad with a focus on enhancing integration with the ArcGIS system.

  • Mobile Device Operating System Wars: Android vs. iOS vs. Windows Mobile

    Following up on my” Mobile Devices Galore” column a couple of weeks ago, one predominant question I hear reverberating across all industries with geospatial apps on mobile devices is “what is the mobile device operating system of the future?”

    After years of relatively benign evolution, the mobile device market (smart phone, tablet, handheld) is changing really quickly, and it’s really making geospatial users think hard about which device and operating system to deploy.

    I think it’s safe to say that if there were enough apps available for the Android platform, Android would clearly be the geospatial operating system of choice. There are a myriad of smart phones and cheap tablet computers running Android that consumers are eating up and geospatial users are salivating over. Unlike Apple with their iOS, Google will license Android to almost anyone so hardware manufacturers like Samsung are flocking to Android. One would think this might be déjà vu for Apple a la Microsoft Windows.

    However, the fact is that there’s not much in the way of geospatial apps for Android, yet.

    Almost all geospatial apps in existence today are built for Windows Mobile, but most people I’ve spoken to aren’t convinced that Microsoft is committed to Windows Mobile. The follow on to Windows Mobile 6.5 called Windows Embedded Handheld. You might think that Windows Phone 7 is the follow-on to Windows Mobile 6.5, but the problem is that apps have to be re-written for Windows Phone 7 while the software development environment for Windows Embedded Handheld is the same/similar as/to Windows Mobile 6.5. Following is a video explaining Microsoft’s mobile device strategy for Windows:

    Almost all geospatial apps in existence today are built for Windows Mobile, but most people I’ve spoken to aren’t convinced that Microsoft is committed to Windows Mobile. The follow on to Windows Mobile 6.5 called Windows Embedded Handheld. You might think that Windows Phone 7 is the follow-on to Windows Mobile 6.5, but the problem is that apps have to be re-written for Windows Phone 7 while the software development environment for Windows Embedded Handheld is the same/similar as/to Windows Mobile 6.5. Following is a video explaining Microsoft’s mobile device strategy for Windows:

    Dual Boot?

    We have a problem. We need mobile devices to support Windows Mobile, for now, due to the wide number of apps available for that operating system. However, we aren’t sure of Microsoft’s committment to Windows Mobile in the future and it seems Android has a tremendous amount of momentum, How many IT people have you seen with dual boot Windows/Linux? It makes me think about a dual boot mobile device…Windows Mobile and Android. But, that could get ugly pretty quickly since average consumer is not going to be interested in this. Without the benefit of consumer acceptance of what we use for a mobile device, we are back to where we started, stuck with a few niche suppliers that produce high-priced mobile devices specifically for the geospatial industries.

    I can dream about dual boot, but I doubt it will happen.

    Which Mobile Device Operating systems will survive and flourish?

    Earlier this month, technology research firm Gartner, Inc. issued a report detailing the results of their research on tablet computer operating systems. While it’s not completely indicative of smart phone and handheld operating systems, I think it’s a very good indicator of where things are headed.

    Following is a table summarizing the results of their research by operating system.

    Worldwide Sales of Media Tablets to End Users by OS (Thousands of Units):
    OS 2011 2012 2013 2016
    iOS 39,998 72,988 99,553 169,652
    Android 17,292 37,878 61,684 137,657
    Microsoft 0 4,863 14,547 43,648
    QNX (RIM) 807 2,643 6,036 17,836
    Other OS 1,919 510 637 464
    Total 60,017 118,883 182,457 369,258

    If you’d like to read a detailed article about their results and report, click here.

    Is Apple’s iOS really going to continue to dominate?

    I wish I would have bought Apple stock a few years ago. Apple is a serious cash machine, earning more profit than even ExxonMobile, thus becoming the most profitable company in the world.

    However, with their closed system, it smacks of the Mac vs. Windows battle of 20+ years ago of which Apple clearly lost. Can a closed operating system like iOS maintain its dominance? I doubt it, I really doubt it. Apple has been on a great run, but even from the table above, one can clearly see that Android is projected to grow faster.

    While I’m reasonably sure iOS isn’t going to be a long-term dominator, I’m not so sure about Android vs. Windows Embedded. As we saw with Microsoft’s Internet Explorer going from zero to hero in a short period of time, Microsoft has the ability to focus a tremendous amount of resources to tackle a market if they choose. They could do it with Windows Embedded, if they choose.

    Thanks, and see you next week.

    Follow me on Twitter at http://twitter.com/GPSGIS_Eric