Oregon Department of Transportation workers use DT Research’s GNSS rugged tablets. (Photo: DT Research).
The Oregon Department of Transportation (ODOT) has expanded its use of DT Research GNSS rugged tablets to all 15 of its construction management offices across the state, and also use the tablets for biology, geology, roadway and wetland projects.
DT Research worked closely with ODOT to design purpose-built rugged tablets that empower state workers to easily collect and transmit geospatial measurements in the field using GNSS real-time kinematic (RTK) technologies.
“DT Research’s GNSS rugged tablets have enabled us to bring high-accuracy geospatial measurements to workers across the Department of Transportation, which has literally changed the way we work,” said Chris Pucci, construction automation surveyor at ODOT. “The tablets have enabled us to save time, reduce costs and improve the accuracy of projects through ‘digital-as constructed’ measurements and real time data capture.”
The tablets have a dual-frequency GNSS module built in, which provides stand-alone sub-meter accuracy to centimeter-level accuracy with RTK from GPS, GLONASS and Galileo satellites.
The tablets are compatible with existing survey and GIS software for mapping applications and provide an advanced workflow for data capture, accurate positioning and data transmitting.
“We now have essentially created one-person survey crews because the DT Research tablets are so much easier to use than a tape measure and paper to accurately calculate and record measurements during complex construction projects,” Pucci said. “Using the tablets saves us an average of $2,000 for every survey-grade measurement job that does not require a full survey crew.”
“In addition, the tablets have provided us with a contract verification system by having highly accurate digital-as-constructed measurements that are delivered immediately and stored forever, which saves the state time and money by avoiding independent re-measurement checks due to billing discrepancies at the end of a project,” added Pucci.
The DT Research GNSS tablets can store up to 1 Terabyte of data for field data collecting. Users can avoid down time with a high-capacity hot-swappable battery pack, which delivers 60 or 90 watts for up to 15 hours of continuous mobile communications. The units include Long Range Class 1 Bluetooth, which powers wireless connectivity up to 1,000 feet and 4G mobile broadband.
“The simplicity of how the DT Research tablets work is amazing,” Pucci said. “Unlike complex professional survey equipment, the DT Research tablets are a Windows-based mobile device with a user interface that is familiar to workers. In just two hours, I can easily train state workers with diverse skill sets to measure quantity, linear features and volumes for a variety of projects — and they are ready to go.”
The tablets run on Microsoft Windows 7 Professional or Windows 10 IoT Enterprise and are high performance devices with an Intel 6th or 8th Generation Core i5 or i7 processor. The rugged tablet is designed for outdoor use with a brilliant LED-backlight, 800 nits sunlight-readable screen and capacitive touch.
“We have found the DT Research tablets to be incredibility easy to manage and highly durable — we just turn them on and they work,” said Pucci. “In the three years that we have used the tablets, we have had very few technical support questions and they hold up well in different weather conditions. There isn’t a comparable product on the market at the price point.”
The DT Research tablets are military-grade durable devices, yet lightweight, offering the versatility to be used in field-to-office settings. For use in harsh environments, the tablet is fully ruggedized to meet the highest durability standards with an IP65 rating, MIL-STD-810G for vibration and shock resistance and MIL-STD-461F for EMI and EMC tolerance.
For use in a variety of environments, the tablets are complemented by many accessories including: external antennas, pole mount cradles, detachable keyboards, battery charging kits and digital pens.
The mobile mapping market size is expected to be worth more than $40 billion by 2024, according to a new research report by Global Market Insights.
The mobile mapping market is propelled by the increasing adoption of mobile devices such as smartphones and tablets across the globe. Smartphone users are extensively using mapping applications on their devices for navigation and driving assistance, the report said.
Furthermore, they are also leveraging on the GIS and GPS applications to access geo-referenced data for searching nearby restaurants, cinema halls and other landmarks. This is encouraging the technology companies to commence mapping across the globe to acquire accurate GIS data and provide an enhanced customer experience.
High initial investment is a major factor limiting the growth of the mobile mapping market. Currently, the market comprises a few major players with a long-standing expertise in location-based technologies. High initial investments in developing mobile mapping systems and assembling major components have restricted the entry of new players in the market.
According to the report, the software market is anticipated to grow at a CAGR of 15 percent over the projected timespan. The growing demand for geo-referenced data acquisition and data analysis software among the organizations is driving the mobile mapping market growth. The software assists organizations in simplifying the data extraction process by combining the vital details. It retrieves geographic and spatial data captured by the positioning devices to develop maps and other graphic displays. This data is also used by enterprises to build effective decision support systems, which will drive the market demand.
The report includes key industry insights in 250 pages with 341 market data tables and 38 figures and charts from the report, “Mobile Mapping Market Size, By Component (Hardware [Imaging Device, Laser Ranging Device & Scanning Device, Positioning Device], Software [Mapping Data Extraction, Data Processing], Service [Consulting, Integration & Maintenance, Managed Service]), By Application (Road & Railway Survey, GIS Data Collection, Vehicle Control & Guidance, Asset Management), By End-User (Agriculture, BFSI, Government & Public Sector, Real Estate, Retail, Mining, Telecommunication, Transport & Logistics), Industry Analysis Report, Regional Outlook (U.S., Canada, the United Kingdom, Germany, France, Italy, Spain, Australia & NZ, China, India, Japan, South Korea, Brazil, Mexico, Argentina, GCC, Israel, South Africa), Growth Potential, Competitive Market Share & Forecast, 2018 – 2024.”
The mobile mapping technology is used for conducting road and rail surveys, collecting GIS data, and developing vehicle control and guidance systems and asset management systems. The road and rail survey market is expected to register a growth rate of over 17 percent during the forecast period. It is used to analyze the road and rail infrastructure and plan the engineering operations with minimum disruptions. The surveying authorities across the globe are using mobile mapping technology to create maps for the transportation department for road assessment purposes.
The agriculture sector is estimated to grow at a CAGR of 22 percent during the forecast timeline. The integration of the GPS and GNSS devices into the farming process to acquire geospatial data is the primary factor driving the mobile mapping market share. Furthermore, the ability of the mobile mapping technology to monitor the crop yield and land variability also augments the demand for the technology among the farmers.
The European region accounted for over 25 percent global mobile mapping market in 2017. The increasing investments by the government agencies have accelerated the adoption of mobile mapping technology in the region. For instance, in 2017, the U.K. government established the Geospatial Data Commission to frame a strategy for using the public sector location data to support the country’s growth.
The Asia Pacific region will grow at a rapid pace over the forecast timespan. The rapid urbanization of the region and the growing number of infrastructural projects have fostered the growth of the mobile mapping market in the region. Moreover, the widespread adoption of smartphones has also driven the market size.
Prominent players operating in the mobile mapping market are Phoenix LiDAR, Sharp Corporation, Teledyne Optech, TomTom International, Topcon Positioning Systems, MapJack, Mapquest, Navteq, NCTech, Microsoft, Mitsubishi, NovAtel, Phaseone industrial, Hexagon, EveryScape, Foursquare Labs and XIMEA.
The major companies in the market are collaborating with other expert companies in the market to develop new product offerings and conduct strategic acquisitions to gain a competitive advantage over its competitors.
For instance, in 2017, Garmin acquired Navionics, a provider of electronic navigational charts to the marine industry. This acquisition is aimed at combining the data from Navionics charts and Garmin’s blue charts to develop improved navigational services to its customers. Similarly, in 2017, Hexagon entered into an OEM partnership with Smart Guided Systems to develop new precision technologies for commercial applications.
The global mobile mapping market research report includes an in-depth coverage of the industry with estimates and forecast revenue in USD respectively from 2013 to 2024, for the following segments.
Mobile Mapping Market, By Component
Hardware
Imaging device
Laser ranging and scanner device
Positioning device
Software
Mapping data extraction
Data processing
Service
Consulting
Integration & maintenance
Managed
Mobile Mapping Market, By Application
Road & railway survey
GIS data collection
Vehicle control & guidance
Asset management
Mobile Mapping Market, By End-User
Agriculture
BFSI
Government & public sector
Real estate & infrastructure
Retail
Mining
Telecommunication
Regions and Countries
North America
U.S.
Canada
Europe
UK
Germany
France
Spain
Italy
Asia Pacific
ANZ
China
India
Japan
South Korea
Latin America
Brazil
Mexico
Argentina
MEA
GCC
South Africa
Israel
Boundless Anywhere is a new mobile application for enterprises needing to collect and distribute location information from handheld devices and tablets, available for iOS or Android.
With Boundless Anywhere, organizations can collect data in the field and store it instantly in a database. Collected data can then be visualized on clients such as desktop GIS, web and mobile. With real-time access to location-based data, the entire organization can now accomplish work faster and more efficiently.
“Mobility is at the heart of today’s technology, and the rapid proliferation of smartphones and tablets in recent years has had a profound impact on the GIS industry,” said Anthony Calamito, chief geospatial officer at Boundless. “The ability to access all kinds of data — including location data — from the palm of our hands at any given time or place has become essential. With this extended offering, Boundless offers mobile capabilities that empower users to do more while on the move.”
With Boundless Anywhere, users of the Boundless enterprise GIS platform can collect geospatial data wherever they are and use maps to engage a community, validate data, make observations, report, respond and communicate in real-time. The new solution simplifies field collection workflows and improves the accuracy of geospatial data, saving time and money.
Users are able to capture new data and edit or delete existing data with or without an internet connection, and can sync instantly once they are back online. Updates and edits are instantly available on Boundless Exchange, where the entire team can analyze and share findings with the rest of the organization.
Key advantages:
Collaborate in real-time to make faster decisions. View mobile edits instantly on the web, making it easy to pull data into your GIS for mapping, analysis, and reporting.
Ground-truth data to improve accuracy. Take expensive transcription errors out of the equation. Mobile workflows modernize field collection away from clipboards and cameras, ensuring data collected on-location is current and accurate.
Empower responders to collect, even when offline. A good network connection is never guaranteed in the field – the Boundless Anywhere solution lets you edit GIS data in even the most remote areas and sync it when you’re back online.
GIS apps don’t have to be cumbersome. Collect GIS data and photos in a straightforward interface that’s easy to use and can turn your entire team into data collectors.
Boundless solutions are built on open GIS technology and APIs that generate actionable location intelligence across third-party apps, content services and plugins for enterprise applications.
Mobile-scanning company Viametris has launched the bMS3D backpack mobile scanning system, which features an embedded 360° camera.
Narrow streets and pedestrian zones are considered hurdles when it comes to mobile scanning. The new bMS3D-360 makes these tasks achievable. It is now available on the market and it comes with post-processing software. It will be presented at SPAR 3D 2018 in June.
“Users of mobile scanning systems know how difficult it is to cover an entire city with this kind of system and how complex the completeness is,” said Jerome Ninot, founder of Viametris.
Improved Data Exploitation with Panoramic Images. Viametris has found a solution to scanning challenges by developing the bMS3D-360: the mobile scanning backpack system includes a panoramic camera. This sensor allows the user to maintain continuity of results with mobile mapping systems on cars that already include this kind of camera. Operation and visualization with such 360° images are now easy to use.
Since Google provided massive street views, people are used to navigating through panoramic images. Navigating through bMS3D-360 images becomes easy and intuitive compared to navigating with 3D point clouds, the company said.
Ten years of experience have allowed Viametris to produce its GNSS mono-antenna system based on GNSS-free scanning (indoor or denied-GNSS area): the system trajectory is calculated by lidar-SLAM. It produces colorized point clouds with absolute accuracy of less than 5 centimeters under appropriate satellite reception conditions.
Compared to many mobile scanners, this backpack does not rely on GNSS to work. If the GNSS reception is not good enough, control points can be added for absolute localization. The backpack can be used to scan all sorts of indoor areas such as airports, industrial buildings or shopping malls.
The bMS3D-360 is lightweight. It protects the retractable camera an all other components since it is self-contained.
Post process in VIAMETRIS PPiMMS Software. PPiMMS post-processing software manages the dataset coming from the system. Its mission is to calculate, control and improve the trajectories by calling lidar-SLAM functions, and reducing drifts, thanks to loop closure algorithms.
The user can manually add GCPs to constrain the result when GNSS reception is poor. But, in most cases, the user will be able to include post-processed global positions (PPK) using GNSS post-processing software. Additionally, the panoramic camera can be used to colorize the point cloud using PPiMMS.
The new software release of Survey123 for the ArcGIS mobile application now has Spike, a laser measurement solution by ikeGPS.
The paired technology dramatically accelerates field data capture and asset inspection activities.
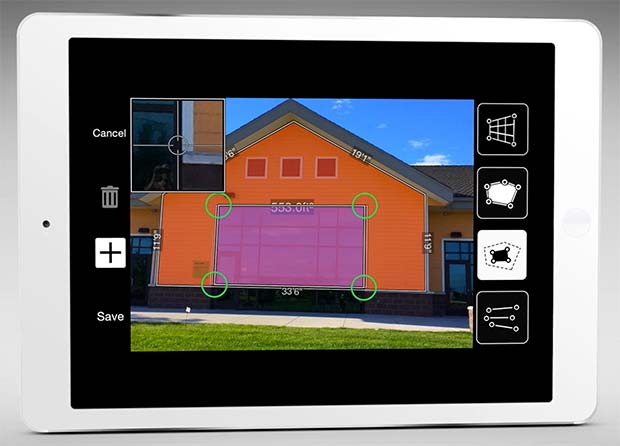
Spike allows users to measure hard-to-reach objects from a distance by taking a photo with their smartphone or tablet. Users can then capture real-time measurements from that image, including areas, elevations, distances between two points, and GPS/GNSS location.
Use of the Survey123 integration with Spike will be of interest to organizations that use mobile workflows for asset and facilities management, field asset inventories and inspections, damage assessments, and tactical operations including disaster response.
Using Spike with Survey123 relieves fieldworkers of the burden of carrying paper maps to find the object of interest and lugging multiple pieces of specialized, expensive measuring equipment. Instead, with a single mobile device, fieldworkers can locate the correct asset, record measurement data, and report accurate data directly back to the office.
“The new Spike integration with Survey123 is a game changer for many field data collection and inspection workflows where the dimension of physical objects needs to be captured. Spike and Survey123 provide quick return on investment,” said Ismael Chivite, Esri product management lead. “The simplicity of the solution enables it to be quickly deployed and with little training. Customers are very enthused about this low-cost solution that will streamline many of their critical workflows.”
The ability to capture accurate measurements in the field is particularly useful when working in areas that don’t lend themselves to hands-on or close-up measurement. Spike’s laser can be used in ranges from 6 to 650 feet, with the option to select units of measurement in inches, feet, meters or centimeters. With it, a single fieldworker is able to more quickly and safely accomplish what may otherwise have taken multiple field staff and costly equipment.
The Spike laser device mounts to smartphones and tablets and connects via Bluetooth with the mobile device’s camera.
Survey123 with Spike runs on Apple iOS and Google Android smartphones and tablets.
For those who want high accuracy, but don’t need it full time, high-productivity dedicated professional solutions may not be cost-justified. In these cases, a “positioning as a service” subscription could offer a viable use model.
Achieving precision positioning with just a standard mobile device, a correction stream using the mobile device’s data connection and a high-accuracy positioning application produces a very low barrier to achieving high accuracy.
ByStuart Riley, Herbert Landau, Victor Gomez, Nataliya Mishukova, Will Lentz and Adam Clare, Trimble Inc.
We expect that for professional applications that need precision positions, a dedicated system that employs a custom GNSS chipset and purpose-built applications will continue to be the right solution. However, it becomes clear that the ubiquity of consumer mobile devices, with increasing computing power, ruggedness and an expanding feature set, presents fertile ground for new development of improved positioning systems that don’t have strict professional requirements.
A range of new use models and applications will be enabled by consumer mobile phones with technology that improves positioning performance. The goal of the work presented here is to assess what level of performance can be achieved by using proprietary PVT (position, velocity, time) engines utilizing GNSS measurements from the Android GNSS measurement application programming interface (API).
We first review GNSS measurement and positioning performance from a subset of the current Android phones/tablets currently on the market. Then we show the position performance achievable using precision engine with measurements from a dual-frequency GNSS chipset targeted for the cellular handset market. This class of device is expected to be integrated into consumer cellular devices on the market within the next 1 to 2 years.
Performance of Current Phones
We tested various devices including the Nexus 9 (which provides phase data) and various other Android devices that implement the new API. Most devices tested do not support phase data; of the few devices tested that do provide phase data, all except the Nexus 9 implement GNSS power duty cycling. This is a mode where the GNSS chipset is only active for a fraction of each second to reduce power consumption. This results in cycle slips each epoch, which makes carrier-phase processing for real-time kinematic (RTK) unusable.
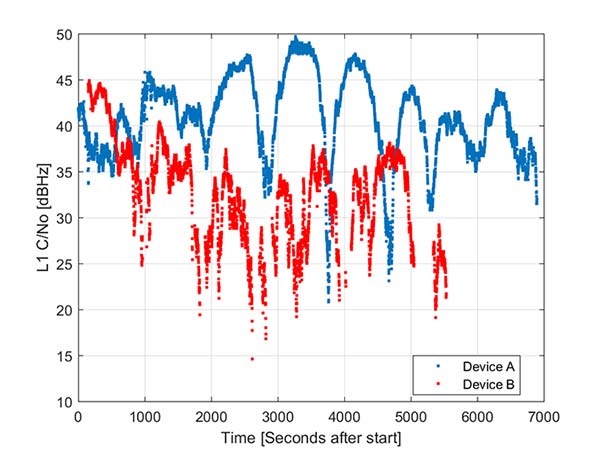
During the testing a wide range of performance across devices was observed. Figure 1 shows the C/NO for a high-elevation GPS satellite collected at the same time from two different Android models that implement the GNSS measurement API. The units were located in a clear environment less than a meter apart. Deep fades are present, most likely caused by deconstructive multipath.
Figure 1. Comparison of the C/NO from two different Android devices.
However, the devices show significantly different tracking performance: device B reports over 10 dB lower C/NO for much of the test and eventually stops reporting measurements. During our analysis, around six different Android devices have been tested; it isn’t clear whether the devices tested are typical over a broader population of device types.
Before attempting to position with observables from Android devices the measurement quality was analyzed. As only a subset of current devices that support the API provide phase information we wanted to evaluate both a phase-based RTK engine and a pseudorange/Doppler based code engine to determine what is possible from each class of device.
One of the devices tested was a Samsung S7 device. It provides pseudorange, Doppler and phase via the GNSS measurement API. However, the phone implements power duty cycling so after a short period of operation the duty cycling mode was enabled which resulted in a cycle slip on the phase every epoch.
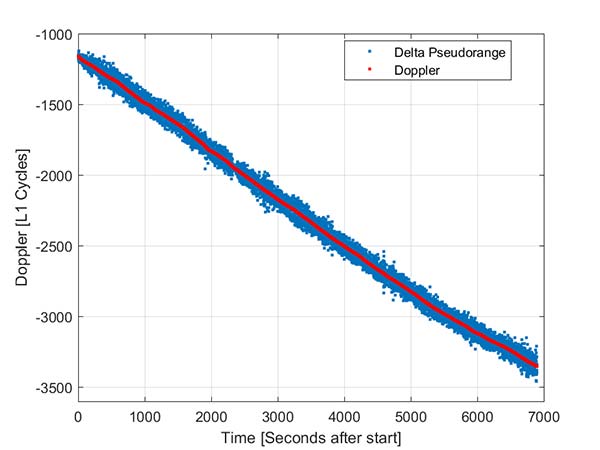
To derive an improved position from this class of device pseudorange and Doppler can be fed into a code-phase positioning engine. Fortunately, the Doppler provided by the device is of reasonable quality as can be seen from Figure 2.
Figure 2. Android GNSS observables: Doppler versus time-differenced pseudorange.
In this simple analysis measurements from a single high elevation satellite were analyzed. The Doppler is plotted along with the differenced pseudorange converted into L1 cycles. It can be seen that as expected the Doppler has much lower noise and so can be used in a pseudorange smoother.
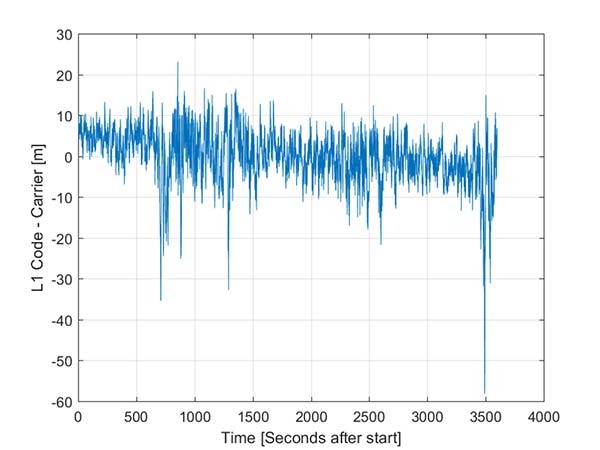
A simple way to view the pseudorange noise is to subtract the carrier phase from the pseudorange. If there are no cycle slips this should show ionospheric divergence with the noise dominated by the pseudorange noise. The absolute level is arbitrary as it includes integer carrier cycles. Figure 3 shows an example from an Android device.
The data was captured on a building roof in an open environment. There’s a slight downward trend due to the ionospheric divergence between code and carrier, but the metric is dominated by the pseudorange noise. For this example from a high elevation GPS satellite the standard deviation is 6.5 meters. For comparison, a precision receiver connected to a precision GNSS antenna providing unsmoothed pseudorange in this environment would have a standard deviation of a few decimeters.
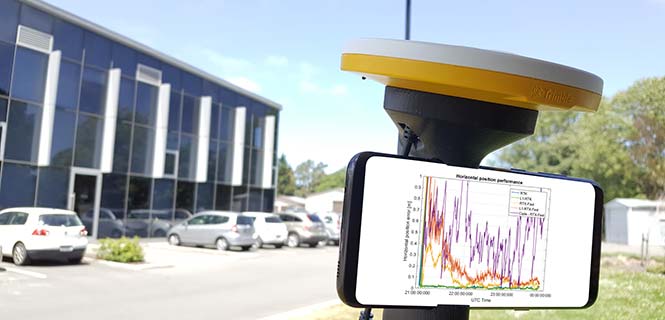
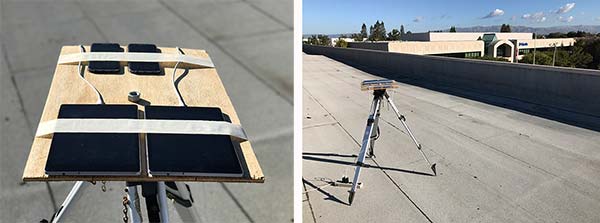
Another way to assess the measurement performance is to form double difference residuals. Data was logged from pairs of identical devices mounted with a common orientation. An RTK system was used to measure the same point on each device. The camera lens location above the screen was used as the reference point.
An accurate vector between the two references points was computed and used as truth in a double-difference residual analysis. Even though we do not know the precise location of the phase center of the antenna, because the difference was performed between two devices that are the same model and have the same orientation the error in the phase center location is common and will cancel. Various pairs of devices were tested by being mounted on a wooden board on a tripod at approximately waist height. The test configuration is shown in Figure 4.
Figure 4. Android device test configuration.
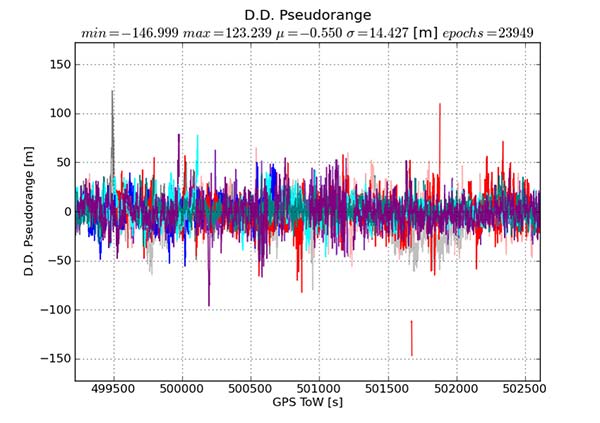
Figure 5 provides the double difference GPS L1 C/A pseudorange residuals between two Android devices. We see errors beyond 100 meters and a standard deviation across all data of 14.4 meters. A precision system (RTK or RTX/PPP) would use a standard survey quality base or network of bases and not an Android device for the correction data.
Figure 5. Short baseline double-difference pseudorange, Android devices.
Consequently in a typical operating mode where a precision data stream provides corrections, the contribution in a double difference from the pseudorange on the Android devices would be roughly half the Android-to-Android residual seen in this test or approximately 7.2 meters for this example.
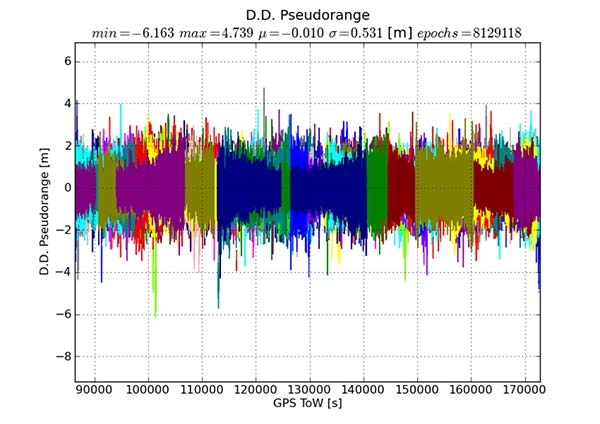
For comparison, the same metric was generated between two precision GNSS units connected to antennas on the same roof. While the data was not from the same time period, we observe very consistent performance over time.
Figure 6 shows the same pseudorange double difference across a short baseline over 24 hours. When comparing Figures 5 and 6, note the difference in the scale on the pseudorange residual axis. The standard deviation from a pair of precision devices is 53 centimeters (cm) or 27 times lower noise than an example pair of Android devices.
Figure 6. Short baseline double-difference pseudorange, precision devices.
All phones that provide GNSS measurements via the Android API publish the phase data in the accumulated delta range field. An accumulated delta range is not necessarily a full phase measurement; it can have an arbitrary starting phase.
For example, in a precision GNSS receiver, if the receiver locks to a satellite and some time later locks a second channel to the same satellite, the phase measurement from the two channels may have a different integer cycle component, but the subcycle component would be the same except for millimetric tracking noise.
If the two channels are providing accumulated delta range the initial phase offset may differ by up to one cycle. From the population of Android devices that publish phase that we have tested we have not observed any devices that deliver true full phase.
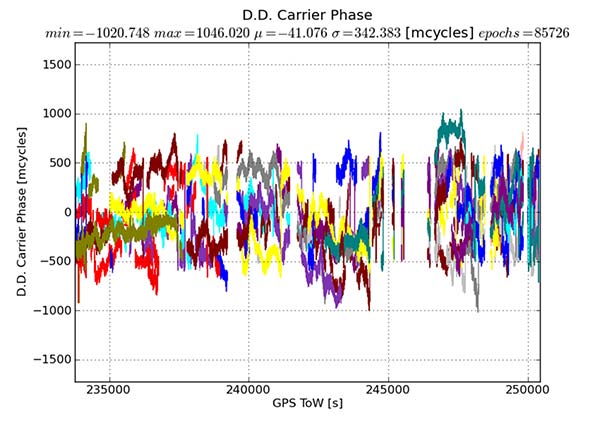
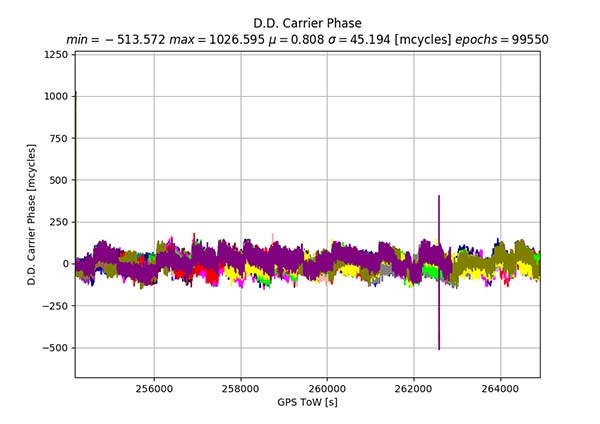
They all deliver an accumulated delta range with an arbitrary phase offset. This limits a phase engine to float processing and ambiguity fixing is not possible. The Android phase data collected from the previously described experiment was processed to provide the double difference carrier residuals. This is shown in Figure 7.
Figure 7. Short baseline double-difference phase residuals, Android devices.
The y-axis is in millicycles (1,000 millicycles = 1 cycle or approximately 19 cm for L1 GPS). Jumps are seen as the reference satellite changes or when the measurements have cycle slips. In this case the standard deviation is 342 millicycles. A double difference residual on a precision receiver in a similar environment with a high-quality antenna on a short baseline is an order of magnitude lower than this.
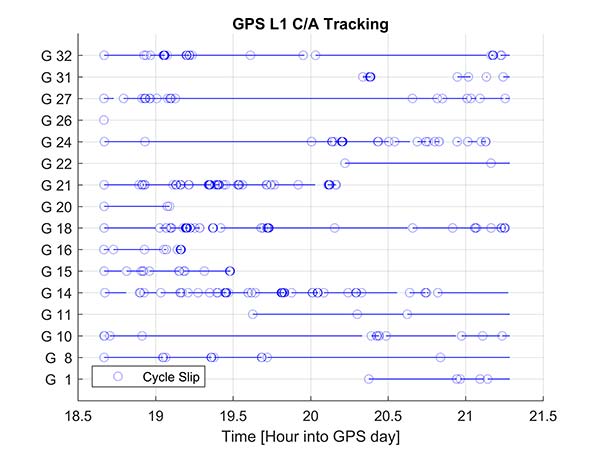
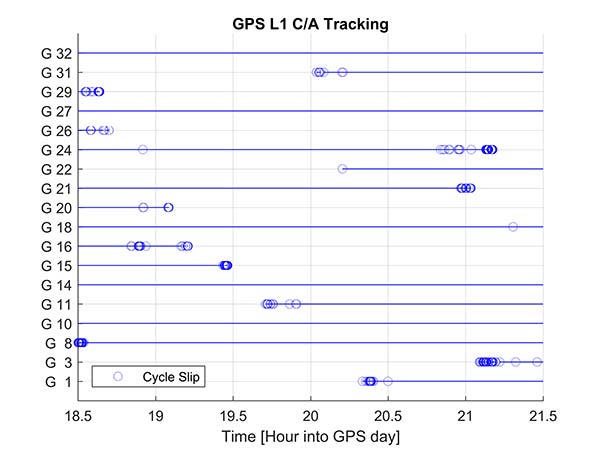
Another useful metric to review are the number of reported cycle slips. Figures 8 and 9 show a comparison of the cycle slips reported on GPS L1 C/A from an Android device compared to data logged on a precision receiver over the same time span. The receiver tends to only cycle slip at low elevation; the device had a zero-degree mask. The Android GNSS device cycle slips at higher elevations, probably a result of deep multipath fades due to the poorer antenna.
In an ION GNSS+ 2017 paper, we showed the achievable position performance using an RTK engine that had been previously customized to operate with measurements from consumer GNSS chipsets. It operated in a float mode due to the sub-cycle issue found in phase data from Android devices.
We also demonstrated the performance from a precision code-based PVT engine that had changes to the a priori measurement error estimate, a modified pseudorange/Doppler Hatch filter and used SBAS data to correct the position. As very few current Android devices deliver phase information the two engines were used to analyze what is possible today with the pseudorange and may be available in the future as phase is more universally available.
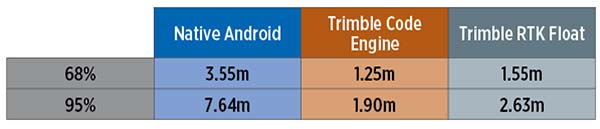
Data was processed from a Nexus 9 tablet, the only known Android device that has GNSS power duty cycling disabled. The unit was unmodified and so the Android tablet’s integrated GNSS antennas were used. The 2D performance is given in Table 1.
Table 1. 2D performance from Nexus 9 Android tablet.
Only GPS L1 and GLONASS L1 measurements were used and the RTK float solution delivered similar performance to the pseudorange solution. This is due to a combination of issues, very high pseudorange noise, and a significant number of cycle slips (see Figures 5 and 8). Only single frequency data was available, and while the engines used had been tuned for consumer data, they were not specifically designed for this class of data.
Next-Generation Phones
Within the next couple of years improved chipsets are expected to be available to consumers that will result in improvements in achievable positioning performance. In May 2017, Broadcom provided us with a development kit for its next generation L1/L5 multi-system BCM47755 GNSS chipset. This allowed us to assess what may be possible when improved GNSS chipsets are integrated in the next generation of cellular devices.
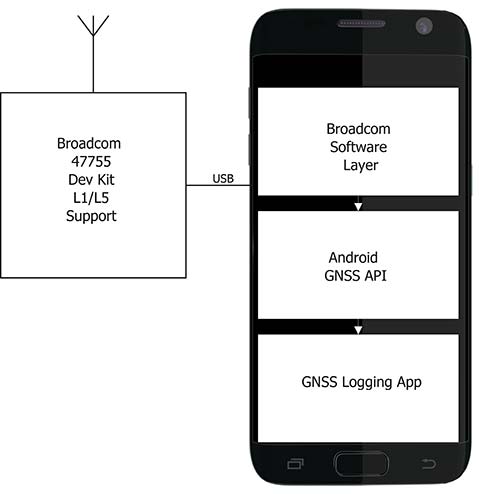
Figure 10. Broadcom BCM47755 development system.
The development environment included the GNSS chipset with an external antenna port so both a cell-phone equivalent antenna and a precision antenna could be compared. This allowed us to evaluate the impact of the antenna performance on the GNSS observables and positioning results. The Broadcom GNSS development system communicates via USB to a Samsung S7 phone and publishes data via the Android GNSS measurement API so the equivalent data flow of an integrated cellular device is maintained (see Figure 10).
In our ION paper, we showed the typical phase double-difference residuals observed from current Android devices. The Broadcom BCM47755 originally provided similar performance, although it also supports GPS L5 and Galileo E5A. In November 2017, Broadcom provided a firmware update that resolved the sub-cycle phase issues. With the updated Broadcom software, the double difference carrier residuals for GPS L1 on a zero baseline when differencing a precision receiver to a Broadcom BCM47755 are shown in Figure 11.
Figure 11. Precision GNSS to Broadcom BCM47755 zero baseline double difference carrier-phase residuals.
The standard deviation is 45 millicycles which is approximately 8.6 millimeters (mm). This is substantially better than earlier implementations of the Android GNSS interface (see Figure 7) and sufficient to perform RTK ambiguity resolution.
The rest of the results in this article were obtained with the improved firmware along with a new precision position engine. This engine was designed from inception to support GNSS measurements with differing quality and so can more optimally process the Android GNSS data. The effect of the improvements to the Broadcom firmware and the change in the processing engine can be seen if the results in our ION paper are compared to the data in this section.
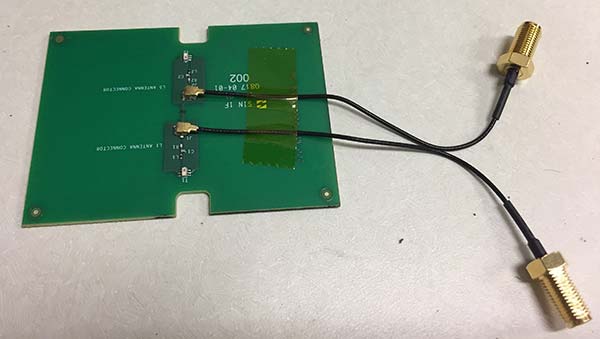
To attempt to model what may be possible with a phone based on a next-generation chipset, a cell-phone equivalent antenna provided by Broadcom was used in some of the tests with the development system, as shown in Figure 12. This device has separate feeds for L1 and L5.
Figure 12. Cellular equivalent antenna.
Datasets were collected with the multi-frequency GNSS BCM47755 device. The data was captured in the Android GNSS measurement API format and converted to proprietary format files for further processing. All data was collected in Sunnyvale, California.
Measurements from GPS L1/L5, Galileo L1/E5A, GLONASS L1 and BeiDou B1 were logged and analyzed. The Precise Positioning Engine (PPE) allows performing carrier-phase RTX and RTK and a pseudorange-based solution using the RTX corrections. Tests were performed by using a precision antenna and a cell-phone equivalent GNSS antenna.
With Precision GNSS Antenna
These datasets were collected on a zero baseline with a precision receiver to allow a direct comparison of results with a professional receiver. The first test was on Nov. 22, 2017, where the Broadcom GNSS chip and the receiver were connected to the same professional antenna.
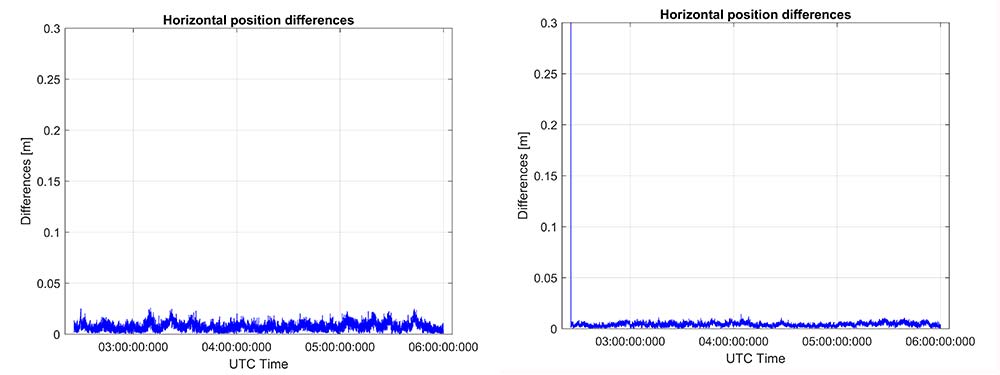
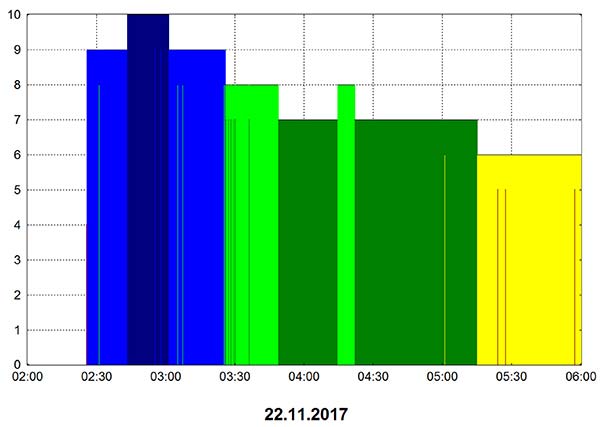
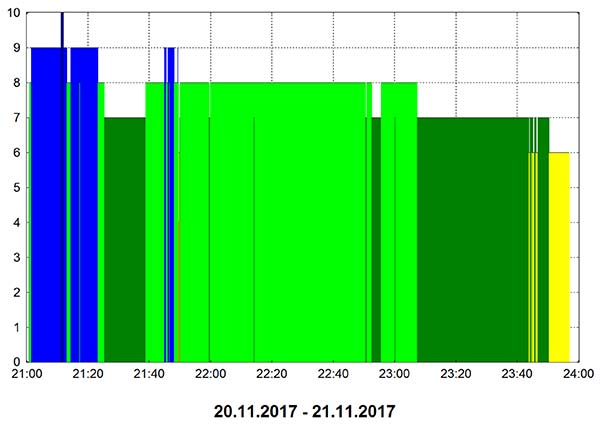
As seen in Figure 13, both GNSS receivers provide centimeter-level accuracies after some convergence time. With the current satellite constellations, only a third of the GPS satellites have L5 and only about half of the E5-capable Galileo constellation is in space. During this 3.5-hour test, the number of dual-frequency measurements processed by the engine that used the Broadcom chipset — data that does not support L2 — ranged between 6 and 10 satellites (Figure 14).
Figure 13. RTK performance for a 3.5-hour dataset sampled on Nov 22. Broadcom chip at left and precision chip at right. A short baseline was used — precision antenna.Figure 14. Number of GPS L1/L5 plus Galileo E1/E5A dual-frequency measurements used by the position solution based on the Broadcom chipset — precision antenna.
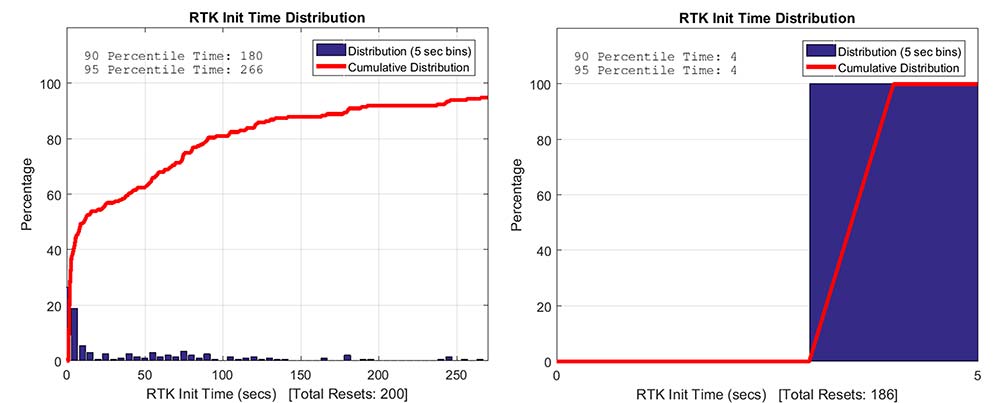
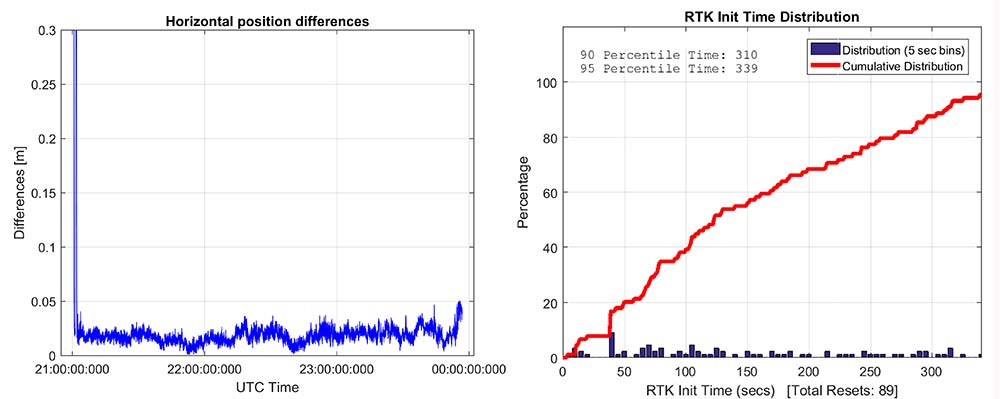
Convergence times were measured with post-processing tools by splitting the datasets into individual time spans. Figure 15 shows that the consumer GNSS chipset is able to get fixed ambiguity solutions but it takes considerably more time (266 seconds versus 4 seconds) for the 95% of initializations. However, the system is fixing ambiguities and provides centimeter level positioning.
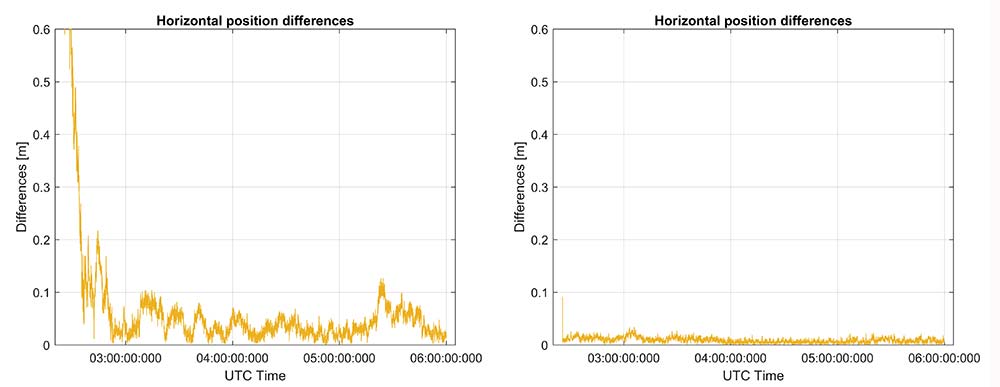
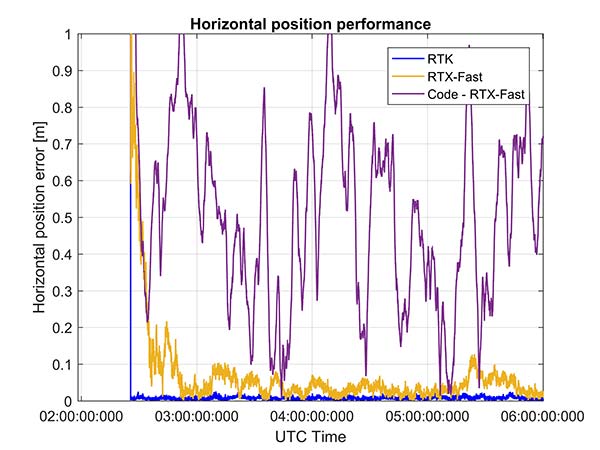
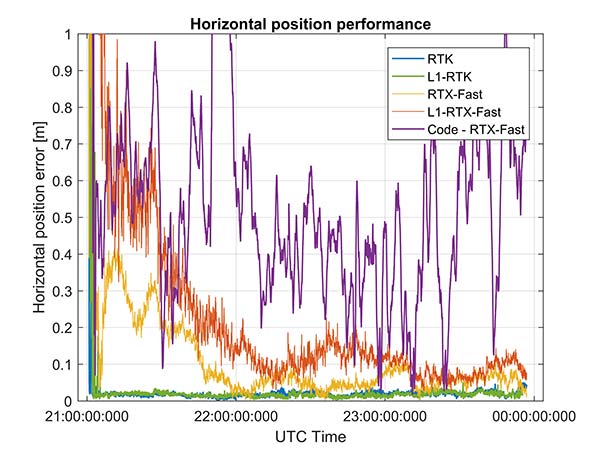
The same datasets were also processed with RTX-Fast in California. Thus the base station data was replaced by a global/regional correction stream received from an internet-based data source (Figure 16).
Figure 15. RTK initialization performance, dataset sampled on Nov 22. Broadcom chip at left and precision receiver at right — precision antenna.Figure 16. RTX performance for a 3.5 hour dataset sampled on Nov. 22 (Broadcom chip at left and Trimble chip at right) — precision antenna.
Horizontal accuracy for Broadcom reach 10 cm while the precision receiver reaches better than 3 cm. The degradation is in part due to the difference in quality of the carrier phase and the different number of dual frequency satellites processed. Precision devices provide measurements on E1/L1, L2 and L5/E5 providing at least dual frequency data from GPS, GLONASS, Galileo, BeiDou and QZSS.
The Broadcom chipset tested provided dual frequency GPS and Galileo along with single-frequency GLONASS and BeiDou; however, due to limited BeiDou constellation visible in California, data from this constellation was not used.
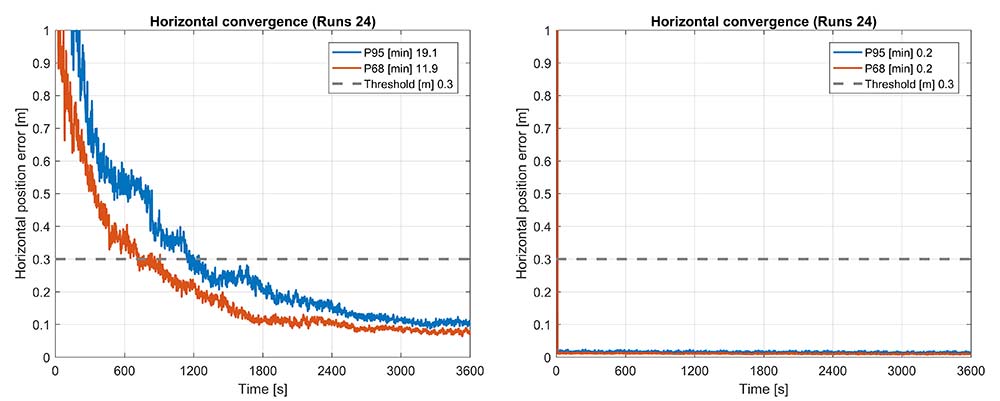
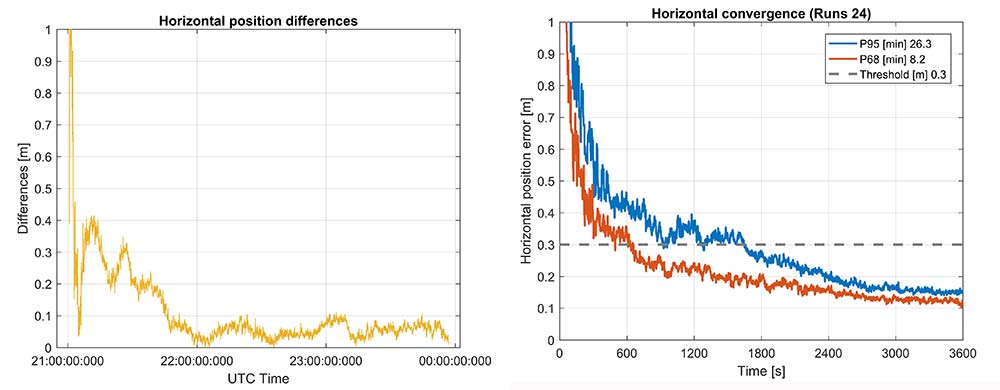
Convergence was also analyzed and is shown in Figure 17. From the data, we generated 24 convergence runs by taking one hour, progressively shifting the start time by 5 minutes and running the data with different start times through the PPE engine. This produced 24 runs, which were translated into 68% and 95% convergence statics shown.
Figure 17. RTX convergence performance for a 3.5-hour dataset sampled on Nov. 22. Broadcom chip at left and precision chip at right — precision antenna.Figure 18. Code RTX performance for 3.5-hour dataset sampled Nov. 22 and corresponding RTK and RTX phase solutions — precision antenna.
The RTX-Fast solution for Broadcom reaches 30 cm horizontal error in 68% of the cases in approximately 12 minutes. The RTX-Fast convergence using precision GNSS data is near instantaneous as can be seen in the right of Figures 16 and 17, reaching centimeter accuracy.
The code position solution using the RTX correction stream provides sub-meter positioning (Figure 18).
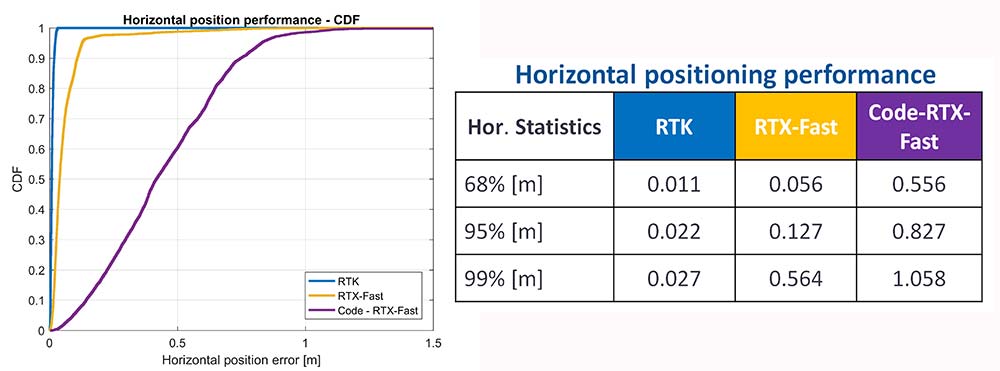
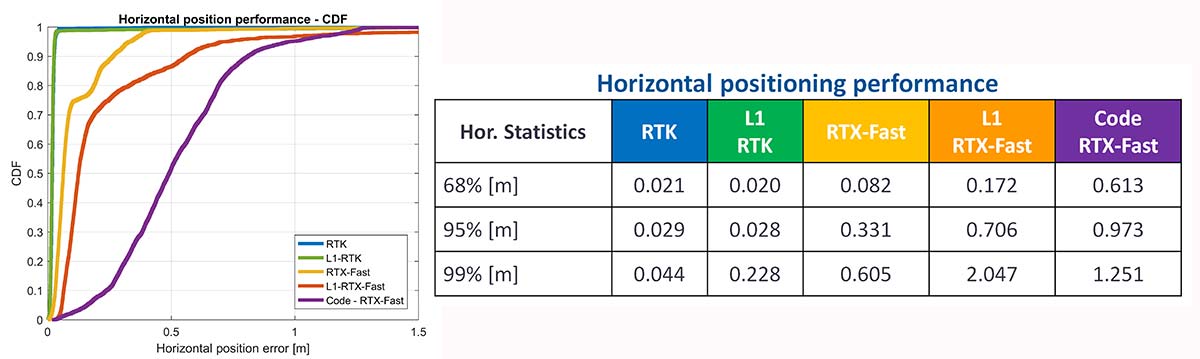
As a summary, the cumulative distribution function plots (Figure 19) show the performance differences for this static environment, on Nov. 22.
Figure 19. CDF plots for the different PPE position solutions — precision antenna.
Cell-Phone GNSS Antenna Results
Similar tests were performed using an external cell-phone GNSS antenna, which is close to the antenna used in a typical smartphone. RTK performance shows centimeter-level accuracies and reasonable convergence times, which are slightly worse than the results with the professional antenna (Figures 20–24).
Figure 20. RTK positioning and initialization performance for the Broadcom chip and the cell antenna sampled on Nov 20 — cell-phone GNSS antenna.Figure 21. RTX-Fast positioning and convergence performance for the Broadcom chip and the cell antenna sampled on Nov. 20 — cell-phone GNSS antenna.
In general as expected we achieve worse performance when connected to the GNSS cell-phone antenna for all the different positioning modes. For the cell antenna we also generated single-frequency RTK and single-frequency RTX-Fast position solutions and compare it with a code positioning solution.
Positioning Engine in Android
Figure 22. Number of GPS L1/L5 plus Galileo E1/E5A dual-frequency measurements used by the position solution based on the Broadcom chipset — cell-phone GNSS antenna.
The results presented in this article captured GNSS data using the Android API and then post-processed the data using PC versions of the position engines. A significant amount of data has been captured and analyzed using this method.
For the purpose of real-world demonstration the PPE has been implemented in an Android app to be used in cell phone devices. This PPE is able to provide RTK, RTX and code based positioning technology in one single PPE library.
The app has been tested running on a Samsung S7 connected to Broadcom’s new chipset development kit as well as a Nexus 9 tablet that uses an older generation GNSS chipset.
Figure 23. Code RTX performance, the dataset sampled Nov. 20 and corresponding RTK and RTX phase solutions — cell-phone GNSS antenna.
Future work will refine this solution as well as evaluate how well the system works when mobile. The data collected in this article operated in an environment with a clear view of the sky. We plan to characterize what happens when the platform moves with both pedestrian and automotive dynamics, as well as the effects of body masking and challenges with changes to the GNSS antenna reception pattern when the phone is held.
Summary
While this article has highlighted that sub-meter and centimeter accuracy have been achieved in a laboratory environment, there are many challenges to be addressed before centimeter accuracy in a phone can be achieved with performance suitable for users in real-world environments.
Figure 24. CDF plots for the different PPE position solutions for cell antenna dataset.
The challenges include very high multipath, significant differences in the tracking performance between different devices, and high rates of cycle slips. As very few Android-based devices provide continuous phase, a pseudorange/Doppler-based engine has been modified to accept Android data.
Based on the testing with existing devices it is possible to achieve position solutions of 1–2-meter accuracy in ideal static scenarios. This is a significant improvement in accuracy for Android based devices.
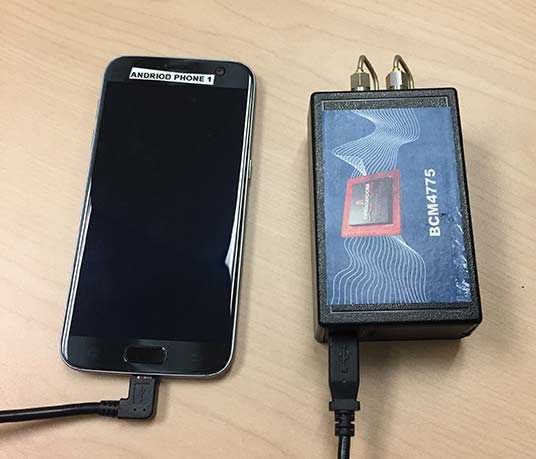
Figure 25. PPE engine on a Samsung S7 with a Broadcom BCM4775 evaluation kit.
However, as performance differences were observed between different mobile devices significantly more data needs to be collected over a larger set of devices to review the repeatability of these preliminary results from existing Android devices.
The Broadcom BCM47755 development kit for a dual-frequency GNSS chipset intended for future phones has allowed us to review the potential position performance that may be achievable in a handset in a few years.
By connecting this next-generation GNSS chipset to a GNSS antenna typical of a cellular device and comparing the performance from a precision GNSS antenna, we’ve shown for the first time that it is possible to produce precision positions from a static cellular class GNSS device in ideal conditions at the centimeter level with both an RTK solution and a PPP solution.
However, due to the significantly higher measurement noise and high multipath from the cellular device’s GNSS antenna, the convergence times to reach centimeter level remain a challenge; although using dual-frequency phase data from a cellular GNSS chipset with a PPE and RTX service, the position is very rapidly sub-meter.
Future work will focus on analyzing how the performance changes when operating in the normal user environment. The effects on the measurements of user motion, body masking and de-tuning of the antenna when the device is held need to be quantified. The Nexus 9 tablet used in this article does not have integrated cellular. The Broadcom development kit connects to the phone via a cable and is also not integrated into the handset.
We will be evaluating what may happen with a more integrated unit to make sure emissions from devices with integrated cellular very close to the GNSS antenna do not result in further degradation.
As the position performance is very sensitive to the quality of the antenna from both multipath and cycle slips due to low C/NO and deep fades, we’ll also evaluate how well the performance of the PCB-based GNSS antenna, which is part of the BCM47755 evaluation kit, matches current handsets.
Acknowledgment
This article further develops work first shown in an ION GNSS+ 2017 paper, “On the Path to Precision — Observations with Android GNSS Observables.”
Manufacturers
Trimble CenterPoint RTX is the satellite orbit and clock corrections service used here, enabling a PPP-like positioning with ambiguity fixing, providing better than 4 cm with typically less than 10 minutes’ convergence.
RTX-Fast functionality in Europe and parts of California uses regional atmospheric models to provide better than 4-cm horizontal in typically less than one minute. When precision and professional receivers and RTK engines are mentioned in this article, they are Trimble devices, the BD940 receiver in some cases.
A Trimble Zephyr 3 antenna was used in many tests shown here.
Trimble made several product announcements at Intergeo 2017, the world’s largest conference on geodesy, geoinformatics and land management.
The new solutions include:
Trimble C5 and C3 mechanical total stations
The Trimble C5 and Trimble C3 mechanical total stations are the only mechanical total stations in the industry to come standard with autofocus technology. With premium-quality Nikon optics, the new C-Series reduces time in the field with improved measuring speed and the longest EDM range of any Trimble conventional instrument.
Trimble T10
Trimble T10 10-inch tablet
The T10 is a high-performance, large-screen device suitable for a variety of survey and GIS applications that provides the processing power of a laptop computer in tablet form to enhance efficiencies for geospatial users in the field. (Now you only need one device for collecting and processing data while out on the job.)
Trimble Business Center and Trimble Clarity
The newest version of Trimble Business Center introduces enhancements and new capabilities to process high-accuracy GNSS data, create CAD deliverables, and leverage full data traceability through the project lifecycle.
Trimble Business Center version 4.0 introduced new capabilities to process high-accuracy GNSS data with confidence, create CAD deliverables and leverage full data traceability throughout the project lifecycle. Surveyors can obtain greater field flexibility without compromising quality via the addition of a new GNSS processing engine that increases solution reliability for baselines exceeding several hundred kilometers/miles.
Version 4.0 also extends the survey CAD capabilities including text editing, ortho drafting and coordinate geometry (COGO) tools that provide a comprehensive set of tools for rapidly producing end-client deliverables. A new History Log feature captures all data changes throughout the project, from GNSS processing to CAD deliverable, providing greater workflow transparency, data traceability and ultimate confidence.
Clarity by Trimble.
Trimble Clarity is a new cloud-based application within the Trimble Connect collaboration platform that enables surveyors to easily share rich project data and imagery, allowing clients — even those who have no experience with engineering software — to view and use data in a web browser.
The result is improved workflow efficiencies and greater situational awareness that enable more informed decision-making.
Users can perform 3D measurements, annotate objects and quickly collaborate with project stakeholders. Multidiscipline teams now have access to a single source of geospatial data that enables more accurate and informed decisions, increases productivity, minimizes rework and reduces project delays.
Trimble Clarity reduces the time required for large file transfers and eliminates the need for specialized software knowledge to get value from laser scanning deliverables.
Trimble eCognition.
Trimble eCognition
The latest version of eCognition adds 3D point cloud analytics and deep learning technology so you can perform a broader range of geospatial analysis with a greater level of control.
Trimble GEDO IMS System
This new addition to Trimble’s track survey and scanning rail portfolio is lightweight, flexible and fast, combining an inertial measurement unit (IMU) with scanning and geodetic sensors for surveying railway lines and documenting assets along the track.
The trolley system is lightweight, flexible and fast. It combines an IMU with scanning and geodetic sensors for surveying railway lines and documenting assets along the track.
The GEDO IMS System provides highly accurate as-built survey documentation of the track and 3D point clouds for asset data collection along the track. The trolley system’s lightweight design is ideal for single-crew operation and on projects near active railway lines. GEDO IMS Field Software and the GEDO Office Software Suite enable smooth data flow between the field and the office. GEDO Scan Office provides enhanced processing for asset data collection and clearance applications.
The basic Trimble GEDO IMS System consists of the Trimble GEDO CE 2.0 Trolley System, Trimble GEDO IMU Unit, Trimble Tablet PC and the Trimble GEDO IMS Field and GEDO Office Software. For mapping applications it can be combined with the Trimble TX6 and TX8 laser scanners.
The app provides a new way to measure marine environments on a 3D interactive map for more cost-effective fishery planning and informed conservation.
Esri has released an Ecological Marine Units (EMU) app for mobile devices. The app is a resource for scientists, educators, governments and industries seeking accessible information and imagery about the ocean’s long-term physical and nutrient properties.
The EMU app puts data such as temperature, salinity and dissolved oxygen from 52 million locations throughout the world’s oceans at any user’s fingertips. This data informs how livable marine environments are for ocean-dwelling species as well as the overall health of the ecosystem.
Organizations involved in fishery planning, for instance, can use the EMU mobile app to review proposed boundaries with a better understanding of which habitats will likely harbor certain species and manage fisheries more cost-effectively.
By using the EMU mobile app, industries that depend on fishing yields can spend less time and money on areas that are less profitable. Conservation groups that need easy access to information on the environments of marine protected areas (MPA) to more effectively regulate them now also have a mobile tool for understanding the chemical makeup of these areas.
“The EMU mobile app will serve as a fresh, widely available resource for professionals who benefit from a deeper understanding of the ocean’s structure — its salinity, temperature, oxygen levels and nutrients,” said Dawn Wright, Esri chief scientist. “Scientists and nonscientists alike who must study and understand the ocean now have the freedom of a convenient mobile interface with this vast wealth of environmental data.”
The primary data source for the EMU mobile app is the National Oceanic and Atmospheric Administration’s (NOAA) authoritative World Ocean Atlas, with marine chemistry information from the National Aeronautics and Space Administration (NASA) and topographic data from GRID-Arendal.
The app provides access to this globally comprehensive, data-driven 2D and 3D data and serves as an educational tool for easily understanding marine environments and how they are affected by climate change.
The EMU mobile app is free from the App Store and Google Play.
The Oregon Department of Transportation (ODOT) is embracing the growing trend in highway construction to go “stakeless” and push to full 3D design.
With more contractors using automated machine guidance applications, ODOT’s construction personnel are being asked to inspect projects with fewer stakes and visual indicators for line and grade. Employees are seeking to use the same data and information to determine line and grade when building or fixing stretches of road.
ODOT inspectors Jorge Jimenez and Mike Stennett at Multnomah Falls, preparing for a night-time paving operation. (Photo: Chris Pucci)
To address this need, rugged tablet maker DT Research worked closely with ODOT to design purpose-built Inspector Positioning Tablets that run GPS locating and 3D modeling applications, and take advantage of the Oregon Real-Time GNSS Network.
“MicroSurvey Field Genius surveying software is used to read XML files directly, allowing the inspector to work with the same files that the contractors received from the roadway designers,” said Chris Pucci, ODOT Construction Automation Surveyor.
The tablets enable ODOT to fully use its knowledge of the Oregon Real-Time GNSS Network and expertise in survey-grade RTK GNSS to achieve accuracies of +/0.05 feet.
The model DT391GS tablets have 9-inch touchscreens. The tablets can be used as handhelds or with an external antenna and pole. ODOT purchased one of four GNSS options offered by DT Research for the DT391GS tablets. The options enable inspectors and construction crews to employ a combination of GPS locating and 3D modeling to guide construction workers.
The goal is to allow the inspectors to make the same checks they would have made if there had been traditional construction staking on a project, not to make inspectors into surveyors, Pucci noted.
A one-day training is provided to train construction personnel before they are issued a tablet. “The tablets have been very well received by our construction inspection personnel,” he said.
The tablet project is now in the pilot phase with 20 tablets deployed to eight construction offices and more than 70 construction personnel having been trained. “We also just placed an order for 22 more tablets for the upcoming 2017 construction season,” Pucci said.
Esri is partnering with GISinc to analyze customer behavior to help retailers increase sales.
Esri will integrate itsspatial analytics platform with GISinc’s indoor mapping capabilities to analyze data collected by sensor-enabled overhead smart lighting systems and from opt-in mobile data from customer phones. The solution will enable retailers to track behaviors, using information including customer locations inside the store and items selected for purchase. The store can then tap into such data to improve customer assistance and position merchandise in the places most likely to attract purchases.
“Analyzing customer choices and mapping go hand in hand,” said Sonny Beech, Internet of Things (IoT) business development manager at GISinc. “Why a person bought something where they did is an example of spatial data. Using ArcGIS analytics, we can enable retailers to make more strategic decisions about where to place merchandise and in-store marketing materials.”
With more than two-thirds of consumers using smartphones while shopping in brick-and-mortar stores, retailers have to deliver more relevant experiences by becoming more precise in how they interact with shoppers. In-store location technologies provide opportunities for retailers to increase touch points in the aisle and on the shelf by delivering messaging and services in real time based on a customer’s location in the store.
Studies show that the spatial customer behavior analysis Esri provides can boost the probability of purchase by up to 70 percent and increase basket size by up to 60 percent for smartphone-enabled shoppers, Esri said.
“Esri enables retailers to access vast amounts of customer information while allowing the customers themselves to take advantage of advanced analytics,” said Gary Sankary, retail industry manager at Esri. “With the widespread use of smartphones during in-store shopping, indoor mapping provides businesses with a tool to understand shopper behavior and improve sales accordingly.”
Indoor-mapping initiatives and smart lighting systems, like other IoT implementations, have become more affordable and accessible — in fact, much of the technology can be integrated directly into the infrastructure of a brick-and-mortar store. Customers benefit by downloading mobile apps and opting in to shared-data environments that make the shopping experience more efficient and enjoyable.
TomTom has extended its the multi-year partnership with AOL Inc. to power its core mapping services for MapQuest, a subsidiary of AOL.
In addition to providing access to TomTom’s extensive digital map database, across all digital platforms including MapQuest.com and its iOS and Android apps, and MapQuest for Business API solutions, the new deal now includes TomTom’s leading traffic solution.
“Every day, millions of people depend on MapQuest for maps, driving directions and location information to make their lives easier and thousands of business depend on MapQuest’s suite of geospatial solutions to meet their needs,” said Brian McMahon, senior vice president and general manager at MapQuest. “We truly value the partnership with TomTom, and we look forward to continuing to build upon and evolve our product suite with TomTom data. By expanding our agreement with TomTom, we are continuing our commitment to provide MapQuest users and business customers with the most innovative products and solutions.”
“We are delighted to enhance our partnership with MapQuest,” commented Anders Truelsen, Managing Director of Licensing for TomTom. “Integrating TomTom’s mapping and traffic data into MapQuest products ensures millions of people can make better and more informed decisions about every journey.”