Tag: Nearmap

  • Using high-precision aerial imagery to map cities

    Using high-precision aerial imagery to map cities

    Government agencies are increasingly turning to high-precision aerial imagery to solve city-planning conundrums. Three recent case studies show how emergency 9-1-1 services gather data to provide updated maps to emergency services to get to the right locations as soon as possible; reveal how a city’s public works department streamlines data collection for more efficient infrastructure management; and how to give GIS professionals instant access to the most current information available — all in the cloud.

    Photo: Nearmap
    Photo: Nearmap

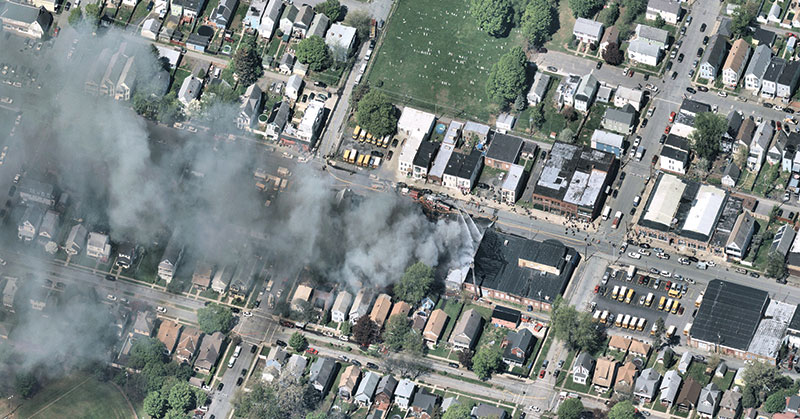
    It’s said a picture is worth a thousand words. In the case of aerial imagery, where location data is packed into every pixel, a picture could save lives.

    Emergency dispatch is just one type of government agency now relying on high-quality aerial imagery. With up-to-date georeferenced imagery of their own towns and counties, agencies are not only improving response to emergency calls, but also streamlining public works and enhancing city planning.

    A company providing that imagery is Nearmap, which serves more than 8,200 organizations and businesses globally using small aircraft for image capture. The aerial mapping company provides high-quality imagery as a subscription service delivered through the cloud. Its photo maps are taken at least twice a year, with leaves both on and off the trees, to provide different views of locations in different seasons.

    Nearmap’s patented camera system and software pipeline enables it to capture aerial photos, stitch them together into seamless digital maps, and publish the content online within days of capture. Above, Nike’s headquarters in Portland. (Photo: Nearmap)
    Nearmap’s patented camera system and software pipeline enables it to capture aerial photos, stitch them together into seamless digital maps, and publish the content online within days of capture. Above, Nike’s headquarters in Portland. (Photo: Nearmap)

    Aircraft offers a huge advantage over unmanned aerial vehicle (UAV) or satellite imagery. Airplanes can cover much greater distances than UAVs, and pilots pay heed to the weather and fly below cloud layers to deliver the clearest visuals possible. Unlike space-based platforms, airplanes operate at lower altitudes, also increasing the resolution, and can fly on demand, unlike satellites that have set orbits dictating their periodicity for returning to a target area.

    Nearmap’s powerful, patented technology allows it to deliver high-resolution aerial imagery as a service: orthographic (straight down) maps, multi-perspective panoramas and oblique aerial views — all at resolutions four times clearer than free satellite imagery.

    Once photographed, the images are stitched together in the cloud in a matter of days, where they are available for viewing and analysis on desktop, tablet and mobile devices via a subscription service.

    Nearmap’s proactive capture model is based on population — the larger the population, the more captures it takes per year. Nearmap images 88% of Australia’s population, 70% of the U.S. population, and 75% of the New Zealand population.

    Nearmap captures many areas multiple times throughout the year; for many locations this gives customers a leaf-off and leaf-on view. Providing spring leaf-off captures allows customers a view of the ground that is typically obstructed by foliage the rest of the year.

    The flight plans cover approximately 430 urban areas that are flown, captured and processed, and then served up via the MapBrowser in-browser tool, or supplied via application programming interface (API) for use in various design platforms. When a user subscribes to Nearmap, the capture is immediately available with any and all historical captures, without the need to pay for a dedicated flight.

    “To capture imagery for a map, a plane has to crisscross over its own flightpath. Each sweep has to overlap the previous by approximately 70%,” explained William Tewelow, GPS World’s contributing editor for geointelligence. “Vertical (or nadir) is straight overhead. Oblique is everything else, but usually not exceeding 30% to either side because it distorts the structures and vertical features (parallax), makes mosaicking difficult, and shadows structures behind other structures.”

    That said, oblique imagery is important for building 3D meshes for imagery point clouds, Tewelow said, as well as seeing various angles of a structure.

    Following are examples of the creative — and surprising — ways government agencies are using Nearmap imagery to improve their services today, and prepare for future changes in their communities.

    Better 9-1-1 address mapping

    Shelby County is the largest county in Tennessee in both population (927,644) and geographic area (785 square miles). Memphis is the county seat, home to the county’s Emergency Communications District, for the operations of the local 9-1-1 emergency system.

    The district provides Shelby County residents with an efficient emergency telephone number service using the latest technology, equipment and training for the various emergency service providers and dispatch centers.

    For each dispatch center, the district provides county address location mapping. A secure database known as an ALI (Automatic Location Identification) contains the exact 9-1-1 address for any given associated phone numbers.

    Albany, N.Y.: A house fire in progress. (Photo: Nearmap)
    Albany, N.Y.: A house fire in progress. (Photo: Nearmap)

    When a 9-1-1 call comes in, the database is queried by the Public Safety Answering Point to obtain the caller’s location. This data is then placed in the computer-aided dispatch software and 9-1-1 mapping software used by the district to help fire and rescue, emergency medical services and law enforcement gain instant access to updated maps containing GIS data needed to get to the right locations as soon as possible.

    The 9-1-1 mapping system uses geodetic coordinates to plot wireless calls on the map. The system also reverse geocodes the coordinates to provide the 9-1-1 telecommunicator with a calculated civic address based on proximity of other features in the map, such as address points or streets.

    Out-of-Date Imagery. For years, Shelby County’s aerial image process required a contracted flight to photograph the county areas. Because of the high cost of capturing those images, the county purchased images once every two years, after pooling resources from various county entities.

    “We had gaps where we wouldn’t have updated imagery,” said Timothy Zimmer, the district’s GIS administrator. “While the images were high resolution, there were issues with mosaicking the separate images together, and since the imagery was taken every two years, many rural and unincorporated areas were out of date.”

    With out-of-date images, the county had to develop alternate methods to locate addresses for the 9-1-1 systems.

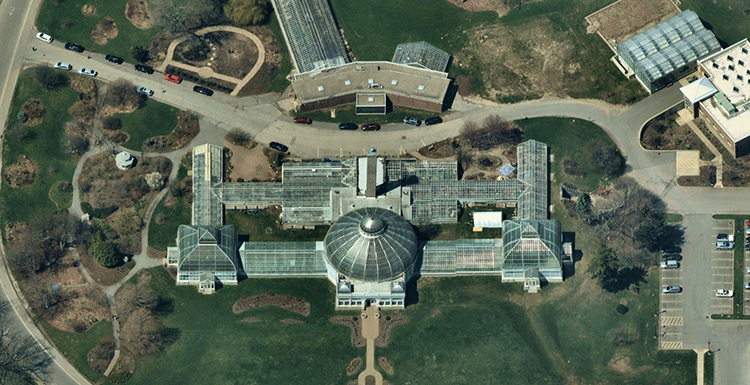
    Moving into the Cloud. In the summer of 2018, Zimmer began to work with Nearmap. With Nearmap, Zimmer and his team can access current imagery to geocode new addresses and developments as well as plot new roads into the 9-1-1 mapping systems (Figure 1).

    Figure 1: Mapping image for Shelby County’s 9-1-1 system. (Photo: Nearmap)
    Figure 1: Mapping image for Shelby County’s 9-1-1 system. (Photo: Nearmap)

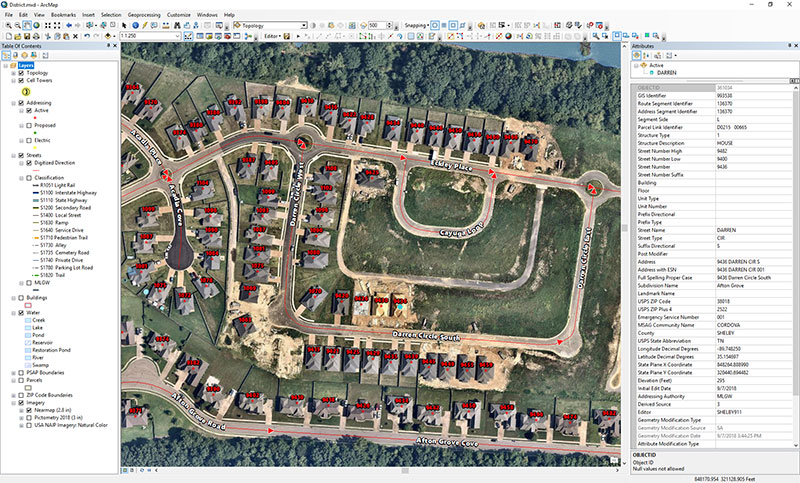
    For Zimmer, the biggest advantage is that Nearmap’s imagery integrates directly into Esri’s ArcMap, ArcPro and ArcGIS Online applications, so he can overlay GIS information directly over the high-resolution imagery.

    “I really like how Nearmap is integrated into the GIS stack,” Zimmer said. “We’re able to stay on top of new developments, roads, and addresses. Being able to have Nearmap imagery integrated into our GIS systems helps us be much more accurate.”

    The combined impact of data services, base maps, Nearmap imagery and third-party data are improving all aspects of public safety, including law enforcement, fire and emergency medical services.

    Other Shelby County agencies also are using the district’s imagery and GIS data. “The county clerk and the utility company are using our address mapping data because Nearmap has helped enable us to be much more current,” Zimmer said.

    Public works in a fast-growing city

    Durham is one of the points in North Carolina’s high-tech Research Triangle and home to Duke University.

    An economic and cultural renaissance is happening in the city. With a revitalization of its downtown district, the redevelopment and repurposing of former tobacco districts into tech hubs, and chic loft-style apartment complexes, Durham is rapidly growing beyond its most recently reported 250,000 population numbers.

    Impervious Challenge. In early 2018, the city’s growth explosion prompted Edward Cherry, GIS administrator for the City of Durham Public Works Department, and his staff of 14 GIS professionals to seek ways to streamline their data collection.

    The department manages all infrastructure data for the city, including mapping the impervious area. As defined by the U.S. Geological Survey, impervious surfaces include highways, streets, pavement, driveways and even house roofs — any surface that won’t absorb rainwater. Rather, the rain runs off into storm sewers and then into local creeks; localized flooding is often the result.

    Durham Public Works manages half a billion square feet of impervious area. The city’s $16 million-a-year Stormwater Utility Fee income was a driver for Cherry’s team to explore satellite imagery options. Imagery from satellites, however, were infrequent and too low-resolution to meet their needs. The satellites captured images only once-a-year, and that might be on a cloudy or rainy day. Clouds cast shadows, and rain makes pavement appear newer than it is.

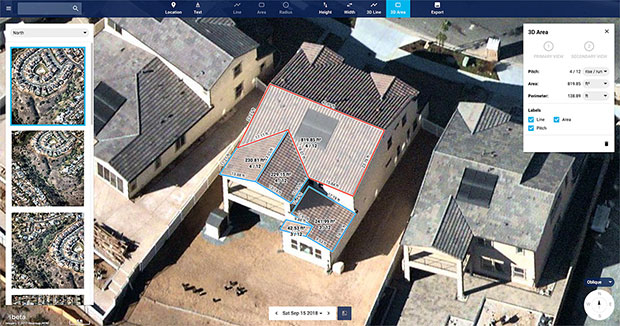
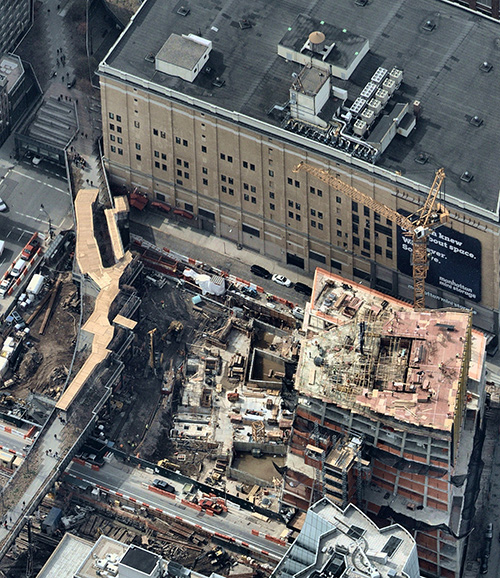
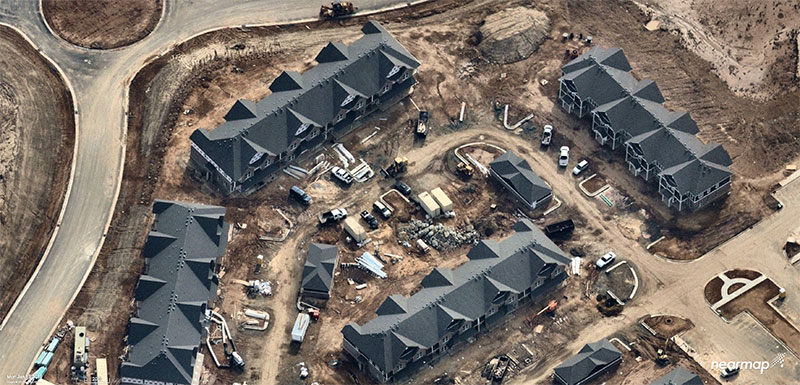
    Nearmap’s aerial imagery, captured in Durham three times a year at a 2.8-inch ground sample distance (GSD), solved the problem (the GSD of each individual pixel in the imagery represents 2.8 inches on the ground. See Figure 2).

    Figure 2: Rapid growth requires frequent imagery. Above is a new Durham neighborhood under construction. (Photo: Nearmap)
    Figure 2: Rapid growth requires frequent imagery. Above is a new Durham neighborhood under construction. (Photo: Nearmap)

    Dozens of projects in the Public Works Department — from road maintenance and pothole patching to water sampling and degradation — are using the improved imagery, which has saved the city money, reduced time spent in the field, and allowed crews to use real-time imagery when they are working in the field.

    Monitoring Pavement Conditions. The City of Durham is responsible for maintaining most of its roads, and conducts a road-condition survey that samples different sites, evaluating the level of degradation.

    Since 2014, Nearmap has regularly captured Durham streets at the same resolution and accuracy, and both the historical and current data are available to the department. With multiple high-quality image captures at high resolution, surveyors can see sections that have been recently paved. “We don’t need to send crews out to an area where a stretch has already been paved,” Cherry explained.

    Road Repair Documentation. As in any city, the patching of potholes is an ongoing project for Durham’s public works department. With imagery, the city has been able to streamline the process.

    Traditionally, the streets department sent out inspectors to spray paint and circle areas that required repairs. “Then we would produce maps and hard copies to direct [road repair contractors] ahead of time on a scheduled event,” Cherry said.

    Now the city uses an application integrated with Nearmap imagery by which contractors can view the job on their smartphone or tablet while in the field. The surveyors can edit and draw the areas that need patching instead of physically going out and spray-painting them. “Then, in real time, the people doing the patching can see a very high-resolution image of where they need to do the work,” he said.

    The pothole image captures are recorded, so the city knows where and how many potholes were patched. “We can see where work has been done when we are billed for it,” Cherry said. “We can visualize the work, which is an added bonus.”

    Mapping Riparian Zones. With imagery previously taken only when the leaves had fallen (known as leaf-off), surveys of riparian zones in Durham proved limiting.

    With imagery captured during both leaf-off and leaf-on seasons, riparian buffers around streams can be properly monitored for expansion. The buffers can be altered if there are issues with a stream’s path, such as sediment clogging the flow, repeated flooding or people intruding on a buffer.

    Change Detection. High-resolution imagery has improved Durham’s billing process by producing web service maps that capture individual storylines. Stormwater billing customers, for instance, can visualize their properties with the impervious areas mapped out and tied to their billing records.

    With up-to-date imagery providing data for change detection software, records also show when a customer has added a driveway or an extension to their house.

    Figure 3: Aerial Imagery of an Apex neighborhood displayed in ArcGIS from Esri. (Image: Nearmap)
    Figure 3: Aerial Imagery of an Apex neighborhood displayed in ArcGIS from Esri. (Image: Nearmap)

    “Having access to imagery back to 2014, we’re able to go back in time during the thrust of development and monitor it forward,” Cherry said.
    Nearmaps’ library of historical imagery allows for change detection algorithms to run in Esri’s ArcGIS imagery analysis software suite.

    More efficient government

    GIS data combined with aerial imagery is tailor-made for city planning and managing urban growth.

    For instance, the population of Apex, N.C., has more than doubled since 2000. Situated near Raleigh and the state’s Research Triangle Park, Apex was rated number one in Money magazine’s 2015 “Best Places to Live,” which cited Apex’s charming downtown, highly rated schools and high-paying technology jobs.

    Figure 4: The post-construction image of the same neighborhood is much more accurate. (Image: Nearmap)
    Figure 4: The post-construction image of the same neighborhood is much more accurate. (Image: Nearmap)

    To manage the explosion in development, Apex’s GIS professionals needed instant access to current information. The old-school method required planners to drive the streets, inspect roadways, and roll out the measurement wheel. Now, the combination of Esri ArcGIS for mapping and Nearmap high-resolution aerial imagery allows them to visualize and measure within six inches of accuracy.

    “Our ability to leverage our GIS operation improved dramatically with Nearmap. The flexibility of its cloud solution and ability to integrate with ArcGIS has redefined how we rapidly respond to staff and citizen requests,” said Steve Nelson, a GIS professional with Apex.

    The use cases for these solutions are diverse. Law enforcement calls on GIS professionals from Apex to quickly provide current, clear, aerial photography for active or ongoing investigations. Planners focused on development are charged with meeting state regulatory reporting guidelines when it comes to building and maintaining roads. Environmentalists want to know if anyone is digging on protected land.

    Figure 5: Measuring for reimbursement in Apex. (Image: Nearmap)
    Figure 5: Measuring for reimbursement in Apex. (Image: Nearmap)

    For the State Street-Aid Program, financial allocations are made to incorporated municipalities eligible under North Carolina law. State routes that pass through incorporated cities are maintained by the cities. Cities are responsible for paving new roads, but the state has the power and economic means to reimburse them.

    To qualify for reimbursement for new roads developed and maintained, Apex needs to submit a report to state engineers for review. The report documents the distance for all newly paved roads.

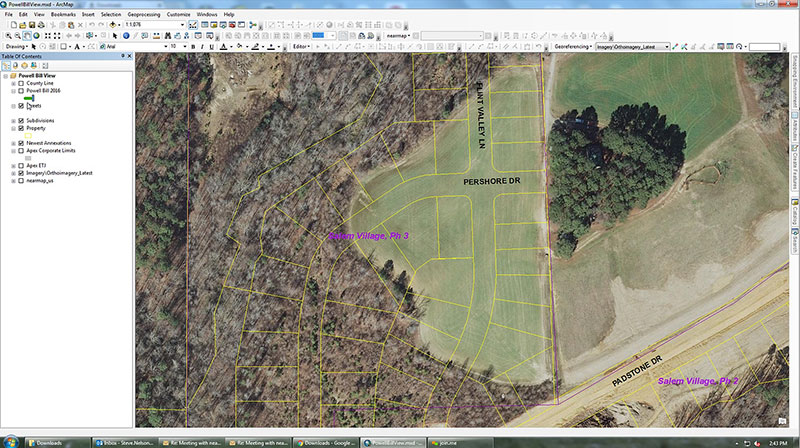
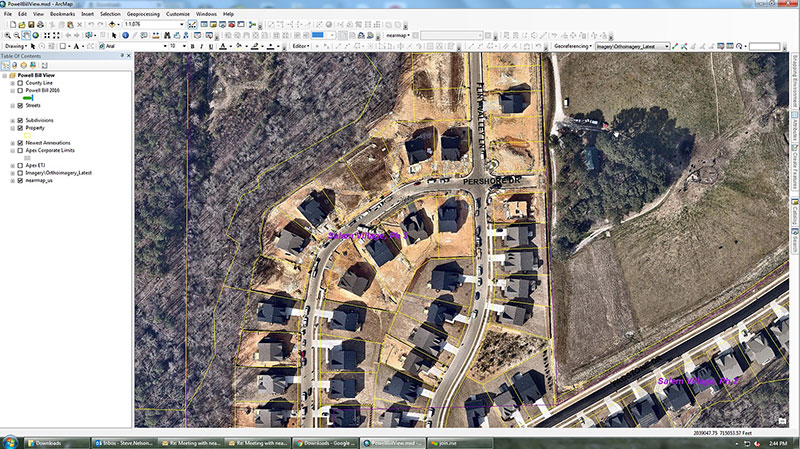
    Before the new system was in place, GIS professionals had access to imagery from 2013, but the actual development took place after this. In (Figure 3), the 2013 imagery simply outlines the parcels and rights of way. It has no detail with respect to where the roads start and end, so a lot of field work was needed to take measurements, drive roads scattered across the county, and collect data.

    Figure 6: Green lines indicate new streets in Apex in a single year (2013). (Image: Nearmap)
    Figure 6: Green lines indicate new streets in Apex in a single year (2013). (Image: Nearmap)

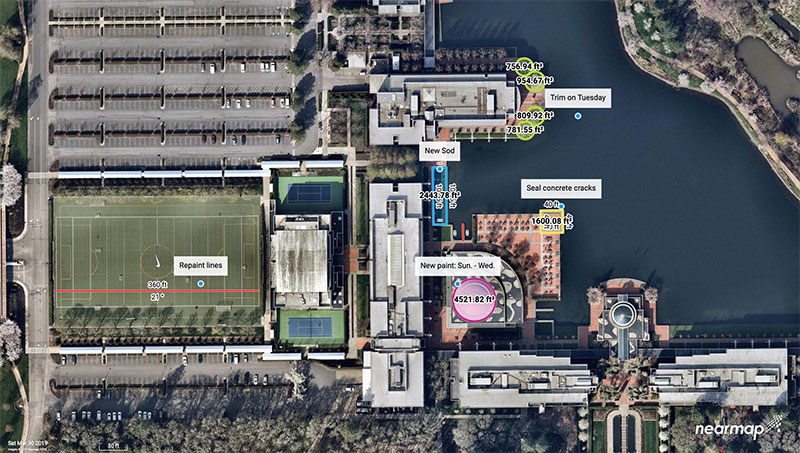
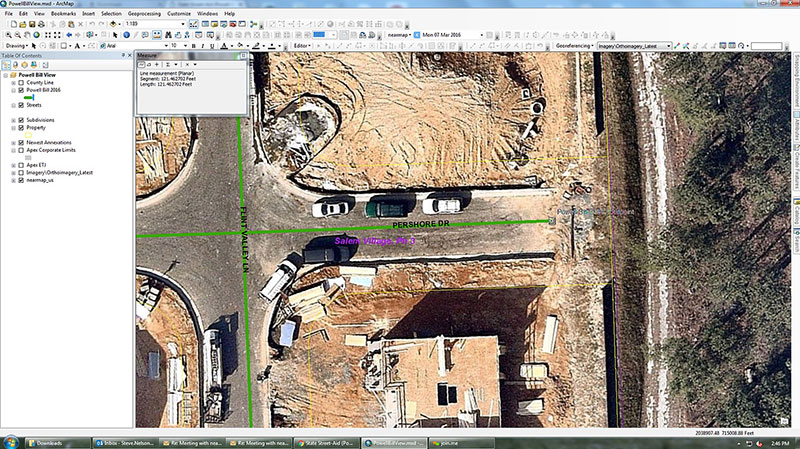
    With the new system, workers have instant access from their desktop to the same location as it currently is. They can see exactly where the edge of the road starts and stops (Figures 4 and 5), which is different from the yellow-lined “right of way” depicted in Figure 3. While in the office, GIS professionals can measure distances precisely, creating an accurate representation of ground truth.

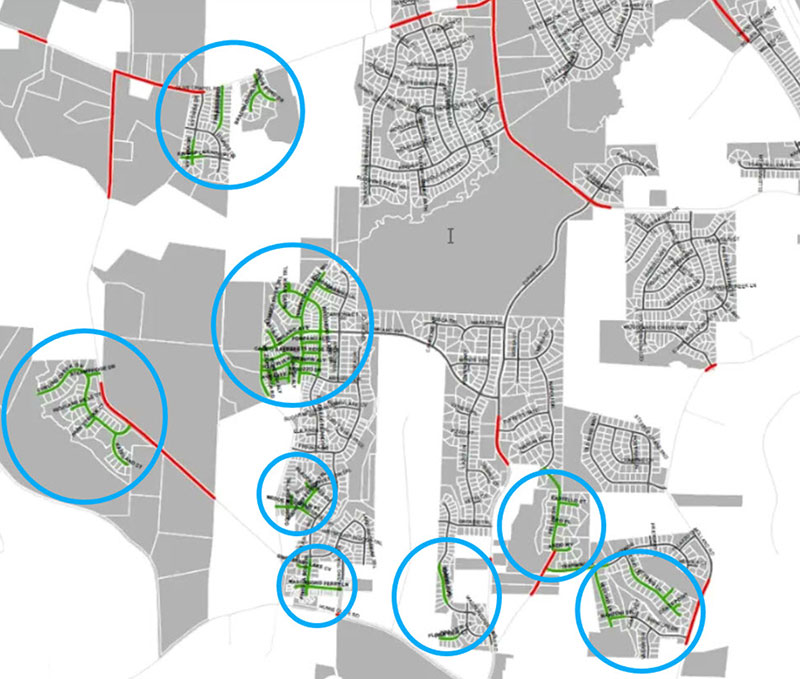
    Figure 6 highlights a small portion of new roads built in Apex in one year. The green lines highlighted are scattered across the city. As Apex continues to grow and annex adjacent territory, the dynamic nature of the growth will be captured and uploaded to the cloud.

    Unlocking Potential

    As cities grow in complexity, mapping becomes integral to planning. With the advances aerial imagery provides, cities are starting to unlock the full potential of location data and visualizing a better future.


    More:

    UAS enhances utility co-op’s GIS efforts
    A straightforward explanation of oblique
    GNSS, GIS help small town utilities operate efficiently

  • Nearmap unveils 3D imagery streaming technology

    At the 2019 Esri User Conference in San Diego, Nearmap’s Tony Agresta discusses Nearmap 3D, which allows customers to stream and export 3D imagery on demand at massive scale, through its proprietary MapBrowser web application.

    Read more about Nearmap 3D here.

  • Nearmap unveils streaming 3D aerial imagery, AI technology

    Nearmap unveils streaming 3D aerial imagery, AI technology

    Aerial imagery business Nearmap has launched its new 3D product to streamline the way industries such as urban planning, architecture, construction, government and councils view and shape cities across Australia and the U.S.

    The company is also previewing its groundbreaking artificial intelligence (AI) technology at its customer event Navig8.

    Nearmap 3D allows customers to stream and export 3D imagery on demand at massive scale through its proprietary MapBrowser web application. Because the imagery is updated frequently, businesses can work with the most current information to make more informed decisions.

    Nearmap’s new AI technology is turning millions of aerial images — captured over a decade and multiple times a year — into valuable datasets. The datasets can be used to more accurately and efficiently measure change and quantify attributes, such as solar panels, pools, roofs or construction sites.


    Organizations ranging from small businesses to large companies and cities will be able to take advantage of AI-driven location intelligence.

    “Product innovation is in our DNA. Everything we do has the customer at the core,” said Tony Agresta, executive vice president of product at Nearmap. “Our customers’ worlds are evolving every day. We need to keep innovating to continue to give our customers a competitive advantage through technology breakthroughs like the ones we are sharing today at Navig8.

    “Nearmap 3D is the result of a significant investment in R&D, but also listening to our customers and what they need to transform the way they work,” Agresta said. “Accessing 3D imagery up to now has typically been an arduous, time-consuming and expensive process — but not anymore. This represents the single largest, most frequently updated footprint of 3D accessible through a browser. The ability to measure in 3D space, size up an area and then export Nearmap 3D for use in other platforms will transform the aerial imagery market.

    “The AI technology that we’re working on will allow organizations to identify locations with specific attributes and in so doing, reduce site visits, generate more leads, and eliminate the time involved to inspect properties manually. Nearmap AI does the heavy lifting so you don’t have to,” Agresta said.

    Composite aerial image of Perth, Australia. (Image: Nearmap)
    Composite aerial image of Perth, Australia. (Image: Nearmap)

    Instant access to 3D through MapBrowser

    Nearmap is making 3D imagery accessible to anyone, in the same way it has with 2-D. While Nearmap has offered 3D imagery since 2017, this new iteration of the technology allows users to instantly stream 3D content at massive scale via its MapBrowser web application.

    The lightweight platform offers customers an immersive 3D experience, allowing them to visualize cities in 3D from any direction, measure distances, and immediately export a custom area in a variety of 3D formats at unprecedented speed — the download time is a matter of minutes for most requirements and only a few hours for very large footprints.

    “It’s like switching from DVDs to streaming services,” said Tom Celinski, executive vice president of technology and engineering at Nearmap. “Our camera technologies have been capturing 3D since 2017, but now our secret sauce is bringing it onto MapBrowser, allowing users to easily and instantly stream this content with many export options. Now users can visualize, measure, define a custom area, export our 3D and use it in their workflows with other commercial platforms and tools. We’re helping 3D experts and novices alike access reality like never before, and this is an important next step in our Reality as a Service journey.”

    Nearmap 3D comes with an extensive library, covering more than 400,000 square kilometers. It is updated once a year and covers major urban areas in Australia and the U.S.

    “We live in a 3D world, we think in 3D, and so we have to ensure that our products give the closest representation of reality as possible,” Celinski said. “That means businesses that rely on visualizing 3D content, like architects, for example, can now access up-to-date 3D models instantly and export them in just minutes. In a tender process, for example, that can be the difference between winning a new project or not. The opportunities for Nearmap 3D are endless.”

    3D image of Manhattan. (Photo: Nearmap)
    3D image of Manhattan. (Photo: Nearmap)

    A living data set

    Nearmap AI technology is the result of more than two years’ worth of research and development, and a team of close to 20 data scientists and machine learning engineers. The team, led by Dr. Michael Bewley, is using the petabytes of imagery that the business has captured over the past 10 years and turning it into a living dataset to accurately identify changes or quantify attributes from the Nearmap library of aerial imagery.

    Nearmap has built highly accurate machine learning models and deployed them on a massive scale. The automated process, and the constantly learning engine, means that the AI technology can be applied to any new geography. Nearmap also applies the models to new surveys, generating fresh results with current imagery.

    To date, Nearmap has performed analysis on over 1 million square kilometers of imagery across Australia and the U.S. (which constitutes about 80 million properties) and is performing more analysis every day. Nearmap is now inviting customers to take part in a beta program to experiment with various use cases.

    “We don’t prescribe how our technologies or content can be used by our customers,” said Michael Bewley, director of AI systems at Nearmap. “Our solar customers could use the AI technology to easily identify where and when solar panels have been installed for maintenance jobs, to prospect new clients in an area where solar energy’s popularity is on the rise; or a government entity that previously had the arduous task of tracking swimming pools or construction in their jurisdictions will be able to do it automatically.”

    “But this is the tip of the iceberg — we’re just getting started. This technology is going to profoundly change the way that cities are built,” Bewley said. “Our plans include delivering AI results in many forms, much the same way we deliver our imagery today.”

    Both technologies will be presented at Nearmap’s flagship event, Navig8, in Perth on June 6, Melbourne on June 11 and Sydney on June 13.

  • Positioning sensors and geospatial intelligence advance in the 5G landscape

    Taming a brave new world


    Nearmap

    Tony Agresta, Executive Vice President, Products

    Tony Agresta
    Tony Agresta

    We’ve all been there before: static on our wireless call or, worse, the call drops at the most inopportune time. Like instant response when we surf the web, consumers have come to expect clear, consistent call connections when using mobile. With too much of a bad thing, the churn risk soars to untenable heights.

    5G, shorthand for Fifth-Generation Wireless Systems, holds the promise of transforming our daily lives. Using massive bandwidth, extremely low latency and high speeds, almost everything that requires sending and receiving data gets a boost. Unique radio frequencies transmitted with precise directions improve on the older 4G approach by taking advantage of higher frequencies. The signals take less time to transfer from one device to another, dramatically reducing wait times.

    How does this help business and the consumer? Video conferencing is better, call connections are clearer, and smart homes get their Ph.D. How does this become reality?

    Rather than using satellite-based towers, 5G depends on shorter signals using antennas and other transmission devices installed closer to the ground, on the tops of buildings and existing utility poles. Herein lies the rub. Ground features such as trees or tall structures can interfere with transmission. On top of this, there’s the need to plan for change. Vegetation grows over time, new construction takes place, and the cycle of interference continues. Imagine trying to plan a 5G network in an urban environment replete with hundreds or thousands of tall buildings. How would a telecom decide where to place the hardware and optimize the network?

    The answer rests in aerial imagery, also known as aerial mapping. Rather than relying on satellite imagery that’s less clear and prone to atmospheric conditions, high-resolution camera systems mounted inside planes are photographing the world — all in 3D. Within predefined coverage areas, every point on and above the ground is being photographed and transformed into a variety of 3D models. For the telecom industry, planners can predict zones of interference and place hardware accordingly. They can better service their customers and quickly adapt to changing conditions in support of maintaining the network.

    One type of output from these advanced camera systems is called a digital surface model, providing detailed elevation profiles of ground features, building, bridges, you name it. Also knows as DSM, the elevation detail contained within the imagery facilitates analysis to optimize the placement of 5G antennas and transmission devices.

    When combined with other forms of imagery that allow users to clearly visualize every aspect of the landscape in photorealistic, immersive 3D, this enables telecoms to quickly model all the transmission permutations.

    These high-tech companies use machine learning to identify clear signal areas and sections of the landscape where a tree, for example, may degrade the 5G radio frequency. Armed with such intelligence, strategic placement of hardware unlocks the optimized network — all without having to leave the office to collect data from the field.

    The race is on to roll out 5G. Fortunately, advances in aerial photography have been combined with machine learning and artificial intelligence (AI) to speed up network planning and change modification. With tens of thousands of access points needed for large cities, advanced uses of aerial imagery and data science provide the answer for fast 5G deployment.


    Lidar USA

    Jeff Fagerman, Chief Executive Officer

    Jeff Fagerman
    Jeff Fagerman

    Wired?

    Not anymore.

    Less than a decade ago, mobile mapping systems were being designed and sold using computer systems that rivaled most desktop computers. Mobile mapping vehicles had to be custom-fit for large displays and computer systems, usually with large, expensive, bulky redundant arrays of inexpensive disk (RAID) storage systems that would consume the back of a van or, at the very least, the back seat of a car. Wiring for these systems completely entangled the vehicle, making it a dedicated part of the mapping system. Many of these systems are still being used today, as their utility is only lost on space consumed but not on usability or productiveness.

    In 2019 we face the ever-increasing demand for smaller size with greater performance, especially in the instance of UAVs, where size, weight and power consumption are precious commodities.

    Wires? Nobody wants or expects to see any wires or cabling running between devices, with the possible exception of power. A desktop computer, laptop or RAID system is no longer a consideration. Storage is replaced by high-speed, high-capacity media such as Compact Flash, Flash memory cards, and solid-state drives.

    And all of those wires? They are replaced by Wi-Fi or Bluetooth working directly between the onboard microprocessor (at most the size of a deck of cards) and what else? Your cell phone. Maybe a tablet.

    The inertial navigation system inside these UAVs, the central nervous system of a mobile mapping set-up, can no longer afford to weigh several kilograms. It must weigh under 1 kilogram, with less than 500 grams preferred. The accompanying antennas must also shrink.

    At the same time, cost must drop while performance must be maintained or improved. More users will adopt the technology, and they will no longer be experts. Reliability and durability will be of utmost importance. 

  • Nearmap imagery wins business for solar installer

    Nearmap imagery wins business for solar installer

    Check out a Nearmap high-resolution aerial image of Zions Bank Stadium/Real Academy. The solar was installed by Auric Solar. (Photo: Nearmap)
    Check out a Nearmap high-resolution aerial image of Zions Bank Stadium/Real Academy. The solar was installed by Auric Solar. (Photo: Nearmap)

    High-resolution aerial maps from NearMap are helping Auric Solar, a residential and commercial solar power provider, accelerate its initial site assessments, develop a more complete and accurate view of properties, and create winning proposals.

    Auric accesses Nearmap imagery through the Aurora Solar platform, a solar sales and design software program. By utilizing Aurora software integrated with Nearmap imagery, Auric analysts have access to clear and current imagery.   Headquartered in Salt Lake City, Utah, Auric services all of Utah, Idaho, Colorado and Oregon.

    “Aurora’s responsive engineering interface coupled with Nearmap’s high-resolution captures allow us to use a combination of 3-D lidar models and 2-D high-resolution maps for complete accuracy in the planning and measuring stage of a project. This equips both the sales and analytics teams with accurate information to save time, money and serve the customer,” said Tyler Soukup, director of analytics at Auric Solar.

    Analysts can make accurate measurements, run production numbers, identify roof obstructions and craft proposals all within the program. The sales team, analysts and installers are all on the same page, significantly reducing change orders.

    The absolute horizontal accuracy of Nearmap’s georeferenced imagery is 0.75m (RMSE) or better. Measurements taken with Nearmap measurement tools are accurate to within 15cm for an individual photo. The company’s HyperCamera aerial photography system captures overlapping photographs along a flight path covering a survey area. Each photograph is tagged with its GPS location. Proprietary HyperVision technology then triangulates, orthorectifies and stitches these GPS-tagged photographs into a georeferenced photomap with an absolute horizontal accuracy of 0.75m (RMSE) and relative accuracy of 15cm. The process employs a combination of GPS positioning, high photo redundancy and triangulation of ground features to ensure this level of accuracy without the use of ground control points.

    Solar panel installer Auric also has access to Nearmap historical imagery from years past, including leaf-on and leaf-off imagery, which presents the presence or lack of the foliage depending on the season. This greatly enhances shading analysis, making it easier to place the panels for maximum sun exposure. 

The company not only saves a significant amount of time with fewer onsite visits to qualify homes, but it also opens up more customers to solar.

    “We’ve been able to qualify more customers than ever because of Nearmap’s clear, current captures. You really can’t accurately qualify a property without up-to-date imagery,” notes Soukup. “We quote projects from $20,000 to a few million dollars, and our proposals, plans and marketing materials should match that level of value. Nearmap helps us create a ‘wow’ factor.”

    Before using Nearmap aerial imagery, Auric used using low-resolution satellite imagery to qualify properties. With outdated, blurry imagery, it was difficult to make accurate measurements and qualify a home before sending a technician for an on-site assessment.

  • Durham public works uses Nearmap to manage massive city growth

    Nearmap high-resolution aerial image of Durham, North Carolina, photographed Jan. 15. (Photo: Nearmap)
    Nearmap high-resolution aerial image of Durham, North Carolina, photographed Jan. 15. (Photo: Nearmap)

    Location content provider Nearmap has partnered with the city of Durham, North Carolina, to help it manage infrastructure projects.

    The city’s Public Works Department uses Nearmap’s high-resolution imagery to aid in managing all infrastructure data for the city, including the city’s $16 million a year Stormwater Utility Fund.

    “Having access to imagery back to 2014, we’re able to go back in time during the thrust of development and monitor it forward,” said Edward Cherry, Durham’s GIS administrator. “With Nearmap, we’ve been able to update development processes and policies to support the revitalization of the downtown district as well as rapid city growth.”

    After using satellite imagery systems with low resolution and infrequent captures, Cherry and his staff of 14 GIS professionals determined the city needed superior mapping imagery.

    Captured every six months at a 2.8-inch ground sample distance, Nearmap supplies Durham with clear images that are up-to-date and accessible through web-based cloud servers, the company said.

    The result is better monitoring of pavement conditions; time savings and documentation of road repairs; more detailed maps of city riparian zones; and accurate and detailed customer billing.

  • Nearmap introduces roof pitch and area tools for solar and roofing

    Nearmap introduces roof pitch and area tools for solar and roofing

    Nearmap high-resolution aerial image showcasing new toolset in MapBrowser, captured Sept. 15, 2018. (Image: Nearmap)
    Nearmap high-resolution aerial image showcasing new toolset in MapBrowser, captured Sept. 15, 2018. (Image: Nearmap)

    Nearmap has introduced a complete measurement toolset in MapBrowser for the solar, roofing and other rooftop industries.

    The new tools allow users to measure roof-pitch, height, width and area, enabling roofers and solar installers to confidently measure rooftops and structures from high-resolution oblique aerial images, the company said.

    The new MapBrowser helps customers significantly reduce onsite visits during the quoting and planning stages of projects and complements their remote roof/site inspection workflows, giving many small businesses the power of expensive systems that only large companies use.

    “Gone are the days of climbing on roofs to take measurements,” said Tony Agresta, executive vice president of product at Nearmap. “Delivered to the cloud within days of capture, our aerial imagery allows roofers, solar companies and other small businesses to carry out assessments from the comfort of their office. Once the domain of large companies, the new features provide businesses of all shapes and sizes with the tools they need to save time, plan and estimate more accurately at a fraction of the price.”

    Using Nearmap’s new tools, roofers and solar companies will be able to:

    • Prospect more efficiently by viewing and expanding opportunities through aerial maps instead of other, more traditional ways.
    • Process leads more quickly by qualifying prospects prior to visiting a potential job.
      Reduce costs associated with the qualification and proposal stages.
    • Create better proposals using up-to-date, high-resolution photos, giving companies a better chance at winning a client’s business.
    • Close more sales with the most accurate and competitive quotes.
      Increase revenue without adding systems or headcount.

    Businesses in construction, home building, painting, insurance and other industries can also benefit from these new tools to accurately measure areas on properties in three dimensions. Nearmap’s aerial imagery can help users to show context for work being done, and the imagery can be annotated with notes, drawings and measurements that provide details of the plan.

    Nearmap Oblique imagery can be accessed through a standard web browser using Nearmap’s intuitive MapBrowser application. In addition, Nearmap Oblique photos are published at sub-7.5cm ground sampling distance (GSD) — better than satellite imagery — which allows users to see great detail, Nearmap said.

  • Hurricane Florence impact revealed in Nearmap aerial imagery

    Newly captured aerial maps show before and after images to support cleanup efforts by public safety organizations, utility companies and insurance agencies.

    Aerial mapping company Nearmap has flown and captured aerial imagery in the areas in North and South Carolina impacted by Hurricane Florence.

    The imagery is already supporting the extensive cleanup and reconstruction efforts for public safety, utility companies, insurance agencies and numerous contractors in many industries.

    High-resolution captures from the Wilmington and Myrtle Beach areas are now online and available for immediate use with more areas scheduled to come online over the next several days.

    The post-hurricane coverage includes about 4,530 square kilometers around the coastline from Newport, N.C., to Myrtle Beach, S.C., covering a population of about 752,000 people.

    High-resolution imagery shows the impact of Hurricane Florence at Southport, North Carolina, comparing September 2017 to September 2018. (Image: Nearmap)
    High-resolution imagery shows the impact of Hurricane Florence at Southport, North Carolina, comparing September 2017 to September 2018. (Image: Nearmap)

    Before the hurricane, Nearmap had already covered more than 30,000 square kilometers in North and South Carolina with ortho imagery and more than 12,000 square kilometers with oblique imagery. With previous aerial maps taken at least once a year totaling over 140,000 square kilometers online, some of them dating back to 2014, users are able to compare current imagery with historical photos.

    “A key element to the recovery efforts is having access not only to high-resolution imagery from after the storm, but also to historical aerial captures from before the storm hit,” said Rob Newman, CEO and managing director of Nearmap. “Historical captures provide consistency and contrast, enabling crews to look at the current truth on the ground and compare it to previous time periods to help assess the damage along the coastlines.”

    All pre- and post-hurricane imagery can be accessed through a standard web browser using Nearmap’s MapBrowser, through Nearmap partners or via APIs to integrate with common GIS, CAD and other applications.

    All the Nearmap pre- and post-hurricane imagery is published at sub-3-inch ground sampling distance, which allows users to see great detail on the ground. At this resolution, they can clearly identify important ground conditions such as roof blow-off, property damage and flooding. The same is true for streets and all other ground features, providing details for users to complete analysis both pre and post storms.

    “Our thoughts are with the residents of North and South Carolina recently impacted by the hurricane,” Newman said. “We are pleased that Nearmap customers are using our imagery to help restore these neighborhoods, and help residents fix and rebuild after rooftop, flooding and other damage.”

    Nearmap customers use aerial imagery to assist in the following aspects of post-disaster cleanup:

    • Public Safety: Access to immediate, crystal-clear aerial imagery of areas affected by storm damage for emergency response routing and safety.
    • Utilities: View all areas where above-ground utilities have been affected and also see where infrastructure is down or damaged and causing hazards.
    • Reconstruction Efforts: Compare historical image captures with post-event imagery to see structure elements and provide proper measurements to rebuild.
    • Insurance: View impacted properties to see first-hand damage and potential structural damage.
  • Imagery works for growing city

    Image: Nearmap
    Image: Nearmap

    Location content provider Nearmap has partnered with the City of Durham, North Carolina, Public Works Department to upgrade its imagery on numerous projects.

    Using real-time imagery from Nearmap in the field, the department streamlines data collection and saves time and money.

    The department manages all infrastructure data for the city, including mapping the impervious area (structures that resist water infiltration) for the city’s $16 million a year Stormwater Utility Fee fund. “That is half a billion square feet of impervious area that we manage through digitization and review daily,” said Edward Cherry, city GIS administrator.

    After using several satellite imagery systems with low resolution and infrequent captures, Cherry and his 14-member GIS staff determined the city needed far superior quality in their mapping imagery to accommodate the city’s explosive growth.

    Captured every six months at a 2.8-inch ground sample distance, Nearmap now supplies Durham with up-to-date images accessible through web-based cloud servers.

    With Nearmap, the Durham Public Works Department has achieved better monitoring of pavement conditions; time savings and documentation of road repairs; more detailed maps of city riparian zones; and accurate and detailed customer billing.

    “With Nearmap, we’ve been able to update development processes and policies to support the revitalization of the downtown district as well as rapid city growth,” Cherry said.

  • City emergency support improved with Nearmap imagery

    Nearmap aerial imagery in ArcMap. (Screenshot: Nearmap)
    Nearmap aerial imagery in ArcMap. (Screenshot: Nearmap)

    The Shelby County, Tennessee, Emergency Communications District has implemented Nearmap high-resolution aerial imagery to geocode and plot new addresses and developments into its 911 mapping systems.

    The mapping systems help fire and rescue, emergency medical services and law enforcement get instant access to updated maps needed to get to the right locations as soon as possible.

    The Emergency Communications District is responsible for establishing local emergency telephone service, providing the network call-handling equipment, and updating the geographic information systems (GIS) data for each Public Safety Answering Point within Shelby County.

    Nearmap provides frequently updated, high-quality aerial captures to ensure that the district’s GIS data, geocoding and the 911 mapping systems are up to date, providing public safety and law enforcement the most accurate information, the company said.

    Benefits of Nearmap aerial imagery for the Emergency Communications District include:

      • The imagery is delivered through the cloud as a subscription service, making it accessible to all team members via mobile and desktop.
      • Nearmap imagery is taken at least twice a year, both leaf-on and leaf-off to provide different views of locations in different seasons.
      • Aerial captures integrate directly into Esri ArcMap, ArcPro and ArcGIS Online applications, so GIS information can overlay directly onto the high-resolution imagery.

    Before Nearmap, Shelby County’s aerial image process required a contracted flight to photograph the county areas. Because of the high cost of capturing those images, the county purchased images once every two years, after pooling resources from various county entities.

    “With our old aerial imagery provider, there were issues with mosaicking separate images together, and since the imagery was taken every two years, many rural and unincorporated areas were out of date,” said Timothy Zimmer, GIS administrator for Shelby County’s Emergency Communications District.

    With out of date images, the county had to develop alternate methods to locate addresses for the 911 systems. Now, the combined impact of data services, base maps, Nearmap imagery and third-party data are improving all aspects of public safety, including law enforcement, fire and emergency medical services, Nearmap said. Even other agencies are using the district’s imagery and GIS data.

    “There’s a certain context and currency you can get from Nearmap imagery that you simply can’t get from any other imagery products,” Zimmer said. “Other agencies, such as the County Clerk and the Utility Company, are using our addressing data because Nearmap has helped enable us to be much more current.”

  • Free ‘Cooking with GIS’ class shows how to serve up high-res imagery

    Free ‘Cooking with GIS’ class shows how to serve up high-res imagery

    A capture of the Buffalo and Erie County Botanical Gardens in Buffalo, New York, taken in May 2018. (Image: Nearmap)
    A capture of the Buffalo and Erie County Botanical Gardens in Buffalo, New York, taken in May 2018. (Image: Nearmap)

    Fresh off an eye-grabbing appearance showcasing its new 3D products at last week’s Esri User Conference, Nearmap will deliver a free “Cooking with GIS” webinar Thursday, July 26.

    The hour-long session will highlight ways that the company’s vertical, oblique and 3D aerial imagery can bring competitive advantage to surveyors, construction managers, telecomm engineers, city planners, realtors and investors, building contractors, property and natural resource managers, and many others. Using their geographic information systems (GIS) skills, these professionals can perform deep analysis and make decisions with confidence using detailed and up-to-date visual insights.

    Nearmap won 2017 Esri’s Best New Content Partner Award in 2017, and the free webinar, subtitled “Esri + Nearmap,” focuses on the key advantages of seamlessly integration the company’s high-resolution aerial imagery into Esri mapping and software products.

    Esri is an international supplier of geospatial information systems with more than one million users in 200 countries around the world. Nearmap’s ArcGIS Image Service Online provides users an easy and efficient way to incorporate high-resolution PhotoMaps within Esri ArcGIS Online. ArcGIS users can instantly access current 2.8” imagery within days of capture while also showing change over time using Nearmap’s historical archive.

    A New York City building site with temporary covered pedestrian walkway. (Photo: Nearmap)
    A New York City building site with temporary covered pedestrian walkway. (Photo: Nearmap)

    As an integral partner in the ArcGIS ecosystem, Nearmap helped integrate their imagery with a wide range of Esri software solutions—both off the shelf and bespoke. Coupled with Portal for ArcGIS, the Nearmap ImageServer can be used in any application that is able to talk to ArcGIS Server, delivering power to the platform.

    3D.  Nearmap recently brought dramatic change to the aerial imagery market, announcing a national survey program providing high-resolution oblique imagery and derivative 3D products from its patented HyperCamera2 technology. The new camera system provides a high degree of overlap from different angles, so Nearmap can reconstruct the real world in detail, producing not only high-resolution orthomosaic and oblique imagery, but also surface and terrain models, natural color point clouds and textured 3-D meshes.

    Users can immerse themselves in 3D textured mesh models, improving analysis and design activities. They can see different elevations and line of sight using the 3-D information. These features become important in many use cases, including airport or utility planning, or to determine the best location for a crane before a construction project.

    Other applications include wireless telecommunications network modeling, solar panel design, tactical resource deployment, real estate development promotion, property valuation, insurance underwriting and smart cities.

    Delivery.  Nearmap is delivered through a user-friendly interface called MapBrowser or accessed via Esri, Autodesk and other third-party solutions.

    Nearmap captures urban U.S. imagery multiple times per year, processes massive amounts of visual data, and uploads up-to-date aerial maps to the cloud within days. Patented imaging and processing technology delivery at speed of high-resolution aerial imagery as a service: orthographic (vertical) maps, multi-perspective panoramas and oblique aerial views.

    The fully cloud-based PhotoMaps are accessible instantly via desktop and mobile, with 70% of the U.S. covered in major metros.

    Clarity, color and 2.8″ GSD detail help users identify and accurately measure ground features with ease, detect change over time or monitor progress through the company’s library of precisely georeferenced historical imagery.

    Nearmap imagery is refreshed up to three times per year principal coverage areas, with three orthomosaic captures incorporating one oblique capture. Nearmap’s orthomosaic imagery already covers nearly 70 percent of the U.S. population dating back to 2014.

    Speakers on the July 26 webinar include Kevin Kwok, Nearmap technical product manager; Chuck Dostal, Nearmap geospatial technical engineer; and customer Mike Otillio, director of research for Colliers International, servicing the commercial real estate industry.

    Register now for the free webinar at env-gpsworld-integration.kinsta.cloud/webinar.

  • Why resolution of aerial imagery matters

    An oblique image with measurements of downtown Chicago, captured in June 2017. (Image: Nearmap)
    An oblique image of downtown Chicago, captured in June 2017, with measurements. (Image: Nearmap)

    Guest column by Sanchit Agarwal
    Vice President, Field Operations, Nearmap

    With high-resolution imagery comes the ability to model reality, creating real-life visualizations for engineers, planners, construction teams and many others.

    A quantum leap in computing capacity has allowed us to model and analyze the real world — all from our desktop and mobile devices. In days past, maps were purely for visualization and direction.

    Today, they have graduated to full-blown analytics platforms empowering users to make decisions faster than ever before.

    Why?

    They closely represent truth on the ground — truth created from high-resolution aerial imagery captured at heights of up to 18,000 feet. Camera systems mounted in the bellies of planes can efficiently map the real world in incredible high detail. These aerial photographs are updated continuously.

    In years past, access to aerial mapping content and services was reserved for more significant players.

    Today, with easy access to scalable high-definition mapping content, anyone can utilize the power of maps in applications that extend far beyond directions and navigation.

    There are two essential attributes of aerial maps driving this transformation — image resolution and model density. Today, most users are applying low-resolution satellite images that lack the detail needed for accurate decisions. But, as resolution increases, the imagery becomes more detailed; the visualizations, more vivid.

    Ground features have gone from fuzzy satellite photos to clearly identifiable homes, buildings, roads, lakes and more — all captured using powerful cameras that have found the perfect pixel. With high-resolution comes added benefit.

    Aerial image of the Aria Resort in Las Vegas captured in May 2017. (Image: Nearmap)
    Aerial image of the Aria Resort in Las Vegas captured in May 2017. (Image: Nearmap)

    Users can manipulate the imagery — zoom closer and closer without losing the details. Computers can classify the features, distinguishing skylights from solar panels, walking paths from sidewalks, and pools from ponds.

    Rich imagery is yielding richer data used to instantly query massive databases and return results that answer complex questions for businesses and government.

    With high-resolution imagery comes the ability to model reality, creating real-life visualizations for engineers, planners, construction teams and others.

    These models of landscapes, cities and neighborhoods are portrayed inside design tools and mapping systems, saving the analyst countless days of traveling to the site only to be surprised that the outdated low-resolution imagery does not depict what’s actually on the ground.

    Imagery can vary greatly in resolution. Pixel resolution refers to the actual distance on the ground that each pixel represents in the orthophotography — the vertical image. For example, one-foot pixel resolution means that each pixel in the image covers one foot on the ground.

    Common resolutions include three-inch, six-inch, one-foot and one-meter. The higher the imagery resolution (for instance, three inches per pixel), the greater the visible detail within the photograph. Clearly, a three-inch resolution is much better than a one-foot resolution.

    Most mapping content currently consumed is two-dimensional and generated from low to mid-resolution nadir imagery. In other words, you see the land as if you were staring straight down at it, not height-of-ground features and certainly not change over time.

    While that was adequate for some users, others reached for higher resolution and, while they were at it, decided they needed a third and fourth dimension — namely, height and time. These new perspectives provide more analytical options, more insights and a variety of new use cases that show change over time, height and multi-perspectives of the same property or landscape.

    With the democratization of mapping products and services and the general trend toward consumption of multi-dimensional experiences, there is an implicit need to increase resolution, detail, dimensions and perspectives in mapping content and services as well.

    The Rancho Mirage community of California, captured with QGIS in February 2017. (Image: Nearmap)
    The Rancho Mirage community of California, captured in February 2017. (Image: Nearmap)

    Traditionally, satellite imagery has been used to monitor large areas of the earth at scale remotely. The resolution of the satellite imagery has graduated from multiple meters to feet with the advent of advanced mapping satellites.

    The challenge here is the resolution. Low-resolution satellite imagery, although scalable, is good for macro-analysis of cities and neighborhoods but is not detailed enough for accurate measurements and micro-analysis at the level of each individual property.

    On the other end of the spectrum come drone mapping solutions that offer the promise of delivering incredibly high-resolution datasets (sub-centimeter resolution) but fails to provide the scalability and repeatability.

    Let’s get specific. Why does resolution matter?

    • You cannot measure what you cannot see. The resolution of imagery provides a more detailed, zoomed in and richer view of the real world, thereby enabling desktop based reconnaissance, inspection, analysis and measurement of features that are not traditionally visible in satellite imagery.
    • Higher resolution means high fidelity and dependable measurements. With the added details and definition of features that high-resolution offers comes the much-needed advantage of clearly and legibly identifying feature boundaries and hence measuring the feature with high precision and accuracy.
    • Higher resolution map content means fewer site visits. Rather than travel onsite to inspect and measure, many organizations are now relying on high-resolution imagery and, in the process, not having to waste resources sending team members on site.
    • High resolution means more detailed documentation of reality. Gamers have experienced reality-like landscapes for quite some time. Now, 3D and 4D mapping content allows users to immerse themselves in the landscape, navigate through street views, and fly like a bird to inspect rooftops with ease.
    • High resolution and refreshed content means more accurate change analysis. Identifying how locations have changed over time through multiple captures that embody leaf-off and leaf-on imagery allow users to not only visualize detail but also notice progress, changes in construction, degradation of property features, growth in vegetation and more.
    • High-resolution content means more automated workflows. High-resolution content allows for better feature definition models resulting in higher success rates in interpreting and analyzing the reality algorithmically. Higher success rates of automated algorithms results in efficient exploitation of datasets to solve real world problems.
    • Machine learning thrives on high-resolution content. There’s no shortage of news on the use of machine learning and artificial intelligence in data science. With the advent of high-resolution maps, machine learning is now able to differentiate skylights from solar panels, decks from patios and pavement from pavers. In turn, the ground features identified are being stored in databases for lightning fast queries to complex problems.

    The higher the resolution, the higher your confidence will be.