A “GNSS radial survey” is a surveying technique where a central control mark is established within an area, and vectors are measured from the central control mark to various other marks of interest surrounding the central control mark, essentially creating a “spoke-like” network design.
Plot of OPUS Projects network diagram. Hub is Addicks CORS, all marks are simultaneously observed during the session. (Photo: Dave Zilkoski)
Why not use a GNSS radial survey when establishing geodetic control networks?
Basically, you cannot directly calculate a “relative accuracy” between two marks if no observations are taken between them. That said, a direct measurement such as a GNSS vector allows error propagation between two marks. Therefore, using the “spoke-like” concept, you know the relative accuracy between the central control mark and a single mark at the end of a single spoke. Still, you don’t know the relative accuracy between marks on the different spokes.
Anyone who has used OPUS Projects or seen presentations on OPUS would think, based on the OPUS Project’s HUB processing strategy, that OPUS Projects was performing a radial survey.
When using OPUS Projects, NGS recommends that users select one CORS as a HUB while processing GNSS session data. In the example here, the Addicks CORS (ADKS) was used as the HUB in data processing. So, why is this not considered a radial survey? It may look like a GNSS radial survey but there’s a lot that goes on behind the scenes.
The bottom line is that OPUS Projects is denoted as a simultaneous (session) processor. This means the vector solution is computed from simultaneous processing of all independent vectors with mathematical correlations between all simultaneously observed vectors. OPUS Projects processing includes all independent vectors along with mathematical correlations to provide the relative connection to marks that are simultaneously observed. In the example above, when processed by OPUS Projects, all the marks occupied (indicated by the lines connecting to the Addicks CORS HUB) will have correlations computed between each other. These correlations are included in the data that is used in the least squares adjustments that are performed during the OPUS Projects workflow (NGS uses a file denoted as the gfile to document the correlations.)
The image below provides a sample of mathematical correlations between marks simultaneously observed during the session. The gfile can be a large file when the survey includes a lot of simultaneously observed marks because there will be correlations between all marks. There were 13 marks simultaneously observed during the sample session, so the “spoke-like” diagram includes imaginary lines between every mark because of the mathematical correlations between these marks.
Excerpt from an output from simultaneous (session) processing. (Gfile contains baseline information with mathematical correlations.)
Dan’s presentation included a slide that described the file’s format. The file provides information on the vectors (delta X, delta Y, delta Z and their standard deviations) between the HUB and the individual marks, plus the mathematical correlations between all marks simultaneously observed during the session. I have highlighted a vector’s components and standard deviations and a set of mathematical correlations.
The image below, from Dan’s presentations, describes the format of NGS’s gfile.
Photo: NGS
Some software programs perform what is called sequential (baseline) processing, which involves processing one vector at a time and ignoring the mathematical correlation between baselines observed in the same session. So, what does this mean, and why is it important?
A couple of definitions are necessary to understand the concept. Independent baselines are baselines where no other baseline is a linear combination of another baseline. Linearly dependent (trivial) baselines are baselines that are linear combinations of another baseline. Basically, once you have used a particular set of data to compute a vector, you can’t use the same data to compute a different vector.
Dan did a nice job during his webinar explaining what baselines are considered trivial and what baselines are non-trivial. This is very important because if your software is a sequential (baseline) processor, you must ensure that trivial vectors are not included with the non-trivial vectors. As Dan highlights in his webinar, dependent vectors are not additional observations. But they do offer useful information if treated properly.
Photo: NGS
There was a 1992 study performed by Michael Craymer and Norm Beck, “Session Versus Baseline GPS Processing,” that explained the differences between sequential baseline processing and simultaneous (session) processing, and what the user needed to do to use sequential baseline processing. Basically, when all the trivial vectors are added to the adjustment, they are treated like additional independent observations, resulting in an inflating degree of freedom and overly optimistic error estimates. If all possible vectors are processed, then resulting coordinates may essentially be the same as in simultaneous (session) processing, but statistics will be overly optimistic and misleading. The 1992 paper does state that the two different processing techniques can produce the same results.
“It is shown that using all possible baseline solutions (with the covariance matrix scaled by n/2, where n is the number of simultaneously observing receivers) is mathematically equivalent to session processing with all correlations only under certain conditions. This equivalence is verified empirically using simulated and real data. However, the conditions under which this equivalence holds are difficult to achieve in practice.”
Users who process data using a sequential processor should read the 1992 study by Craymer and Beck to understand the conditions under which the two processes generate the same results.
I would encourage all individuals that process GNSS data, regardless of which software you use, to download the NGS OPUS User Forum webinar. NGS also has a website that provides training material on the use of OPUS Projects. The more you know about the software you use, the better you will be prepared to address issues associated with your survey results.
Well, it’s January 2025 and it’s almost here — that is, the release of the beta version of the new, modernized National Spatial Reference System (NSRS) – NATRF2022, PATRF2022, CATRF2022, MATRF2022 and NAPGD2022.
This newsletter will highlight some activities associated with the new NSRS. That said, this is short notice, but I would like to highlight that there is a webinar and workshop that will address the new NSRS scheduled for Jan. 9, 2025 — TRB workshop, “Navigating the Modernized National Spatial Reference System: A Geospatial Odyssey” and NGS webinar “Updates to Products and Models within the North American-Pacific Geopotential Datum of 2022.” I will provide more details on this later in the newsletter.
The modernization of the NSRS is scheduled to occur in 2025 or 2026. NGS intends to release associated tools and services within five years of the modernization. The following details from the Federal Register outline the process for the rollout of the modernized NSRS:
NGS plans to roll out components of the modernized NSRS in 2025 or 2026. As each component is released at beta.ngs.noaa.gov, it can be publicly tested with feedback provided to NGS. The testing will continue for at least six months after the final component is released on beta.ngs.noaa.gov.
Once testing is complete and all modernized NSRS components appear to be stable and correct, the Federal Geodetic Control Subcommittee (FGCS) will be asked to vote to approve the modernized NSRS (likely in 2026). If FGCS approves the modernized NSRS, NGS will publish an FRN announcing the approval of the modernized NSRS and begin a several-month process of transitioning all modernized NSRS components to the official website at geodesy.noaa.gov. During this transition, the beta website may be wiped of submitted data and no further submissions to the NGS IDB (the repository for the current NSRS) will be allowed.
Excerpt from Federal Register Notice. (Photo: Federal Register website)
What does “Only one major improvement to the current NSRS is expected during this time: ITRF2020 will be integrated in all products and services” mean? I understand that one product that ITRF 2020 will be integrated into is the NOAA CORS Network (NCN). The CORS coordinates and velocities will be updated with ITRF 2020 values. That said, NGS datasheets will still provide coordinates in NAD 83 (2011), epoch 2010.0.
As I’ve mentioned in previous newsletters, time really is running out and users need to obtain a working knowledge of the new, modernized National Spatial Reference System. For those attending the104th TRB Annual Meeting on Jan. 5-9, 2025, in Washington, D.C., there is a scheduled workshop on the modernized NSRS. The workshop is sponsored by TRB Geospatial Data Acquisition Technologies Committee (AKD70). The workshop, titled “Navigating the Modernized National Spatial Reference System: A Geospatial Odyssey,” will be held on Thursday, Jan. 9, 2025, from 9:00 am to noon, in room 202B in the Convention Center in Washington, D.C.
Thurs., Jan. 9, 2025 9:00 am to 12:00 pm Room 202B, Convention Center Washington, D.C.
This workshop will cover the following topics:
Why the NSRS is being updated
The key goals of the modernization effort
Timeline, standards and technology considerations
The Geospatial Data Act of 2018 and its impact
There will be a discussion about the replacement of the North American Datum of 1983 and vertical datums and implications for existing workflows
There will also be a discussion about use cases and practical scenarios, how to transition and how to leverage new technology and tools.
For those interested in more information on the TRB AKD70 committee, my August 2024 GPS World Newsletter highlighted activities associated with the Transportation Research Board’s ADK70 Standing Committee on Geospatial Data Acquisition Technologies.
Since the new NSRS will be introduced this year, it is time for users of the NSRS to get familiar with the NOAA Technical Memorandum NOS NGS 92 document titled “Classifications, Standards and Specifications for GNSS Geodetic Control Surveys using OPUS Projects” written by Dave Zenk and Dan Gillins, Ph.D., National Geodetic Survey, published on Oct. 23, 2024. This document provides the specifications users must adhere to when submitting GNSS projects to NGS for review and publication.
Photo: NGS website
The section below explains the purpose of the document. There are a few items that I have highlighted in the preface that users should be aware of:
The document replaces NOAA Technical Memorandum NOS NGS 58 and NOAA Technical Memorandum NOS NGS 59
Users will need to follow these specifications for all projects that will be submitted to NGS using OPUS Projects for review and publication
This publication supplements Standards and Specifications for Geodetic Control Networks issued in September 1984 (Bossler 1984).
This publication replaces NOAA Technical Memorandum NOS NGS 58 Guidelines for Establishing GPS-Derived Ellipsoid Heights (Standards: 2 cm and 5 cm), Version 4.3 (Zilkoski et al. 1997) and also replaces NOAA Technical Memorandum NOS NGS 59 Guidelines for Establishing GPS-Derived Orthometric Heights (Zilkoski et al. 2008).
This publication provides classification, standards, and specifications for GNSS geodetic control surveys that use Global Navigation Satellite Systems (GNSS), which will be submitted to NGS using OPUS Projects for review and publication. These types of surveys were not well-established by the dates of the 1984, 1997, and 2008 publications, nor did OPUS Projects exist. In addition, since 2008 GNSS technology has improved and considerable research has been done into the best practices regarding these surveys and the analyses of achievable results (e.g., Allahyari et al. 2018; El Shouny and Miky 2019; Gillins and Eddy 2015, 2017; Gillins et al. 2019a; Gillins et al. 2019b; Jamieson and Gillins 2018; Park et al. 2018; Schenewerk et al. 2016; Soler and Wang 2016; Wang and Soler 2013; Wang et al. 2017; Weaver et al. 2018). That research supports this publication.
This publication is specifically limited to supporting OPUS Projects (version 5.x), the current North American Datum of 1983 (NAD 83), the North American Vertical Datum of 1988 (NAVD 88) and other current vertical datums that are officially recognized by NGS. Future versions of OPUS Projects and future datums will require revision of this publication.
I highlighted some important sections of the April 2023 webinar in my May 2023 newsletter. Future newsletters will address the specifications in more detail, but I would encourage readers to download the NGS 92 document and the April 13 webinar and slides.
On Dec. 18, 2024, NGS sent an email to individuals on NGS’s listserv informing them that they have made several updates to the NAPGD2022 products and that these updates are now available on the NGS alpha site.
NGS Dec. 18 newsletter. (Photo: NGS website)
To explain the product updates, NGS has scheduled a webinar for Jan. 9, 2025, to discuss the North American-Pacific Geopotential Datum of 2022 (NAPGD2022).
As previously stated in my newsletters, users should obtain a working knowledge of the new, modernized National Spatial Reference System. NGS publicly given presentations that have been collected for public viewing can be downloaded here.
I would like to wish everyone a Happy New Year and a year filled with exciting opportunities.
My previous newsletter highlighted the Fall HSRP meeting that discussed how The Ohio State University and Michigan State University have made great progress in developing useful tools for the development and implementation of the new, modernized National Spatial Reference System (NSRS) in 2025. This newsletter will highlight the updates to vertical datums that The National Oceanic and Atmospheric Administration (NOAA) is working on.
Below is an excerpt of the agenda for the material that I will highlight in this newsletter. As I mentioned in my last newsletter, the HSRP website provides links to reference documents, presentations and recordings. I would encourage everyone to download the presentations or listen to the recordings to obtain all the details.
This newsletter will highlight the session on the vertical datums, including the International Great Lakes Datum (IGLD).
NGS has created a website that provides brief explanations with additional links for detailed information on the National Tidal Datum Epoch (NTDE), International Great Lakes Datum (IGLD) and Gravity for the Redefinition of the Vertical Datum (GRAV-D). The site highlights that NOAA is currently working on three major updates to vertical datums: the 1983-2001 NTDE, the International Great Lakes Datum of 1985 (IGLD 85), and the North American Vertical Datum of 1988 (NAVD 88). The site provides information on why the datums need to be updated.
Excerpt from NTDE. (Photo: NOS website)
The box titled “Excerpt from NTDE“ provides information about the NTDE. It explains what the NTDE is, what NOS is doing, and why the NTDE needs to be updated. If you click on the link titled “National Tidal Datum Epoch update” on the right side of the webpage, it provides more information and links about the NTDE update, such as how will the NTDE update impact you.
The National Tidal Datum Epoch (NTDE) is a 19-year time period established by the National Ocean Service for collecting observations on water levels and calculating tidal datum values (e.g. mean sea level, mean lower low water). The NTDE needs to be regularly revised to account for long-term effects of land movement, sea level rise, and changes in tidal constituents. Tidal datums and their data are used to generate products and services necessary for safe navigation, coastal hazard mitigation, ecosystem research, coastal engineering and marine boundary demarcations.
The NTDE Update: New Tidal Datums are Coming!
NOAA currently utilizes the 1983-2001 National Tidal Datum Epoch. This epoch is now undergoing revision and will be replaced by the fifth iteration of the NTDE. Measurements for the update will be based on water level data spanning the years 2002-2020. Once all data has been collected, NOAA will review, analyze, and generate revised datums. The current proposed release date for new NTDE products is after 2026.
The website also highlights two other NOS projects – the International Great Lakes Datum and the Gravity for the Redefinition of the Vertical Datum (GRAV-D). Again, if you click the “International Great Lakes Datum update” link on the right side of the webpage, it provides more information and links about the IGLD update such as how will the IGLD update impact you. Clicking the “Gravity for the Redefinition of the Vertical Datum” link on the right side of the webpage provides some more information and links about vertical datums.
Photo: MOS website Photo: NOS website
On the second day of the meeting, Jacob Heck, NOAA National Geodetic Survey (NGS), and Sierra Davis, NOAA Center for Operational Oceanographic Products & Services (CO-OPS), gave a presentation providing details on the update to the International Great Lakes Datums of 1985 (IGLD 85). The presentation addressed the following topics:
Define IGLD
Significance of the Great Lakes and need for a common water level datum
Binational coordination and mandates
Why IGLD needs to be updated
Updating the datum
Crucial observational infrastructure
Differences in IGLD (1985) and IGLD (2020)
Future of accessing the datum
Status of IGLD (2020) development
Project milestones to roll-out
Unresolved questions: low water datum
Outreach efforts underway
I have provided a few slides highlighting parts of the presentation. Again, the HSRP website provides links to reference documents, presentations, and recordings. I would encourage everyone to download the presentation or listen to the recording to obtain all the details. The presentation of the IGLD starts at 1:34:00 on the recording.
Photo: HSRP website
They explained the importance of the requirement for the coordination of water levels on the Great Lakes between Canada and the United States and the reason for establishing an international datum.
Photo: HSRP website
Due to land deformation, the IGLD is periodically updated, typically every 25 to 30 years. That is, an uplift in the northern region and subsidence in the southern region of the Great Lakes. See the box titled “Land Deformation in the Great Lakes.”
Land deformation in the Great Lakes. (Photo: HSRP website)
The IGLD was updated in 1955 and then again in 1985. This update is overdue by a few years. That said, it will be aligned with the new modernized NSRS and allow for more seamless updates in the future.
Photo: HSRP website
The presentation highlighted that the expected changes between the old datum, IGLD 85, and the new datum (IGLD 2020) will range from 30 cm to 65 cm.
Photo: HSRP website
The IGLD community measures hydraulic heads for water management using dynamic heights, not orthometric heights. The presentation explained why IGLD uses dynamic heights and how GNSS technology will be used to estimate IGLD dynamic heights.
The IGLD team have been working on getting the message out to the user community. The September 2024 HSRP presentation is just one example. Here’s a summary of the recent and future outreach activities:
Recent engagements:
All-Interested Congressional briefing (May 2024)
Canadian Hydrographic Conference (May 2024)
Canadian Geophysical Union Conference (May 2024)
IAGLR (May 2024)
Soo Locks Engineers Day (June 2024)
Michigan Sea Grant briefing (Jan 2024)
Illinois Coastal Management Program briefing (Sept 2024)
Upcoming:
Coordinating Committee’s ESG (TBD)
Boards of Control (Spring 2025)
2024 Great Lakes Conference, Chicago, IL
US Hydro 2025, Wilmington, NC
IAGLR 2025
The slide titled “Key Takeaways” summarized the essence of their presentation.
This newsletter highlighted NOS’s Tail of Three Datum website. The website provides brief explanations with additional links for detailed information on the National Tidal Datum Epoch (NTDE), International Great Lakes Datum (IGLD), and Gravity for the Redefinition of the Vertical Datum (GRAV-D). The site highlights that NOAA is currently working on updating the 1983-2001 NTDE, IGLD 85, and North American Vertical Datum of 1988 (NAVD 88). The newsletter also discussed the presentation on the International Great Lakes Datum (IGLD) 2020 that was given at the 2024 Fall HSRP meeting. Again, the HSRP website provides links to reference documents, presentations, and recordings. I would encourage everyone to download the presentations or listen to the recordings to obtain all the details.
The HSRP is a federal advisory committee that provides NOAA with independent advice on improving the quality, efficiency, and usefulness of NOAA’s navigation-related products, data, and services. The HSRP advises the NOAA Administrator about its navigation (i.e. nautical charts and ENCs), physical oceanographic (i.e. tides & water levels), geospatial, positioning, and coastal and shoreline programs, products, and services. There are two public meetings each year in different port regions at which public comments from stakeholders and partners are sought. Most of the meetings include webinar capability for those not in the area.
See an excerpt below of the agenda for the three-day meeting. These meetings are open to the public and I would encourage anyone interested in the activities of these program offices to participate in the meetings. Participants can attend in person or virtually via webinar. I participated in the meeting in virtual mode. The HSRP website provides links to reference documents, presentations, and recordings.
This newsletter will highlight the session on the NGS Geospatial Modeling grants.
Excerpt from the HSRP 2024 Fall Meeting Agenda
September 24, 2024
Presentations:
Opening and welcome
Mr. Sean M. Duffy, Sr
Mr. Mark Schrupp
Sen. Peters (MI), video
Rep. Theander (MI), video
Ms. Rachael Dempsey
RDML Benjamin Evans
Opportunities and Challenges for the NOS’s Navigation Observations and Positioning Portfolio
Moderator: Ms. Rachael Dempsey
Dr. Larry Mayer
Dr. Marian Westley
RDML Benjamin Evans
Dr. Shachak Pe’eri
Directors FSK update
Local, Regional, State Stakeholder and Partner Perspectives on NOAA Navigation Services
Moderator: Mr. Eric Peace
Capt. Richard Armstrong
Mr. Paul LaMarre
Capt. Tony Brandano
Capt. Peter Barry
Mr. Derek Cusimano
Underserved Communities Mapping and Charting needs in the Great Lakes Region
Moderator: Mr. Nathan Wardwell
Dr. Jennifer Boehme
Ms. Stephanie Gandulla
Mr. Ed Bailey
September 25, 2024
Vdatum
Dr. Shachak Pe’eri
International Great Lakes Datum (IGLD)
Dr. Jacob Heck
Ms. Sierra Davis
HSRP Working group:
HSRP Technical Working Group Report
September 26, 2024
NGS Geospatial Modeling Grants
Moderator: Mr. Galen Scott
Dr. Jeff Freymueller (Ph.D.)
Ms. Mara Figueroa Berrocá
Great Lakes Perspectives on National Drivers
Moderators: Mr. Nathan Wardwell and Mr. Eric Peace
Ms. Erika Jensen
Mr. John Bratton
Mr. Mark Breederland
Mr. Ryan Chatland
NOAA Center of Excellence for Operational Ocean and Great Lakes Mapping
The session on NGS geospatial modeling grants provided updates by representatives from MSU (Jeff Freymueller) and OSU (Mara Figueroa Berroca). I have provided a few highlights below, but I encourage everyone to download the presentations and/or listen to the daily recording.
Freymueller highlighted that keeping the error in coordinates small in a spatial reference system is hard to do in a deforming Earth. This is very important to all users of the National Spatial Reference System (NSRS). Not all CORS are created equal, and their coordinates can change based on various factors such as earthquakes, equipment changes, and local deformation due to the extraction of groundwater. Therefore, efficiently and effectively monitoring the CORS is necessary to quickly identify issues and correct coordinate values in a timely manner. MSU developed a CORS Dashboard that provides a tool for monitoring CORSs. Freymueller provided a slide depicting an example of a CORS in California. See the image below.
MSU CORS dashboard. (Photo: HSRP Website)
Plots of GLO2. (Photo: HSRP Website)
That said, Freymueller stated that crustal deformation and changes in CORS coordinates is not just a California issue. He provided a slide of a plot of a station in Wisconsin (see the image below.) The plot highlights changes in values where there’s an undocumented offset, a change in antenna, and an elastic deformation due to a change in water load in the Great Lakes.
Plot of ABMS. (Photo: HSRP Website)
As previously mentioned, keeping the error in coordinates small in a spatial reference system is hard to do in a deforming Earth, especially when so many factors affect coordinates, such as the changing load of water on the Great Lakes. The MSU CORS Dashboard will provide a tool for monitoring the CORS and identifying issues associated with coordinates of the CORSs.
The MSU CORS Dashboard plans include having different modules for various purposes:
Compare Solutions:
With other solutions
With Velocity Model
Compute and Display Metrics and select CORS stations based on metrics.
Earthquake and Postseismic Deformation Modeler:
Ingest fault model solutions and generate predictions
Statistics on agreement of different fault models
How well do the range of geophysical models agree?
Forward predict postseismic deformation
The MSU CORS Dashboard provides information about CORSs that could be useful to surveyors and mappers when performing and analyzing a GNSS survey project. For example, one module will compute and display metrics about individual CORSs, providing surveyors with the appropriate information to select the best CORSs for their GNSS project. NGS and MSU will determine how this CORS Dashboard is incorporated into NGS products and services.
Another phase of the MSU geospatial modeling grant included developing a geodesy program to help address the U.S. geodesy crisis. The presentation provided several slides with information on students obtaining a master’s degree in geodesy. The coursework for the two-year online program is divided into four thematic areas: Foundations of Geodesy, Fundamentals of Geodesy and Geophysics, Mathematical and Computational Concepts, and Geodetic Methods and Applications. Students will take a mix of courses (no thesis) from the consortium institutes – MSU, Michigan Technological University (MTU and the University of Alaska Fairbanks (UAF).
The following is a Timeline for Development:
2024: Develop University consortium agreements and establish structure for master’s program
2024/2025: Develop courses
Fall 2025: Launch program with first class of students
Freymueller mentioned that the timeline for launch currently feels optimistic due to bureaucratic hurdles dealing with the consortium agreements, but they are continuing work on the development of courses. Further newsletters will provide updates on the progress of the program.
Outline of Geodesy Master’ Degree
Foundations of Geodesy
Courses:
Map Projections (MSU)
Geodetic Models (MTU)
Both courses required
Courses provide backgrounds in mapping, projections, datums, reference frames, and transformations.
Fundamentals of Geodesy and Geophysics
Courses:
Modern Geodesy and Applications (MSU) or Geodetic Methods and Applications (UAF)
Geodetic Data Processing and Analysis (MSU)
Solid Earth Geophysics and Geodynamics (MSU) or Foundations of Geophysics (UAF)
Positioning with GNSS (MTU)
Students choose at least 2 courses
Courses provide background in geodetic theory (including orbit determination and GNSS and imaging satellite systems), measurement and interpretation of steady state and time variable motions within the solid Earth, cryosphere, and hydrosphere, data processing, and geophysical modeling.
Mathematical and Computational Concepts
Courses:
Introduction to Numerical Tools for Earth and Environmental Sciences (MSU)
Programming and Automation for Geoscientists (UAF)
Data Analysis and Adjustments (MTU)
Inverse Problems and Parameter Estimation (UAF)
Numerical Analysis (UAF)
Students choose at least 2 courses
Courses will provide foundation in programming and mathematical techniques (including inversion theory and linear regression) essential for geodesy
Geodetic Methods and Applications
Courses:
3D Surveying and Modeling with Laser Scanning Data (MTU)
Courses extend knowledge into additional land- and satellite geodetic techniques, network design, and geophysical applications
The second presentation on the geospatial modeling grants was titled “Developing a Fully Kinematic, Backwards-Compatible Reference Frame for the Continental United States of America and Canada,” presented by Mara A. Figeroa, OSU.
OSU Presentation. (Photo: HSRP Website)
Figeroa outlined the following project goals:
Development of the operational (sandbox) kinematic reference frame (KRF).
Develop automation processes to detect and model deformation resulting from earthquakes, GIA and other crustal motions.
Parallelization wrapper for M-PAGES (adapted from our existing Parallel.GAMIT)
Process all existing data in the U.S. and Canada
Creation of Intraframe deformation models (i.e. trajectory prediction models)
Use GNSS and InSAR aided by AI to access the conventional epoch of the frame.
Provide the users with maps of “stable areas” to facilitate access to the frame using differential processing.
Figeroa noted that the coordinates and model parameters defining the reference frame are time-dependent in a National-Level Kinematic Reference Frame (KFR). The KFR needs to provide multiple conventional epochs that are accessible to all users anytime and anywhere to guarantee topologic homogeneity. Models need to be updated to account for the changes in coordination due to earthquakes and other deformation events. Figeroa stated, “Kinematic implies constant update of the reference frame parameters to ‘honor’ the frame’s internal geometry.”
OSU has developed what they denote as a Geometric Geodesy Processing Line (GGPL) to evaluate and analyze CORSs data. They are processing all CORSs data to identify issues with the data that could be due to various factors such as crustal deformation and equipment changes. The tool highlights stations with a potential warning flag issue (see OSU Interactive GGPL).
OSU Interactive GGPL. (Photo: HSRP Website)
The system is automated, but they have developed interactive visual tools so researchers can review the results of each station. The visual interactive GGPL provides metadata about the station such as coordinates, maps, photos, and dates of installation of equipment.
OSU Interactive GGPL – Location and Photo. (Photo: HSRP Website)
OSU Interactive GGPL – Equipment. (Photo: HSRP Website)
OSU Interactive GGPL – Coordinates and Other Metadata. (Photo: HSRP Website)
One feature of the GGPL is that it generates plot changes in coordinates over time (see the image below). I recently participated in a School of Earth Science Advisory board meeting at OSU and visited with Demian Gomez, Ph.D., the project’s lead principal investigator.
Demian demonstrated the GGPL tool for me. I was really impressed at how fast the system was, as well as how much information it provided in a user-friendly format. In my June 2024 GPS World Survey Scene newsletter, I highlighted an issue I found with an antenna change at a CORS in Texas. I ask Demian to pull up the information for the same site. The GGPL highlighted the same antenna change and shift in coordinates that I found. This feature is important to developing an intraframe deformation model (IFDM). How NGS will use this in the development of the IFDM2022 for the new, modernized NSRS will be determined later by NGS.
An important aspect of an IFDM is to identify and model changes in coordinates due to crustal deformation. As mentioned by Freymueller, modeling earthquake and other deformation events is extremely important to maintaining an accurate spatial reference frame. OSU GGPL tool assists in identifying potential deformation due to earthquakes.
OSU Interactive GGPL – Detection of Earthquakes. (Photo: HSRP Website)
OSU’s process includes developing trajectory prediction models (TPM). Trajectory prediction models need to be continuous in space and time to predict the behavior of passive benchmarks. Accurate trajectory prediction models will ensure access to a geodetic reference frame after big earthquakes utilizing accurate post-seismic coordinates. OSU’s process includes developing techniques for observing GNSS networks in sparse areas to improve the model’s predictability. My May 2024 GPS World Survey Scene newsletter highlighted Demián’s extensive experience modeling time-dependent coordinates and several papers published in the Journal of Geodesy addressing this topic. The papers have demonstrated the model’s effectiveness in earthquakes in Argentina and have developed tools that provide coordinates in updated reference frames based on the models. This is important to users of the new, modernized NSRS because the accuracy of the IFDM2022 model is vital to providing accurate Reference Epoch Coordinates (RECs) in the new, modernized NSRS. See my August 2022 GPS World Survey Scene Newsletter for information on RECs and my May 2024 GPS Newsletter for more details on Demián’s work.
Model of Co-seismic Component. (Photo: HSRP Website)
This newsletter highlighted the progress that OSU and Michigan State University have made in developing tools that will be useful for developing and implementing the new, modernized NSRS in 2025.
As I previously mentioned, I would encourage everyone to download the presentations and recordings for more details. The recording of the session on NGS Geospatial Grants can be found on the Sept. 26, 2024, recording. (The session on NGS Geospatial Grants starts at 1:02:45 on the recording.)
Similarly to my previous newsletter, I want to remind everyone that in less than a year, NGS will finalize the new terrestrial reference frames and geopotential datum. Time really is running out and users need to obtain a working knowledge of the new, modernized National Spatial Reference System.
On Sept. 10, the GeoGov 2024 Summit hosted a panel discussion between NGS and other federal and industry leaders on the modernized National Spatial Reference System (NSRS). High-level management and leadership officials attended the conference, which was a great place to network and collaborate with federal agencies.
Panel session on NSRS modernization.
As you can see from the announcement, the panel members represented a wide range of users of the NSRS. They were asked to address the following four topics based on their perspective of the rollout of the new, modernized National Spatial Reference System:
Benefits of Modernization
Challenges of Modernization
Opportunities Provided by Modernization
Next Steps in Collaboration
As one would expect, there was a wide range of responses based on the individual panel’s perspective of what the new, modernized NSRS means to their products, services and constituents. Even though there were many responses based on the individual panel’s perspective, there were many common ideas. This newsletter will highlight some of the bullet points presented by the panel members during their presentations. I attempted to combine similar statements for every topic under a common theme.
Summary of Benefits of Modernization
A unified four-dimensional system will finally provide a sustainable spatial reference frame for managing the state’s geospatial resources.
Combining of horizontal and vertical datums in one system
Improved spatial data quality – both horizontal and vertical
Simplification in which vertical reference frame and GEOID to use in local areas with the new NAPGD2022
Improved accuracy of the horizontal and vertical coordinates
A common “language” or framework for spatial data
Greater consistency in non-CONUS areas like AK, Hawaii, PR, and USVI
We can write NSRS requirements into any task order for acquisition
Additional uniformity for surveying practitioners
Better spatial data sustainability
The unification of marine and terrestrial geoids is important for managing our valuable coastal resources (all heights should be geoid based)
Closer integration with tidal datum information
Improved height information will enable us to provide the most accurate data possible
Direct relationship to ITRF2020 offers the ability to deliver the intra-frame deformation model through real-time networks
The introduction of reference epochs on NGS geodetic survey benchmarks and the time-dependency of the datums
The ability to more easily link the data to ITRF
Expansion of low distortion projection (LDP) systems
Lack of metadata within historical information to adapt to the new datum
Ensuring data fidelity, now and always! (METADATA)
People and processes; not technology
Users with lack of understanding of a time-dependent datum
Surveyor making time to learn about new datum
Understanding the impact of the new system to your products and services
How do we convince them to effectively transition all their historic data to the latest reference system?
Confusion among end users in understanding geodetic terminology and time-dependent way of perceiving coordinates
Adequate understanding by all stakeholders
Degrading coordinates and heights can impact reliability over project lifespans (NGS may not be able to respond to natural changes and emergencies)
Maintaining an accurate deformation model for use by many geospatial users in their specific workflows
Updating specifications on ground surveys for lidar and ortho projects that are processed through OPUS (How do we better educate our team and partners on what can be considered accurate for those observations)
Updating of existing surveying equipment to include new datum
Potential confusion in reported accuracy as it relates to changes in epoch vs. actual error of the equipment (ground-based or aerial/satellite) and the approach used to measure the feature
Transformations to new datums may incur costs if partners do not want to “modernize” data (Potential of needing two copies of data delivered)
Will need to develop policy deciding if we “modernize” all our older/existing data, or just start with the new NSRS at a certain point in time
Need operational software that reprojects/transforms data – especially large, bulk features (e.g., lidar point clouds)
Combining legacy data with modern data can lead to loss of data fidelity and often difficult to recognize changes to the data
Many challenges were mentioned, but I found it interesting that panel members highlighted issues with the user’s lack of understanding of the new system’s impact on their products and services. It is about people, not the processes or new technology. This was not surprising to me because this was an issue when NGS implemented the North American Vertical Datum of 1988 (NAVD 88). I know this firsthand because I was the NAVD 88 Program Manager while working for NGS. Surveyors and mappers are used to dealing with new technology and datum changes. Still, management and leadership have different issues that need to be addressed for new technology and datum changes. Hopefully, the management and leadership that attended the GeoGov 2024 Summit will start identifying how their products and services will be affected by the new NSRS and developing implementation plans.
Summary of Opportunities Provided by Modernization
Increased collaboration between private entitles and public agencies
Providing better service
Reducing cost
Improving safety and welfare
Expanding innovation
More reliable data for monitoring trends in infrastructure
Providing efficient and cost-effective tools and processes for users to update their mapping products to the new reference system
More accurate data collection/dissemination to benefit the public
More uniformity of data collection between surveyors
Improved reliability of advanced positioning built on the new NSRS
Improved heights for flood mapping products for forecasting, infrastructure planning and design, and accessibility using GNSS
Facilitates integration of tidal datum, critical to coastal science and industry
Allows for unification with SAR imagery and satellite altimetry, improving earth observations and mapping products
Improved Change Detection estimations
Better metadata descriptions for understanding times of collections
Increased vertical data for monitoring existing conditions
More accurate representation of the Earth’s surface over time as it lates to coastal change (sea level rise, flood modeling, coastal erosion, etc.)
Compensating for workforce attrition
As in any new paradigm, there are opportunities for increased collaboration between users and the development of new products and services. The panel members highlighted opportunities to provide better service to customers, develop more efficient and cost-effective tools for users and improve coastal change detection models.
Next Steps in Collaboration
Cross promotion of new datums within likeminded professions
Recruitment into geospatial professions
Increased awareness of the importance of the geospatial professions
New or expanded collaborations across professions
Leveraging non-federal resources and their active user communities spanning surveying, geophysical science, regional governmental agencies, industry, and academics
Working together to convince state/local agencies to adopt the new datums
Working with geospatial societies (NSPS, AAGS, ASPRS, URISA,etc.) for impact awareness
Working together to identify the new NSRS impact on your products and services
Guidance from professional organizations and societies
Implementation of tools and processes for datum conversion for large remotely-sense datasets for more effective data analysis for reporting climate change
Under the next steps in the collaboration section, promoting the new reference frames with other geospatial professionals was mentioned as an opportunity to leverage resources and expand the understanding of the new NSRS’s effect on users’ products and services. That is, increasing the number and types of stakeholders and constituents affected by the new reference frames will increase awareness of the new NSRS.
Joint Actions to Promote a Smooth Transition
Promoting awareness to non-technical leadership within AEC industries
Provide examples of the potential for a datum upgrade (smart cities, digital twins, autonomous transportation.)Educate allied professionals (e.g. engineers, contractors, operators.)Develop unified messaging for practitioners (e.g., best practices/standards.)
Focus on the education component and benefits of the new datum.
Act now to develop a specific plan and resource allocation to implement the new reference frame
Helping develop appropriate standard metadata/STAC templates and information
Provide open-source tools to the private sector to enable datum conversion and an open discussion forum.
For a smooth transition of the new NSRS, it is important to identify actions required for implementation. Promoting awareness to leadership is critical for the implementation of any new system. In the case of the new NSRS, it is essential for federal agencies to get engaged in the process now. I was pleased to hear that panel members mentioned that it is vital for federal agency engagement through the Federal Geographic Data Committee (FGDC) and the Federal Geodetic Control Subcommittee (FGCS) to be compliant with the Geospatial Data Act of 2018 (GDA 2018). These federal agencies must develop plans and allocate resources to implement the new NSRS.
As previously stated, high-level management and leadership attend the GeoGov 2024 Summit conference. It is a great place for networking and collaborating within federal agencies and for better understanding the issues associated with implementing the new, modernized NSRS.
Technology and tools are essential for the development of the new, modernized NSRS. That said, understanding how the use of technology and tools meet the users’ requirements is necessary for implementation.
Some users trust NGS models and tools without following the appropriate procedures. Standard operating procedures are used in a workflow to help meet users’ project requirements. In my opinion, understanding the impact of the new system on a specific product and service is the most important part of implementing the new NSRS. Documenting the workflow used to create a product and service and then using this information to develop standard operating procedures that use the appropriate tools and procedures will help implement the new, modernized NSRS.
In less than a year, NGS will be finalizing the new terrestrial reference frames and geopotential datum. Time really is running out and users need to obtain a working knowledge of the new, modernized NSRS.
In my last newsletter, I highlighted the release of a beta version of a new NOAA CORS Network (NCN) Station Web Page. As demonstrated in my newsletter, each CORS in the NCN has its own page with data, metadata, maps and photos for that station displayed in a modular layout so information is easily found all in one location. This past month, I had the privilege of participating in a meeting with representatives from the American Association for Geodetic Surveying (AAGS), the National Society of Professional Surveyors (NSPS) and the National Geodetic Survey (NGS). As a Past President of AAGS and the current Chair of the AAGS Membership Committee, I participate in these quarterly meetings.
AAGS aims to lead the community of geodetic, surveying, and land information data users through the 21st century. AAGS members develop new educational programs, including presentations, seminars, and workshops on topics related to geodetic surveying; and articles and papers that inform the membership of the latest scientific and technological developments and how to implement them in the most cost-effective and efficient manner.
In my previous newsletters, I have reminded everyone that time is running out to obtain a working knowledge of the new, modernized National Spatial Reference System (NSRS). The release of the new, modernized NSRS is only about a year away. As of July 2024, NGS plans to have a beta version of the new, modernized NSRS available around the summer of 2025 for users to test and evaluate new products and services. After enough testing has been performed, the new, modernized NSRS will be officially published – probably in early to mid-2026.
At the meeting, NGS highlighted some new products on its Alpha Preliminary Products site. The alpha site provides products that are useful for individuals who want to obtain a better understanding of the products that will be distributed as part of the new, modernized NSRS.
First, I want to bring attention to the importance of ensuring that the state’s legislation is modified or rewritten, if required, to include that the current horizontal and vertical datums are being replaced with the new, modernized NSRS. The “Learn More” button on the SPCS2022 Alpha site provides information about legislation.
Per personal communication with Michael Dennis, Ph.D., NGS SPCS2022 Manager, as of June 26, 2024, the following 12 states have have enacted into law NSRS modernization: Alaska, Idaho, Iowa, Kansas, Kentucky, Louisiana, Nebraska, North Carolina, South Dakota, Vermont, Washington, and Wyoming.
Users can download examples of actual new state legislation here.
Examples of legislation.
During the joint AAGS/NSPS/NGS meeting, Tim Birch, the executive director of NSPS, said that anyone who has questions about updating legislation for the new, modernized NSRS, including SPCS2022, can contact him directly.NSPS has experience working with agencies and individuals to develop legislation as indicated in the following statement on the NSPS website.
“We are the voice of the professional surveying community in the US and its territories. Through its affiliation agreements with the respective state surveying societies, NSPS has a strong constituency base through which it communicates directly with lawmakers, agencies, & regulators at both the national and state level. NSPS monitors and comments on legislation, regulation, & policies that have potential impact on the activities of its members and their clients, and collaborates with a multitude of other organizations within the geospatial community on issues of mutual interest.”
As previously stated, the two latest alpha products are the “GEOID2022 Alpha” and “Alpha Values for EPP.” My December 2017 newsletter discussed GEOID 2022 and the North American-Pacific Geopotential Datum of 2022 (NAPGD2022), and my February 2022 newsletter discussed the Euler Pole Parameters process and use in the new, modernized NSRS.
The GEOID2022 Alpha page provides a version of GEOID2022, which is the most recent prototype of the geoid models. The reference ellipsoid is Geodetic Reference System 1980 (GRS 80, but the geometric reference frame is ITRF2020). The Alpha GEOID2022 prototype data is available for download in two formats, “ASCII” and “.b.” There is a static component (SGEOID2022) and a dynamic component (DGEOID2022). These grids will be useful to programmers who want to develop and test their systems. Additional grids and tools will be available in the future.
Technical Details of the Alpha prototype of GEOID2022
GEOID2022 alpha is the last prototype of GEOID2022. It covers three regions: the North America–Pacific region, Guam and Northern Mariana Islands, and American Samoa. The spatial resolution of the geoid model is 1 arcminute. The geoid heights, which are in the tide-free system, are with respect to the reference ellipsoid of the Geodetic Reference System 1980 (GRS80) in the ITRF2020 geometric reference frame. GEOID2022 alpha includes static and dynamic components for the geoid heights. For detailed fundamental parameters of the geoid model, refer to NOAA Technical Report 78.
GEOID2022 Alpha
The Alpha EPP site provides the Euler Pole Parameters (EPP) that are needed to define the relationship between the ITRF2020 and models on the North America, Caribbean, Pacific and Mariana plates as discussed in NGS’s Blueprint Part 1 document.
Alpha Values for EPP
As stated in Blueprint Part 1, NGS will define the official relationship between ITRF2020 and the four NSRS TRFs through equation 59, using the rotation matrix in equation 58 resulting in equation 60.
I programmed this using a simple Excel spreadsheet to compute some of the potential changes between epochs for North Carolina. They were very similar to the ones that I depicted in my February 2022 newsletter that discussed the Euler Pole Parameters process and provided plots depicting the movement.
I would like to highlight the latest information available on the State Plane Coordinate System of 2022 alpha site. As previously stated, in about a year, the new, modernized NSRS will be available as a beta product. Users must get prepared by accessing NGS’s alpha products as well as taking the opportunity to provide feedback to NGS to improve their products and services. The Online Interactive Maps page provides information about the zones for every U.S. state and territory.
Clicking on the Online Interactive Maps link opens a NOAA ArcGIS online website that provides information about the Alpha State Plane Coordinate System 2022 preliminary zone designs. I have highlighted a few items that may be of interest to users.
The site provides a description of the site, links to various types of zones, links to data sources and information about distortion.
SPCS2022 online interactive maps.
Clicking on the link for zone definitions provides a list of zones and their parameters. This same information is also provided when users click on a zone on the map. I will demonstrate this later in this newsletter.
Per personal communication with Dennis, as of June 26, 2024, seven states have some or all their SPCS2022 zone definitions formally finalized, consisting of 205 out of the 965 zones (the total number of zones is still preliminary):
Alaska (partial coverage multizone layer)
Arizona (both multizone layers)
Idaho (both multizone and statewide)
Kentucky (both multizone and statewide)
North Carolina (statewide zone; it has no other zones)
South Dakota (both multizone and statewide)
Wisconsin (multizone)
Dennis informed me that the information on the alpha SPCS2022 Experience has been updated. He told me that the total number of zones decreased from 967 to 965, but based on coordination with the International Association of Oil & Gas Producers (IOGP) Geodesy Subcommittee the number may eventually increase to 972 (more about that in a future newsletter).
He stated that his goal is to finalize the zone definitions by the end of this calendar year or early 2025. Users should keep checking the alpha site.
Dennis mentioned that the website now offers a new feature that provides the distortion value when users click on the map. A nice thing about that is the site can be used on a smartphone, allowing users to obtain real-time distortion information from their location.
Clicking on the link titled “View” in the upper right corner of the box brings up a map that depicts the SPCS2022 zones.
View of ALPHA (preliminary) SPCS2022 zone designs.
When you click on the note about the ALPHA being preliminary, the map underneath appears where the user can select the type of maps they wish to review.
The following options are available: All Zone Layers, Statewide Zone Layers, Multizone Complete Layers, Multizone Partial Layers, and Special Use Zone Layers.
Users can use their mouses or the “+” button on the left-hand side” to zoom to a particular region, or use the search button on the right-hand side to select a State or zone.
Using the search box.
Information about a particular zone pops up by clicking on a point on the map.
Detailed information provided for a zone.
Each zone provides links to other features based on the location of the point selected on the map.
The image below provides the distortion in ppm for the point selected on the map.
The Alpha NCAT site can be used to obtain an estimate of the changes between SPCS83 and SPCS2022. It should be noted that all values will be in meters (m) and international feet (ft).
International feet may be new to some surveyors who were previously using the U.S. survey feet in SPCS83. The U.S. survey foot will not be used with the NSRS, including SPCS2022 coordinates. NGS and the National Institute of Standards and Technology (NIST) have taken action to deprecate the U.S. survey foot. What does that mean?. NIST has the following statement on its website: “Beginning on January 1, 2023, the U.S. survey foot should be avoided, except for historic and legacy applications, and has been superseded by the international foot.” This means that NGS will not be publishing SPCS2022 in U.S. survey feet but all historic products and services such as SPCS83 will still be provided in U.S. survey feet (sft) and international feet (ift).
More information and resources about the deprecation of the sft are listed below (personal communication from Dennis):
The official announcement is the final determinationFederal Register Notice (FRN) on deprecation of the sft issued on 10/5/2020. It was jointly issued by the National Institute of Standards and Technology (NIST) and NGS. I encourage everyone concerned about this topic to read it closely and in its entirety; it can likely answer most questions. The FRN includes information on the continued use of sft for legacy applications (such as SPCS 83). That is stated in the last paragraph of the “Notice of Final Determination” section; in items #1 and #2 in the “Counterpoints to Feedback Expressing Opposition”section; and in the second paragraph of the “Implementation Summary and Actions” section.
The legacy issue is also addressed in the 10th FAQon the NIST website and in the 11th FAQon our “new datums” FAQs web page.
The 40 states that officially adopted the sft for SPCS 83 are listed in Table C.1 of Appendix C of NOAA Special Publication NOS NGS 13, “The State Plane Coordinate System History, Policy, and Future Directions.”
Although the final determination FRN is itself not a law, Congress has passed several laws giving NIST the authority to maintain national standards of measurement. These and other related federal laws are given in the initial sft FRNissued on 10/17/2019.
An NGS webinar given on 11/10/2022 addresses the deprecation of the sft in the context of state plane. Two previous NGS webinars also provide additional background and historical information on the sft, one given on 4/25/2019 and the other on 12/12/2019.
Input to Alpha NCAT.
Photo:Output from Alpha NCAT.
This newsletter highlighted the products on NGS’s Alpha Preliminary Products site. The alpha site provides products that can be useful for individuals to obtain a better understanding of the products that will be distributed as part of the new, modernized National Spatial Reference System (NSRS). NGS is providing these products on an alpha site so that they can get feedback from users. I would encourage all users to access the alpha sites and provide comments to NGS so that their products and services better meet the needs of the surveying and mapping community.
Welcome to the NGS National Spatial Reference System (NSRS) Modernization Alpha Product Release Site. This site provides examples of the content, format, and structure of data and products that NGS plans to release as a part of the Modernized NSRS.
Products found on this page are for illustrative purposes only and do not contain any authoritative NGS data or tools. They are under active development and are subject to change without notice.
To provide feedback on any of the content on this site, please email [email protected].
In my last column, I highlighted the announcement made by the National Geodetic Survey (NGS) of the recipients of the NOAA FY 23 Geospatial Modeling Competition Awards. As shown in the image below, NGS awarded approximately $4 million in grant funding to four institutions for projects that will research emerging problems in the field of geodesy, develop tools and models to advance the modernization of the National Spatial Reference System (NSRS), and help address a nationwide deficiency of geodesists.
Image: NGS
I had the opportunity to speak with Juliana Blackwell, director of the NGS, about the geospatial awards. I asked her how the grants will help NGS in its development of products and services as well as the implementation of the modernized NSRS.
“The geospatial modeling grant is an opportunity to expand our abilities within NGS to address research challenges, diversify the tools we provide, and multiply our future workforce,” Blackwell said. “I’m excited about the competitive and collaborative nature of the grant and the chance for NGS to work with a variety of academic institutions.”
NGS awarded the grant funding to four institutions including Oregon State University, Scripps Institute of Oceanography, Michigan State University, and the Ohio State University. Looking at the summary of the awards, there appears to be some overlapping interest between grantees that could lead to a diverse set of solutions to a problem or task. I will report on specific tasks and outcomes as more details become available.
I was pleased to see that grant proposals included developing new geodetic tools and operating procedures for working with the new, modernized NSRS. Hopefully, these universities will engage the geospatial user community when developing new tools so the tools will be useful during the implementation of the new NSRS.
Summary of the Geospatial Awards (Image: NGS)
Besides providing funds for the geospatial grants, NGS is collaborating with other federal agencies to address the geodesy crisis. This collaboration, denoted as the “Geodesy Community of Practice (COP),” includes four agencies — NGS, National Geospatial-Intelligence Agency (NGA), National Aeronautics and Space Administration (NASA), and United States Geological Survey (USGS). The co-chairs of the group discussed the group’s actions and goals at the Hydrographic Services Review Panel (HSRP) fall committee meeting held in Silver Spring, Maryland, on Sept. 27-29.
Geodesy Community of Practice. (Image: NOAA’s Hydrographic Services Review Panel)
The HSRP involves four NOAA offices: three National Ocean Service (NOS) program offices -NGS, the Center for Operational Oceanographic Products and Services (CO-OPS), the Office of Coast Survey (CS), and the University of New Hampshire’s Joint Hydrographic Center and Center for Coastal and Ocean Mapping. More information and the presentations from the HSRP meeting can be obtained here. The purpose of the committee is to review and provide NOAA with independent advice on their products and services.
I attended the three-day HRSP meeting as a virtual participant. As previously noted, NGS is one of the NOS offices that’s part of the HSRP. As the Director of NGS, Blackwell participated in the 2023 fall HSRP meeting. A majority of the meeting discussed the geodesy crisis. In my opinion, this is due to Blackwell’s efforts to highlight the importance of geodesy to NOAA products and services.
The presentation by the co-chairs of the Geodesy Community of Practice highlighted a few articles that have brought the geodesy crisis to the attention of the geospatial user community. Anyone keeping up with my columns knows that I have been highlighting the geodesy crisis and programs that advance the science of geodesy (July 2020, November 2022, December 2022, and April 2023). The geodesy crisis white paper is posted on the American Association for Geodetic Surveying (AAGS)website.
Image: NOAA’s Hydrographic Services Review Panel)
The Geodesy COP established working groups to address topics that are important to all geospatial users. All the agencies are supporting the working groups which should help create more effective and efficient solutions to technical geodetic issues.
Image: NOAA’s Hydrographic Services Review Panel
A goal of the Geodetic Community of Practice is to train future geodesists. The advancements in satellites and computers have enabled geodesy to expand into many different disciplines. Geodetic science and technology now underpin many sciences, large areas of engineering (such as driverless vehicles and UAVs), navigation, precision agriculture, smart cities, and location-based services.Major U.S. companies, such as Google and FedEx, as well as the automobile industry, precision farming companies and mining companies also need more accurate geodetic models, tools, and algorithms.Therefore, these companies also need trained geodesists to perform important research on topics that address their specific geodetic requirements.I highlighted this in my July 20, 2020, GPS World First Fix article.To address the geodesy tradecraft, the COP includes providing professional government assignments.That said, many industries that rely on accurate and consistent geodetic information should also provide professional geodetic assignments.
Training future geodesists. (Image: NOAA’s Hydrographic Services Review Panel)
I asked Blackwell how she thought the U.S. government’s Geodesy Community of Practice will help NGS and the geodesy crisis.
“The Geodesy Community of Practice is in the beginning phase right now with the collaboration among federal agencies with geodetic missions, NOAA/NGS, NGA, NASA, and USGS,” Blackwell said. “There is already a benefit in sharing research, workforce, and operational needs and leveraging our resources. I envision expanded engagement with academia, private industry, and other government agencies as the community of practice matures.”
In my opinion, the Geodesy Community of Practice’s integrated working groups consisting of individuals with different backgrounds and skills addressing geospatial problems will help to advance the field of geodesy. I believe that integrated and collaborative organizations create the best geospatial solutions; the Geodesy COP is an embodiment of this concept.
Of course, as I have stated in many of my columns, I like to remind everyone that “geodesy is the foundation for all geospatial products and services.”
My previous column provided an update on the current set of published orthometric heights in the southeast Texas region and rules by the National Geodetic Survey (NGS) for estimating and publishing GNSS-derived orthometric heights using OPUS Projects. It also highlighted my personal crusade, that is the United States geodesy crisis. The Geodesy Crisis white paper can be downloaded from the American Association for Geodetic Surveyingwebsite.
This column focuses on potential errors in orthometric heights using a digital barcode leveling system with multi-piece leveling rods. Every business makes decisions based on expenses and ultimately on the profit margin. That said, making a business decision that results in a bad technical outcome may lead to issues that cost the company more than expected.
I have been involved with establishing orthometric heights, both leveling-derived heights and GNSS-derived heights, for most of my career. On a personal note, the digital bar code leveling system is important to me because I was the lead author of the document by the Federal Geodetic Control Subcommittee (FGCS) to incorporate the digital barcode leveling systems “Specifications and Procedures to Incorporate Electronic/Digital Barcode Leveling Systems (2004).” Recently, a colleague brought to my attention that many surveyors are using the digital barcode leveling system (which wasn’t a surprise to me), but they are not using the one-piece, single-scale, invar rod. They are using the multi-piece rods, either fiberglass or wooden. Surveyors can use any type of instrument to perform their project, but it will not meet the Federal Geodetic Control Subcommittee specification and procedures for leveling unless they use a one-piece leveling staff. This not a new requirement; it has been a requirement since the first publication of the FGCS specifications and procedures. Surveyors have always requested to use multi-piece rods but the potential errors associated with them were considered too large to be incorporated into the specifications and procedures to meet first-, second-, or third-order U.S. federal accuracy standards.
Excerpt from FGCS Specifications and Procedures (Image:FGDC)
Excerpt from FGCS Specifications and Procedures (Image:FGDC)
In 2018, NGS documented a study to evaluate the use of multi-piece rods using the digital barcode leveling system. I first saw a draft of this report in 2011 and forgot that it existed. A colleague of mine recently provided me with the 2018 report. In my opinion, anyone who uses the digital barcode system and multi-piece rods should read this report and, of course, the rest of this column.
NOAA Technical Memorandum NOS NGS 75. (Image: NGS)
The image below provides the important summaries of the tests. I highlighted the statement “In the field, these errors were as high as 1.5 mm per setup and up to 7 mm for the entire 180-meter section.” In my opinion, an error of 7 mm in a 180-meter section is too large for any order and class of leveling. Also, the results of the study support the current FGCS specifications and procedures requirement of the use of one-piece, calibrated rods.
Image: NGS
The 2018 report states that multi-piece level staffs are popular among the surveying community because of their ability to break down into an easily transportable unit and they are relatively inexpensive and readily available. They may also be extended to reduce the number of leveling setups required over sloping terrain. This makes good business sense but surveyors should not make technical decisions based solely on business costs. That said, the FGCS “Specifications and Procedures to Incorporate Electronic/Digital Barcode Leveling Systems (2004)” prohibit the use of multi-piece rods for any order/class of leveling based on technical decisions, not on business expenses. To evaluate the multi-piece barcode rods, NGS developed and implemented laboratory and field tests designed to detect and quantify possible loss of precision in multi-piece leveling staffs. All their tests were conducted at the NGS Testing & Training Center located in Woodford, Virginia, in December 2011. The report was published in 2018.
The report did note that only a small sampling of instrumentation, three multi-piece leveling staffs comprising two separate models from two separate manufacturers, were included in the NGS study. Therefore, the results found within the report evaluate the accuracy and precision of the specific staffs tested. As the report states: “The tests are qualitative in nature with respect to bifurcation and non-Invar construction. Similar results are expected for similarly designed level staffs; nevertheless, the results should not be considered precisely valid for all types or models of multi-piece leveling staffs.”
Users should download the document and read it but I’ll highlight a few results. First, the report made the following statements about the plumbing of the rods:
“With the Leica GKNL4M level staff carefully plumbed, the section directly above the bottom section housing the level vial was visually slightly out of plumb. No correction was made for this effect in the lab or field tests. No measurements were made to the top third section of this level staff during this evaluation.”
“With the Trimble LD23 level staff carefully plumbed, the sections directly above and below the middle section housing the level vial was visually bowed and slightly out of plumb. No correction was made for this effect in the lab or field tests.”
Obviously, having a correctly plumbed rod is extremely important.
To estimate the potential scale error in a controlled environment, NGS performed a special test where they set up the level instrument 5 m from the leveling rods inside their building and made a measurement every decimeter on each rod. To perform this, the level instrument was moved upward one-decimeter after each measurement and the measurement was repeated. Figure 9 from the 2018 report depicts the results of the process. The first thing to notice is that the two calibrated, invar rods indicate very small errors. The other thing to notice is that there is a change in scale error at the section breaks of the multi-piece staffs. I highlighted the section breaks in the image below. The plots in Figure 9 indicate that the upper section of the rod is different from the lower section. This may result in a large error when going up (or down) an incline; that is, when leveling up an incline the upper section of a rod would be read in the back-sight reading and the lower section of a rod would be read in the foresight reading. The opposite would occur going down the incline.
Figure 9 from NGS 2018 report. (Image:NGS)
NGS also performed a small field test. The height difference was only 10 m over about 180 m distance. Figure 15 from the report provides the results of their field test. Some of the rods showed an error of almost 7 mm in the 180-meter section. Obviously, this is a significant error over such a short leveling distance, especially since it appears to be systematic. The report made a note about the systematic error; it noted that the height differences between the forward and backward runs were similar, but they were different from the standard. In other words, the forward and backward runs may meet a FGCS section misclosure but the mean difference would still have the accumulated systematic error. This means that following double-run procedures will not account for the systematic error. As a side note, according to FGCS specifications and guidelines, for establishing a height of a new bench mark, double-run procedures must be used. Single-run methods can be used to re-level existing work provided the new work meets the allowable section misclosure.
Figure 15 from NGS 2018 Report. (Image:NGS)
As stated in the 2018 report, errors as large as 6.8 mm over a 180-meter sloping section were due to using the multi-piece leveling rods. This is unacceptable for meeting FGDC specifications and procedures for leveling surveys.
The NGS report was based on a small sample and over a very small project area. It provides a compelling argument for requiring one-piece leveling rods. Now, for a real-world example that supports the results of NGS’s study. I received a report where the results of repeat leveling surveys using the multi-piece fiberglass rods over the same basic route indicated a large systematic height error. The figure below provides the difference in heights between the two surveys. As indicated in the figure, the data indicates a height dependent error of -0.43 mm/meter between the two surveys. In this example, the difference approaches 200 mm. Clearly this type of systematic error needs to be accounted for when multi-piece barcode rods are used in a survey.
Example of Height Dependent Error in Fiberglass Rods. (Image: Dave Zilkowski)
As previously stated in the conclusion of NGS’s 2018 report, “Calibration of these type survey instruments provides a means of quantifying these type error sources, thus providing a mechanism for ‘correcting’ for them during post processing of data sets.” If a company or agency created a calibration process similar to NGS’s test site, then surveyors could use the site to evaluate their multi-piece barcode rods. In my opinion, until users account for the index and scale error in multi-piece barcode leveling rods, they should not be used to perform leveling surveys to compute orthometric heights with any expected accuracy value.
Clearly, it is more cost effective to use multi-piece rods instead of single-piece invar rods because of the increase in expenses for the single-piece invar rods. However, making a business decision that results in a bad technical outcome could lead to lawsuits, professional liability issues, and/or additional expenses for having to resurvey projects. Enough said.
First, happy New Year to everyone. As a follow up to my November 2022 column on the geodesy crisis, I’d like to highlight that the National Geospatial Advisory Committee (NGAC) of the Federal Geographic Data Committee (FGDC) just adopted a resolution on the need for the federal government to understand and aggressively address the US geodesy crisis. See below. This is great news and, hopefully, the FGDC and others will follow up with discussions with other organizations such as the Office of Science and Technology Policy (OSTP) in the White House.
Now for this month’s column. Last year the National Geodetic Survey (NGS) started suppressing height information in Southeast Texas (see my April 2021 and June 2021 columns). See below for more information. Last year’s columns highlighted the potential effects of subsidence on published heights in the Houston, Texas, region which implied that most of the published heights, which are based on older surveys in the region, are not current or accurate. At the time of NGS’s announcement, only 28 marks with orthometric heights were published on NGS datasheets in southeast Texas. Click here for more information and see below.
This column will provide an update on the following: the current set of published orthometric heights in the southeast Texas region based on recent GNSS surveys performed during 2021 and 2022, NGS’s rules for estimating and publishing GNSS-derived orthometric heights using OPUS Projects, and the status of NGS’s GPS on Benchmarks program.
I always retrieve the latest published coordinates using NGS’s datasheet website routine. See the graphic below of the published NAVD 88 orthometric heights as of Nov. 20, 2022 (I used NGS’s monthly archive by State retrieval option). There are currently 147 marks with published orthometric heights within NGS’s definition of the southeast Texas zone of subsidence. From mid-October to early December of 2022, another GNSS project sponsored by the Harris-Galveston Subsidence District (HGSD) was performed in the region. In this project, 154 marks in the southeast Texas region were observed. The results of this project should be published and disseminated by NGS in the spring of this year.
Latest Published Heights in Southeast Texas. Image: Dave Zilkoski
The current version of OPUS projects allows the user to estimate NAVD 88 orthometric heights, providing they adhere to NGS’s recommendations and procedures. A presentation titled “Heights Suppression in Southeast Texas” by Boris Kanazir, NGS, provides guidance on estimating NAVD 88 orthometric heights using OPUS projects.
See below for the requirements for number of occupations, duration of each session, and the spacing of marks with valid NAVD 88 published orthometric heights.
The requirements include:
a minimum of two NAVD 88 control marks per new mark observed
a mark must be observed twice on different days and at different times of the day
the maximum distance between new marks and NAVD 88 control is between 30-50 km, based on session duration
I like to think of this concept as drawing Venn diagrams around marks. See below for an example of the concept.
Venn Diagram. Image: Dave Zilkoski
So, what does this mean in the real world? The map below demonstrates the concept in the Houston-Galveston, Texas, region. As shown, many of the 30 km circles overlap, indicating that in these overlapping areas there are two CORS with published NAVD 88 orthometric height. This means that a user can occupy a mark for two hours and use the data from two CORS as NAVD 88 control. Of course, the mark must be occupied twice for redundancy.
30 km Radius Circles around SE TX CORS with NAVD 88 Heights. Image: Dave Zilkoski
Increasing the radius to 40 km includes more overlapping areas. This means that the user would have more overlapping areas with two CORS that have published NAVD 88 orthometric heights, but the marks would have to be occupied twice for at least four hours each time.
Image: Dave Zilkoski
Now, when you apply a 30 km radius around the current 147 marks that have published NAVD 88 heights, most of the region has overlapping areas (see below). This means that the user could occupy two of the NAVD 88 marks along with any new marks for at least two hours.
30 km Radius Circle Around all 147 NAVD 88 Marks in SE TX. Image: Dave Zilkoski
The previous figure may seem confusing because of all the circles. In the example below, based on only two marks, 11 marks fall inside the overlapping sections of the two circles. They could be established using the two NAVD 88 control marks that were used to make the 30 km circles.
Example of Two 30 km Radius Circles. Image: Dave Zilkoski
As depicted in my June 2021 column, the Houston-Galveston, Texas, region is subsiding. The map below provides the latest estimates of subsidence in Houston-Galveston, Texas, region based on a Harris-Galveston Subsidence District (HGSD) report “Determination of Groundwater Withdrawal and Subsidence in Harris and Galveston Counties – 2021“ published in 2022. Most of the rates are small, less than 0.5 cm/year, but some are greater than 1 cm/year. This means that some marks may have subsided around 5 cm in five years.
Estimate of subsidence in SE TX. Image: Dave Zilkoski
The surveying and mapping community has done a tremendous job of increasing the number of published heights in the Houston-Galveston, Texas, region (from 28 to 147). That said, the amount of movement in the Katy region is more than -2 cm/year (see box titled “Estimate of Subsidence in the Katy Area”). That means, the marks in this area may subside 10 cm in five years.
Estimate of subsidence in the Katy Area. Image: Dave Zilkoski
Heights that change 10 cm cannot be considered NAVD 88 control marks. NGS’s OPUS Projects User Guide states the following about superseding a mark’s coordinates:
“Users should review the newly adjusted coordinates on user marks to decide whether they recommend that the user mark be re-determined (re-published). Typically, this would happen if the coordinates have shifted by more than 2 centimeters horizontally or 4 cm vertically from the published coordinates marks.”
Therefore, these marks in the Katy region may not be valid NAVD 88 control marks in about two years. Even marks that are subsiding at 1 cm/year may not be valid NAVD 88 control marks in about four years.
The community needs to maintain these marks to account for movement in the region. As previously stated, the Harris-Galveston Subsidence District (HGSD) has marks, denoted as PAMS, that are occupied continuously for a week several times throughout the year. These PAMS and the CORS in the area could be used to estimate crustal movement rates and maintain a set of valid, published heights in the region. See the boxes titled “ArcGIS Online HGSD Subsidence Rates” and “PAM 98 Subsidence Rate.” Additionally, the Texas Spatial Reference Center (TSRC) could provide the appropriate services to help maintain the published coordinates. The TSRC website states, “The technical mission of TSRC is to conduct basic and applied research contributing to NGS’s national Height Modernization program. TSRC is a repository for information used by researchers to develop improved understanding of elevation, geodetic and vertical datums in the state of Texas. The TSRC goal is to re-establish accurate evaluations throughout Texas in cooperation with qualified geospatial scientists, professional engineers, and professional land surveyors.”
In 2025, NGS will replace all three North American Datum of 1983 (NAD 83) frames and all vertical datums, including the North American Vertical Datum of 1988 (NAVD 88), with four new terrestrial reference frames and a geo-potential datum. As stated in my previous columns – April 2022, April 2021, June 2020 – the new reference frames will rely primarily on Global Navigation Satellite Systems (GNSS) as well as on a gravimetric geoid model. These new reference frames will be easier to access and to maintain than the current NSRS. NGS will provide tools similar to the OPUS suite of routines that will facilitate users’ ability to submit data to NGS to maintain and publish survey marks. See the graphic below.
I would like to highlight that NGS has extended the cut-off date for submitting data for use in the 2022 Transformation Tool. The new cut-off date is Sept. 30 (see below).
This column provided an update on the current set of published orthometric heights in the southeast Texas region based on recent GNSS surveys performed during 2021 and 2022, NGS’s rules for estimating and publishing GNSS-derived orthometric heights using OPUS Projects, and the status of NGS’s GPS on Benchmarks program. Additionally, it highlighted that the NGAC of the FGDC adopted a resolution on the need for the federal government to understand and aggressively address the United States geodesy crisis. This is a good step forward, and I hope that others will follow up with discussions with other organizations such as the OSTP in the White House. Finally, “The Geodesy Crisis” white paper can be downloaded from the American Association for Geodetic Surveying (AAGS) website.
I hope everyone has a happy new year filled with optimism, happiness and a generous amount of enthusiasm and fun.
Geodesy without math equations: Is that possible? The answer is no, but basic geodetic concepts can be described without using complex math equations.
My previous column addressed the geodesy crisis in the United States. (See also this.) The newsletter was highlighted on LinkedIn (thanks, Jay); more than 235 individuals reacted to the post and there were 25 reposts.
I’m pleased so many people are interested in highlighting the discussion of the inverted pyramid. One reader of my column asked for material for non-geodesists to obtain a better understanding of geodetic concepts.
Geodesy does involve advanced mathematics that may not be familiar to some people. That said, there are various online lessons and tutorials that describe the basic concepts without using complex math equations.
As mentioned in my previous column, geodesy is involved with anything related to positioning. For example, have you ever wondered how your phone appears to know where you are on a digital map while you’re walking or driving down the street? Geodesy provides the foundation for all geospatial products and services.
Image: Dave Zilkoski
Location on a Map
A goal of mine has always been to get individuals (young and old) interested in obtaining a better understanding of geodesy. In my opinion, high schools and colleges should include courses that explain to students how their phones know where they are, why the Earth is not a sphere, how the movement of tectonic plates are measured and why, basic concepts of how satellites orbit the earth, and how geographic coordinates are important to making maps and their use in establishing an accurate geographic information system (GIS).
A good first step is to get high school teachers interested in the topic. When I was employed by the National Geodetic Survey (NGS), a group of us worked with local high school students to map their football field using GPS. They acquired observations in the field, and then downloaded the coordinates into their GIS. The teacher was instrumental in integrating the application into the students’ curriculum.
A reader of my last column suggested I provide concrete, meaningful things to lower the barrier of entry. I’m not exactly sure how to lower the barrier of entry — geodesy does require an individual to have a certain level of mathematical knowledge.
Since I retired from NGS, I have helped homeschool my eight grandkids. The one thing that I’ve found is that young students apparently either “like” math or they “hate” math. At least with my grandkids, there doesn’t seem to be an in between.
At this moment, I don’t believe any of my grandkids will become geodesists; well, actually, there’s still a possibility that one may have a “love for mathematics.” It appears that most students don’t really see a reason to learn math. They can use their phones or calculators to do what they need.
The reader suggested that the geodesy community could publish free, high-quality, web-based resources for the public. The reader made the following suggestions:
A set of 3D-printable designs for rudimentary survey tools; alternatively, how to acquire/build the tools in the most economical way possible. Even something that would be considered a “toy” that can be given to a child would be good.
A list of software tools (preferably open source) relevant to the subject and how to use them in this context.
Introductory material intended for young audiences.
This column will provide some free online lessons and tutorials that describe the concepts associated with geodesy and surveying. Some of the online videos are at a level for young audiences, and some are aimed at individuals with more advanced education. Let’s start with the young audience.
Lessons for Kids
The website “Get Kids into Survey” provides materials focused on kids. The website states: “Bringing young people into the exciting world of survey through pioneering content and engaging experiences.” See the boxes titled “Get Kids into Survey Website,” “Get Kids into Survey Website – Poster Page,” and “Get Kids into Survey Website – World Without Surveyors Poster.”
Get Kids into Survey Website
Screenshot: Get Kids lnto Survey
Get Kids into Survey Website – Poster Page
Screenshot: Get Kids into Survey
Get Kids into Survey Website – World Without Surveyors Poster
Screenshot: Get Kids into Survey
The GPS.gov website has lessons describing GPS that are designed for kids. One lesson introduces the concept of GPS trilateration. The lesson explains how GPS positioning works on two basic mathematical concepts:
trilateration, which literally means positioning from three distances, and
the relationship between distance traveled, rate (speed) of travel, and amount of time spent traveling.
This was developed by NGS for a National Science Teachers Association Conference. You can download both the instructions and map.’
GPS Trilateration Lesson
Screenshot: GPS.gov website
The following are several videos that describe the concept of trilateration.
This video explains trilateration and how the GPS ranges (distances from the satellite to the receiver) are computed.
This video uses distances on a map to describe trilateration.
Here is a detailed description of trilateration and why you need the fourth satellite.
Now, let’s look at some free online lessons and tutorials that describe the concepts associated with geodesy. As previously stated, some of the online videos are at a level for young audiences, and some are aimed at individuals with more advanced education. Most of them describe the concepts using diagrams with narratives, and without complex math equations. NGS provides a number of videos that can be downloaded here.
NGS, in partnership with the COMET program, has developed a series of self-paced lessons on geodetic and remote sensing topics. Users have to create a free user account to gain access to the courses. Users will have the option of printing out a certificate upon successful completion of a quiz at the end of each lesson.
The lessons are rated by skill level ranging from “Suitable for Non-Scientists” to “Requires some Prior Knowledge of the Topic.”
The COMET program provides teaching and training resources for the geoscience community. All of the content is completely free, but an account does need to be created. The COMET program is part of the University Corporation for Atmospheric Research (UCAR) Community Programs.
NGS Online Lessons
Screenshot: NGS Website
NGS and COMET Educational Videos
NGS also has a website that contains educational videos. Again, NGS, in partnership with the COMET Program, has developed short videos on topics related to geodesy and mapping.
NGS Educational Videos
Screenshot: NGS Website
This link provides a tutorial on “Why is geodesy the framework behind all mapping and navigation?” The article states. “If you think about it, the whole field of geomatics lies on the shoulders of geodesists. Because it’s really geodesy that is the framework behind all surveying, mapping and navigation.”
What Is Geodesy?
Screenshot: Gisgeography Website
NASA’s Eratosthenes Estimating the Circumference of the Earth by Looking Down a Well
NASA offers a video titled “Looking Down a Well: A Brief History of Geodesy.” This video explains how it all started when Eratosthenes estimated the circumference of the Earth by looking down a well. It highlights how, over time, the field of geodesy has expanded and evolved dramatically, and how NASA uses technology such as radio telescopes, ground surveys, and satellites to contribute.
NASA’s Video on Looking Down a Well
UNAVCO Measures Plate Tectonics with Geodesy
UNAVCO, a non-profit university-governed consortium, facilitates geoscience research and education using geodesy. UNAVCO has a video that describes the tectonic plates and how geodesists measure their movements. Another UNAVCO video describes what geodesy actually is, as well as geodesy’s application in our everyday lives (UNAVCO’s 2017 USIP geoscience video production). Visit UNAVCO’s website to learn more about its mission.
Geodetic Software Tools
NGS provides tools that focused on meeting the needs of the surveying and mapping community. A few may be of interest to non-geodetic individuals. A map tool can be used to locate marks near someone’s location.
Production NGS Map
Screenshot: NGS Website
UNAVCO also has interactive tools that may be of interest to geospatial users. See the boxes below titled “UNAVCO Interactive Tools” and “UNAVCO Spotlight.”
Screenshot: UNAVCO Website
Screenshot: UNAVCO Website
3D Printer of Surveying Equipment
Now, let’s address the 3D printing of surveying equipment and tools. I’m not familiar with using a 3D printer, but I found several websites that provide information on surveying equipment. Some of the sites provide free information and others charge for their services. See the websites 3D Printer of Total Station and 3D Printer of GNSS Equipment.
3D Printer of Total Station
Screenshot: CULTS Website
3D Printer of GNSS Equipment
Screenshot: 3dmdb Website
I’m pleased a lot of people are interested in highlighting the discussion of the inverted pyramid. As commented by several individuals in the LinkedIn responses, the surveying and remote sensing (which includes photogrammetry) communities are experiencing the same crisis as geodesy. In my opinion, they are all related, because the surveying and mapping community provides tools other disciplines use.
As stated in my last column, the surveying and mapping community can do the following to help:
actively market geodesy in high schools as a rewarding career for the math stars before college entry
build back, support and sponsor geodesy programs at select universities; this support needs to be strategic with backing from the highest levels of the U.S. government
encourage U.S. government support in the form of grants, professional development of staff, and research collaborations/affiliations.
As previously mentioned, one of my goals has always been to get individuals (young and old) interested in obtaining a better understanding of geodesy. I hope this column helps to whet the appetite of some individuals to obtain a better knowledge of geodesy. Maybe even some high school and college teachers will introduce geodetic concepts in their lectures.
Writing about the geodesy crisis is a good first step, but we need to find champions that can influence high school and university teachers and administrators, federal and state government program managers, and congressional representatives.
Please feel free to email me at [email protected] if you have suggestions on how to lower the barrier of entry into the world of geodesy.
My April column addressed the vertical movement at the NOAA CORS Network (NCN). The values at the sites indicate the potential movement of marks in the area of the CORS. The rates are based on GNSS data and have an estimate of error associated with them.
As I mentioned in my previous column, I’m not sure how the National Geodetic Survey (NGS) will address the vertical movement effects in the new, modernized National Spatial Reference System (NSRS). That said, NGS will be monitoring the CORS and looking for trends to help describe the vertical movement at the CORS. These trends are an indication of what may be happening in that area.
As stated in previous columns, orthometric heights in NAPGD2022 will be defined through ellipsoid heights and a geoid model, for example GEOID2022. In addition to the movement of individual marks due to crustal movement, there are geophysical reasons for changes in the geoid that affect the orthometric height of a mark. Therefore, changes in the geoid model will be very important to users estimating orthometric heights using GNSS.
As stated in the NOS NGS 64 report, NGS has set a goal of maintaining geoid accuracy at 1 centimeter (1 standard deviation) in both absolute and differential geoid undulations. The box titled “Figure 13 from NOS NGS 64 Report” depicts an estimate of the secular change in the geoid. As indicated in the plot, the changes are very small, ranging from -1.25 mm/year to 1.5 mm/year.
What I find interesting is the small negative change in the southeastern United States. There are other drivers for geoid changes. This column will address some of these changes and what they mean to users.
Secular geoid change
Figure 13 from NOS NGS 64 Report (Image: NGS)
As mentioned in many of my articles, the new, modernized NSRS has a time-dependent component. This includes the geoid model. Table 5-1 from NOS NGS 64 report are examples of some of the physical processes being investigated by NGS to account for changes in the geoid. (See the box titled “Some of the geophysical drivers of geoid change.”)As mentioned in the NOS NGS 64 report, the magnitudes in red have already been determined to be too small for NGS to model. The examples highlighted in yellow have magnitudes that are significant and NGS will attempt to account for these changes to the geoid.
Table 5-1: Some of the geophysical drivers of geoid change
NGS classifies the changes in the geoid in three different groups: Shape Change, Size Change, and W0 Change. The box titled “The Groups of Geoid Change” provides NGS’s definition and explanation of the terms.
The groups of geoid change
NGS’s report on their Geoid Monitoring Service (GeMS) program provides figures that depict an estimate of the secular geoid rate trend based on the NASA GSFC mascon model. See the boxes titled “Estimate of Geoid Rate Over CONUS” and “Estimate of Geoid Rate Over Alaska.” For more details on GeMS, download the report NOAA Technical Report NOS NGS 69: A Preliminary Investigation of the NGS’s Geoid Monitoring Service (GeMS), and read my December 2019 Survey Scene column. The secular geoid rate trend is an example of the geoid changing its shape, but not the W0 value. What this means is that the local geoid undulations will change, but the overall size of the geoid will not.
Estimate of geoid rate over CONUS
Figure 32: Geoid rate over CONUS based on the GSFC mascon model [mm/yr] (Image: NOAA)Estimate of geoid rate over Alaska
Figure 33: Geoid rate over Alaska from GSFC mascon model [mm/yr] (Image: NOAA)These changes in the geoid are fairly small values (+/- 1.3 mm/year), but they will accumulate over a decade. As previously stated, NGS’s goal is to maintain geoid accuracy at the centimeter level (1 standard deviation) in both absolute and differential geoid undulations. In my February 2022 column, I discussed how coordinates change because Earth’s surface is moving due to the movement of major tectonic plates. It’s fairly obvious how the tectonic shift affects horizontal coordinates, but earthquakes and volcanic eruptions can also cause large shifts in vertical coordinates.
In recent history, on May 18, 1980, geologists watched in awe as Mount St. Helens erupted in a gigantic explosion. After the eruption, the volcanic cone of Mount St. Helens had been completely blasted away; the peak, which was at an elevation of 9,677 feet (2,950meters) was changed to a horseshoe-shaped crater with an elevation of 8,363 feet (2,549 meters). Extreme crustal movements such as the Mount St. Helens eruption can change the shape of the geoid. As explained in my April 2022 newsletter, NGS understands this and is attempting to manage the changing coordinates by providing a time-dependent component to a mark’s ellipsoid height, but there is also a time-dependent component to the geoid that affects the mark’s orthometric height.
Ring of Fire
Image: National Ocean Service
The “Ring of Fire” map highlights earthquake activities around the world. As indicated in Table 5.1, earthquake or volcanic eruptions can change the shape of the geoid. Of course, they also can change the height of a mark due to crustal movement, which would typically be larger than the change in the geoid height. The amount of movement would be due to the size and magnitude of the event, but even small earthquakes could cause a change in the height of a mark located near the event. Earthquakes are occurring all over the world every day.
Earthquakes with large magnitudes are highlighted by news media outlets, but ones with smaller magnitude typically are not highlighted. The four figures below provide examples of earthquakes that have occurred over 30 days. This information can be obtained from the United States Geological Survey (USGS).
Earthquakes during the past 30 Days Date: May 20, 2022
Image: USGS
Earthquakes in the lower 48 during the past 30 days Date: May 20, 2022
Image: USGS
Earthquakes in eastern United States in the past 30 days Date: May 20, 2022
Image: USGS
I found the large number of earthquakes that occurred in Oklahoma in just 30 days to be very interesting. This isn’t something that I thought occurred in the eastern region of the United States.
Earthquakes in Oklahoma during the past 30 days
Date: May 20, 2022
Image: USGS
The image below depicts earthquakes that have occurred in Oklahoma in the past five years. They are fairly small in magnitude, but what is the cumulative effect on the geoid in the region, as well as changes to the orthometric heights of marks due to crustal moment in the region? This is why it is important for the new, modernized NSRS toimplement time-dependent coordinates.
Earthquakes in Oklahoma in the last 5 years Dates: 2017 to 2022
Image: USGS
To better understand the changes to the geoid, NGS performed a survey in Alaska to obtain geodetic data as part of its GeMS program. On May 12, 2022, Kevin Ahlgren, a geodesist at NGS, described in a webinar the observations collected and some of the results.
The presentation provided an overview of a field campaign performed in support of the GeMS program and a time-dependent geoid model. The campaign included static GNSS, relative gravity, and deflection of the vertical techniques on 50 stations in Alaska. The webinar was can be downloaded.
I encourage everyone to download the presentation. The change in the geoid due to geophysical drivers is small, but if the new, modernized NSRS is going to include time-dependent coordinates, then changes in the geoid must be accounted for. For demonstration purposes, NGS provides an example of the time-dependent geoid change in the xGEOID20 webtool. The box below, “xGEOID20 interactive computation output,” is an example of using this tool. The two stations are located in Alaska. As indicated in the output from the tool, the change in the geoid is 8 mm in five years. Again, NGS’s goal is to maintain geoid accuracy at the centimeter level (1 standard deviation) in both absolute and differential geoid undulations. These small changes can become significant over time.
xGEOID20 interactive computation output
Note: DN is the time-dependent geoid change computed between user inputted epoch (t) and t. (Image: NGS)
The last geoid change group that I’ll highlight has to do with the change in the gravity potential (W0) value that defines the model. The NOS NGS 64 Report states that the standing definition of the geoid, as adopted and used at NGS, is the following:
The geoid is the equipotential surface of the Earth’s gravity field which best fits, in a least squares sense, global mean sea level.
As stated in the NOS NGS 64 report, over a century of sea-level measurements imply that global mean sea level (GMSL) was rising at a rate of approximately 1.7 millimeters per year and was rising at a rate of 3.2 millimeters per year between 1993 and 2010 (IPCC, 2014). If NGS is going to define the geoid as theequipotential surface of the Earth’s gravity field that best fits, in a least squares sense, global mean sea level, then the geoid in the new, modernized NSRS must change when the GMSL exceeds a certain threshold.
Again, NGS’ goal is to maintain geoid accuracy at the centimeter level (1 standard deviation) in both absolute and differential geoid undulations. What this means is that as GMSL rises, the value of gravity potential which best fits to GMSL (called W0) will also change. In other words, the surface which was called “the geoid” and had W=W0in 2022 will no longer be the geoid. A new value of W0 (W0new) is chosen, and “the geoid” would now be the surface W=W0new.
So, what does this really mean to users? The NOS NGS 64 Report states on page 37:
“NGS and the Canadian Geodetic Survey have jointly adopted the value of 2.0 m^2/s^2 as the replacement threshold for a new geoid model (and new geopotential datum). This represents approximately 20 centimeters of GMSL (and thus geoid) rise. At the current rate of sea-level change of about +3 millimeters per year (IPCC, 2014), this means NGS expects to replace NAPGD2022 in approximately 60 to 70 years.”
Therefore, this should not be a major concern of users for a long time.
This column highlighted that orthometric heights in NAPGD2022 will be defined through ellipsoid heights and a geoid model, for instance GEOID2022; and therefore, changes in the geoid model will be very important to users estimating orthometric heights using GNSS. It briefly described the geophysical reasons for changes in the geoid that affect the orthometric height of a mark.
If NGS is going to meet the goal of maintaining geoid accuracy at 1 centimeter (1 standard deviation) in both absolute and differential geoid undulations, they will have to address changes in the geoid. The secular changes in the geoid, as indicated in Figure 13 in the NOS NGS 64 report, are very small, ranging from -1.25 mm/year to 1.5 mm/year. Once again, these are small changes to the geoid, but they will accumulate over time, and that is why NGS is including time-dependent coordinates in the new, modernized NSRS.
My February column explained why it is important to account for horizontal movement of marks everywhere, and not just in areas influenced by active crustal movement due to earthquakes such as Southern California.
It provided information about the NOAA CORS Network (NCN) rates of movement based on International Reference Frame of 2014 (ITRF2014) coordinates and horizontal velocity information. It highlighted reports from the National Geodetic Survey (NGS) that describe models that will facilitate users transferring coordinates between reference frames and dealing with intra-frame movement between marks based on surveys performed at different epochs.
NAPGD2022 orthometric heights will primarily be accessed through GNSS technology.
As I stated in my February column, this is not just a horizontal positioning issue. In this month’s column, I address estimates of vertical movement that will have to be accounted for in the new, modernized National Spatial Reference System (NSRS).
NAPGD2022 will provide gridded models for North America (that includes CONUS, Alaska, Hawaii, the Caribbean, Canada, Mexico, Central America and Greenland), American Samoa and Guam/Commonwealth of Northern Mariana Islands (CNMI). My previous columns have described the NAPGD2022 in detail. The revised NOS NGS 64 report mentioned that NAPGD2022 will be built upon ITRF2020. It states that NAPGD2022 will operate equally well in any of the four new terrestrial reference frames developed as part of the new, modernized NSRS in 2022.
As I stated in previous columns, orthometric heights in NAPGD2022 will be defined through GNSS ellipsoid heights and GEOID2022. This means NAPGD2022 orthometric heights will primarily be accessed through GNSS technology. GEOID2022 will be defined in a manner that best fits global mean sea level at the epoch of NAPGD2022.
As in my previous column, to better visualize the potential size of the vertical movement, I used the CORS ITRF2014 coordinates and velocities from the NGS website to create plots depicting the upward velocity (Vu) values for CORS that are designated as operational and have computed velocities. [Note: I use the term upward because that is how it is reported on the NGS CORS website under the tab labeled “position and velocity.” The term upward velocity means movement in both directions — negative is downward and positive is upward.] The box below shows maximum, minimum, average and standard deviations of upward velocity values for each state and territory of the United States.
Table of ITRF 2014 Upward Velocities of US CORSs
The upward velocity values are not as systematic as the horizontal velocity values, and they are significantly smaller. I have highlighted the average value velocity column. As indicated in the table, the values vary from state to state, but they are all small relative to the horizontal movement values. (See my previous column for plots depicting the horizontal values.)
What is interesting is the range of values in some states. For example, Alaska and California have a very large range — understandable because of the active earthquakes and other movement that occur in these states. Also, Louisiana and Texas have a very large range due to local subsidence.
I decided to highlight the values for the conterminous United States (CONUS) in two separate plots. The box “Upward Velocities (Vu) Between +/–5 mm/year in CONUS” depicts upward velocities (Vu) between +/–5 mm/year in CONUS. The box “Upward Velocities Greater than Absolute Values of 5 mm/year in CONUS” depicts upward velocity values greater than +/–5 mm/year.
Upward Velocities (Vu) between +/- 5 mm/year in CONUS
Image: Dave Zilkoski
It’s obvious that most of the vertical movement values are between +/–5 mm/year in CONUS. There are some large values in California, Louisiana and Texas. This is highlighted in both plots.
Upward Velocities (Vu) Greater than Absolute Values of 5 mm/year in CONUS
(Image: Dave Zilkoski)
As indicated in the plots, some of the values exceed 10 mm/year. In five years, the heights of marks in these regions could potentially change by 5 cm. An example of the potential subsidence in the Houston-Galveston, Texas, region is depicted in the box below. As indicated in the plot, some marks are subsiding greater than 2 cm/year. That means in five years the marks in that region could have subsided more than 10 centimeters.
Estimate of Subsidence in the Houston-Galveston, Texas, Region
The box below depicts the values in Alaska. Most of these values indicate that the marks are uplifting. Some of these values exceed 10 mm/year. Once again, height coordinates in some regions will potentially change 5 cm in five years. I generated a separate plot for the southeastern region of Alaska. (See the box titled “Upward Velocities (Vu) in Southeastern Alaska.”)
Upward Velocities (Vu) in Alaska [All Values]
Image: Dave Zilkoski
Upward Velocities (Vu) in Southeastern Alaska [All Values]
Image: Dave Zilkoski
As I did in my previous columns, I prepared several plots that depict the upward velocities in various regions of the United States. See the boxes below for North Carolina, Missouri Southwest U.S. The plots indicate that the magnitude of the vertical movement varies from state to state, as well as within the states.
CORS ITRF 2014 Upward Velocities (Vu) in Missouri [All Values]
Image: Dave Zilkoski
CORS ITRF 2014 Upward Velocities (Vu) in Southwest U.S. [All Values]
Image: Dave Zilkoski
CORS ITRF 2014 Upward Velocities (Vu) in Southwest U.S. [Values Between +/- 5 mm/year]
Image: Dave Zilkoski
I also generated plots that separately depict the positive and negative upward velocities for the conterminous United States. There are more negative upward velocity values than positive values.
CORS ITRF 14 Positive Upward Velocities (Vu) in Conterminous U.S. (Values between 0 and 5 mm/year)
Image: Dave Zilkoski
CORS ITRF 2014 Negative Upward Velocities (Vu) in Conterminous U.S. (Values between -5 and 0 mm/year)
Image: Dave Zilkoski
The table below provides the number of CORS with negative upward velocity values and the number of CORS with positive values for every state and territory of the United States. I have highlighted the states and territories that have more positive values than negative values. As you can see, only six states have more positive upward velocities than negative values. Four of the six states are in Northeastern United States.
Table of ITRF 2014 Positive and Negative Upward Velocities for United States
So far, this column has only addressed the vertical movement at the NCN CORS. The values at the sites indicate the potential movement of marks in the area of the CORS. The rates are based on GNSS data and have an estimate of error associated with them.
I’m not sure how NGS will address the vertical movement effects in the new, modernized NSRS. That said, NGS will be monitoring the CORS and looking for trends to help describe the movement at the CORS. These trends will be an indication of what may be happening in the area.
In addition to the movement of individual marks, there are geophysical reasons for changes in the geoid. As I stated in previous columns, orthometric heights in NAPGD2022 will be defined through ellipsoid heights and GEOID2022. Therefore, changes in the geoid model will be very important to users estimating orthometric heights using GNSS.
As stated in the NGS 64 report, NGS has set a goal of maintaining geoid accuracy at 1 centimeter (1 standard deviation) in both absolute and differential geoid undulations. Figure 13 from the NGS 62 Report depicts an estimate of the secular change in the geoid. As indicated in the plot, the changes are very small, ranging from –1.25 mm/year to 1.5 mm/year.
What I find interesting is the small negative change in the southeastern United States. There are other drivers for geoid changes. Future columns will address some of these changes and what it means to users.
Figure 13 from NOS NGS 62 Report
Image from NGS website: Blueprint 2 Revised NOAA_TR_NOS_NGS_0064.pdf
Figure 13 – Secular Geoid Change
Lastly, I’d like to highlight a new service from NGS: “NGS Webinar Series Certificates of Attendance.” See the box titled “Ways to Earn a Certificate of Attendance.” Basically, users can earn certificates by viewing a webinar after it has been posted by NGS. This is very useful for users who could not attend the original webinar. I encourage all users to check out the site to find out more information about the new service.
Ways to Earn a Certificate of Attendance
Image from NGS website: https://geodesy.noaa.gov/web/science_edu/webinar_series/certificates.shtml
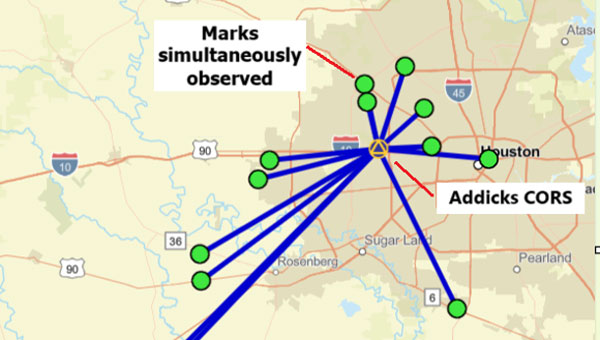
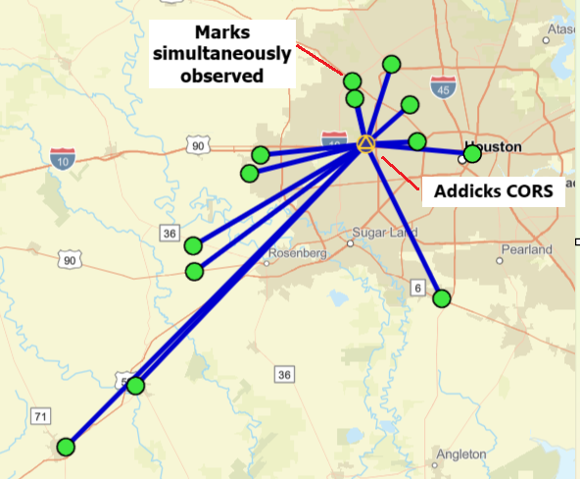
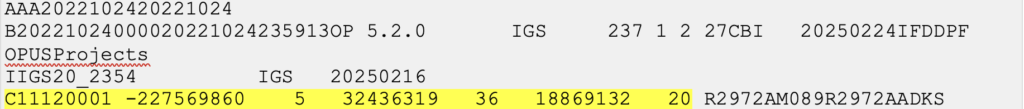
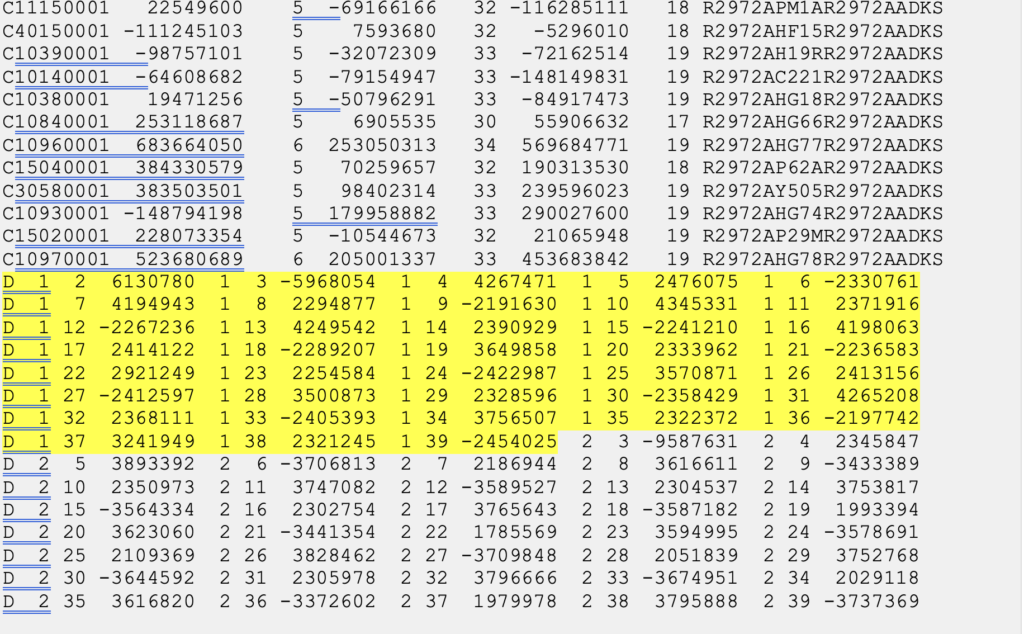
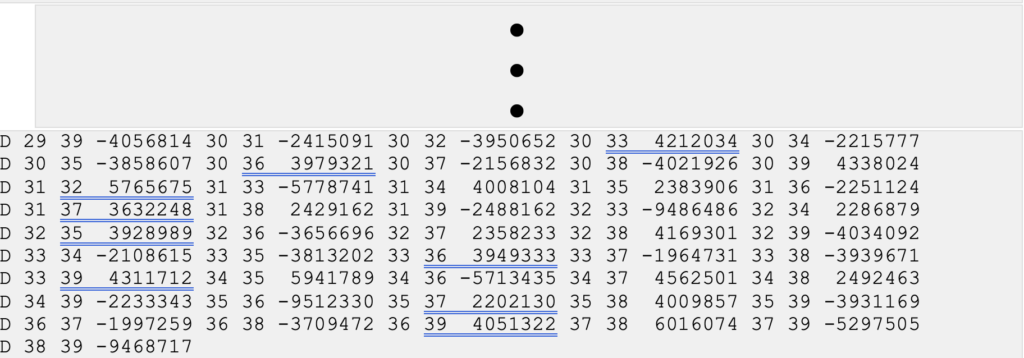
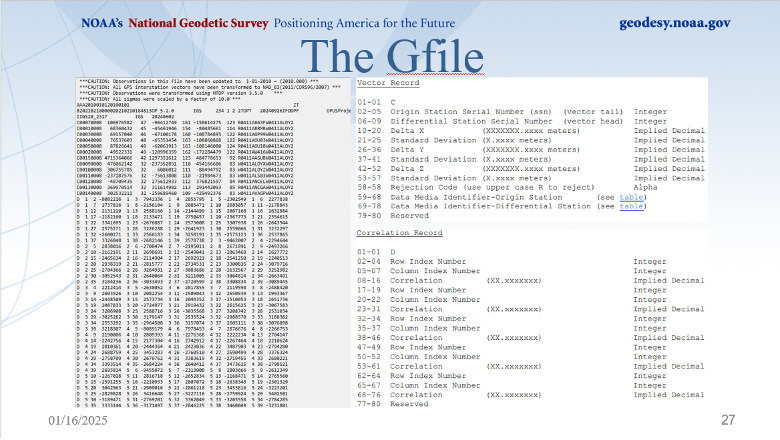
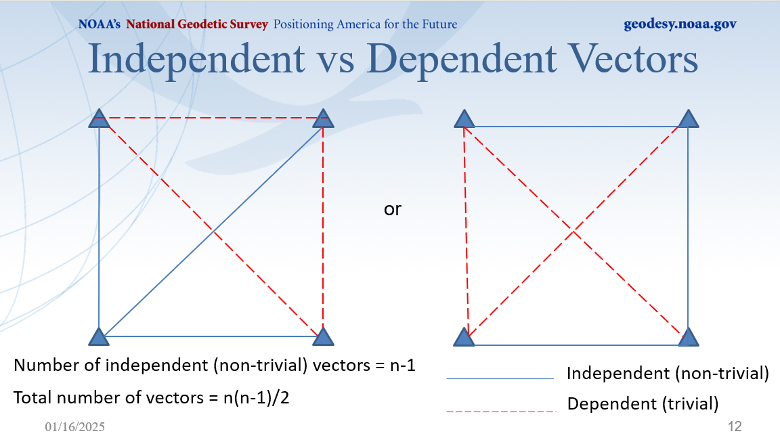
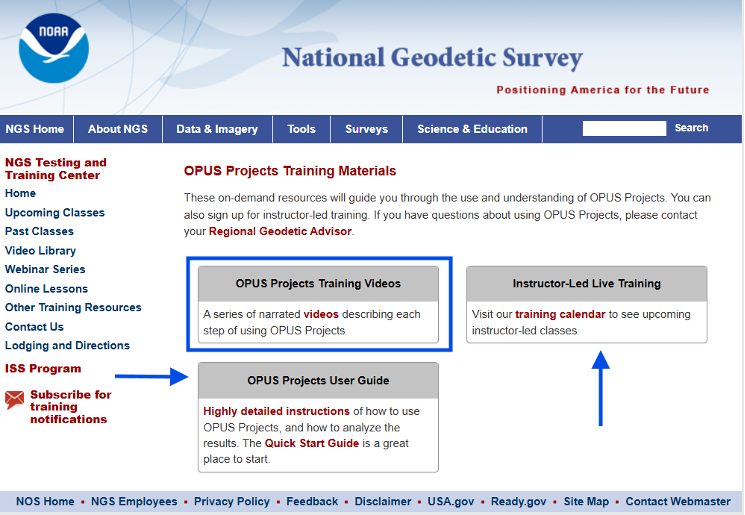
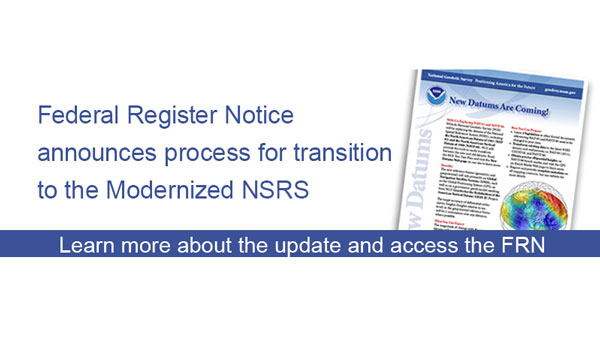
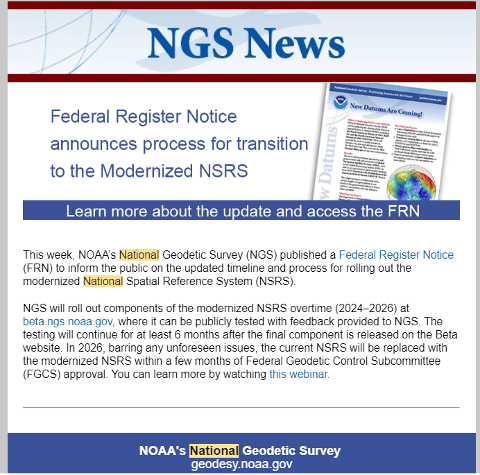
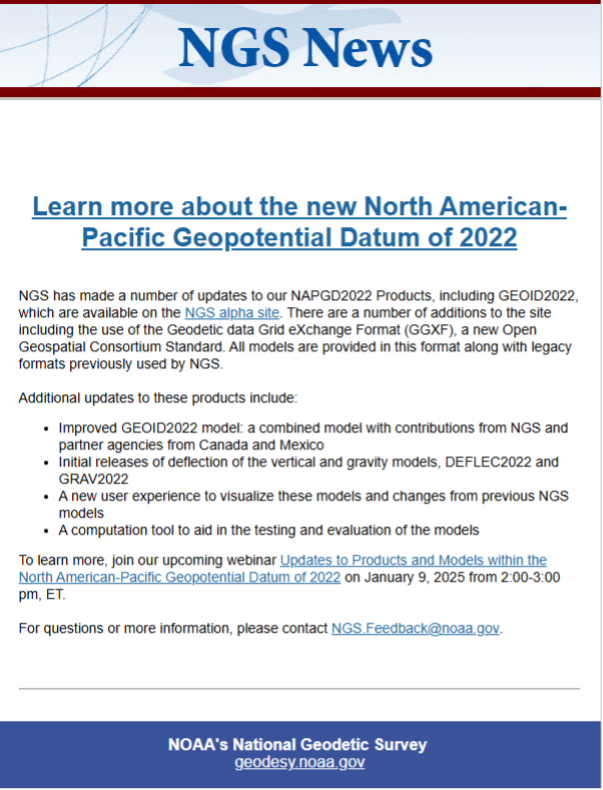
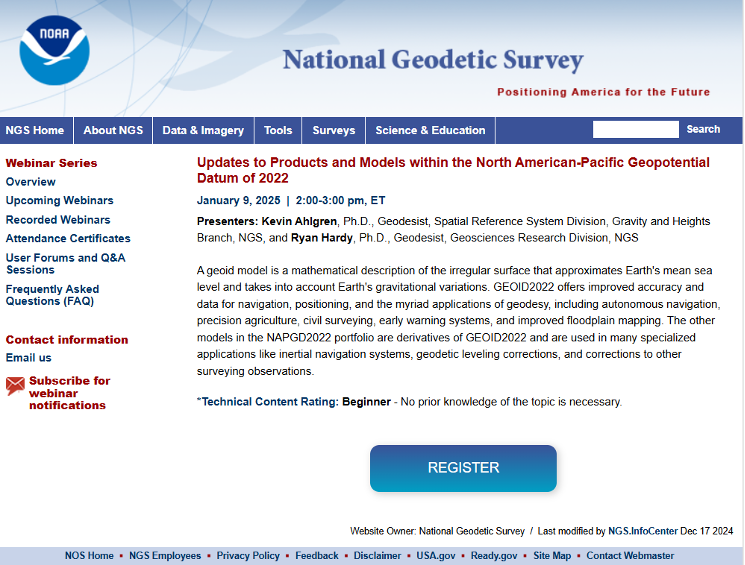
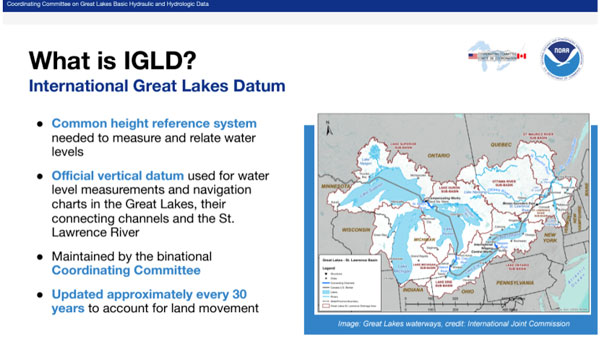


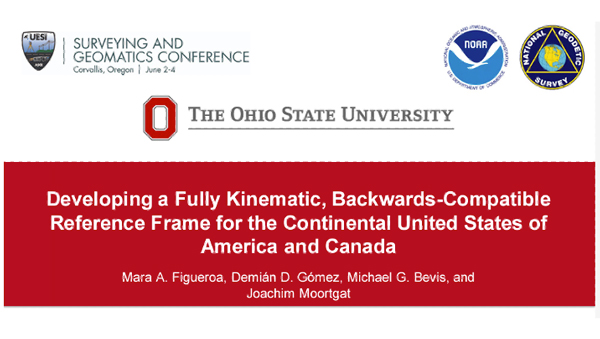
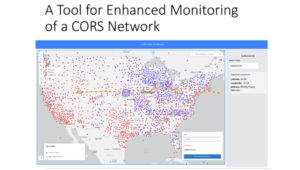
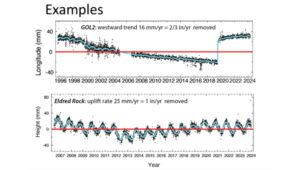
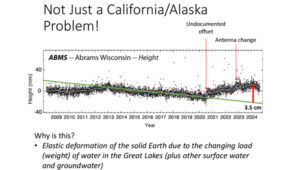
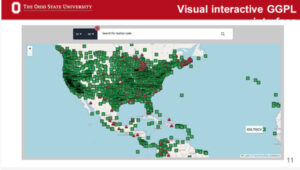
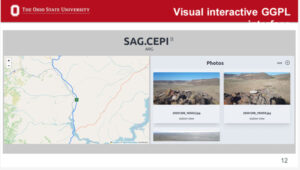
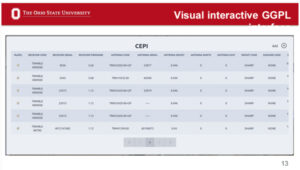
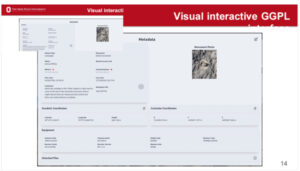
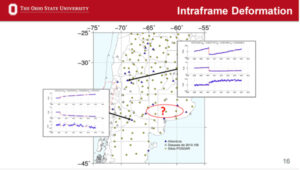
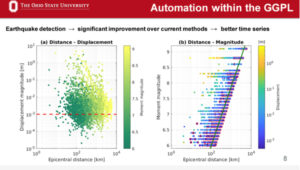
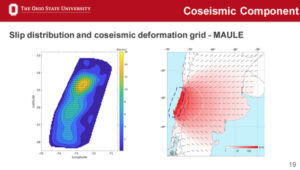


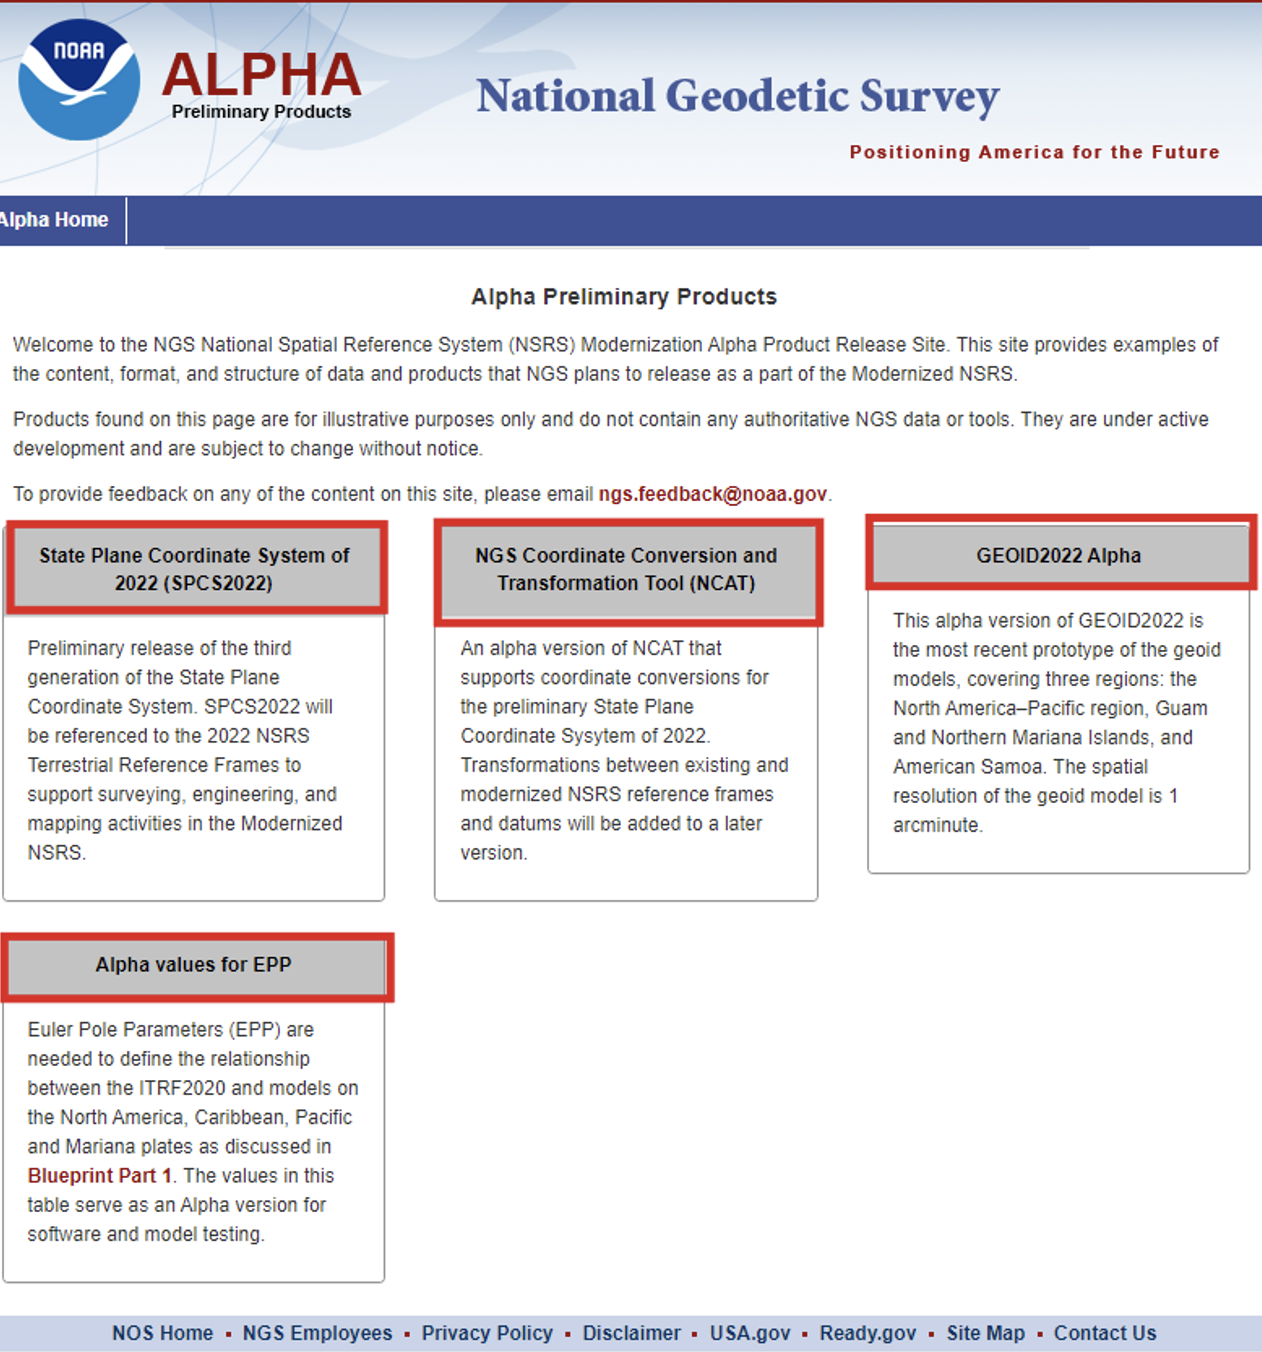
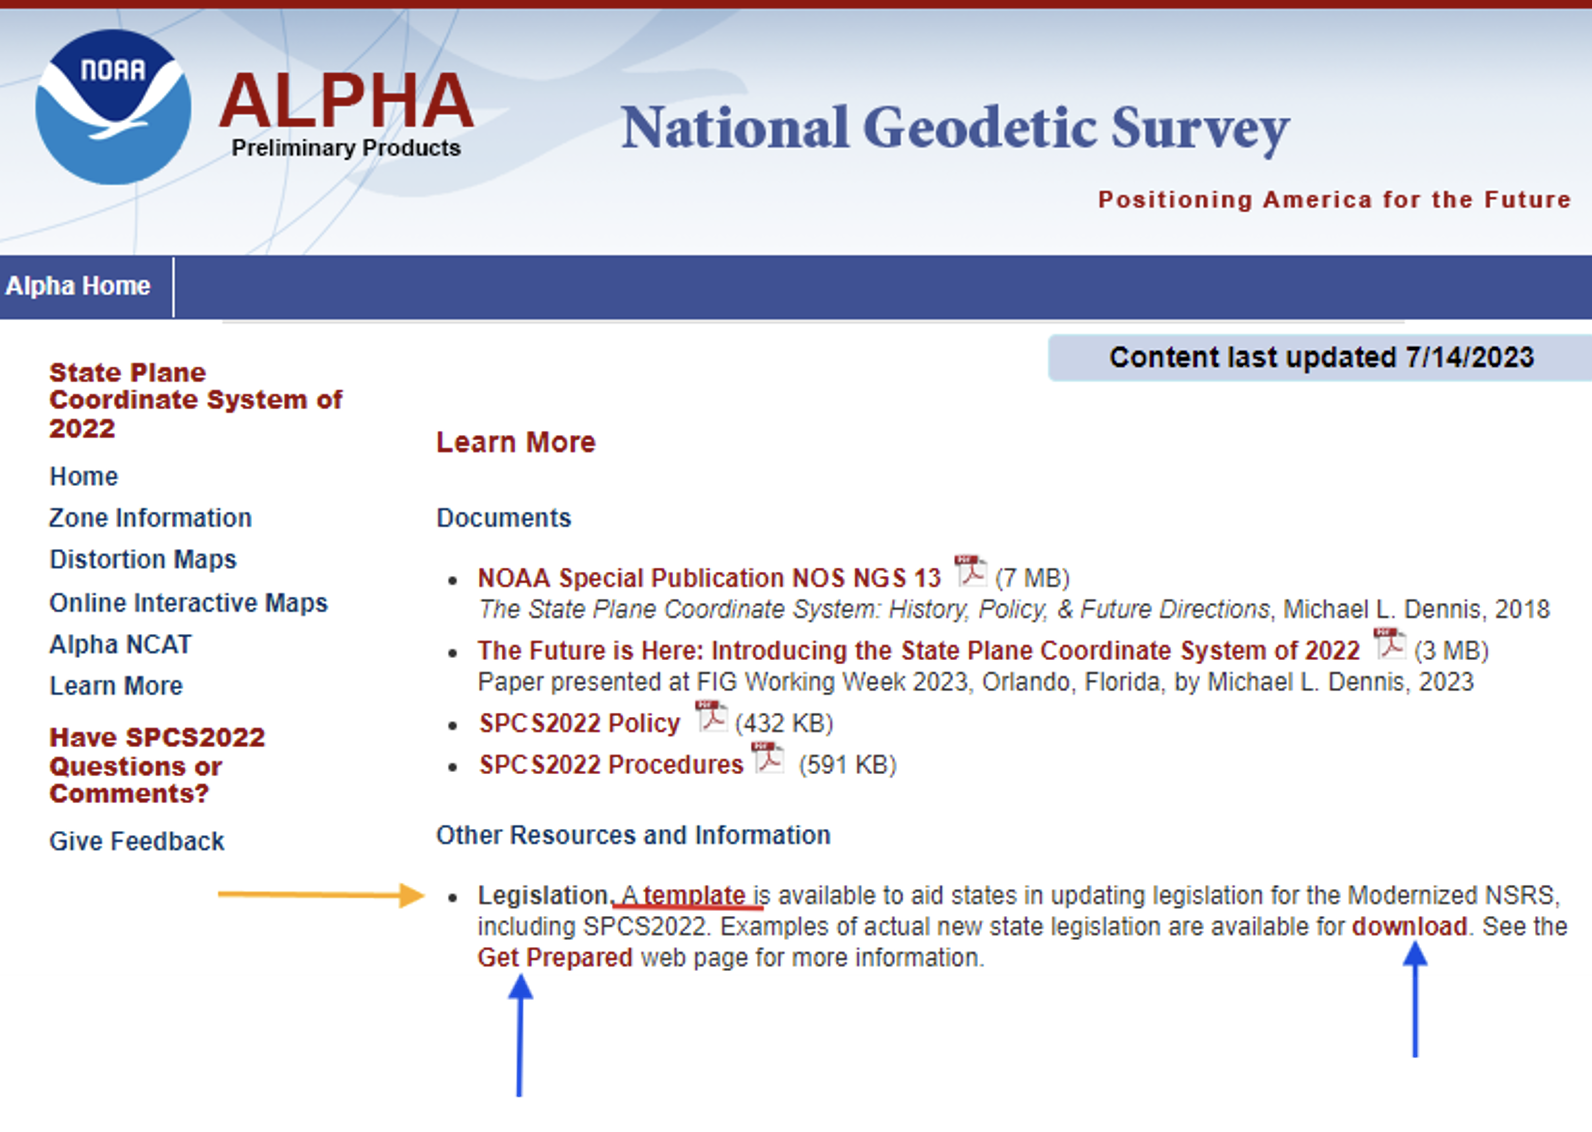
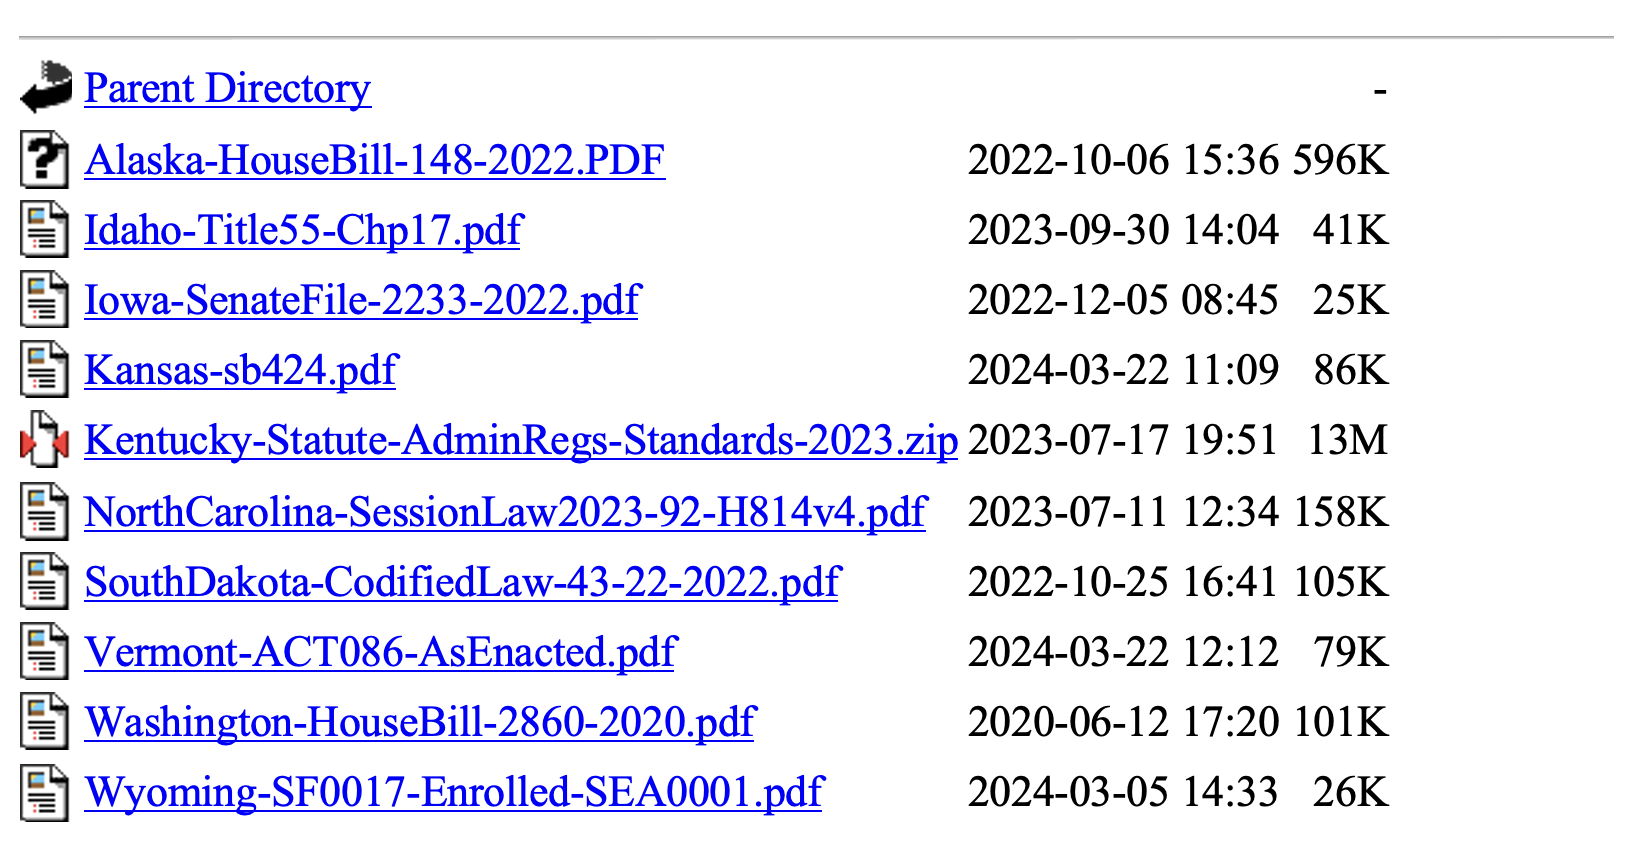
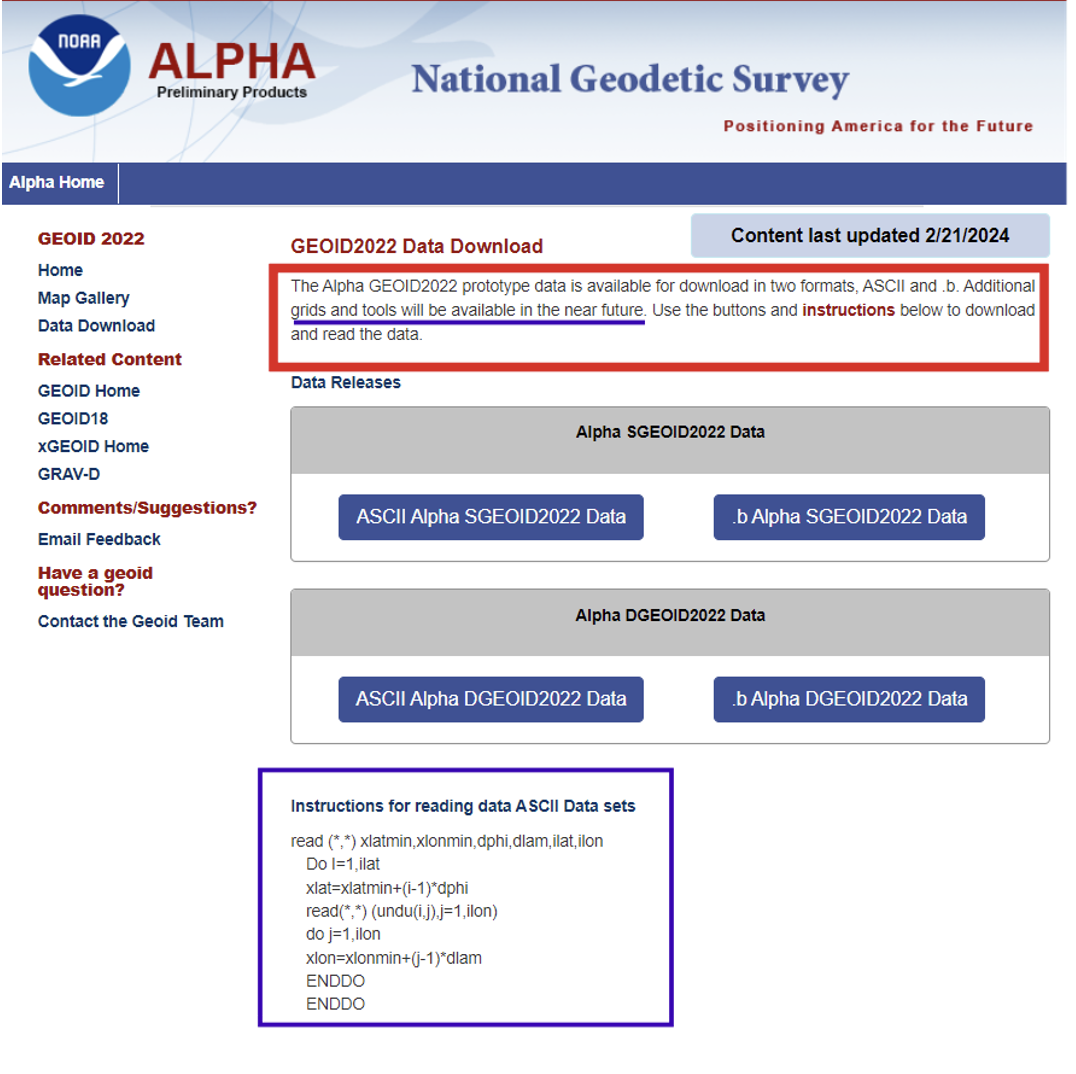
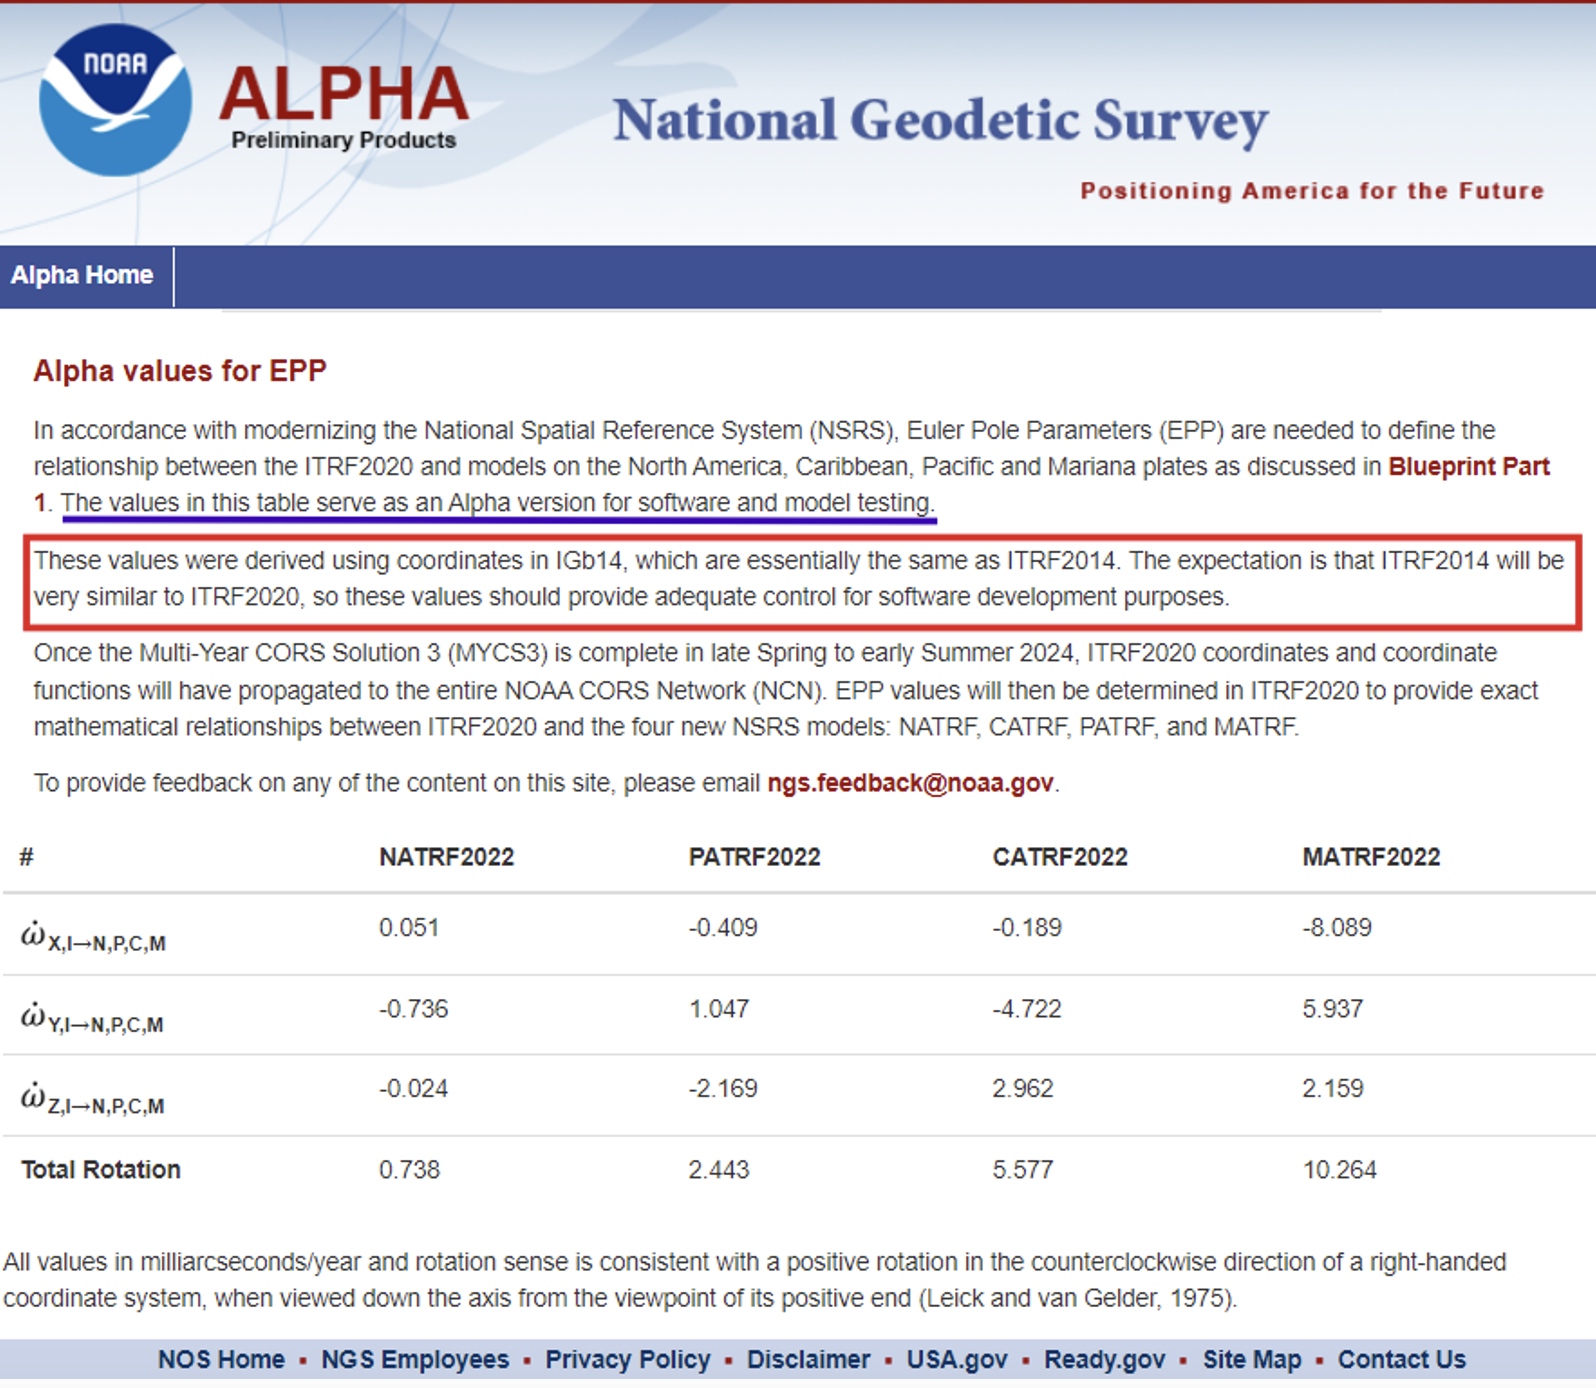


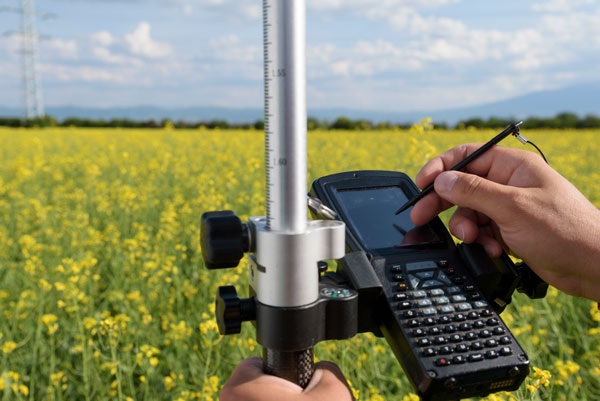
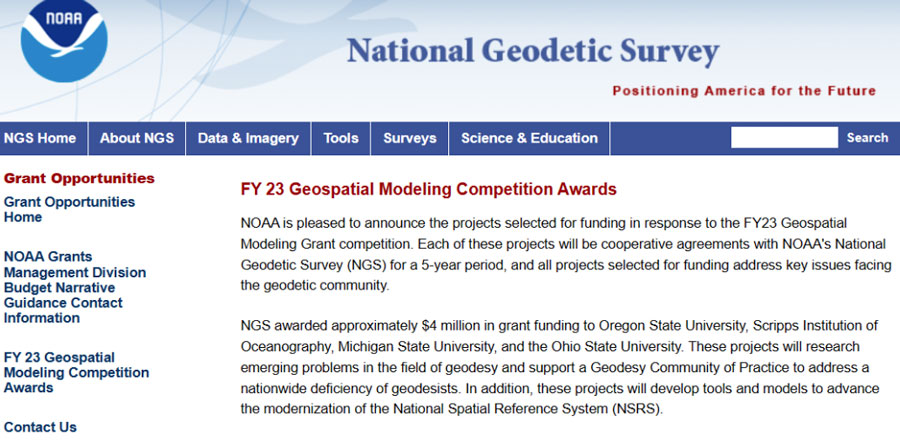
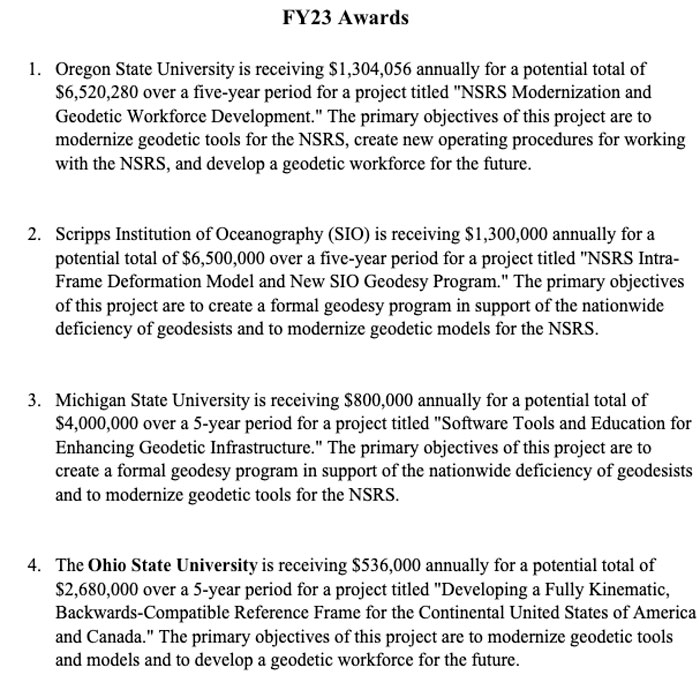
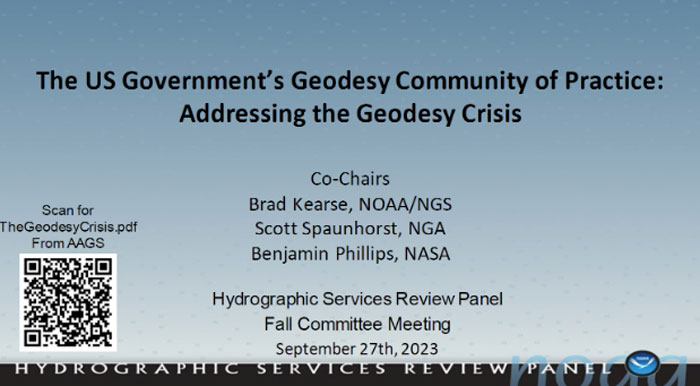

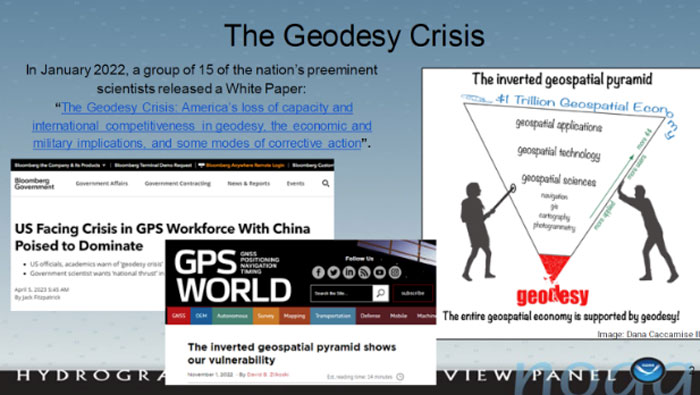
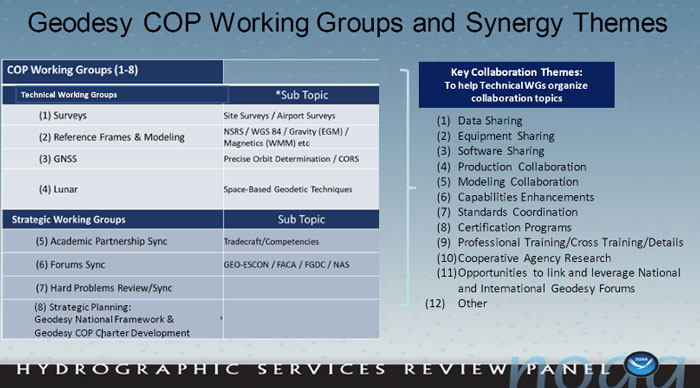
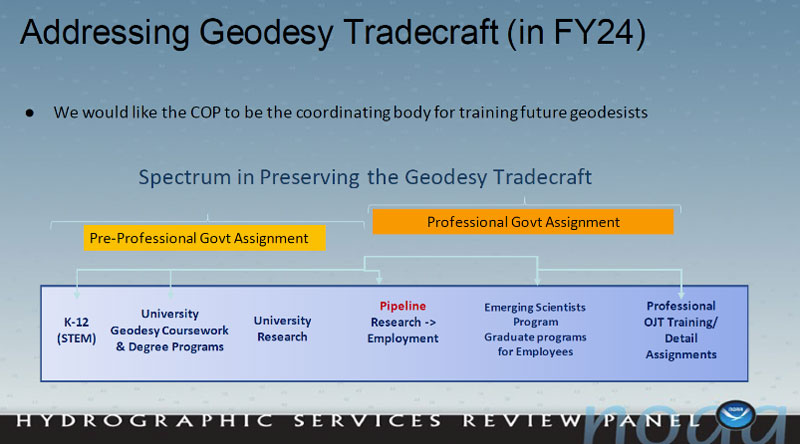
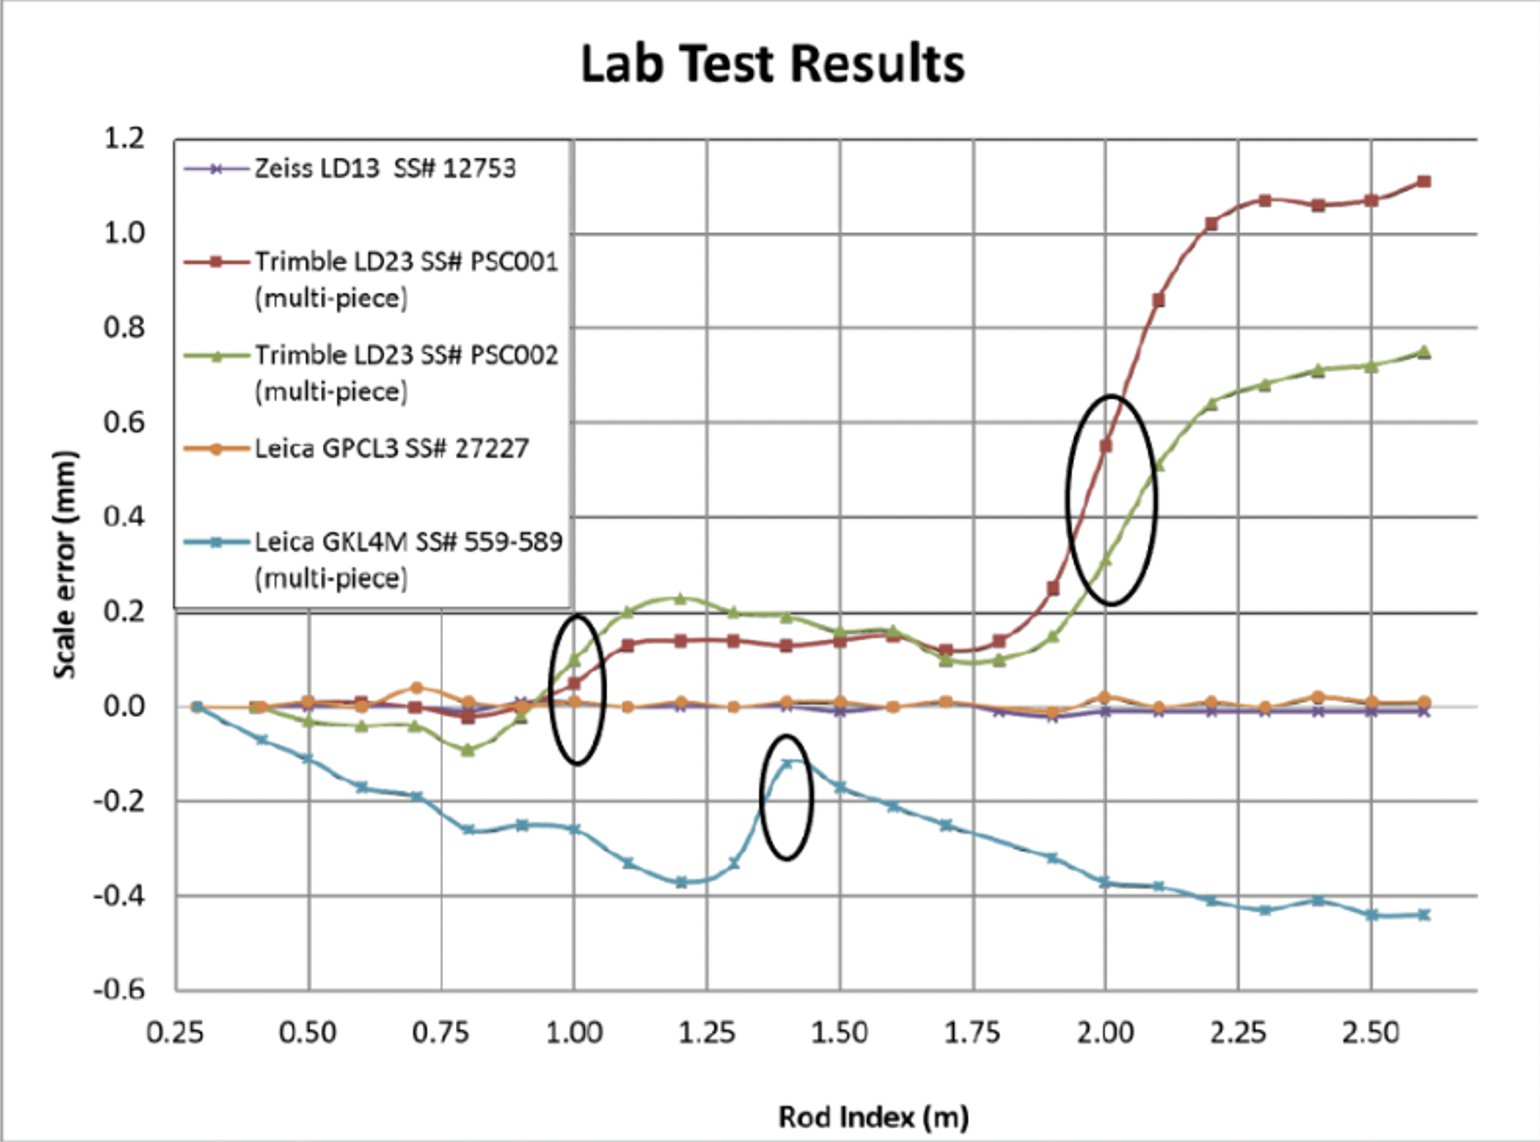
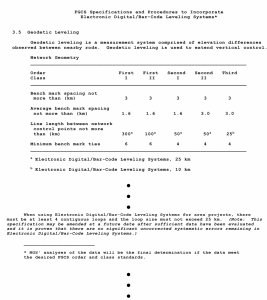
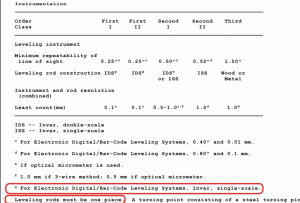
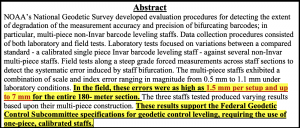
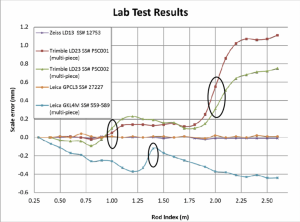
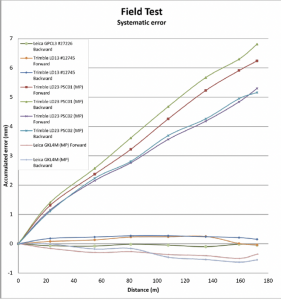
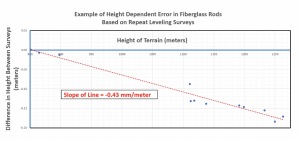

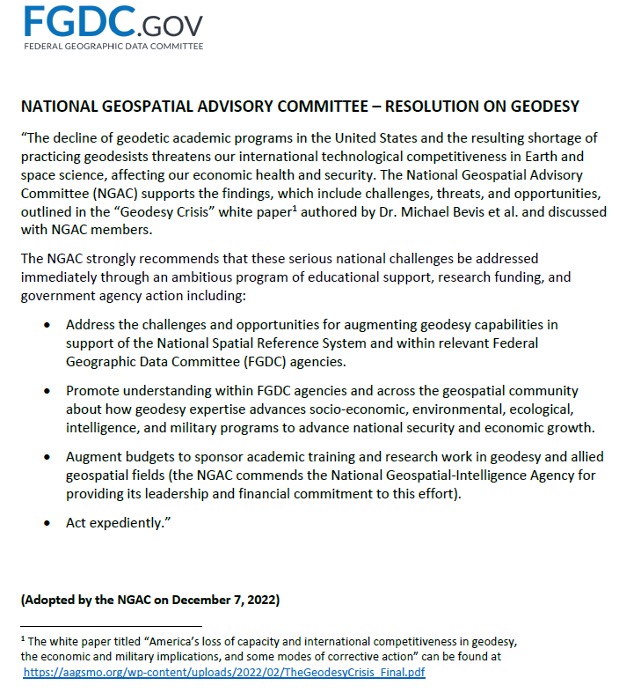
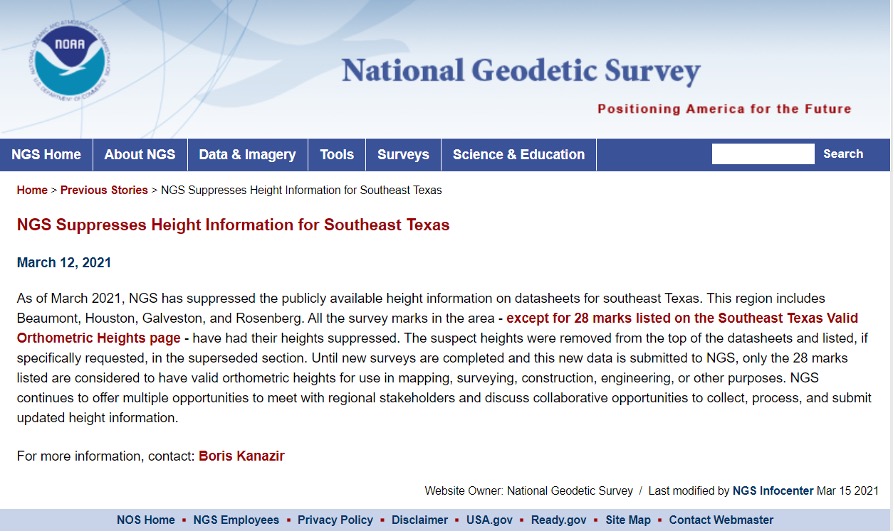
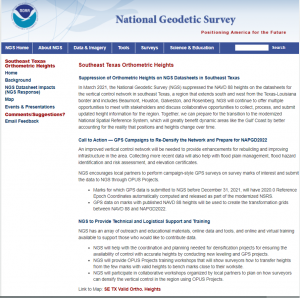
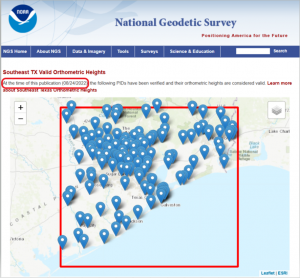
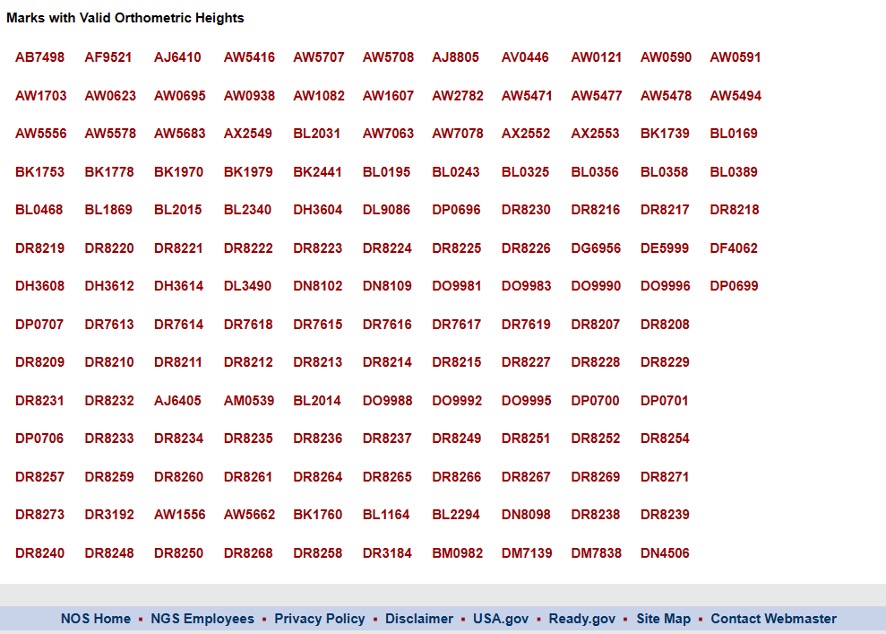
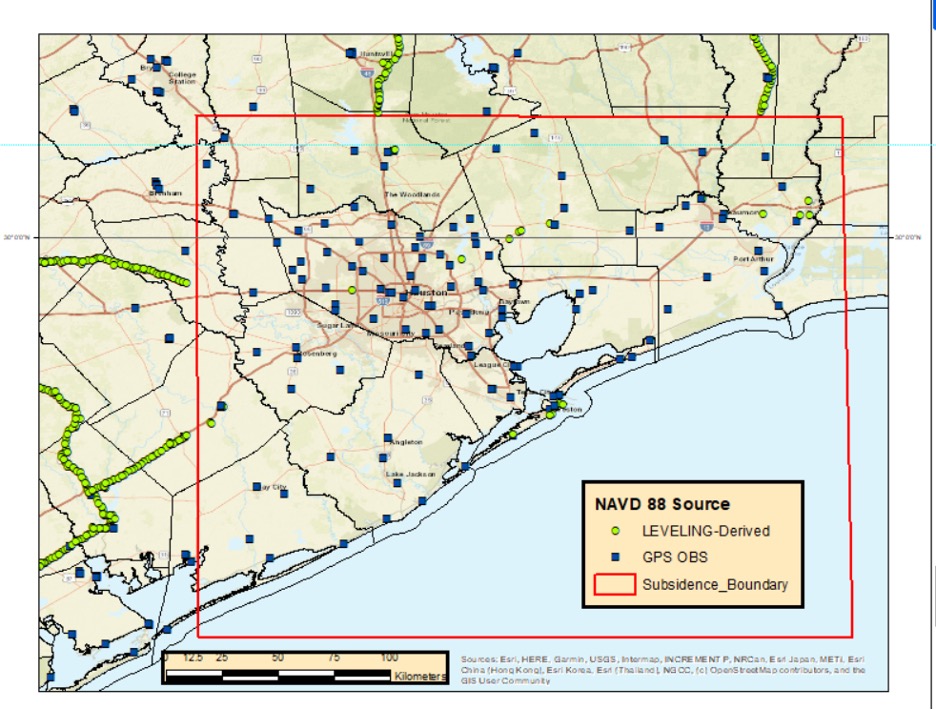
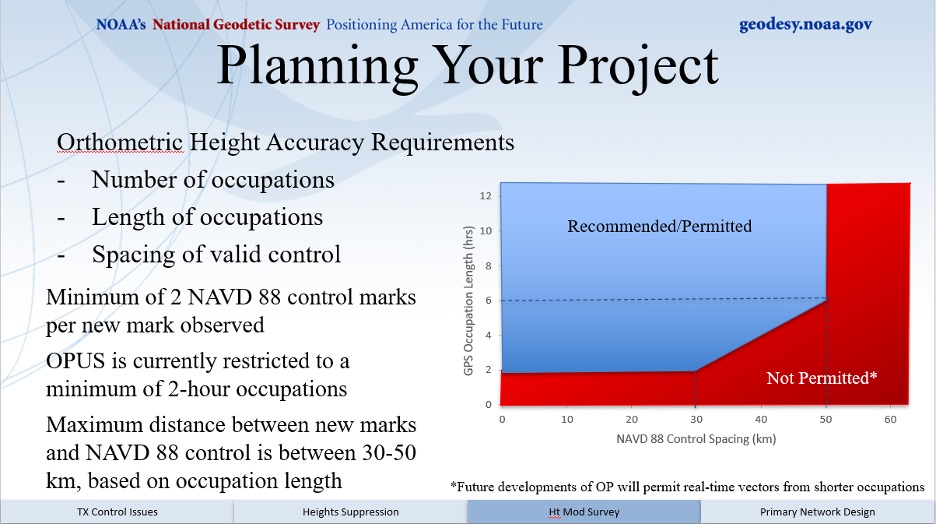
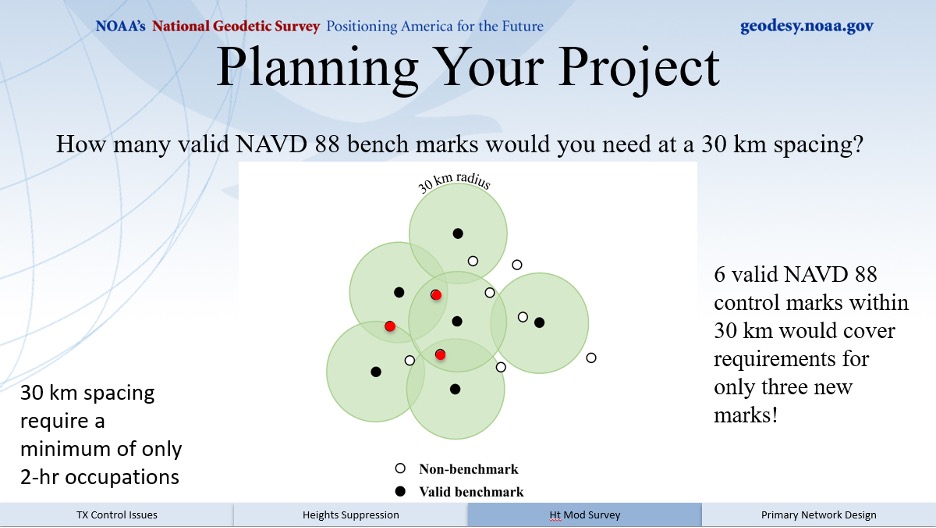
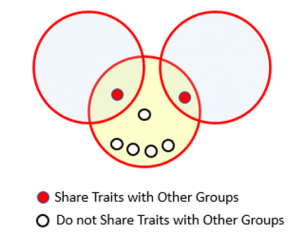
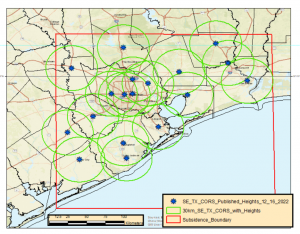
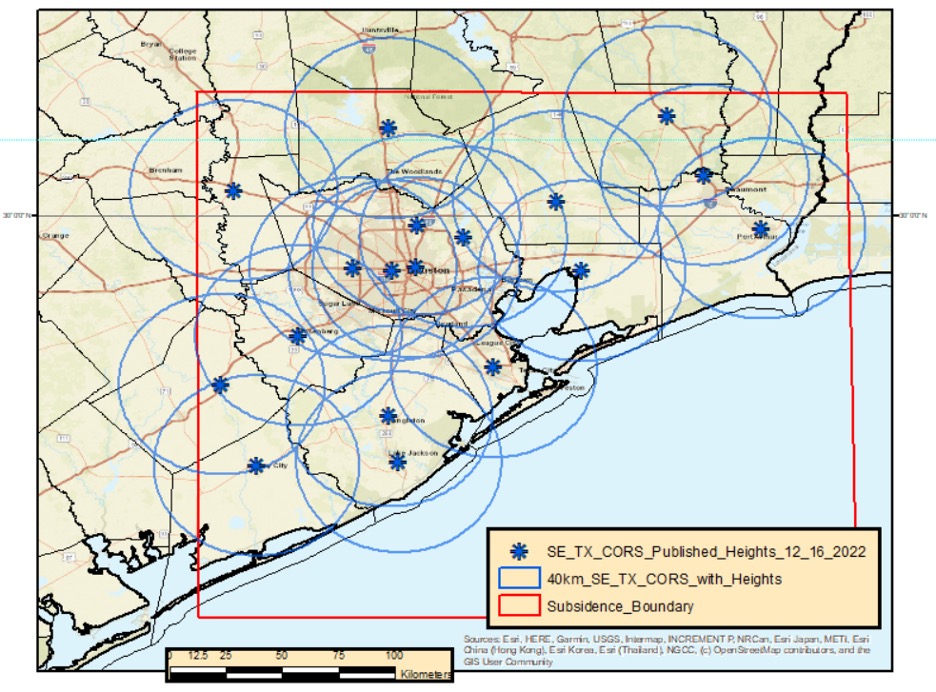
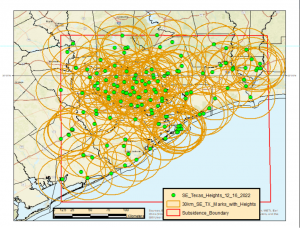
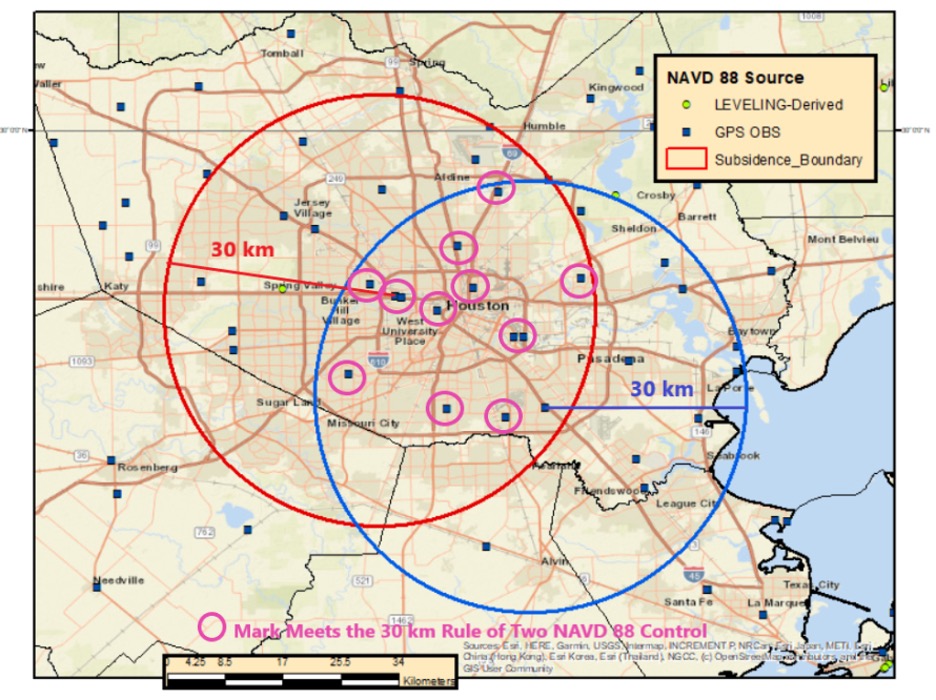
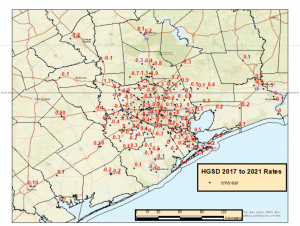
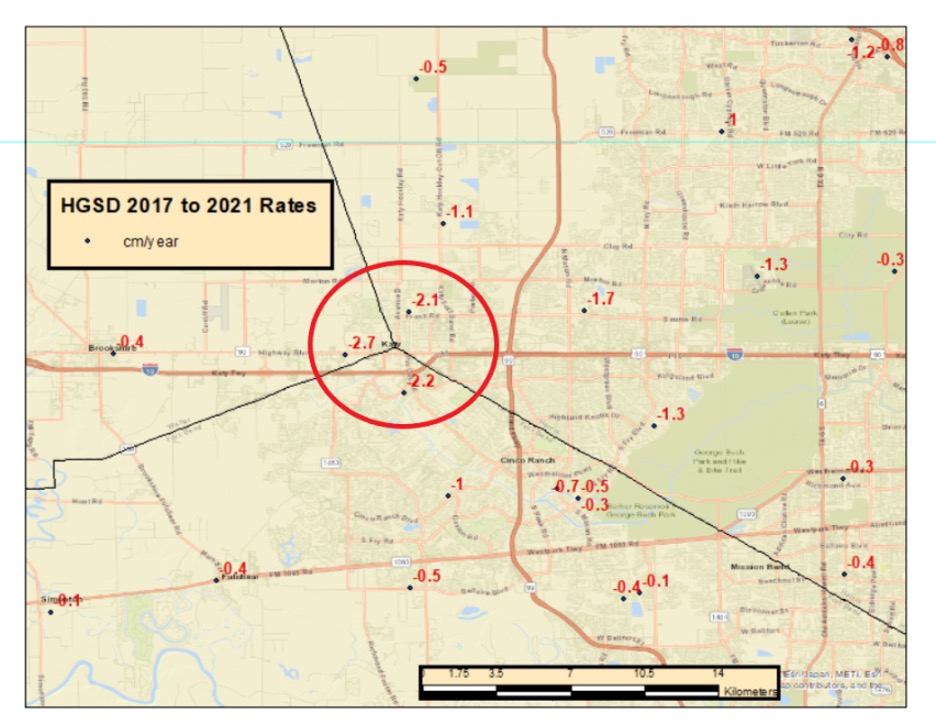
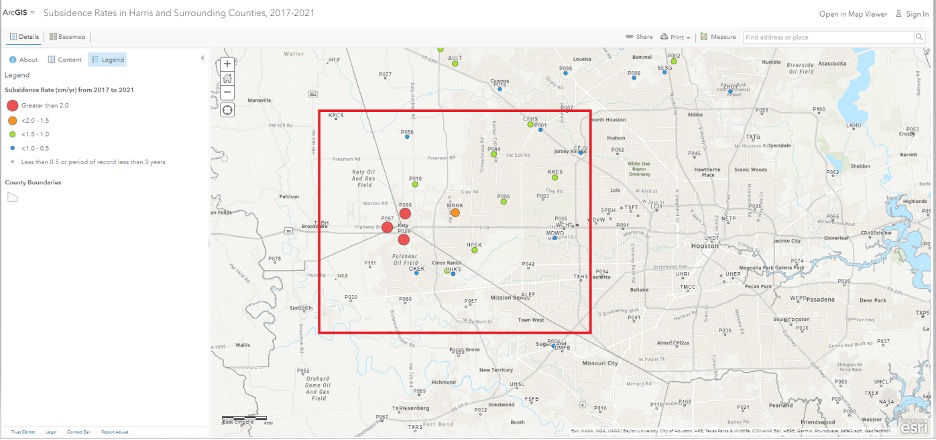
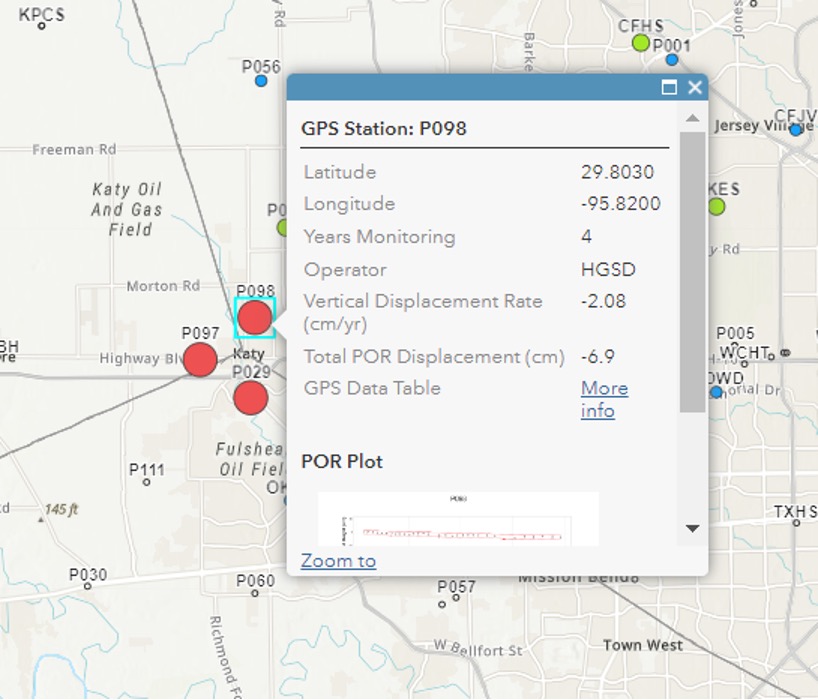
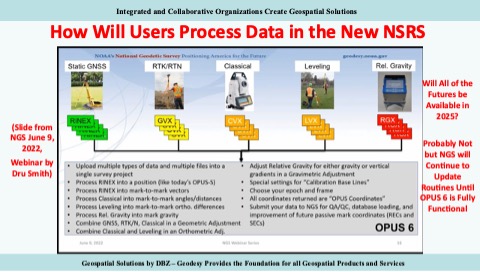
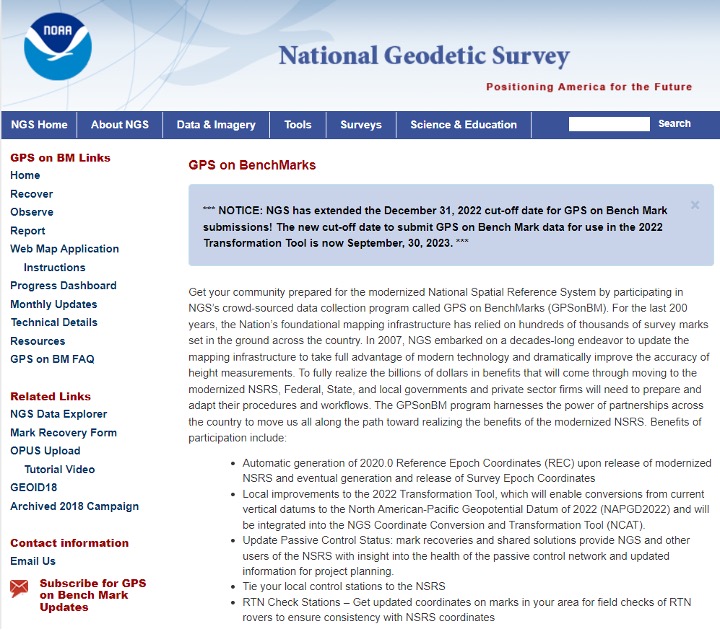


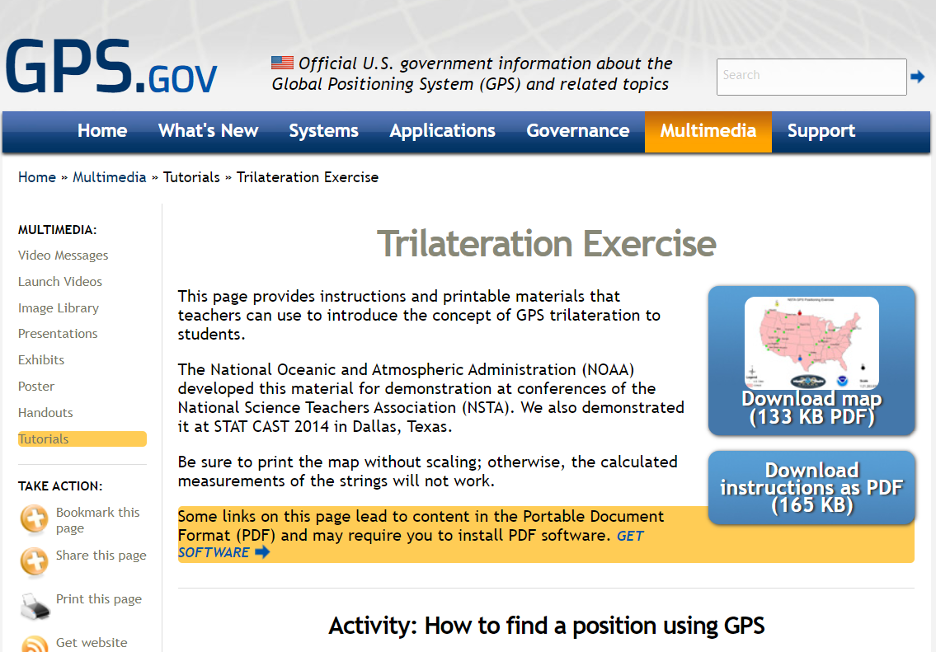
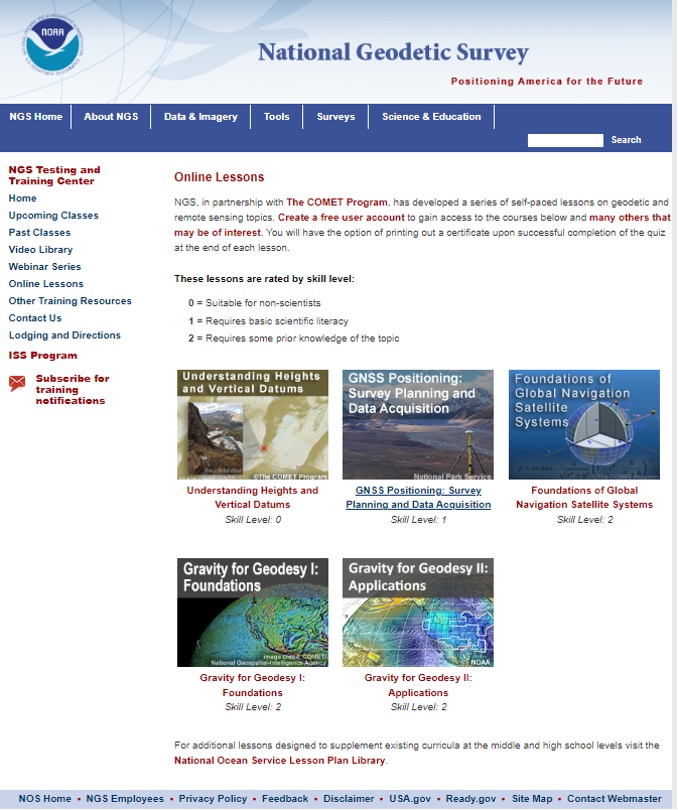


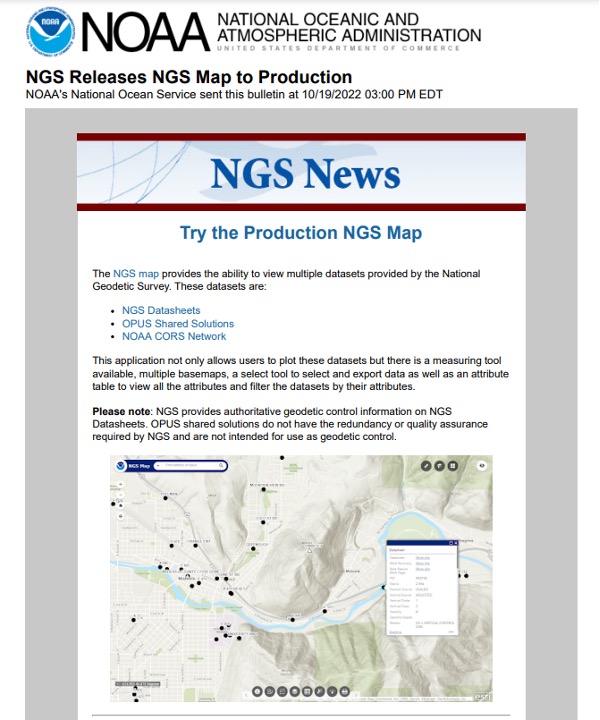
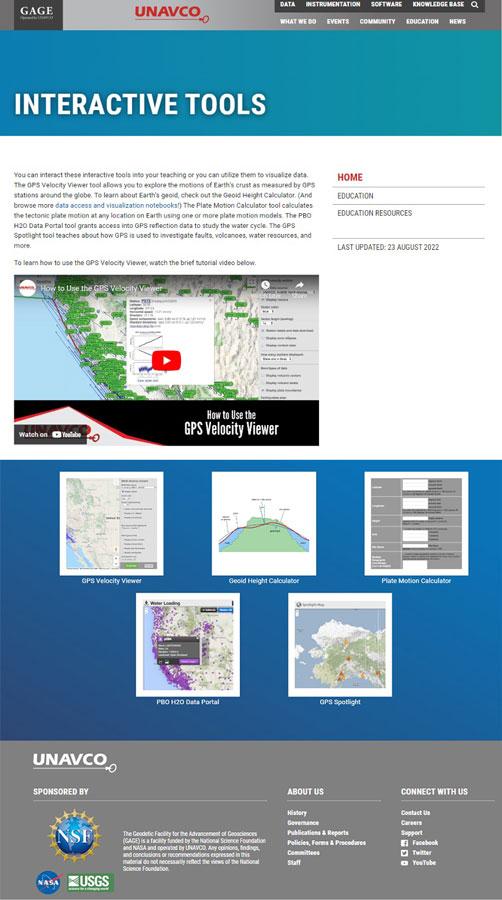
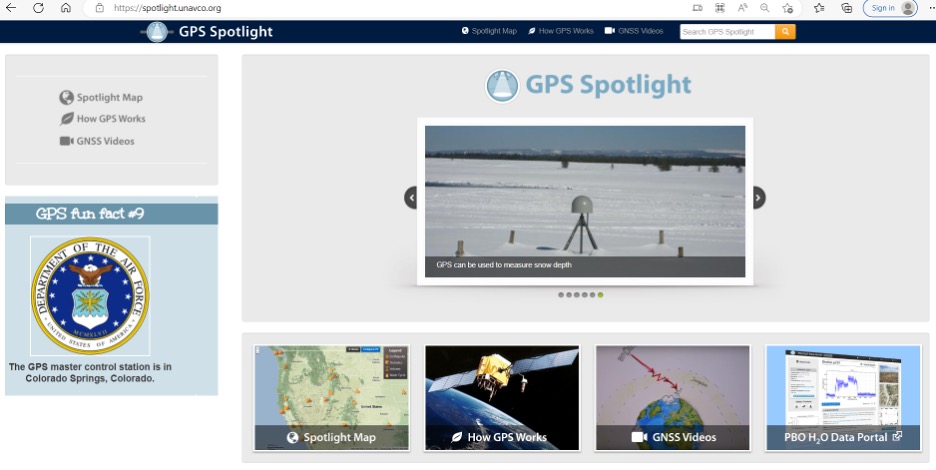


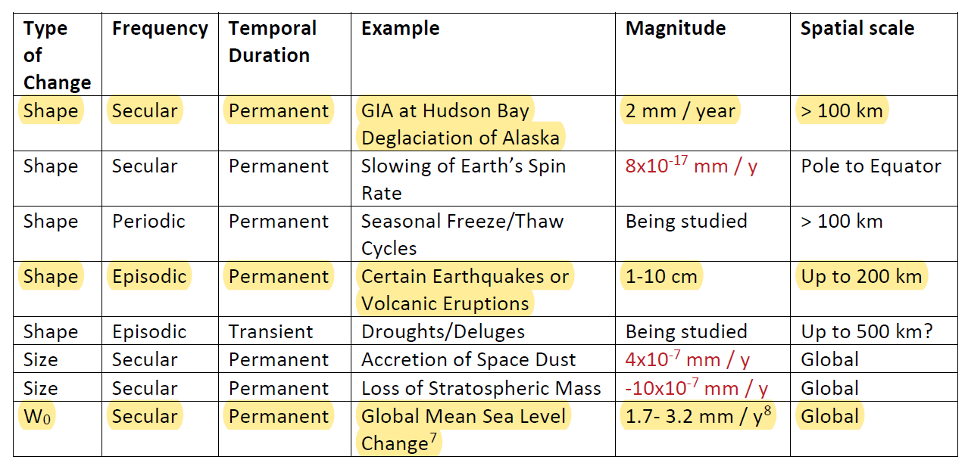
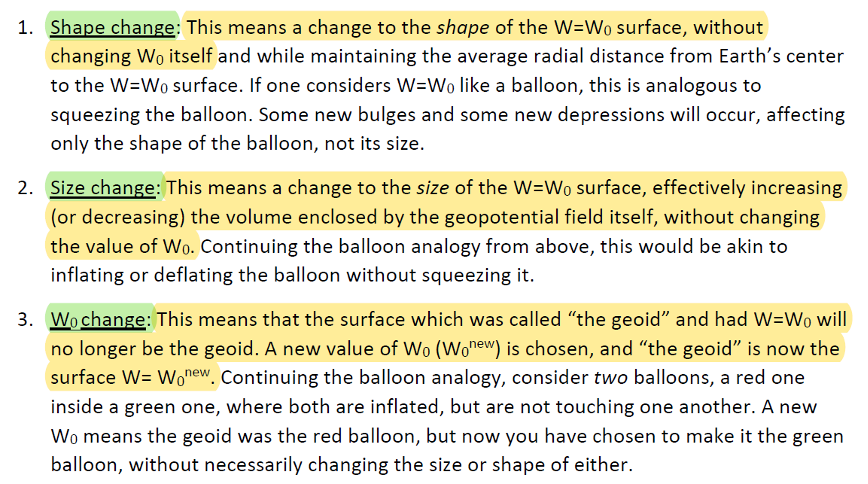
![Figure 32: Geoid rate over CONUS based on the GSFC mascon model [mm/yr] (Image: NOAA)](https://stage.globalpositioningnews.com/wp-content/uploads/2022/05/Geoid-rate-CONUS.jpg)
![Figure 33: Geoid rate over Alaska from GSFC mascon model [mm/yr] (Image: NOAA)](https://stage.globalpositioningnews.com/wp-content/uploads/2022/05/geoid-rate-alaska.jpg)