Wear Elite is a personal AI platform designed to unlock the next generation of truly personal, always-on, intelligent wearable computing devices. It works acrossWearOS by Google, Android and Linux with a neural processing unit (NPU) for on-device AI and advanced suite of ultra-low power connectivity solutions.
The Snapdragon Wear platform introduces a multi‑mode connectivity architecture integrating six advanced technologies: GNSS, 5G RedCap, Micro‑Power Wi‑Fi, Bluetooth 6.0, UWB and NB‑NTN. The company’s GNSS solution enables advanced processing for precise location context that helps AI better understand where users are and adapt interactions accordingly.
Snapdragon Wear Elite delivers key on‑device capabilities that support rich, real‑time agentic experiences. By integrating the Qualcomm Hexagon NPU to support up to billion‑parameter models at the edge, and pairing it with advanced sensor fusion, high-performance, low-power connectivity and computing, Snapdragon Wear Elite enables a new class of Personal AI experiences, including context‑aware recommendations, natural voice interactions, life logging and AI agents that can take actions and orchestrate tasks on users’ behalf.
Snapdragon Wear Elite delivers a massive leap in power efficiency backed by 5x improvement on single-core CPU performance and up to 7x faster GPU, for app launching, multitasking and smoother rendering.
The platform supports multi-day battery life, reducing charging sessions, while advanced power management enables 30% longer day of use compared to the previous generation. When recharging is needed, rapid charging powers a device up to 50% in approximately 10 minutes.
Polaris Wireless, a provider of software-based wireless location solutions, announced the commercial availability of a high-accuracy carrier-independent 3D location platform for application developers. By integrating their applications to the new platform, developers can provide end users with pinpoint location, including indoors and in high-rise buildings with floor level accuracy, delivering enhanced situational awareness and improved operational efficiency, according to the company.
Polaris Wireless has integrated its new platform with Orion Labs, Inc., a San Francisco-based company delivering instant and secure voice and location communication.
The Polaris Wireless 3D location platform is cloud-based and is available to application developers via a standard Android and iOS SDK. It can locate devices on the vertical axis within 3 meters, floor level, utilizing all available signals and sensor measurements combined with the company’s patented algorithms. By operating independently, or “over the top,” of wireless carrier networks, the platform is “universal,” enabling applications to locate any device on any network.
“Orion’s customers in hospitality, retail, healthcare, and public safety require pinpoint accuracy on a person’s location inside a building. Polaris Wireless’ platform helps us deliver that location capability, both for teams to see which floor they’re on or room they’re in, as well as to integrate location awareness with Orion Voice Bots and advanced AI-driven services,” said Jesse Robbins, Founder and CEO of Orion Labs.
Orion will demonstrate its solution based on the Polaris Wireless 3D location platform at the International Wireless Communications Expo (IWCE) in Las Vegas March 4-8 in booth No. 3371.
Polaris Wireless CEO, Manlio Allegra, will be participating in an IWCE panel titled “Impact of Enhanced Location Accuracy on Public Safety and 911 Services” on Wednesday, March 6 at 11:45 a.m.
Allystar Technology Co. Ltd., headquartered in Shenzhen, China, has released a multi-band multi-GNSS chipset, the HD9310. The new product is based on the Cynosure III architecture integrating multi-band multi-system GNSS RF and baseband.
A multi-band, multi-system system-on-chip, it supports BeiDou-3 and is capable of tracking all global civil navigation systems (GPS, BeiDou, Galileo, GLONASS, IRNSS, QZSS and SBAS) in all bands (L1, L2, L5, L6), said Simon Sun, Allystar general manager.
Photo: Allystar Technology
Designed for high-precision applications, the HD9310 measures 5.0mm x 5.0mm. The architecture integrates floating-point arithmetic units based on ARM CortexM4, 160 KB RAM, 32KB backup RAM with VBAT, 386 KB embedded FLASH and peripheral interfaces UART, I2C, SPI, GPIO, CAN.
In terms of the manufacturing processes, it adopts a 40nm process and incorporates a variety of advanced design technologies, endowing it with very power consumption: less than 50mA.
The quad-flat no-leads package allows customers to reduce printed circuit board and bill of materials costs while reducing the number of peripheral devices. This chip supports CAN interface and can be widely used in vehicle management, car navigation, wearable devices, GIS data collection, precision agriculture, smart logistics, driverless, engineering survey and other fields.
“The HD9310 supports three options of RF setting — A, B, C — for product developers to quickly bring their ideas to the different application and markets,” added Shi Xian Yang, high precision project manager at Allystar.
Three available options for the HD9310 chipset. Graphic: Allystar Technology
Option A, focused on L5 band, L5/E5, maximizes measurement accuracy and improves multipath mitigation based on higher chip rate.
Option B is focused on L2 band, and suitable for relative position applications, for example, real-time kinematic (RTK), because worldwide continuously operating reference stations (CORS) commonly support L1/L2/L1OF/L2OF.
Option C is focused on the L6 band and is designed for PPP applications, receiving state space representation (SSR)-type corrections to be broadcast from satellites in the coming future, and supporting B3I already.
The HD9310 comes with built-in support for standard RTCM Protocol (MSM), supporting multi-band multi-system high-precision raw data output, including pseudo range, phase range, Doppler, SNR for any kind of 3rd party integration and application.
Module. Allystar Technology also has launched a multi-band multi-GNSS module, TAU1302, which integrates the HD9310 chipset and measures 12 × 16 × 2.3 millimeters.
With the features of small size, low power consumption (<50 mA), and ease of integration and mass production, HD9310 is suitable for high-precision applications such as vehicle management, car navigation, wearable devices, GIS data collection, precision agriculture, smart logistics, driverless, engineering survey and other fields.
Customer samples of the HD9310 chipset are available now.
Representatives from the global automotive industry gathered at the the Intelligent Transport Systems (ITS) World Congress in Copenhagen in September. At a “Galileo for Mobility” session, panelists showed off new products and discussed the benefits of GNSS for the deployment of multimodality, new mobility services and digital platforms by transport authorities, industries and users.
Their goal: to make safe driverless road transport a reality.
Autonomous driving with multi-GNSS
Cover image of Galileo for Mobility leaflet. (Image: GSA)
Germany’s ANavS GmbH provides position and attitude solutions with centimetre-level accuracy. Fast fixing is achieved by using three GNSS constellations and the company’s patented RTK fixing technology. The system combines multi-GNSS (GPS + GLONASS + Galileo), inertial sensors, vehicle data, visual odometry and feature mapping, as well as LiDAR and radar. Tight coupling of GNSS and all of these other systems ensure reliable positioning even in areas with limited satellite visibility.
ANavS managing director Patrick Henkel said, “Our sensor fusion framework delivers precise position and attitude information for navigation. It also generates real-time, highly accurate maps with high resolution. The platform can be used for the whole range of transport applications from road transport to maritime and drone navigation, as well as in robotics, surveying applications and of course in agriculture for precision farming.”
The system is particularly well suited to autonomous driving applications because of its high accuracy, high availability and continuity, and, with Galileo, its integrity, according to Henkel. The ANavS module is available in different versions, with one, two or three integrated GNSS receivers, depending on the level of performance required.
Sensor fusion with non-connected vehicles
Swedish truck manufacturer Scania led work on the EU-funded project, Precise and Robust Positioning for Automated Road Transports (PRoPART), demonstrating a high-availability positioning solution for connected automated driving applications. The system implements sensor fusion using information from both the on-board vehicle sensors and an off-board road infrastructure traffic sensor, accounting also for non-automated and non-connected road vehicles.
“We are benefiting from the high multipath mitigation enabled by the Galileo binary offset code, and there is a substantial improvement of reliability of the carrier phase ambiguity resolution,” said senior engineer Fredrik Hoxell. “All of this makes Galileo a really good addition to our sensor platform,” he said.
Big data contribution
Digital mapping is of course a critical resource for autonomous driving applications, and Tom Jensen of the veteran manufacturer of personal navigation devices TomTom stated “We have been compiling data from our GNSS receiver users for 10 years. We have 500 million devices currently running and today we have about 90 trillion data points!”
TomTom has dedicated itself to fusing that data for the generation of detailed maps that can be updated within minutes, for understanding traffic flow and traffic changes in near real time. “Now we want to open that up for the users,” he said. “We are meeting with public authorities, governments, decision makers who we know can use this information, for the roads, for the infrastructure, to plan their projects in the best and most intelligent way.”
Preventing terrorist attacks
The H2020-funded TransSec project coordinated by Daimler AG Trucks targets a solution to the recent rise in vehicle-based terror attacks across Europe, often employing heavy trucks to attack pedestrians.
Oihana Otaeguim, head of ITS at TransSec project partner Vicomtech, said, “We are developing and evaluating autonomous systems to detect and prevent trucks from being misused, to prevent these incidents from occurring. The trustability provided by Galileo is very remarkable. We have achieved advances in GNSS positioning, map data and map matching. On-board environment sensors and V2X communication are all combined in a local dynamic map. This can then be used for movement monitoring, critical area alarm, pre-crash object detection and for the implementation of non-defeatable emergency manoeuvres.”
The project team is also concerned with developing new and more effective methods to combat GNSS jamming and spoofing, which represent further threats to security in the context of automated driving technologies. Here, Galileo’s unique authentication feature will play an important role.
3D mapping
Japan’s Strategic Innovation Promotion Program, Automated Driving for Universal Services (SIP-adus) conducts several activities previewing the next generation of road transport systems: the human-machine interface in for autonomous and semi-autonomous driving, and the application of automated driving technologies in buses. The goal is precise stopping at bus stops with almost no space between the bus and the curb, to facilitate boarding and exiting for wheelchair users and elderly passengers.
“The project is validating the specifications and accuracy of a high-accuracy 3D mapping function,” Satoru Nakajo of the University of Tokyo said, “including data updating and distribution systems, and of the critical linkage of dynamic data delivered via road infrastructure.”
Public transport on demand. Area Metropolitana de Barcelona (AMB) will replace an existing fixed bus line with low demand with a flexible service that adapts bus routes according to the actual demand, improving the service and engaging new users without increasing public expenditure. The Galileo-based technology platform will consist of a mobile app and a system that manages requests, confirmations and cancellations, finds the best routes, and monitors distances travelled and payments.
Shared taxis. The pilot aims to alleviate Thessaloniki’s city centre congestion by reducing the number of trips from two eastern suburbs to the city. Ride sharing will be offered to commuters through 20 taxis provided by Taxiway at a flat rate.
Service aggregator. The Mobility as a Service (MaaS) app gathers mobility services available in Barcelona, Madrid and other big cities in Spain. It includes public transport, sharing services by motorbikes, bikes and cars, and bike parkings in these cities, improving accuracy and availability in urban areas, enabling a fast and smooth transition between transport modes, and offering the user a door-to-door and seamless multimodal trip experience.
Campus shuttle. The pilot will link autonomous electric vehicles to major hubs in a university or hospital campus (location to be determined).
Vehicle sharing. The Clem’ project will operate a last-mile transportation service to the community in Plateau de Saclay, an urban campus under development in the suburbs of Paris designed to welcome 85,000 students, workers and inhabitants by 2025. The pilot will include sharing a mixed fleet of 10 geolocated electric cars and 20 electric bikes.
This account drew heavily from published reports by the European GNSS Agency (GSA), available in full here.
The U.S. Supreme Court heard arguments last week on a case that could determine whether authorities can search cellphone location data without a warrant.
In Carpenter v. U.S., the Court will eventually rule on whether the Fourth Amendment of the U.S. Constitution’s Bill of Rights, enacted in 1791 to safeguard citizens’ rights against unreasonable searches and seizures, extends to cover personal cellphone records tracking user location.
The case began when police used records, obtained from a phone company and drawing on cell-tower location, to show that an individual’s cellphone was used in the vicinity of several armed robberies in Michigan and Ohio in 2010 and 2011.
The appellants contend that the government had violated the Fourth Amendment when it collected their cellphone location records without a warrant. A federal appeals court ruled against the appeal, finding the Fourth Amendment doesn’t “yet” extend to cellphone location data.
That court distinguished between the “content” of a communication and the “information necessary to send it.” The government can’t read letters or emails or listen to wiretapped conversation without a warrant, but it is entitled to the metadata used to send such content — in this case the phone company data showing in which tower’s cell area the phone was activated.
“The business records here fall on the unprotected side of this line. Those records say nothing about the content of any calls,” the court ruled. “Instead the records include routing information, which the wireless providers gathered in the ordinary course of business.”
The Supreme Court, in hearing the appeal on this decision, is expected to review — and possibly revise — its heretofore opinion that when users share information with a third party, such as a bank or telephone company, they lose the expectation that it will remain private. At question is whether cellphones have activated a new era of privacy expectations, in essence, whether legal doctrine needs to be subject to updates for the digital age.
One tenet that no one questions is that cell phone users have no idea to what extent their phone companies know where they go and how long they stay there. Whether they care or not, or whether they are willing to sacrifice some amount of privacy for the convenience of cell phone access, remains to be seen. The limits for this have been explored but never completely settled, in controversies around Facebook’s (and others’) access to and use of customer data and profiles.
Apple, Facebook, Google and Verizon have all filed an amicus (“friend of the court”) brief in Carpenter v. U.S. The tech gargantua seem to want, on the one hand, to discourage the possibility of government and law enforcement being able to access location data without a warrant, while also maintaining a clear and unencumbered route for themselves to use it. They argue that “Fourth Amendment doctrine must adapt to the changing realities of the digital era” and that “rigid analog-era rules should yield to consideration of reasonable expectations of privacy in the digital age.”
After a related 2012 Supreme Court decision that attaching a GPS tracker to a car without a search warrant violated the Fourth Amendment, Justice Sonia Sotomayor wrote that the so-called third-party doctrine was “ill suited to the digital age” and that privacy case law should adapt to changes in society’s views that are occurring thanks to smartphones and other technology.
For a summary of the arguments presented to the Court on November 29 in Carpenter v. U.S., see the SCOTUS blog here. Further developments in the case will appear on this page, and viewers may sign up for push updates as well.
In 2008, GPS World published an editorial on this subject, in the guise of a parodized future film noir scenario, “The Call Tease Factor.” An expandable image appears at left. The essay opined that “Government agencies and police routinely tracked cell users’ location without a warrant or court oversight. . . . Challenges had faltered, and no one seemed to notice any more, or care much.”
“Privacy, as least as far as location, no longer existed.”
Integrations of MEMS sensors with signal conditioning and radio communications form “motes” with extremely low-cost and low-power requirements and miniaturized form factor. Now standard features in modern mobile devices, MEMS accelerometers and gyros can be combined with absolute positioning technologies, such as GNSS or other wireless technologies, for user localization.
Navigation has been revolutionized by micro-electro-mechanical systems (MEMS) sensor development, offering new capabilities for wireless positioning technologies and their integration into modern smartphones.
These new technologies range from simple IrDA using infrared light for short-range, point-to-point communications, to wireless personal area network (WPAN) for short range, point-to multi-point communications, such as Bluetooth and ZigBee, to mid-range, multi-hop wireless local area network (WLAN, also known as wireless fidelity or Wi-Fi), to long-distance cellular phone systems, such as GSM/GPRS and CDMA.
With these technologies, navigation itself has become much broader than just providing a solution to location-based services (LBS) questions, such as “Where am I?” or “How to get from start point to destination?”
It has moved into new areas such as games, geolocation, mobile mapping, virtual reality, tracking, health monitoring and context awareness.
MEMS sensors are now essential components of modern smartphones and tablets. Miniaturized devices and structures produced with micro-fabrication techniques, their physical dimensions range from less than 1 micrometer (μm, a millionth of a meter) to several millimeters (mm).
The types of MEMS devices vary from relatively simple structures having no moving elements to complex electromechanical systems with multiple moving elements under the control of integrated microelectronics.
Apart from size reduction, MEMS technology offers other benefits such as batch production and cost reduction, power (voltage) reduction, ruggedization and design flexibility, within limits.
Wireless sensor technology allows MEMS sensors to be integrated with signal-conditioning and radio units to form “motes” with extremely low cost, small size and low power requirements.
New miniaturized sensors and actuators based on MEMS are available on the market or in the development stage.
Today’s smartphone sensors can include MEMS-based accelerometers, microphones, gyroscopes, temperature and humidity sensors, light sensors, proximity and touch sensors, image sensors, magnetometers, barometric pressure sensors and capacitive fingerprint sensors, all integrated to wireless sensor nodes.
These sensors were not initially intended for navigation. For instance, accelerometers are used primarily for applications such as switching the display from landscape to portrait as well as gaming.
These embedded sensors, however, are natural candidates for sensing user context. Because of their locating capabilities, people are getting used to the location-enabled life.
MEMS accelerometers and gyros, for instance, can be employed for localization in combination with absolute positioning technologies, such as GNSS or other wireless technologies.
WIRELESS OPTIONS IN SMARTPHONES
Various wireless standards have been established. Among them, the standards for Wi-Fi, IEEE 802.11b and wireless PAN, IEEE 802.15.1 (Bluetooth) and IEEE 802.15.4 (ZigBee) are used more widely for measurement and automation applications.
All these standards use the instrumentation, scientific and medical (ISM) radio bands, including the sub-GHz bands of 902–928 MHz (US), 868–870 MHz (Europe), 433.05–434.79 MHz (US and Europe) and 314–316 MHz (Japan) and the GHz bands of 2.4000-2.4835 GHz (worldwide acceptable).
In general, a lower frequency allows a longer transmission range and a stronger capability to penetrate through walls and glass.
However, due to the fact that radio waves with lower frequencies are more easily absorbed by materials, such as water and trees, and that radio waves with higher frequencies are easier to scatter, effective transmission distance for signals carried by a high-frequency radio wave may not necessarily be shorter than that of a lower frequency carrier at the same power rating.
The 2.4-GHz band has a wider bandwidth that allows more channels and frequency hopping and permits compact antennas.
Wireless Fidelity. Wi-Fi (IEEE 802.11) is a flexible data communication protocol implemented to extend or substitute for a wired local area network, such as Ethernet. The bandwidth of 802.11b is 11 Mbits and it operates at 2.4 GHz frequency.
Originally a technology for short-range wireless data communication, it is typically deployed as an ad-hoc network in a hot-spot. Wireless networks are built by attaching an access point (AP) to the edge of a wired network.
Clients communicate with the AP using a wireless network adapter similar to an Ethernet adapter. Beacon frames are transmitted in IEEE 802.11 Wi-Fi for network identification, broadcasting network capabilities, synchronization and other control and management purposes.
Timers of all terminals are synchronized to the AP clock by the timestamp information of the beacon frames. The IEEE 802.11 MAC (Media Access Control) protocol utilizes carrier sensing contention based on energy detection or signal quality.
RSSs and MAC addresses of the APs are location-dependent information that can be adopted for positioning. For localization of a mobile device, either cell-based solutions or (tri)lateration and location fingerprinting are commonly employed.
Bluetooth. A wireless protocol for short-range communication, Bluetooth (IEEE 802.15.1) uses the 2.4-Hz, 915-MHz and 868-MHz ISM radio bands to communicate at 1 Mbit between up to eight devices. It is mainly designed to maximize the ad-hoc networking functionality (Wang et al., 2006).
Compared to Wi-Fi, the gross bit rate is lower (1 Mbps), and the range is shorter (typically around 10 m). On the other hand, Bluetooth is a “lighter” standard, highly ubiquitous (embedded in most phones) and supports several other networking services in addition to IP. For positioning either tags (small size transceivers) or Bluetooth low energy (BLE) iBeacons are common.
Each tag has a unique ID that can be used for localization. iBeacon is a low-energy protocol developed by Apple; compatible hardware transmitters, typically so-called beacons, broadcast their identifier to nearby portable electronic devices.
The technology enables smartphones, tablets and other devices to perform actions when in close proximity to an iBeacon whereby a universally unique identifier picked up by a compatible app or operating system is transmitted.
The identifier and several bytes sent with it can be used to determine the device’s physical location, track customers, or trigger an LBS action on the device such as a check-in on social media or a push notification.
One application is distributing messages at a specific point of interest — for example, a store, a bus stop, a room or a more specific location like a piece of furniture or a vending machine. This is similar to previously used geopush technology based on GNSS, but with a much reduced impact on battery life and much extended precision.
Another application is an indoor positioning system, which helps smartphones determine their approximate location or context. With the help of an iBeacon, a smartphone’s software can approximately find its relative location to an iBeacon.
iBeacon differs from some other LBS technologies as the broadcasting device (beacon) is only a one-way transmitter to the receiving smartphone, and necessitates a specific app installed on the device to interact with the beacons.
This ensures that only the installed app (not the iBeacon transmitter) can track users, potentially against their will, as they passively walk around the transmitters. Localization is based on proximity sensing and cell-based solutions.
ZigBee. ZigBee is an IEEE 802.15.4-based specification for a suite of high-level communication protocols used to create personal area networks with small, low-power digital radios.
ZigBee operates in the ISM radio bands: 2.4 GHz in most jurisdictions worldwide, 784 MHz in China, 868 MHz in Europe and 915 MHz in the U.S. and Australia. Data rates vary from 20 kbit/s (868-MHz band) to 250 kbit/s (2.4-GHz band).
It adds network, security and application software and is intended to be simpler and less expensive than other WPANs such as Bluetooth or Wi-Fi.
Owing to its low power consumption and simple networking configuration, ZigBee is best suited for intermittent data transmissions from a sensor or input device.
Applications include wireless light switches, electrical meters with in-home displays, traffic management systems and other consumer and industrial equipment that requires short-range low-rate wireless data transfer.
Distances are limited to 10–100 m line-of-sight, depending on power output and environmental characteristics. ZigBee localization techniques usually use measurement of signal strength (RSS-based positioning) in conjunction with (tri)lateration and fingerprinting.
COMPARING STANDARDS
Table 1 compares the three wireless standards most suitable for a wireless sensor network. The standards also address the network issues for wireless sensors. Three types of networks (star, hybrid and mesh) have been developed and standardized.
TABLE 1. Comparison of Wi-Fi, Bluetooth and ZigBee.
Bluetooth uses star networks, composed of piconets and scatternets. Each piconet connects one master node with up to seven slave nodes, whereas each scatternet connects multiple piconets, to form an ad-hoc network. ZigBee uses hybrid star networks of multiple master nodes with routing capabilities to connect slave nodes, which have no routing capability.
The most efficient networking technology uses peer-to-peer mesh networks, which allow all the nodes in the network to have routing capability. Mesh networks allow autonomous nodes to self-assemble into the network and allow sensor information to propagate across the network with high reliability and over an extended range.
They also allow time synchronization and low power consumption for the “listeners” in the network, thus extending battery life. When a large number of wireless sensors need to be networked, several levels of networking may be combined.
For example, an IEEE 802.11 (Wi-Fi) mesh network comprised of high-end nodes, such as gateway units, can be overlaid on a ZigBee sensor network to maintain a high level of network performance.
A remote application server (RAS) can also be deployed in the field close to a localized sensor network to manage the network, to collect localized data, to host web-based applications, to remotely access the cellular network via a GSM/GPRS or a CDMA-based modem and, in turn, to access the internet and remote users.
ESTIMATION METHODS
The three most common position estimation methods are cell-based positioning (cell-of-origin, CoO), (tri) lateration and location fingerprinting, regarding achievable positioning accuracies as well as their advantages and disadvantages.
They provide different level of accuracies ranging from dm up to tens of m. Compared to (tri)lateration and fingerprinting, the principle of operation of CoO is the most straightforward and simplest. Disadvantages range from the requirement of a large number of devices or receivers as well as their performance in dynamic environments.
All these techniques provide absolute localization capabilities. Their disadvantage is that position fixes are lost if no coverage or signal availability is available.
Thus, combination with other technologies to bridge loss of lock of wireless signals (for example, no GNSS reception) is required. In smartphones, motion sensors exists that can be employed for inertial navigation (IN). In this article, these sensors are also referred to as inertial sensors.
In the simplest case, a position solution can be obtained from the relative measurements of the inertial sensors via dead reckoning (DR). The accelerometers, for instance, can be used by a pedestrian to count steps while walking and the gyroscope and magnetometer can provide the direction of movement.
These sensors have therefore substantially won on importance for navigation solutions.
MEMS LOCATION SENSORS
For many navigation applications, improved accuracy and performance is not necessarily the most important issue, but meeting performance at reduced cost and size is.
In particular, small navigation sensor size allows the introduction of guidance, navigation and control into applications previously considered out of reach. In this context, the small size, extreme ruggedness and potential for very low-cost and weight means of MEMS gyros and accelerometers have been, and will be, able to utilize inertial guidance systems — a situation that was unthinkable before MEMS.
The reduction in size of the sensing elements, however, creates challenges for attaining good performance. In general, the performance of MEMS inertial measurement units (IMUs) continues to be limited by gyro performance, which is typically around 10 to 30 deg/h, rather than by accelerometer performance, which has demonstrated tens of micro-g or better.
MEMS has struggled to reach high-accuracy tactical-grade quality.
MEMS Accelerometors. MEMS accelerometers are either pendulous/displacement mass type or resonator type. The former use closed-loop capacitive sensing and electrostatic forcing while the latter are based on resonance operation.
Both can detect acceleration in two primary ways: either displacement of a hinged or flexure-supported proof mass under acceleration, producing a change in a capacitive or piezoelectric readout, or frequency change of a vibrating element caused by a change in its tension induced by a change of loading from a seismic-proof mass.
Pendulous types can meet a wide performance range from 1 mg for tactical systems down to 25 μg. Resonant accelerometers or VBAs can reach higher performance down to 1 μg.
MEMS-Based Gyroscopes. For MEMS INS, attaining suitable gyro performance is more difficult to achieve than accelerometer performance. Fundamentally, MEMS gyros fall into four major areas: vibrating beams, vibrating plates, ring resonators and dithered accelerometers.
Gyroscopes are usually built as hybrid solutions, with sensor and electronics as two separate chips. The operational principle for all vibratory gyroscopes is based on the utilization of the Coriolis force.
If a mass is vibrated sinusoidally in a plane, and that plane is rotated at some angular rate Ω, then the Coriolis force causes the mass to vibrate sinusoidally perpendicular to the frame with amplitude proportional to the angular rate Ω.
Measurement of the Coriolis-induced motion provides knowledge of the angular rate Ω. This rate measurement is the underlying principle of all quartz and silicon micro-machined.
These gyroscopes are usually designed as an electronically driven resonator, which are often fabricated out of a single piece of quartz or silicon. The output is demodulated, amplified and digitized. Their extremely small size, combined with the strength of silicon, makes them ideal for very high-acceleration applications.
For purely surface micro-mechanical gyroscopes, given their small sizes and capacitances, monolithic integration is an option to be considered not so much for cost as for performance.
Combined IMUs. Further interest in all-accelerometer systems, which are also referred to as gyro-free, arises because high-performing small gyroscopes are very difficult to produce. Two approaches are typically used. In the first, the Coriolis effect is utilized.
Typically, three opposing pairs of monolithic MEMS accelerometers are dithered on a vibrating structure (or rotated). This approach allows the detection of the angular rate Ω. In the second, the accelerometers are placed in fixed locations and used to measure angular acceleration.
In both approaches, the accelerometers also measure linear acceleration, enabling a full navigation solution. In the direct approach, however, the need to make one more integration step makes it more vulnerable to bias variations and noise, so the output errors grow by an order of magnitude faster over time than when using a conventional IMU.
However, these devices only provide tactical-grade performance, and are most useful in GNSS-aided applications. The concept of a navigation-grade all-accelerometer IMU requires accelerometers with accuracies on the order of nano-g’s or better, and with large separation distances.
Use of all-accelerometer navigation for GNSS-unavailable environments will likely require augmentation with other absolute positioning techniques. Further sensor size reductions are underway through the combination of two in-plane (x- and y-axis) and one out-of- plane (z-axis) sensors on one chip. These multi-axes gyroscopes and accelerometer chips produce IMUs as small as 0.2 cm3.
Barometric Sensors. Barometric pressure sensors embedded in smartphones and other mobile devices demand small size, low cost and high-accuracy performance. The key element of a pressure sensor is a diaphragm containing piezoresistors which can be formed by ion implantation or in-diffusion.
Applied pressure deflects the diaphragm and thereby changes the resistance of the piezoresistors. By arranging the piezoresistors in a Wheatstone bridge, an output signal voltage can be generated. The measurement sensitivity of the pressure sensor is determined by the strain at the bottom plane of the diaphragm, whereby larger strain leads to higher sensitivity.
These altimeters are increasingly used in smartphones and other navigation systems. They can enable altitude determination of the user, for example, to determine the correct floor in a multi-storey building.
Pedestrian Dead Reckoning (PDR). The MEMS accelerometers embedded in the mobile device can be used to estimate the distance traveled from the accelerations made while walking, and magnetometers and gyroscopes to obtain user heading. Starting from a known position, determined by GNSS or other absolute positioning technique, the current position of the user can then be dead-reckoned using observations of the inertial sensors.
DR techniques differ from other localization techniques because the position is always calculated relative to the previously calculated position and no correlation with the real position can be made. PDR can give the best available information on position; however, it is subject to significant cumulative errors, i.e., either compounding, multiplicatively or exponentially, due to many factors as both velocity and direction must be accurately known at all instants for position to be determined accurately.
The accuracy of PDR can be increased significantly by using other, more reliable methods — GNSS or another absolute positioning technique such as Wi-Fi — the combination with inertial sensors produces more reliable and accurate navigation.
Altitude Determination. For navigation, determination of the altitude of the user can be of great importance, for example in determining the correct floor in a multi-storey building. Barometric pressure sensors can provide this data, augmenting the inertial sensors that can usually only provide reliable 2D localization.
Furthermore, if only three GNSS satellites are visible, providing a 2D positioning solution, pressure sensors can aid 3D localization.
Altitude determination with a barometric pressure sensor can be performed relatively from a given start height — for example, obtained from GNSS outside the building or from a known height point in the indoor environment.
As the user walks inside the building and up stairs or elevator to other floors, differences in air pressure can be calculated using a simple relationship between the pressure changes and height differences.
For conversion of the air pressure in a height difference, the mean value of the temperature at both stations is also required; MEMS infrared temperature sensors are increasingly found in smartphones to provide this.
Activity Detection. Low-cost inertial and motion sensors provide a new platform for dynamic activity pattern inference. Human activity recognition aims to recognize the motion of a person from a series of observations of the user’s body and environment.
A single biaxial accelerometer can classify six activities: walking, running, sitting, walking upstairs, walking downstairs and standing.
Until recently, sensors on the body have been used for activity detection, and until recently only a few studies have used a smartphone to collect data for activity recognition.
Smartphone accelerometers recognize acceleration in three axes as shown in Figure 1. Different motion sequences can thereby be ascertained.
Figure 1. Smartphone coordinate frame (left) and global horizontal coordinate system (right).
If a smartphone is held horizontally in the hand during a forward motion, then an acceleration in the y-axis is induced. When working with accelerations, two approaches can be applied to measure the linear displacement: integration of the accelerations or step detection combined with step size estimate.
In the first case, the distance traveled can be theoretically calculated by integrating the accelerations once for velocity, twice for distance.
Due to the double integration, however, any error in the signal will propagate rapidly, so the drift on the received signals from the accelerometer makes it impossible to use integration for walks of more than a few seconds.
The Zero Velocity Update (ZUPT) technique, where the velocity is reset to zero between every consecutive step when the foot is stationary for a small amount of time, can overcome this. Any error produced during one step has no influence on following steps. ZUPT can only be used when the accelerometer is placed on the foot, taking advantage of the stationary period between footsteps.
In the latter case, the distance traveled is obtained from step counts by processing the fluctuating vertical accelerations, which cross zero twice with every step. When the number of steps and the step size are acquired, the distance can be calculated by multiplication.
Figure 2 shows the recorded acceleration of a walking person in the z-axis, with significant maxima and minima that enable step-counting. Correction for the gravity effect on the x-, y- and z-axes of the smartphone’s local coordinate system is key to the correct determination of accelerometer-derived distance traveled. The MEMS-based three-axis accelerometer allows the device to detect the force applied along the three axes in order to accomplish specific functions based on predefined configurations.
Figure 2 . Typical recording of accelerometer sensor data in z-axis of a walking user.
The mobile device can be oriented in such that one of the axes is aligned in the direction of movement or heading (for example, y-axis), the positive x-axis is pointing rightward and the positive z-axis is upward (compare Figure 1). When the y-axis is horizontal, the gravity effect will be fully reflected on the z-axis.
However, a cell phone will most likely be placed by a user into a pocket or bag. Therefore, most existing step detection algorithms cannot be used directly — adjustments have to be made to take into account the orientation of the accelerometers. Because a phone can be placed with any side up or down, the accelerations are observed to determine which axis is the most vertical one.
The accelerations of the axis that is pointing directly to the center of the Earth has a value of 1 g due to gravity. So if the smartphone is lying flat on a table, with the display side up, then the z-axis of the accelerometer would theoretically have a value of 1,000 mg.
If the phone is put crooked (not along one of the axes) in someone’s pocket, the values will be lower than 1,000 mg. So to detect which accelerometer has the most vertical axis, the absolute average of the last 30 samples, or 1.2 seconds, of all three axes of the accelerometers of which the absolute value is closest to 1 g, is the most vertical axis and the accelerometer to use.
SYSTEM COMPARISON
Table 2 compares the most commonly used location sensors and systems in mobile devices classified depending on their positioning capability — absolute or relative — and on their type. A meaningful combination in form of a hybrid solution will produce the best performance for localization of a mobile smartphone user.
TABLE 2. Specifications of the most commonly used location sensors and systems in mobile devices.
Combining MEMS, Wireless. For the majority of indoor navigation systems, the combination of MEMS sensors and wireless options provides the optimal solution. MEMS sensors can provide relative positioning information, with an unbounded accumulation of location errors over time. Wireless systems provide an absolute position in either a local or global coordinate frame, independent of previous estimates without integrating measurements over time. The combination of these two technologies takes advantages of the strengths of both, producing a more robust position solution.
CONCLUSIONS
The increasing ubiquity of location-aware devices has pushed the need for robust GNSS-like positioning capabilities in difficult environments.
No single sensor or technique can meet the positioning requirements for the increasing number of safety- and liability-critical mass-market applications.
Integration is one approach to improving performance level, but a significant step change in high-performance positioning in GNSS-difficult environments, higher performance level are required from MEMS and wireless technologies.
ALLISON KEALY is a professor of geospatial science at Royal Melbourne Institute of Technolgy University, Australia. She holds a Ph.D. in GPS and geodesy from the University of Newcastle upon Tyne, UK. He is co-chair of FIG Working Group 5.5. Ubiquitous Positioning and vice president of the International Association of Geodesy (IAG) Commission 4: Positioning and Applications.
GÜNTHER RETSCHER is associate professor in geodesy and geoinformation at the Vienna University of Technology, with a Ph.D. in applied geodesy. He is co-chair of IAG Sub-Commission 4.1 on Emerging Positioning Technologies and GNSS Augmentation and of the IAG/Fig Working Group on Multi-Sensor Systems.
Google’s annual developers conference in May, Google I/O, featured many announcements, accomplishments and 2017 plans. Of particular interest, the Android Location and Context Team’s talk “Android Sensors & Location: What’s New and Best Practices,” is available online.
This followed a keynote by CEO Sundar Pichai on solving problems at scale with deep neural networks, machine learning algorithms and artificial intelligence (AI). He also spoke about a shift from a mobile-first model to AI-first. Google is doing this across every product area, applying AI and machine learning. Other keynotes updated Assistant, Photos, YouTube, Superchat, Android and VR (virtual reality).
The Android Location and Context team — Marc Stogaitis, Wei Wang, Souvik Sen and myself — spoke about background location, location accuracy, activity recognition, Android sensor hub, Android sensors, and the future of location and context.
Discussing why battery life is so important, we showed detailed graphs on the costs of accessing different parts of the phone subsystems like WiFi, GNSS and making data connections.
Then we introduced Background Location Limitations (at the 4:30 point in the posted video) coming with Android’s latest operating system in Android O. These limits will prevent applications from misusing Android’s APIs in the background, thus saving its user’s battery. There were examples on how to make your app background ready for these upcoming changes.
We showed plans for location accuracy improvements (12:50) coming later this year and comparisons of existing vs. upcoming solutions for the positioning algorithm.
We covered the tools to help analyze GNSS measurements. How strong are the individual measurements? How accurate are the range measurements? With these tools, developers now have direct insight into the lowest layers of a GNSS receiver. Then came activity recognition algorithms (15:40) and how deep neural networks will improve the precision of these algorithms and help advance the field in activity recognition.
I spoke spoke about the Android Sensor Hub (20:27), how Google is leveraging the capabilities of an always-on low-power processor in Android phones. The sensor hub allows Google to port algorithms such as Activity Recognition, Geofencing and Gestures from the main application processor into the low-power sensor hub. We then went into detail around the new sensor features (25;55) and improvements around the compass (28:34).
Finally, we looked into the future (33:28). I covered Project Elevation, Accurate Indoor Location, and dual-frequency GNSS. Closing thoughts were around how more signals are going to be added into the low-power always-on compute domains so that the phone is more aware and intelligent, simplifying users’ interactions, augmenting human memory and knowledge, and assisting users understanding of themselves and the world around them.
Access to Raw GNSS Measurements
In related news, our new web page is up and operational! This site provides all the details around GNSS Raw measurements in Android along with our analysis tools for anyone to download. Our previous site was accessible to people who signed up as a partner with Google, but now we have opened up this site to everyone.
Android GNSS Analysis Tool: Shows how you can select and run the analysis on a per satellite basis. This tool now supports multi-constellation and dual frequency (L1+L5) by default
Android apps typically access GNSS chipsets through a filter, which improves the GNSS location output for the majority of use cases. Filters use additional sensors, such as motion sensors, to improve the end user experience. However, filtering is not appropriate for some applications used by professionals such as researchers and original equipment manufacturer (OEM) developers. The Android Framework provides access to raw GNSS measurements on some Android devices. The page lists Android devices that support raw GNSS measurements as well as tools that help you log and analyze GNSS data.
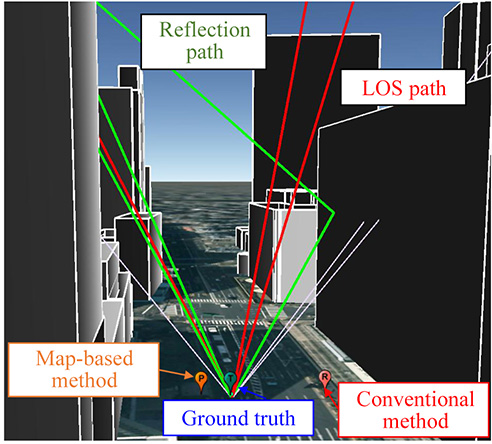
Figure 1. Example of the GNSS signal propagation using ray-tracing and a 3D building map.
A particle-filter-based positioning method using a 3D map to rectify the errors created by multipath and non-line-of-sight signals on the positioning result delivered by a low-cost single-frequency GPS receiver takes a multi-GNSS approach, using the combined signals of GPS, GLONASS and QZSS. The method outperforms conventional positioning in availability and positioning accuracy. It will likely be fused with other sensors in a future pedestrian navigation application.
By Li-Ta Hsu, Shunsuke Miura and Shunsuke Kamijo
GPS provides an accurate and reliable positioning/timing service for pedestrian application in open field environments. Unfortunately, its positioning performance in urban areas still has a lot of room for improvement, due to signal blockages and reflections caused by tall buildings. The signal reflections can be divided into multipath and non-line-of-sight (NLOS) effects. Recently, use of 3D building models as aiding information to mitigate or exclude multipath and NLOS effects has become a promising area of study.
At first, researchers used the 3D map model to simulate multipath effects to assess the single-reflection environment of a city. Subsequently, the metric of NLOS signal exclusion using an elevation-enhanced map, extracted from a 3D map, was developed and tested using real vehicular data. An extended idea of identifying NLOS signals using an infrared camera onboard a vehicle has been suggested. The potential of using a dynamic 3D map to design a multipath-exclusion filter for a vehicle-based tightly coupled GPS/INS integration system has also been studied. A forecast satellite visibility based on a 3D urban model to exclude NLOS signals in urban areas was developed.
The research approaches outlined above seek to exclude the NLOS signal; however, the exclusion is very likely to cause a horizontal dilution of precision distortion scenario, due to the blockage of buildings along the two sides of streets. In other words, the lateral (cross direction) positioning error would be much larger than that of the along-track direction.
Therefore, approaches applying multipath and NLOS signals as measurements become essential. One of the most common methods, the shadow-matching method, uses 3D building models to predict satellite visibility and compare it with measured satellite visibility to improve the cross street positioning accuracy. A multipath and NLOS delay estimation based on software-defined radio and a 3D surface model based on a particle filter was proposed and tested in a static experiment in the Shinjuku area of Tokyo.The research team of The University of Tokyo developed a particle-filter-based positioning method using a 3D map to rectify the positioning result of commercial GPS single-frequency receiver for pedestrian applications.
An evaluation of the QZSS L1-submeter-class augmentation with integrity function (L1-SAIF) correction to the proposed pedestrian positioning method was also discussed in an earlier paper by the authors of this article. However, satellite visibility in the urban canyon using only GPS and QZSS would not be enough for this proposed method. The use of emerging multi-GNSS, encompassing GLONASS, Galileo and BeiDou, could furnish a potential solution to the lack of visible satellites for this method. This article assess the performance of the proposed pedestrian positioning method using GPS, GLONASS and QZSS.
Building Models Construction
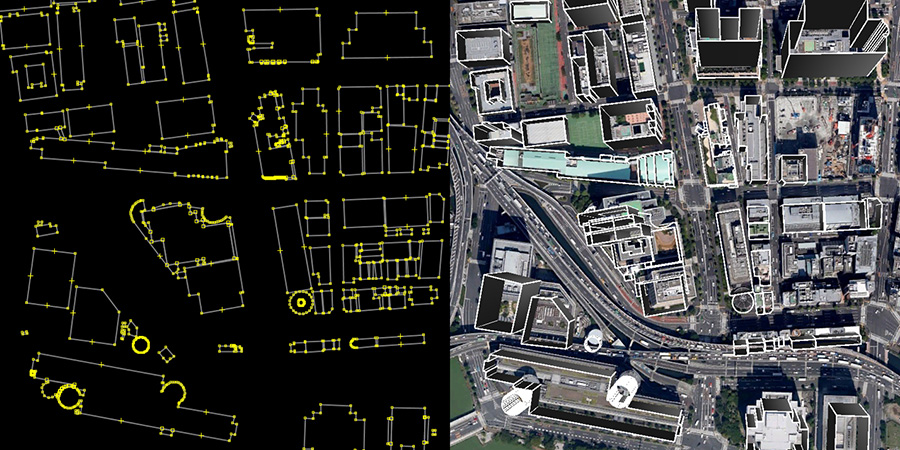
Our work established a 3D building model by a 2D map that contained building location and height information of buildings from 3D point-clouds data. The Fundamental Geospatial Data (FGD) of Japan, which provided by Japan geospatial information authority, is open to the Japanese public. This FGD data is employed as 2D geographic information system (GIS) data. Thus, the layouts and positions of every building on the map could be obtained from the 2D GIS data. In this article, the 3D digital surface model (DSM) data is provided by Aero Asahi Corporation. Figure 2 shows the process of constructing the 3D building model used here. This process first extracts the coordinates of every building corner from FGD as shown in the left of Figure 2. Then, the 2D map is integrated with the height data from DSM. The right of Figure 2 illustrates an example of a 3D building model established in this way. The 3D building map contains a very small amount of data for each building in comparison to that of the 3D graphic application. For our purposes, the file only contains the frame data of each building instead of the detail polygons data. This basic 3D building map is utilized in the simulation of ray-tracing.
Figure 2. The construction of the 3D building map from a 2D map and DSM.
Our version of the ray-tracing method does not consider diffractions or multiple reflections because these signals occurred under unfavorable conditions. Here, we utilize only the direct path and a single reflected path. The developed ray-tracing simulation can be used to distinguish reflected rays and to estimate the reflection delay distance. Our research work assumes that the surfaces of buildings are reflective smooth planes, that is, mirrors. Therefore, the rays in the simulation obey the laws of reflection. In the real world, the roughness and the absorption of the reflective surface might create a mismatch between the ray-tracing simulation and the real propagation. Here we ignore this effect, as the roughness of the building surface is much smaller than the propagation distance.
The opening figure (Figure 1) shows an example of the GNSS signal propagation using ray-tracing and a 3D building map. Red, green and white lines denote the LOS path, reflected paths and the NLOS paths, respectively. In this environment, a conventional positioning method such as weighted least squares (WLS) usually estimates the position on the wrong side of street as shown in the red balloon. With the aid of 3D building model and ray-tracing, the map-based positioning method is able to provide a result close to the ground truth.
Map-Based Pedestrian Positioning
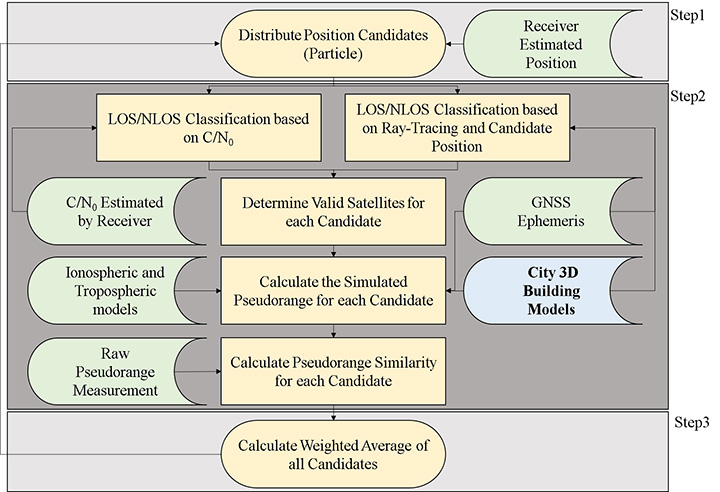
The flowchart of the 3D city building model-based particle filter is shown in Figure 3. This method first implements a particle filter to distribute position candidates (particles) around the ground-truth position. In Step 2, when a candidate position is given, the method can evaluate whether each satellite is in LOS, multipath or NLOS by applying the ray-tracing procedure with a 3D building model. According to the signal strength, namely carrier-to-noise ratio (C/N0), the satellite could be roughly classified into LOS, NLOS and multipath scenarios. If the type of signal is consistent between C/N0 and ray-tracing classification, the simulated pseudorange of the satellite for the candidate will be calculated. In the LOS case, simulated pseudoranges can be estimated as the distance of the direct path between the satellite and the assumed position. In the multipath and NLOS cases, simulated pseudoranges can be estimated as the distance of the reflected path between the satellite and the candidate position via the building surface.
Figure 3. Flowchart of the particle filter using 3D city building models.
Ideally, if the position of a candidate is located at the true position, the difference between the simulated and measured pseudoranges should be zero. In other words, the simulated and measured pseudoranges should be identical. Therefore, the likelihood of each valid candidate is evaluated based on the pseudorange difference between the pseudorange measurement and simulated pseudorange of the candidate, which is simulated by 3D building models and ray-tracing.
Finally, the expectation of all the candidates is the rectified positioning of the proposed map method. This method can therefore find the optimum position through a dedicated optimization algorithm of these assumptions and evaluations. The positioning principle of the proposed method is very different from the conventional GPS positioning method, that is, WLS. As a result, the calculation of the positioning accuracy of the 3D map method should be also different.
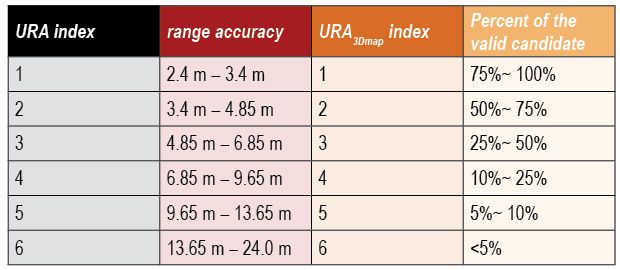
We define two positioning performance measures for the 3D map method: user range accuracy of the 3D map method (URA3Dmap) and positioning accuracy.
The value of URA3Dmap is to indicate its level of positioning service, which is similar to the user range accuracy (URA) of conventional GPS. The URA3Dmap is defined based on the percentage of the valid candidates from all candidates outside the building. The higher percentage of the valid candidate implies a higher confidence of the estimated position. Ideally, if the center of the candidate distribution is not far from the ground truth, the simulated pseudorange of the candidates located at the center of distribution would be very similar to the measurement pseudorange. We define the URA3Dmap as shown in Table 1.
Table 1. The definition of URA and URA3Dmap used in this article.
Experiments and Discussion
We selected the Hitotsubashi and Shinjuku areas in Tokyo to construct a 3D building model because of the density of the tall buildings. In this area, multipath and NLOS effect are frequently observed. We tested pedestrian navigation in a typical path that included walking both sides of street and passing through/waiting at a road intersection. The cut-off angle is 20 degrees. The data were collected in November and December 2014.
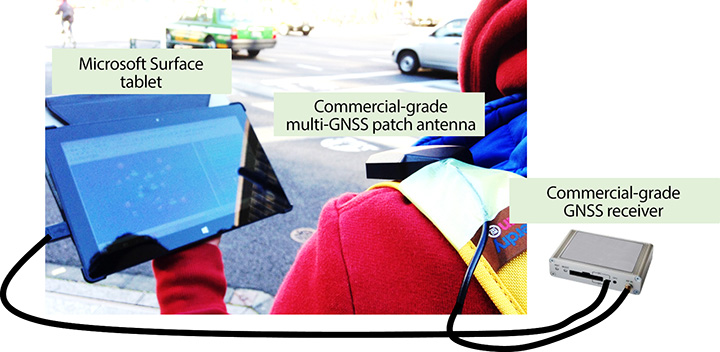
We compare here two single point positioning methods: single-point positioning solutions provided by open source RTKLIB software (RTKLIB SPP), and the proposed 3D map method. RAIM FDE of the RTKLIB SPP is used here as a conventional NLOS detection algorithm. The test used a geodetic-grade GNSS receiver and a commercial grade receiver. The geodetic receiver was only used to collect the QZSS L1-SAIF correction signal. The antenna of the commercial receiver was attached in the strap of the backpack as shown in Figure 4. The receiver is connected to a tablet to record the GNSS measurements and is set to output pseudorange measurements and positioning results every second.
Figure 4. Equipment set-up.
We generated a quasi-ground truth using a topographical method.Video cameras were set in the ninth and18th floors of a building near the Hitotsubashi and Shinjuku areas, respectively, to record the traveled path. The video data output by the cameras are used in combination with one purchased high-resolution aerial photo to get the ground truth data. The aerial photo is 25 cm/pixel and therefore the error distance for each estimate can be calculated. The synchronization between video camera and commercial GNSS receiver is difficult to get as accurate as in the topographical method. As a result, we used point to “points” positioning error to evaluate the performance of the dynamic experiment. The synchronization error is limited to 1 second. Hence, for each estimated position x(t), the ground truth points used to calculate the positioning error is xGT (t-1), xGT (t) and xGT (t+1). The point to “points” positioning error is calculated as:
Three performance metrics are used here: mean, standard deviation of the point to points error, and the availability of positioning solution. The availability defined here means the percentage of given solutions in a fixed period. For example, if a method outputs 80 epochs in 100 seconds, the availability of the method is 80 percent.
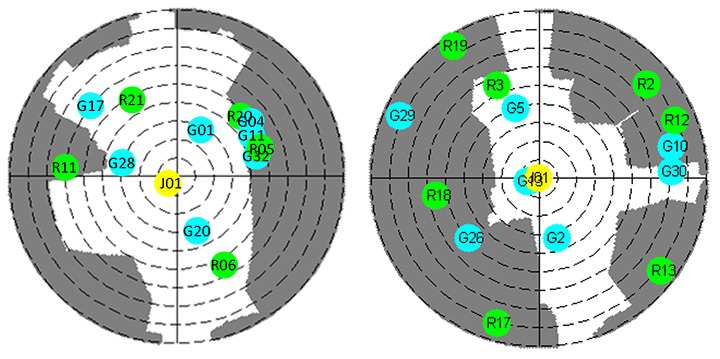
This research demonstrates two dynamic data. The skyplot of the data are shown in Figure 5. The satellites are tracked by the commercial receiver. The grey areas indicate the obstruction of the surrounding buildings. The two dynamic data are typical signal receptions at Hitotsubashi (middle urban canyon) and Shinjuku (deep urban canyon) areas.
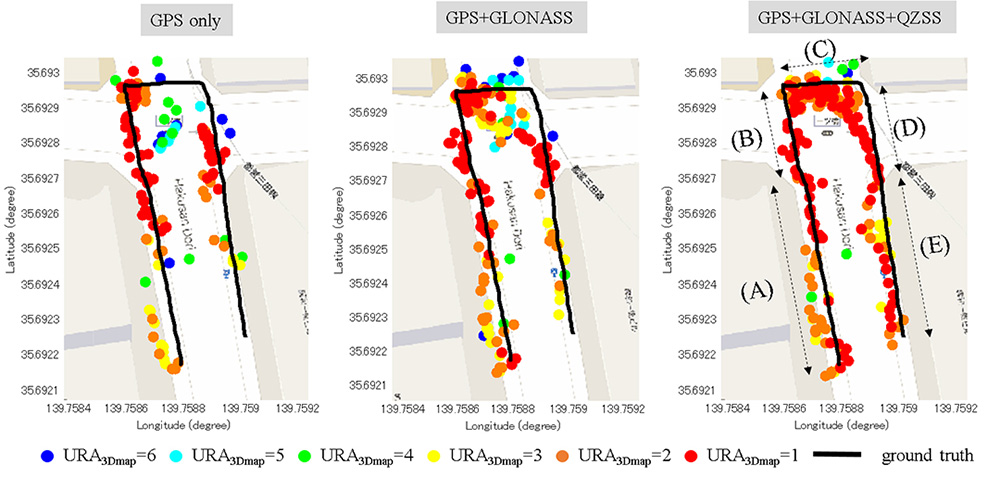
Hitotsubashi Mid-Canyon. To study the benefit of using different GNSS constellations in the 3D map method, Figure 6 shows the trajectory estimated by the proposed method under different satellite constellations. The different colors indicate different values of URA3Dmap of each point. This walking trajectory is divided into five sections (identified as A, B, C, D and E in the right-most of the three plots). In the GPS-only case (left), results in A and B sections have much better performance than sections D and E, because more than half of the GPS satellites are blocked at D and E, as shown in the left of Figure 5.
Figure 5. The left and right are the skyplot of the dynamic experiment at the Hitotsubashi and Shinjuku areas, respectively, in Tokyo.
The middle plot in Figure 6 shows the trajectory using GLONASS. It is obvious that the positioning results located at the right side of street are greatly increased, derived from the greater number of satellites in view. However, the quality of the GLONASS signal is not as good as GPS because multipath has a double effect on GLONASS.
Figure 6. Positioning results of the proposed 3D map method using different combinations of satellite constellations in a middle urban canyon.
In summary, the positioning error of applying GLONASS maintains a similar level, and availability increases about 12 percent compared to using GPS only. The right plot of Figure 6 shows the result after adding QZSS L1 C/A and L1-SAIF. This increases the results of C, D and E sections, because QZSS provides a high-elevation-angle satellite to the 3D map method. As a result, the number of valid candidate points in C, D and E sections increases dramatically. The reliability in C, D and E sections is also much higher than that of GPS+GLONASS. In addition, the trajectory became smoother than before.
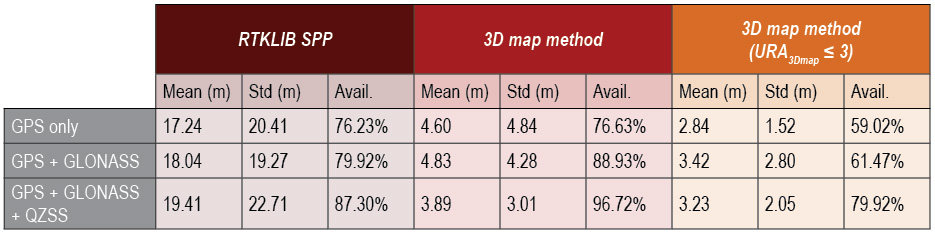
Table 2 compares the positioning results of both RTKLIB SPP and the 3D map method, showing the 3D map method using GPS, GLONASS and QZSS to have the best performance among three scenarios. The positioning error mean and availability are 3.89 meters and 96.72 percent, respectively. The positioning error mean could be further improved to 3.23 meters if selecting the position point with URA3Dmap ≤ 3 (yellow, orange and red points in Figure 6). This selection will lose about 17 percent of availability.
Table 2. Positioning results of the 3D map method using different combinations of satellite constellations in a middle urban canyon.
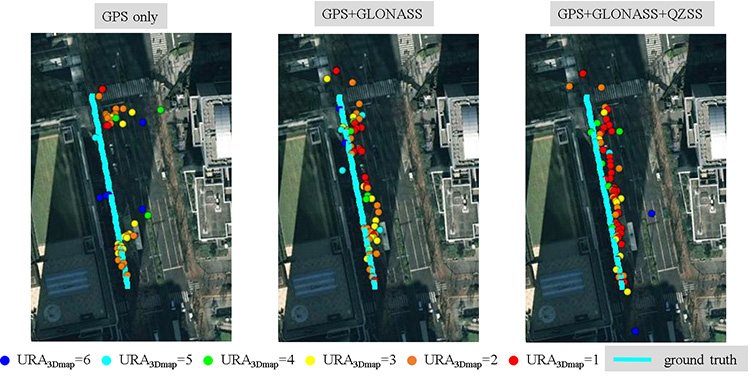
Shinjuku Deep Canyon. We conducted a similar experiment in the Shinjuku area of Tokyo, the most urbanized area in Japan (Figure 7). The positioning results and skyplot are shown in Figure 8 and the right of Figure 5, respectively. Table 3 compares the results of the two methods using the three constellation configurations.
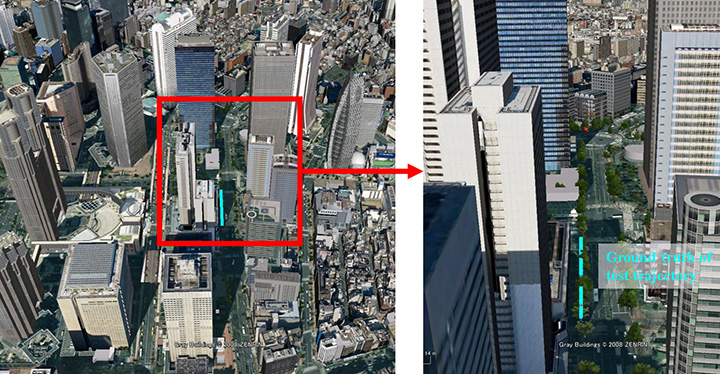
Figure 7. Deep urban canyon environment, Shinjuku, Tokyo. (Courtesy Google Earth)
Figure 8. Positioning results of the proposed 3D map method using different combinations of satellite constellations in a deep urban canyon.
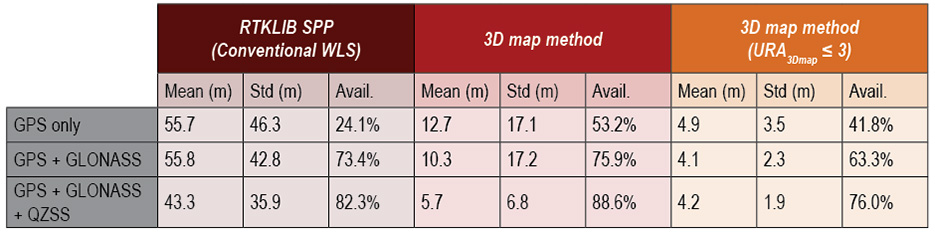
Table 3. Performance comparison of RTKLIB SPP and the proposed 3D map method using different combinations of satellite constellations in a deep urban canyon.
As shown in the left of Figure 8, only half of the GPS-only solutions are on the correct side of the street. A few points are incorrect due to the insufficient number of satellites. Adding GLONASS measurements greatly increases the availability, and most of the GPS-only outliers are corrected. The positioning error mean improves from 12.7 to 10.3 meters, and the availability improves from 53.2 to 75.9 percent. GLONASS measurements provide such a significant improvement because the distribution of GPS and GLONASS satellites are complementary.
After adding the QZSS measurements, availability further increases to 88.6 percent, and positioning error mean is reduced to 5.7 meters. The positioning error mean could be further improved to 4.2 meters if selecting the position points with URA3Dmap ≤ 3: the red, orange and yellow points in Figure 8. Although this selection will lose about 12 percent of availability, it could be easily compensated by a simple filtering technique.
Comparing Table 2 and Table 3, we find the positioning error of the proposed method in the middle urban canyon is about 1 meter worse than that in the deep urban canyon. This is because of the increase of multiple reflected signals.
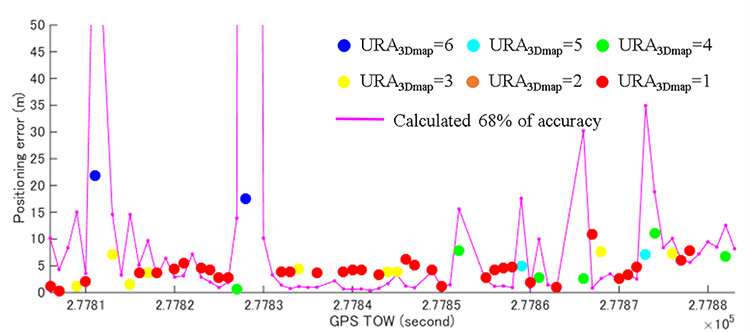
The target application of this 3D map method is consumer-based pedestrian navigation. Most of these applications benefit from an integrated system of multiple sensors. The 3D map method could serve as one sensor for such an integrated system. The calculation of positioning accuracy is required to indicate the quality of the point solution estimated by this method. Figure 9 shows the relationship between the calculated accuracy and positioning error. We can find that the calculated accuracy is able to describe the performance of the proposed method.
Figure 9. Positioning error of the 3D map method using GPS+GLONASS+QZSS. The purple line denotes the calculated 68 percent accuracy of the proposed method.
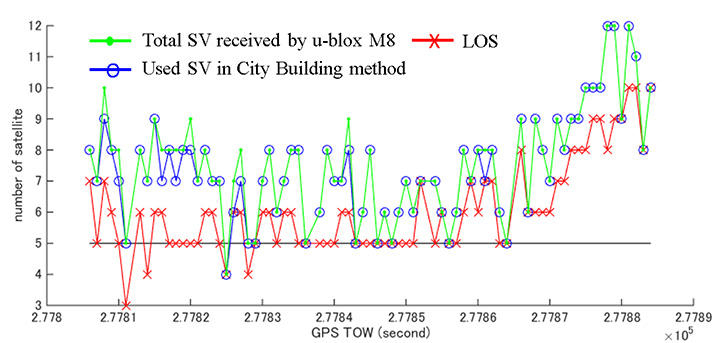
The performance of the conventional method is very inaccurate in this deep urban canyon. Its positioning error is larger than 40 meters. Figure 10 shows the number of satellites in this data. Note the number of LOS satellites is determined by the ray-tracing simulation according to the ground truth trajectory.
Figure 10. Number of LOS satellites, the number of satellites used in the 3D map method, and the total number of satellites tracked by the commercial-grade receiver.
The number of LOS satellites means the light-of-sight path of satellite is not blocked by buildings. Note that the LOS signal also contains the multipath effect. In this deep urban canyon, the number of LOS signals is much less than that of all received satellites. This implies a lot of NLOS is received, which deteriorates the performance of the conventional method. The map-based method is able to correct most of the NLOS signals.
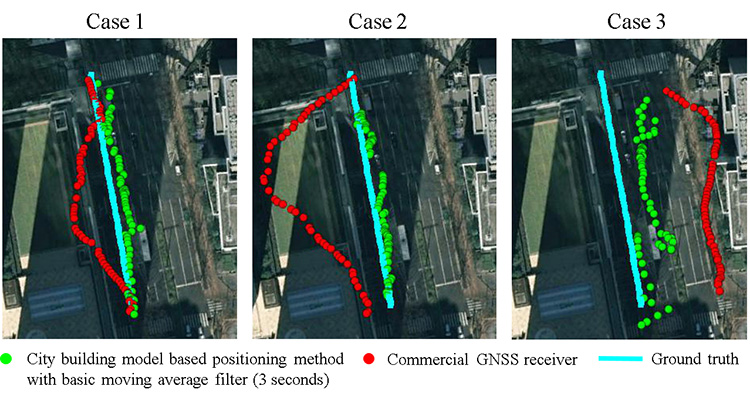
The number of satellites used in the map-based method is close to the number of all the satellites received. Therefore the map-based method can achieve better performance than the conventional method. Figure 11 demonstrates the comparison between the map-based method and the commercial GNSS receiver. The map-based method is simply smoothed by a moving average filter with 3 seconds data. It is difficult to understand the pedestrian trajectory by the commercial-grade receiver result. In some cases, the commercial receiver will estimate the pedestrian to be on the wrong side of the streets. The proposed method, instead, is capable of estimating the result at the correct side of the street.
Figure 11. Positioning results of the proposed 3D map method and commercial-grade receiver using GPS+GLONASS+QZSS in the deep urban canyon.
Li-Ta Hsu is a post-doctoral researcher at the Institute of Industrial Science of the University of Tokyo. He received his Ph.D. degree in aeronautics and astronautics from National Cheng Kung University, Taiwan.
Shunsuke Miura received an M.S. degree in information science from the University of Tokyo in 2013.
Shunsuke Kamijo received a Ph.D. in information engineering from the University of Tokyo, where he is now an associate professor.
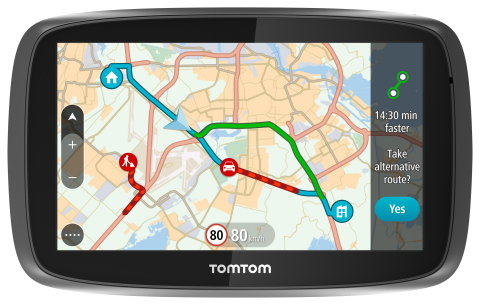
TomTom is introducing Lifetime World Maps and Lifetime Speed Cameras to drivers with the launch of four new TomTom navigation devices.
TomTom is introducing Lifetime World Maps and Lifetime Speed Cameras to drivers with the launch of new TomTom navigation devices. Lifetime World Maps allow people to drive with maps from around the world at no extra cost, for the lifetime of their TomTom GO device2. Lifetime Speed Cameras let drivers know the locations of all speed cameras — both fixed and mobile, also for the lifetime of the device.
The TomTom GO 510, 610, 5100 and 6100 feature a fully interactive screen to pinch, zoom and swipe — as well as a rich user interface, simplified user interaction, 3D Maps and a Click & Go mount. Drivers can also choose between a 5-inch or a 6-inch screen size, TomTom said. The new TomTom GO devices also include “Drive Home” and “Drive to Work” buttons in the main menu, for faster, simpler navigation.
TomTom GO devices combine real-time traffic information with routing technology, to always offer drivers the fastest route available. TomTom Traffic covers all mapped roads and combines data from millions of data sources, from all over the world, to deliver traffic information so accurate that, with each new update, it can pinpoint the start and end of a traffic jam, precisely, down to 10 meters.
“With the addition of Lifetime World Maps and Lifetime Speed Cameras to our new TomTom GO devices, we’re offering the most comprehensive package to drivers that we’ve ever launched,” said Corinne Vigreux, co-founder and managing director, TomTom Consumer. “Our aim is to help you avoid the jams, getting to your destination faster, wherever in the world you might be.”
Lifetime TomTom Traffic is available via a smartphone connection on the TomTom GO 510 and 610. The TomTom GO 5100 and 6100 offer Lifetime TomTom Traffic via a built-in SIM with unlimited data and roaming at no extra cost.
The new TomTom navigation devices are compatible with TomTom MyDrive4. For the first time, drivers can use their smartphone, tablet or PC to review real-time traffic information, plan routes, and send destinations to their TomTom GO, before they get in the car. Previously launched TomTom GO devices5 are also compatible with MyDrive though a simple software update. Find out more about TomTom MyDrive here.
The new TomTom GO devices are now available online and in-store from €199.95.
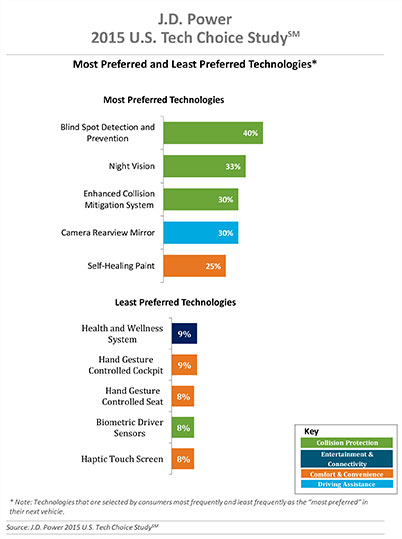
Three of the top five technologies consumers most prefer in their next vehicle are related to collision protection, according to a new J.D. Power 2015 U.S. Tech Choice Study.
Technologies that reduce the overall burden of driving and enhance the safety of the vehicle and its occupants receive the most consumer attention. Among the technologies consumers express most interest in having in their next vehicle are blind spot detection and prevention systems, night vision, and enhanced collision mitigation systems. These findings demonstrate growing customer acceptance towards the concept of the vehicle taking over critical functions such as braking and steering, which are the foundational building blocks leading to the possibility of fully-autonomous driving. The only non-collision protection technologies to crack the top five are camera rearview mirror, which falls into the driving assistance category, and self-healing paint, a comfort and convenience category.
In contrast, technologies in the navigation category have low preference across all vehicle price segments.
The inaugural study uses advanced statistical methodologies to measure preference for and perceived value of future and emerging technologies. A total of 59 advanced vehicle features are examined across six major categories: entertainment and connectivity; comfort and convenience; collision protection; driving assistance; navigation; and energy efficiency.
“There is a tremendous interest in collision protection technologies across all generations, which creates opportunities across the market,” said Kristin Kolodge, executive director of driver interaction and HMI research at J.D. Power. “In contrast, there is very little interest in energy efficiency technologies such as active shutter grille vents and solar glass roofs. Owners aren’t as enthusiastic about having these technologies in their next vehicle because of other efforts automakers are taking to improve fuel economy, as well as relatively low fuel prices at the present time.”
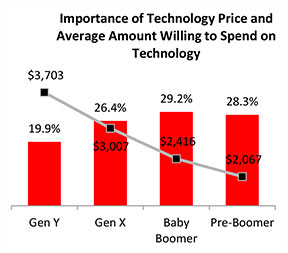
Gen Y Willing to Spend Most for Technology
Across all generations, price is the most important consideration for technology, accounting for 25.2 percent of importance. Gen Y is the least sensitive to technology price and shows a greater willingness to spend on new technologies than the other generations. Gen Y consumers, who have accounted for 27.7 percent of new-vehicle sales thus far in 2015 — second only to Boomers at 37.1 percent — are willing to spend an average of $3,703 on technology for their next vehicle. Gen X is willing to spend $3,007, while Boomers, who show the greatest price sensitivity, and Pre-Boomers are willing to spend only $2,416 and $2,067, respectively.
Importance of Technology
A certainty in the automotive domain is the impact the consumer electronics world has had upon it. From shifting consumer expectations of user interaction, to the rapid pace of technology introduction and importance of keeping software up to date, to the miniaturization and creation of cost-effective solutions for sensors and cameras, “the auto industry is standing on its head to keep technology up to consumers’ new standards,” said Kolodge. “Those who haven’t done so have seen negative feedback from consumers.”
Apple CarPlay vs. Google Android Auto
Smartphones play an increasingly vital role in everyday life, and vehicle technology is beginning to mirror what is offered on those devices, yet Apple CarPlay and Google Android Auto technologies consistently have among the lowest preference scores across all generations.
Consumer preferences for Apple CarPlay and Android Auto are uniquely dependent on which smartphone they own. Those who currently own a smartphone that is compatible with one of these technologies would choose the technology compatible with their phone at only a moderate rate, while those with the opposite brand of smartphone will rarely, if ever, choose that technology. For example, Android owners indicate that Apple CarPlay is “unacceptable” nearly twice as often as they indicate that solar glass roof is unacceptable.
Similarly, Apple phone owners indicate that Android Auto is “unacceptable” nearly twice as often as solar glass roof.
Kolodge noted that “lukewarm interest in these technologies that connect your phone to your vehicle coupled with consumer loyalty to their phone poses a unique challenge for automakers, which could be remedied by knowing their customers’ phone preferences.”
“Owners of luxury vehicles tend to own iOS devices, 1 so for many luxury brands, offering Apple CarPlay may be the best option, realizing they may be leaving out a portion of the market,” said Kolodge. “For nonluxury vehicle brands, the ownership of Apple and Android devices is much closer to an equal split. The solution for those brands may be to offer both operating systems and allow customers to select the option best suited for them.”
Key Findings
Full self-driving automation technology, part of the collision protection category, is designed to perform all safety-critical driving functions and monitor roadway conditions. The younger generations (Gen Y and Gen X) have substantially higher preference for the technology than the older generations (Boomer and Pre-Boomer). The Pre-Boomer generation, in contrast, has a greater preference for lower levels of automation, such as traffic jam assist.
Blind spot detection and prevention has high preference across the range of vehicle price segments. In contrast, reverse auto braking systems have low preference across the vehicle price segments and preference wanes as vehicle prices increase.
Advanced sensor technologies, such as hand gesture controlled seats, biometric driver sensors or haptic touch screens have low preference.
Technologies in the navigation category have low preference across all vehicle price segments.
The 2015 U.S. Tech Choice Study was fielded in January through March 2015 and is based on an online survey of more than 5,300 consumers who purchased/leased a new vehicle in the past five years.
TomTom is partnering with Mozilla and Telefónica to bring its Maps Online and Nav Online apps to HTML5-powered Firefox OS smartphone devices.
“We’re thrilled to offer Firefox OS users TomTom’s Maps Online and Nav Online apps in the Firefox Marketplace,” said Bertrand Neveux, director of Marketplace and Ecosystem at Mozilla. “Our priority is to empower users with a mobile experience that makes their lives richer and more efficient, and great content like TomTom’s ensures that.”
“Telefónica has now launched Firefox OS devices in 14 markets and is pleased to see high-quality maps and navigation solutions from TomTom that enhance these devices for our consumers in Latin America and Europe,” said Simon Callan, director Business Development at Telefónica.
“TomTom is excited to be embracing the openness of HTML5 to bring high quality maps and turn-by-turn navigation to the ecosystem,” said Charles Cautley, managing director of TomTom Licensing. “By partnering with Mozilla and Telefónica, we’re opening new markets and opportunities for smartphone users globally.”
TomTom Maps Online offers accurate and up-to-date maps, as well as Address and Point of Interest search capabilities with routing instructions, enabling Mozilla customers to quickly and easily find their favorite places, TomTom said.
With TomTom Nav Online, Telefónica’s Firefox OS customers can extend the mapping experience to full voice-guided turn-by-turn navigation.
Navitel Q1 2015 Maps for Brazil, Mexico, Maldives, Philippines
Navitel has updated Q1 2015 Navitel Navigator maps of Brazil, Mexico, Maldives and the Philippines.
The updated maps contain 1,892,294 kilometers of roads, 2,381,245 points of interest (POI) and 264,896 settlements. Users can now search by a road network for 7,370 addresses, including a detailed search of bungalows.
Navitel says visual representation of roads, traffic jams, indication of forbidden turns and routes have been improved.
The Q1 2015 maps are compatible only with the 9.1.0.0 or later versions of Navitel Navigator.
Navitel Navigator 9.5.30 Update for iPhone, iPad, Windows, Blackberry
Navitel Navigator 9.5.30 now allows users to reserve a hotel room with Booking.com within the app. Navitel also has added a sign for the second maneuver that appears when following a route, notifying the upcoming and next maneuver.
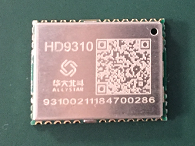


 We covered the tools to help analyze GNSS measurements. How strong are the individual measurements? How accurate are the range measurements? With these tools, developers now have direct insight into the lowest layers of a GNSS receiver. Then came activity recognition algorithms (15:40) and how deep neural networks will improve the precision of these algorithms and help advance the field in activity recognition.