Annual revenues from connected healthcare and fitness services will approach $2 billion by 2019, nearly six times the $320 million value estimated for this year, according to a report from Juniper Research.
The report, “Smart Wireless Devices: CE, Enterprise, Fitness, Healthcare, Payments 2015-2019,” says that connected healthcare devices and the data they generate will offer substantial benefits to both stakeholders and consumers, potentially improving preventative healthcare. However, deployments will initially be constrained by inconsistent regulation, alongside continued privacy concerns surrounding the sharing and security of personal data.
‘Quantified Others’ are Key
The research highlights the “quantified others” trend: the use of someone’s data by a professional or concerned party — such as a parent — to provide meaning and/or advice. Companies like GOQii and Filip Technologies are using this to provide services beyond mere data provision.
Although, this has the potential to be undermined by unreliable data. While medical devices have validation standards, fitness devices have no such benchmark. The development of standards would alleviate consumer and medical professionals’ concerns, driving up adoption.
Software to Drive Connected Devices Forward
“Connected fitness and health devices provide a way to collect biometric data, not interaction platforms,” said author James Moar. “People want to interact with the devices at the app level – the draw is the information. Because of this, and the omnipresence of sensors, the importance of the hardware will diminish at a much faster rate than other CE market segments.”
Other Findings from the Report
Other findings were mentioned in a news release from Juniper Research, and are listed below:
“Smart Wireless Devices will permeate the enterprise, with smart glasses in particular having a large impact.”
“Mobile point-of-sale devices are poised to take off in developing markets, with several key players looking to move into Latin America and Asia Pacific in the coming years.”
“Smartwatches will be the most popular consumer electronics connected devices, overtaking more established wearable cameras.”
The white paper, Smart Wireless Devices & the Internet of Me, is available to download from the Juniper website together with details of the full research and the Interactive Forecast Excel (IFxl).
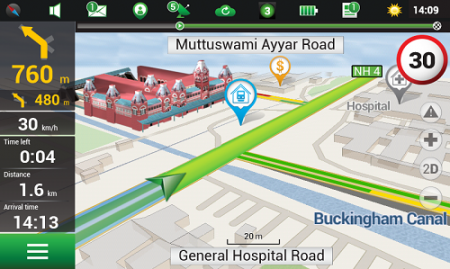
Navitel’s navigation map of India is now available for purchase, for use with the Navitel Navigator GPS & Maps app on Google Play. Navitel Navigator is a precise offline GPS navigation with free geosocial services and detailed maps of 59 countries, with 20 million downloads worldwide.
The map of India contains 2,092,013 km of road graph, 594 627 cities, towns, and other settlements, as well as 5,294,344 POI. Coupled with the address search in more than 6 000 residential and industrial areas of settlements, this map includes the detailed housing system data with due account for the number of floors, detailed road networks with all streets, roads, and indicated traffic direction, road interchanges, roundabouts, and other important road information.
The map contains 149 3D points of interest, including:
Gujarat – ISCON Mall, Satyam Centre, the Metropole Hotel, Kaizen Hospital.
Karnataka – Bangalore Palace, Software Technology Park of India, Jamia Masjid, Hotel Savannah Sarovar Premiere, Jawahar Bal Bhawan park.
TamilNadu – Chennai International Airport, Chennai Railway Station, Manorama Hotel, Lemon Tree Hotel.
Haryana – Vardhman Star Mall, YMCA University of Science and Technology, Mini Secretariat, Sarvodaya Hospital, Gurgaon Centre.
Chandigarh – Panjab University, Chandigarh College of Engineering & Technology, Haryana and Punjab Secretariat, Hotel Royal Plaza.
Details for Map of India, Q1 2015:
2,092,013 km of road graph;
594,627 settlements on the map;
6,614 settlements allowing the address search;
8,217,526 addresses;
149 3D points of interest;
5,294,344
Android OS device users can purchase a license key to the new product at Google Play and from the program menu by selecting “My Navitel” > “Purchase maps”.
The Q1 2015 map of India is compatible only with 9.1.0.0 and later versions of Navitel Navigator.
Ride service Uber is buying mapping and search startup deCarta, reports Mashable, which said it learned of the deal from an Uber representative.
The deal was expected to close earlier this month. Uber plans to use deCarta’s technology and talent to fine-tune its products and services that rely on maps, including UberPOOL, the smartphone-based ride-sharing app.
Thirty out of 40 deCarta employees will remain with the company, including Kim Fennell, chief executive officer and president, Mashable said. deCarta will continue to operate as a wholly-owned subsidiary of Uber, but will use its own name.
Founded in 1996, deCarta is privately held, and headquartered in San Jose, Calif., with international offices and distributors in Germany, China, Brazil and South Africa. deCarta is a global location-based services (LBS) technology company that provides specialized geospatial technologies for online mapping, routing, navigation, geocoding, local search and geo-data integration and processing. The company’s platform is used by high-volume LBS applications and services in the mobile, Internet, enterprise-fleet and automotive markets. Customers and technology partners include Samsung, Inrix, T-Mobile, FullPower MotionX GPS Drive, Appello, Denso, Ford, GM OnStar, Masternaut, Wireless Matrix, eMapgo, Nokia/HERE, Spot-On-Time, Telstra/Sensis, TomTom, WHERE/eBay.
In February, Uber announced a partnership with Starwood Hotel and Resorts where Starwood Preferred Guest members earn points towards free hotel stays for every dollar spent riding Uber.
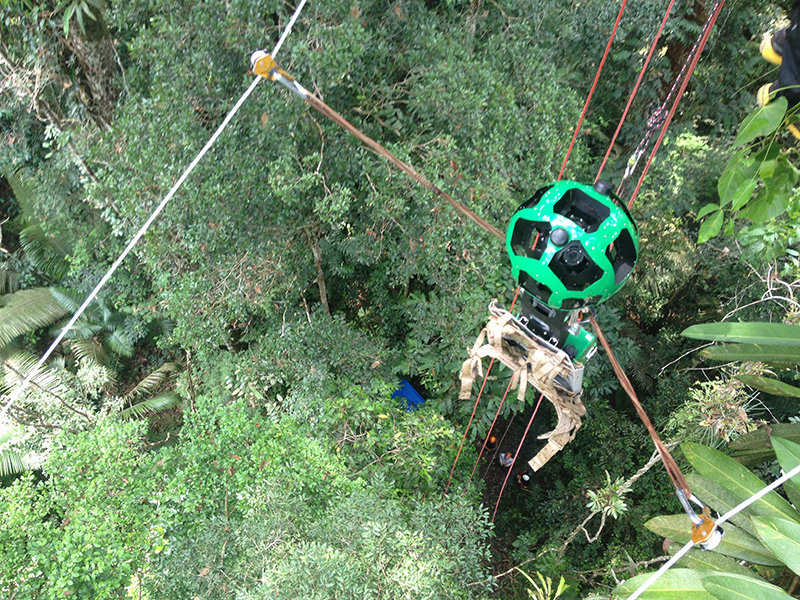
The Street View Trekker on a zipline in the Amazon Rainforest. (Photo credit: Google Maps)
New imagery of the highest canopy in the Amazon rainforest is now available on Google Maps. The Amazon rainforest is one of the most diverse ecosystems in the world, with many species high in the canopies of the forest still undiscovered.
“Starting today, with the help of our partners at the Amazonas Sustainable Foundation (FAS), you can begin to unlock some of the wonders of the forest, by traveling from the upper canopy to the forest floor with Google Maps’ first zipline Street View collection,” wrote Karin Tuxen-Bettman, program manager, Google Earth Outreach on a March 1 blog.
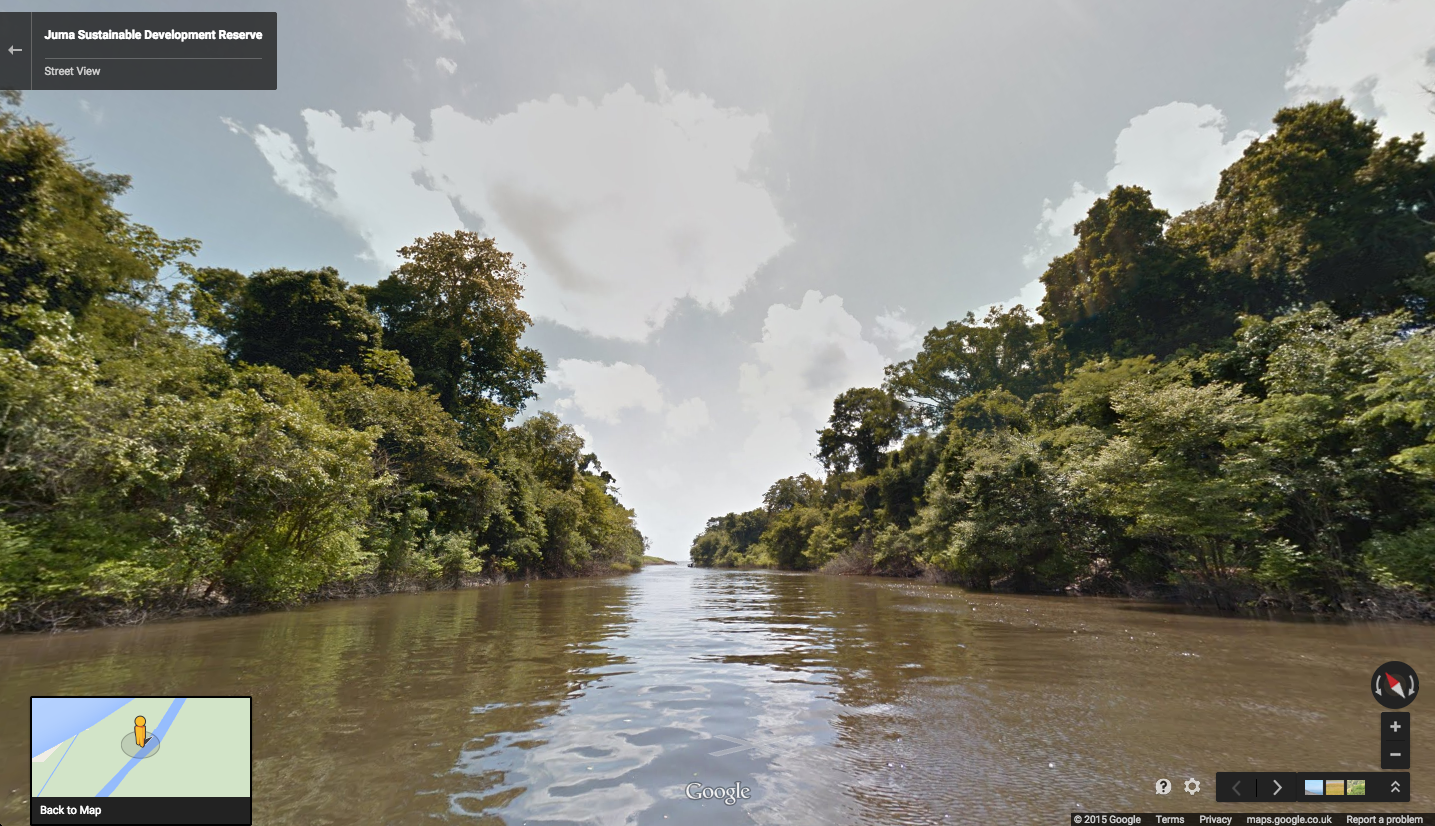
The project is part of Google’s partnership with FAS, who three years ago invited Google Maps to the Rio Negro Sustainable Development Reserve. “Their hope is that sharing the imagery of their local communities, rain forests and rivers with the world will raise awareness and support for their efforts to conserve these areas,” Tuxen-Bettman writes.
The imagery was collected through Google Map’s Trekker Loan Program, which loans out the Street View camera and technology to tourism boards, non-profits, universities, and research organizations to help collect imagery of remote places.
The Amazon map imagery was gathered through boat travels on 500 kilometers of rivers, hiking on 20 kilometers of forest trails and ziplining through forest canopies.
“We hope it inspires you to embark on your own virtual expedition of the Amazon (you can leave the bug repellent at home!),” Tuxen-Bettman writes.
The map on this page shows where Google Maps has yet to collect Street View imagery.
Rio Mariepauá, Brazil. (Photo credit: Google Maps)
Rx Networks Inc., a mobile location technology and services company, announced the upcoming release of its GPStream PGPS v8 extended ephemeris solution at Mobile World Congress 2015, taking place this week in Barcelona, Spain.
The patented technology, being used in hundreds of millions of devices, is designed to speed up the time-to-first-fix (TTFF) of any GNSS chipset while improving acquisition sensitivity in challenging environments.
Compared to the previous version, GPStream PGPS v8 effectively doubles accuracy performance while supporting all four global GNSS constellations. GPStream PGPS v8 will be available for integration testing in the second quarter of 2015, with commercial release in the fourth quarter of 2015. (Full commercial support for Galileo will remain subject to the readiness of the constellation).
All major GNSS semiconductor vendors are now offering or developing multi-constellation support to improve availability in challenging environments. Quad-constellation support also enables OEMs and GNSS chipset manufacturers to meet any national or regional market requirement. Availability of extended ephemeris across the four constellations is required to ensure fast TTFF and optimal sensitivity. Early lab access to the latest GPStream PGPS v8 solution from Rx Networks can help chipset manufacturers validate performance early in the development cycle and thus accelerate the time to market for their new multi-constellation chipsets.
A key component of any extended ephemeris solution is the accuracy of the orbit and clock predictions. This accuracy is often presented as an error in meters compared to the native broadcast ephemeris transmitted by the satellites. The latest version of GPStream PGPS improves this accuracy by a factor of two, compared to its previous release. For example, day 1, 7 and 14 accuracies for GPS are now 2.8 m, 4.5 m and 11.4 m compared to 6.3 m, 12.5 m and 30.2 m previously. BeiDou and Galileo will experience similar performance. GLONASS is also significantly improved, with day 1, 7 and 14 accuracies of 1.8 m, 6.5 m and 13.7 m compared to 7.3 m, 13.4 m and 27.2 m previously.
“Rx Networks continues to expand its relationships with major OEMs and GNSS chipset manufacturers to help them deliver innovative, multi-constellation and highly accurate GNSS performance,” said John Carley, senior product manager at Rx Networks. “This latest release reaffirms our commitment to provide best in class Assisted-GNSS solutions for the mobile market.”
Rx Networks is exhibiting in Booth 5H75 at Mobile World Congress.
InvenSense Inc. is making available its InvenSense Positioning Library (IPL) software, designed to provide sensor-assisted positioning in places where GNSS alone cannot provide desired accuracy. Invensense is a provider of intelligent sensor system on chip for motion and sound in consumer electronic devices.
InvenSense made the announcement at Mobile World Congress, taking place in Barcelona, Spain March 2-5.
The IPL incorporates advancements in sensor-assisted positioning algorithms that allow use of inertial sensors to improve GNSS positioning in urban areas where satellite signals are either blocked or distorted by multipath, enabling continuous location availability while driving in underground parking lots, tunnels, or walking in urban canyons. The IPL enables continuous and accurate position, velocity and orientation in challenging operating environments.
These sensor-assisted positioning algorithms have been designed to operate under normal pedestrian and driving use without restrictions on the device orientation. Supported pedestrian use includes handheld, hand swinging, in pocket, call mode and belt holster. The algorithms also allow any use within the vehicle, such as in cradle, cup holder or simply left on a seat. The software was designed in a way to maximize accuracy and minimize constraints on the user.
The IPL is designed to operate with an IMU and GNSS receiver as minimum hardware. Integration with a magnetometer, barometer, and vehicle speed sensor is also available, which provides additional heading integrity as well as height and velocity accuracy for sensor-assisted positioning.
IPL is designed for smartphones using Android, iOS, Windows and general Linux operating systems and has already started shipping commercially. The underlying navigation technology comes from years of development at Trusted Positioning Inc., which was acquired by InvenSense this past summer.
“With more consumers using their smartphones for turn-by-turn navigation on foot or in vehicle, one of the most frustrating user experience issues is losing your GPS (GNSS) signal in an unfamiliar location or being re-routed erroneously due to multipath errors,” said Ali Foughi, vice president of Marketing and Business Development at InvenSense. “With IPL technology, high-accuracy location guidance is always available and provides smartphone OEMs with a differentiated user experience and consumers with a more reliable navigation solution.”
The InvenSense Positioning Library is available immediately.
InvenSense is exhibiting in booth #D61 in Hall 7 at Mobile World Congress.
Centimeter Positioning with a Smartphone-Quality GNSS Antenna
By Kenneth M. Pesyna, Jr., Robert W. Heath, Jr. and Todd E. Humphreys, the University of Texas at Austin
The smartphone antenna’s poor multipath suppression and irregular gain pattern result in large time-correlated phase errors that significantly increase the time to integer ambiguity resolution as compared to even a low-quality stand-alone patch antenna. The time to integer resolution — and to a centimeter-accurate fix — is significantly reduced when more GNSS signals are tracked or when the smartphone experiences gentle wavelength-scale random motion.
GNSS chipsets are now ubiquitous in smartphones and tablets. Yet the underlying positioning accuracy of these consumer-grade GNSS receivers has stagnated over the past decade. The latest clock, orbit, and atmospheric models have improved ranging accuracy to a meter or so, leaving receiver-dependent multipath and front-end-noise-induced variations as the dominant sources of error in current consumer devices. Under good multipath conditions, 2-to-3-meter-accurate positioning is typical; under adverse multipath, accuracy degrades to 10 meters or worse.
Yet outside the mainstream of consumer GNSS receivers, centimeter — even millimeter — accurate GNSS receivers can be found. These high-precision receivers are used routinely in geodesy, agriculture, and surveying. Their exquisite accuracy results from replacing standard code-phase positioning techniques with carrier phase differential GNSS (CDGNSS) techniques. Currently, the primary impediment to performing CDGNSS positioning on smartphones lies not in the commodity GNSS chipset, which actually outperforms survey-grade chipsets in some respects, but in the antenna, whose chief failing is its poor multipath suppression. Multipath, caused by direct signals reflecting off the ground and nearby objects, induces centimeter-level phase measurement errors, which, for static receivers, have decorrelation times of hundreds of seconds. The large size and strong time correlation of these errors significantly increases the initialization period — the so-called time-to-ambiguity-resolution (TAR) — of GNSS receivers employing CDGNSS to obtain centimeter-level positioning accuracy.
Prior work on centimeter-accurate positioning with low-cost mobile devices has focused on external devices, or “pucks,” which contain a GNSS antenna and chipset. These devices interface with the smartphone via Bluetooth or a wired connection. Such solutions, which enjoy the better sensitivity and multipath suppression offered by their comparatively large, high-quality GNSS antennas, do not provide insight into the feasibility of CDGNSS on a stand-alone smartphone platform.
This article demonstrates that centimeter-accurate CDGNSS positioning is indeed possible based on data sampled from a smartphone-quality GNSS antenna. This result has far-reaching significance for precise mass-market positioning. We offer an empirical analysis of the average gain and carrier phase multipath error susceptibility of smartphone-grade GNSS antennas. We also demonstrate that, for low-quality GNSS antennas such as those in smartphones, wavelength-scale random antenna motion substantially improves the time to integer ambiguity resolution.
This article focuses on single-frequency CDGNSS rather than multiple-frequency CDGNSS or other carrier-phase-based techniques, such as precise-point positioning (PPP), for three reasons. First, virtually all smartphones are equipped with single-frequency GNSS antennas tuned to the L1 band centered at 1575.42 MHz, and single-frequency CDGNSS will likely forever remain the cheapest option. Second, as compared to PPP, CDGNSS converges much faster to centimeter accuracy, which will be important for impatient smartphone users.
Finally, as centimeter-accurate GNSS moves into the mass market, GNSS reference stations will proliferate so that the vast majority of users can expect to be within a few kilometers of one. In this so-called short baseline regime, the differential ionospheric delay between the reference and mobile receivers becomes insignificant, obviating differential delay estimation via multi-frequency measurements. Of course, the additional signal measurements produced by multiple-frequency receivers would lead to faster convergence times and improved robustness, but for many applications, single-frequency measurements will be adequate.
Test Architecture
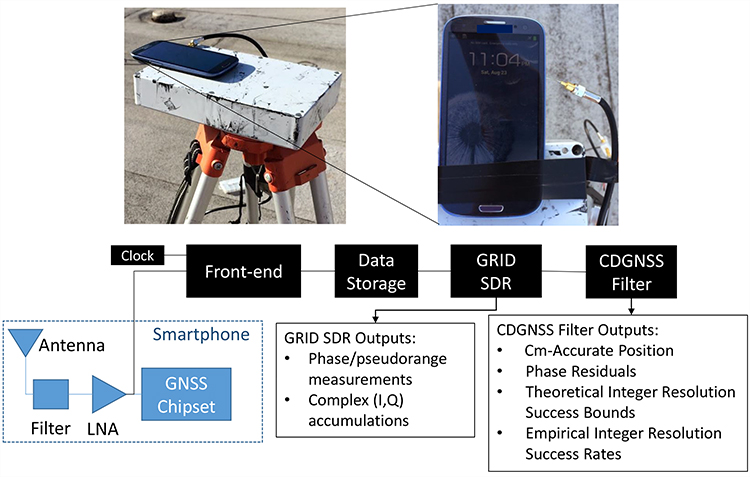
We used the test architecture shown in Figure 1 to collect data from a smartphone-grade antenna and higher quality antennas, process these data through a software-defined GNSS receiver, and compute a CDGNSS solution on the basis of the carrier phase measurements output by the GNSS receiver.
Figure 1. Test architecture designed for an in-situ study of a smartphone-grade GNSS antenna. The analog GNSS signal is tapped off after the phone’s internal bandpass filter and low-noise amplifier and is directed to a dedicated RF front-end for downconversion and digitization. Data are stored to file for subsequent post-processing by a software GNSS receiver and CDGNSS filter.
The architecture has been designed such that the antenna is left undisturbed within the phone; data are collected by tapping off the analog signal immediately after the phone’s internal bandpass filter and low-noise amplifier. This analog signal is directed to an external radio frequency (RF) front-end and GNSS receiver. Use of an external receiver permits well-defined GNSS signal processing unencumbered by the limitations of the phone’s internal chipset and clock.
The clock attached to the external front-end was an oven-controlled crystal oscillator (OCXO), which has much greater stability than the low-cost oscillators used to drive GNSS signal sampling within smartphones. However, it was found that reliable cycle-slip-free GNSS carrier tracking only required a 40-ms coherent integration (pre-detection) interval, which is within the coherence time of a low-cost temperature-compensated crystal oscillator (TCXO) at the GPS L1 frequency.
Although only a single model of smartphone was tested using this architecture — a popular mass-market phone — the results are assumed representative of all smartphones from the same manufacturer.
Using this architecture, many hours of raw high-rate (∼6 MHz) digitized intermediate frequency samples were collected and stored to disk for post processing. Also stored to disk were high-rate data from a survey-grade antenna, which served as the reference antenna for CDGNSS processing. An in-house software-defined GNSS receiver, known as GRID, was used to generate, from these samples, high-quality carrier phase measurements. GRID is a flexible receiver that can be easily adapted to maintain carrier lock despite severe fading. Complex baseband accumulations output from GRID allowed detailed analysis of the signal and tracking loop behavior to ensure that no cycle slips occurred. The generated carrier phase measurements were subsequently passed to a CDGNSS filter, a model for which is described in the next section.
CDGNSS Processing
The CDGNSS filter described in this section ingests double-differenced carrier phase measurements output from GRID and processes them to produce (1) the centimeter-accurate trajectory estimate of the mobile antenna, (2) a time history of phase residuals, (3) carrier phase integer ambiguity estimates, (4) theoretical integer ambiguity resolution success bounds, and (5) empirical integer ambiguity resolution success rates. These outputs are used to analyze the performance of the smartphone-grade antenna and compare its performance to higher-quality antennas.
CDGNSS Filter Model. The filter’s state has a real-valued component xk that models the mobile antenna’s relative center of motion, its instantaneous offset from this center of motion, and its velocity at each time epoch k:
. (1)
The filter’s state also has an integer-valued component that models the CDGNSS phase ambiguities:
(2)
where NSV is the total number of satellites tracked. Such integer ambiguities are inherent to carrier phase differential positioning techniques; their resolution has been the topic of much past research and is required to produce a CDGNSS positioning solution.
Dynamics and Measurement Models. The real-valued state component xk is assumed to evolve as a mean-reverting second-order Gauss-Markov process. This process models the time-correlated and mean-reverting motion a smartphone experiences when held or moved gently in the extended hand of an otherwise stationary user. The integer-valued state component nk is modeled as constant, since the phase ambiguities remain fixed so long as the receiver retains phase lock on each signal.
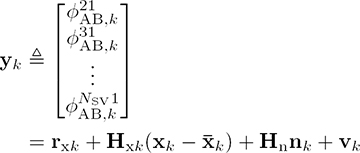
The filter ingests measurement vectors yk for k = 1, …, K, each populated with a single epoch of double-differenced carrier phase measurements for i = 1, 2, . . . , NSV–1. The filter’s measurement model relates yk to the real- and integer-valued state components through the following linearized GNSS carrier phase measurement model:
(3)
where rxk is a vector of double-differenced modeled ranges based on the filter’s real-valued state prior ,Hxk and Hn are the measurement sensitivity matrices for the real- and integer-valued state components, and vk is the double-differenced measurement noise vector, all at time k.
Phase Residuals. After processing data through the CDGNSS filter, the filter outputs, in addition to a time history of centimeter-accurate position estimates, a time history of phase residuals , which can be thought of as departures of each double-differenced phase measurement from phase alignment at the phase center of the antenna. These residuals can be modeled as
(4)
where rxk is now based on the filter’s real-valued state estimate at time k and represents the filter’s estimate of the integer ambiguities at time K.
Phase residuals have been produced for batches of data collected from four different grades of antennas, as described next. These residuals will be used to analyze the suitability of each antenna for CDGNSS positioning.
Antenna Performance Analysis
This section describes four antennas from which data were captured and processed using the test architecture and CDGNSS filter described previously. It also quantifies the characteristics that make low-quality smartphone-grade antennas poorly suited to CDGNSS.
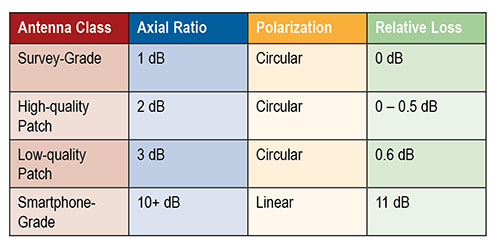
Table 1 describes a range of antenna grades of decreasing quality, noting properties relevant to CDGNSS. The loss numbers in the far-right column represent the average loss in gain relative to a survey-grade antenna, where the average is taken over elevation angles above 15 degrees.
Table 1. Antenna properties.
Survey-grade antennas, whose properties are described in the first row of Table 1, have a uniform quasi-hemispherical gain pattern, right-hand circular polarization, a stable phase center, and a low axial ratio. These are all desirable properties for CDGNSS. Unfortunately, these properties inhere in the antennas’ large size; the laws of physics dictate that smaller antennas will typically be worse in each property.
The last row of Table 1 lists the properties for a smartphone-grade antenna. As shown subsequently, this antenna loses between 5 and 15 dB in sensitivity as compared to the survey-grade antenna. Such a loss makes it difficult to retain lock on GNSS signals. In addition, this antenna’s linear polarization leads to extremely poor multipath suppression.
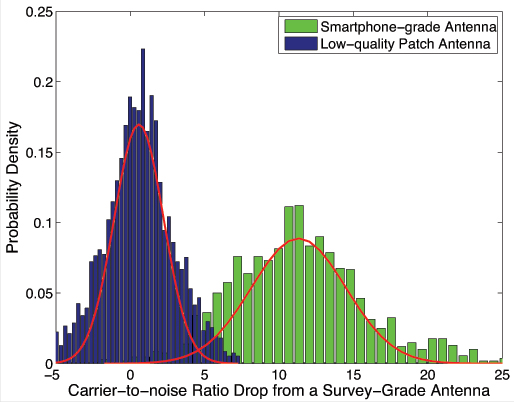
Antenna Gain Analysis.Figure 2 quantifies one of the obvious drawbacks of a smartphone-grade antenna, namely, its low gain.
Figure 2, Drop in carrier-to noise ratio, from 2 hours of data and 9 tracked satellites. Antennas remained stationary.
The rightmost histogram, in green, shows that the decrease in carrier to noise ratio as compared to a survey-grade antenna is on average 11 dB, such that the smartphone-grade antenna only captures approximately 8 percent of the signal power as compared its survey-grade counterpart. For comparison, shown on the left, in blue, is a histogram of the decrease in carrier-to-noise ratio for the low-quality patch antenna. This antenna only suffers about a 0.6-dB drop in power on average relative to the survey-grade antenna. Each histogram was generated from 2 hours of data with nine tracked satellites ranging in elevation from 15 to 90 degrees. The antennas remained stationary. The variation in signal power around the means is due to the multipath-induced power variations in the signal as well as to the different gain patterns between each antenna and the survey-grade antenna.
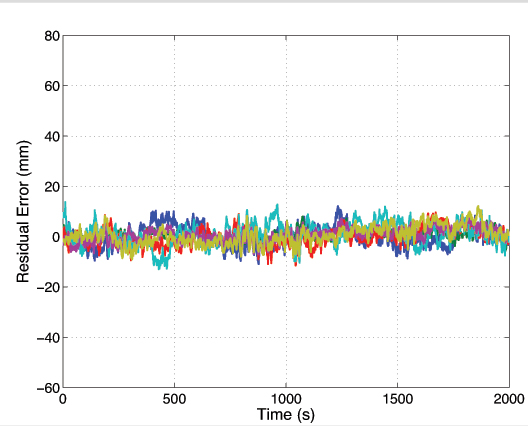
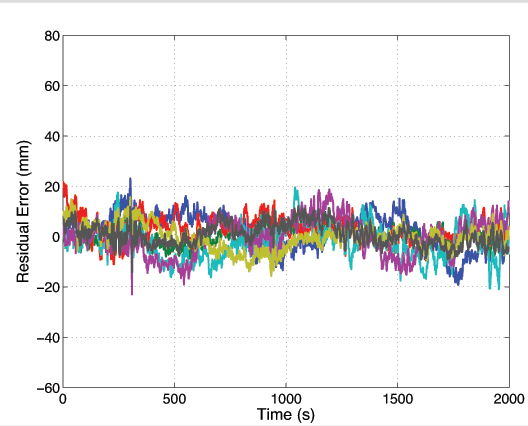
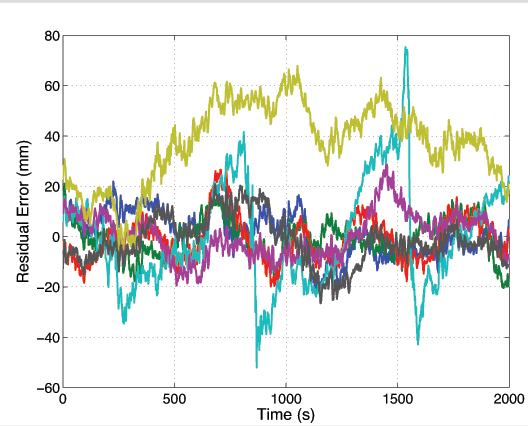
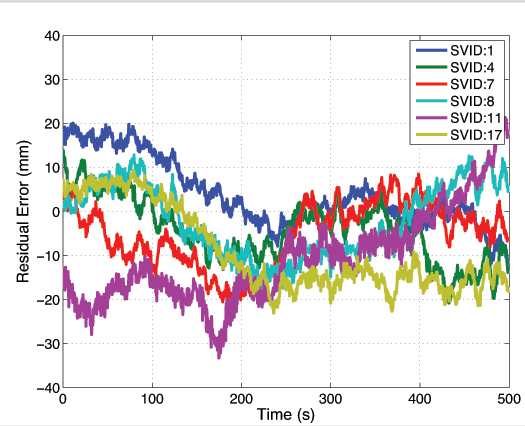
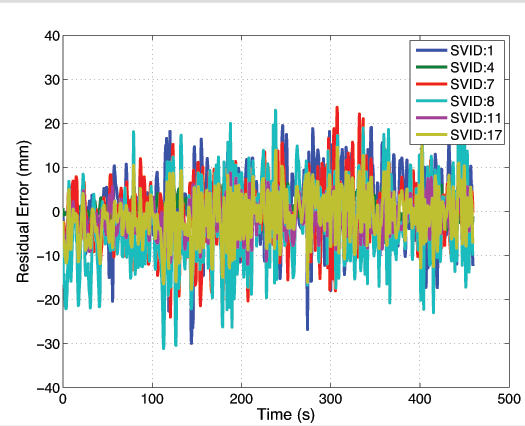
Phase Residual Analysis. Shown in Figures 3, 4, and 5 are 2,000-second segments of double-differenced phase residual time histories for data collected from a survey-grade, a low-quality patch, and a smartphone-grade antenna, respectively.
Figure 3. Survey-grade antenna. Each trace represents a residual for a different satellite pair. Ensemble average standard deviation 3.4 millimeters.Figure 4. Low-quality patch antenna. Ensemble average deviation 5.5 mm.Figure 5. Smartphone-grade antenna.Ensemble average deviation 11.4 mm.
To produce these residuals, the antenna position was locked to its estimated value within the CDGNSS filter. The residuals represent departures of the carrier phase measurements from perfect alignment at the average phase center of the antenna. Each different colored trace corresponds to a different satellite pair. While the data segments were not captured at the same time of day, they were captured at the same location, and thus the multipath environment was similar.
The ensemble average residual standard deviations increase with decreasing antenna quality. The residuals for the survey-grade, low-quality patch, and smartphone-grade antennas have ensemble average standard deviations of 3.4, 5.5 and 11.4 millimeters, respectively. This increase is due to the lower gain and less effective multipath suppression of the lower quality antennas.
Figure 5 shows the presence of outlier residuals in the data collected from the smartphone-grade antenna. These outliers, one of which persists for over 1,000 seconds, are likely caused by either large and irregular azimuth- and elevation-dependent antenna phase center variations or a combination of poor antenna gain in the direction of the non-reference satellite coupled with ample gain in the direction of a multipath signal such that the multipath signal is received with more power than the direct-path signal. Obvious outliers such as these can be automatically excluded by the CDGNSS filter via an innovations test. However, the standard deviation of the remaining residuals still remains large compared to that of the other antennas; the ensemble average standard deviation decreases from 11.4 to 8.6 millimeters upon exclusion of the two large outliers.
For antennas with a large ensemble average standard deviation in their double-differenced phase errors, the time correlation in the phase errors becomes more important. This time correlation, which persists for 100–200 seconds, is a well-studied phenomenon caused by slowly varying carrier phase multipath. While correlation is present in the residuals of all antenna types, and manifests approximately the same decorrelation time, its effect is more of a problem for low-quality antennas because the phase errors are larger. Such correlation, coupled with a large deviation, ultimately leads to a longer time to ambiguity resolution, shown later.
Given a smartphone antenna’s extremely poor gain and multipath suppression as compared to even a low-quality stand-alone patch antenna, one might question the wisdom of attempting a CDGNSS solution using such an antenna. However, the next section reveals that it is indeed possible to achieve a centimeter-accurate positioning solution using a smartphone GNSS antenna despite its poor properties.
CDGNSS with Smartphone Antenna
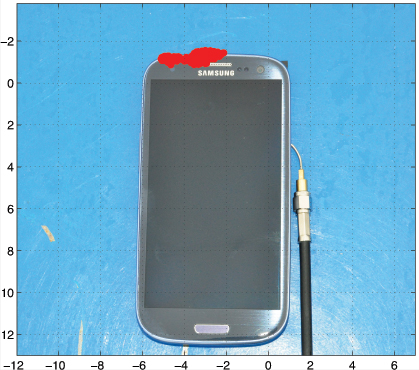
Figure 6 shows the result of an attempt to compute a CDGNSS solution using data collected from the GNSS antenna of a smartphone. The cluster of red near the top of the phone represents 400 CDGNSS position estimates over a 5-minute interval, superimposed on the photo and properly scaled. This cluster is referenced to a marker immediately under the phone whose position was surveyed to approximately 1-centimeter accuracy using a high-quality patch antenna. The mean of the cluster’s horizontal coordinates is approximately 2 centimeters from the phone’s internal GNSS antenna. Figure 6 shows the absolute horizontal accuracy of a CDGNSS solution through the smartphone’s antenna is approximately 2 centimeters.
Figure 6 . Successful CDGNSS solution using data collected from smartphone antenna. The red cluster represents 400 CDGNSS solutions over 5 minutes, superimposed and properly scaled.
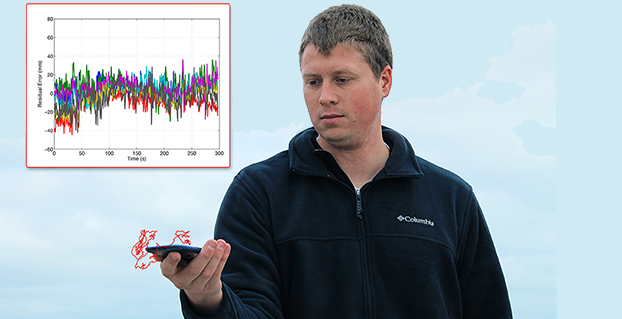
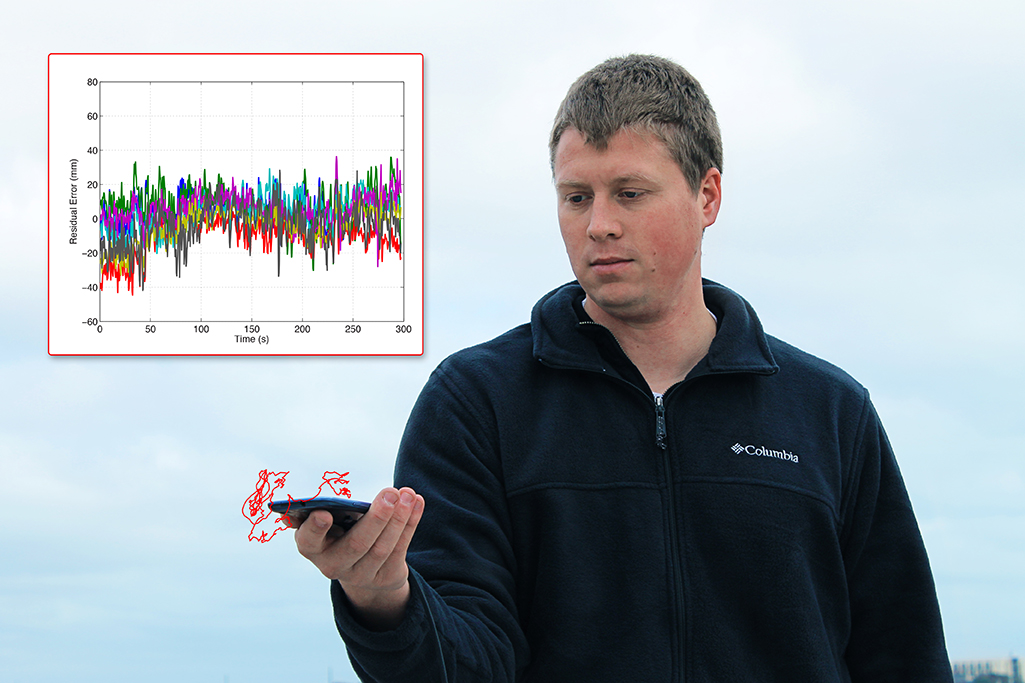
The data in Figure 6were collected with a large conductive backplane below the smartphone. However, the backplane is unnecessary. The opening photo shows the result of a CDGNSS positioning solution computed using data collected from the smartphone antenna while the device was held in the extended hand of the author. The cluster of red represents the computed 3-dimensional position of the phone over a 300-second interval, superimposed on the photo and properly scaled. The author’s hand moved slightly during the interval, as reflected in the figure.
The opening photo also shows the residuals corresponding to the handheld CDGNSS solution. This shows how the residuals look in practice for a scenario in which the phone is held by a user. The residuals look fairly clean, that is, they have a small variance and their mean is approximately zero. It is not uncommon for the residuals to look this good; however, cases do arise in which the residuals are considerably worse due to a combination of poor antenna gain in the direction of the non-reference satellite, coupled with ample gain in the direction of a multipath signal.
The possibility of CDGNSS-enabled centimeter positioning using a smartphone antenna has been previously conjectured, but — to our knowledge — Figure 6 and the opening photo represent the first published demonstrations that this is indeed possible. This significant result portends a vast expansion of centimeter-accurate positioning into the mass market. However, serious challenges must be overcome before mass-market CDGNSS can become practical. Some of these challenges will be studied in the next few sections.
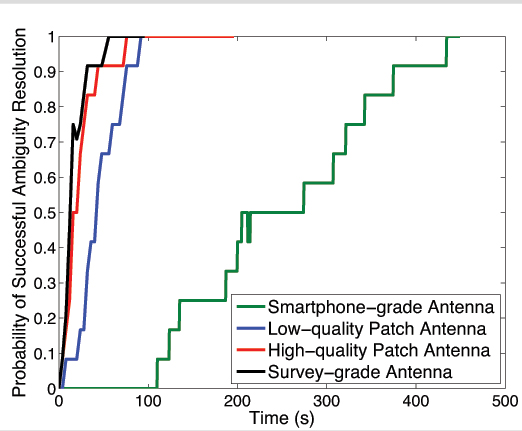
Static Scenario. Figure 7 shows the empirical probability of successful ambiguity resolution for data collected from four antennas, one of each of the different grades discussed earlier. For each antenna, seven satellites were tracked at approximately the same location and time of day. Each trace was computed from 12 batches of double-differenced carrier phase data.
Each trace represents an empirically-derived success rate computed from 12 batches of phase data as follows:
For a given batch, at each epoch the filter outputs its best estimate of the integer ambiguities on the basis of the data ingested thus far.
The estimate from step 1 is compared against the true set of integer ambiguities which were acquired in advance by processing a much longer batch of data. If correct, a flag is set at that epoch to “1”; if incorrect, the flag is set to 0.
For each epoch, the flags produced in step 2 are averaged across all 12 batches to generate each trace.
Figure 7. Residuals for CDGNSS solution depicted in the opening photo.
As shown by the green trace in Figure 7, the smartphone-grade antenna required 400 seconds to achieve a 90% ambiguity resolution success rate; in other words, it manifested a 400-second TAR at 90%. This would surely exceed the patience of most smartphone users. Also shown are traces for the other three antenna grades. The higher-quality antennas yield shorter TARs for a given success rate, primarily due to their superior multipath suppression.
Note that the loss in received signal power due to the smartphone antenna’s poor gain turns out to be tolerable — the signals arriving from the smartphone-grade antenna can be tracked without cycle slipping. Therefore, the outstanding challenge preventing fast ambiguity resolution for data collected from smartphone-grade antennas is the severe time-correlated multipath errors in the double-differenced carrier phase data.
Decreasing TAR via More Signals. There are ways to mitigate the impact of multipath on the CDGNSS TAR, even the severe multipath experienced by low-quality antennas. It has been shown that the volume of the integer ambiguity search space, and thus TAR, decreases as a function of the number of double-differenced phase time histories available, which, for single-frequency CDGNSS, is one less than the number of satellites tracked. Consequently, an acceptable TAR can always be achieved with enough satellites tracked.
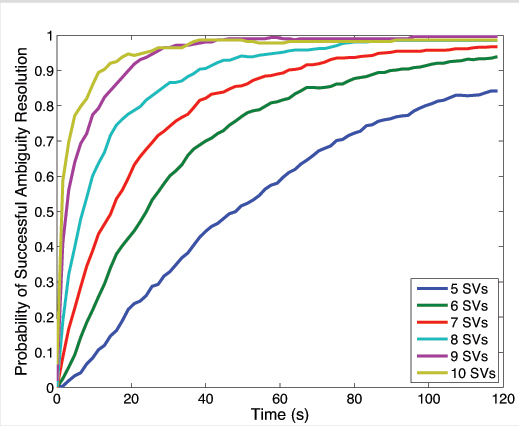
Figure 8 shows the reduction in TAR for an increasing number of satellites. Each trace was computed from 720 non-overlapping 2-minute batches of data taken from a survey-grade antenna over a 24-hour interval. A decreasing elevation mask angle was used to allow an increasing number of SVs to participate in the CDGNSS solution. For a given 2-minute batch of data, an elevation mask was first applied to all but the highest five satellites. Double-difference phase data from these satellites were then processed by the CDGNSS filter to compute an empirical probability of successful integer ambiguity resolution. Next, the elevation mask was reduced until one additional satellite was in view, and the process repeated to produce all traces shown.
Figure 8 makes clear that each additional double-differenced phase time history, although corrupted by its own multipath-induced phase errors, significantly decreases the overall TAR. Note that although Figure 8 was produced from data collected via a survey-grade antenna, a similar trend would apply for the smartphone-grade antenna. One implication of Figure 8 is that smartphone-based CDGNSS would benefit greatly from the additional double-differenced measurements that a multi-frequency GNSS receiver could provide. For example, at the time of writing there are 14 operational GPS satellites broadcasting unencrypted civil signals at the GPS L2 frequency (1227.6 MHz), and 7 broadcasting civil signals at the GPS L5 frequency (1176.45 MHz). With some modification of the smartphone GNSS antenna and chipset, these modernized GPS signals could be exploited to reduce TAR. However, the narrow profit margins on mass-market GNSS antennas and chipsets militate against multi-frequency architectures.
Figure 8. Probability of successful ambiguity resolution vs. time as a function of the number of satellite vehicles (SVs) tracked.
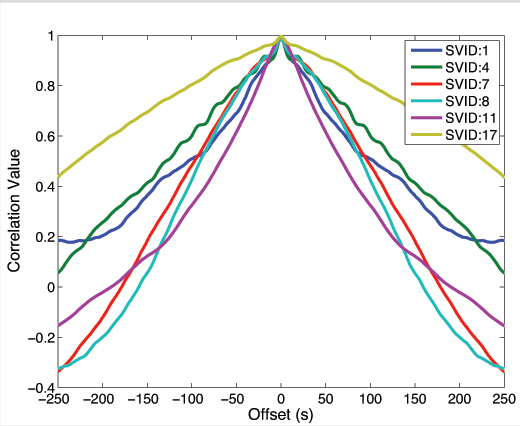
Decreasing TAR via Random Motion. There is a second way to reduce TAR under severe multipath conditions. Unlike TAR reduction via additional signals, the theory and practice of this second technique have not been previously treated in the literature. Moreover, the technique is well-suited for smartphones, which are typically hand-held and mobile. This simple technique consists of gently moving the smartphone in a quasi-random manner within a wavelength-scale volume. The key to this technique’s effectiveness is that, whereas multipath-induced phase measurement errors are typically time-correlated on the order of hundreds of seconds for a static receiving antenna, their spatial correlation is on the order of one wavelength, or approximately 19 centimeters at the GPS L1 frequency. As a result, random wavelength-scale antenna motion transforms the phase residuals from slowly-varying when the antenna is static, as shown in Figure 9, to quickly-varying when the antenna is dynamic, as shown in Figure 10.
Figure 9. Residuals for data captured from smartphone-grade antenna while static.Figure 10. Data from smartphone-grade antenna as it experienced wavelength-scale random motion, 2–5 cm/second.
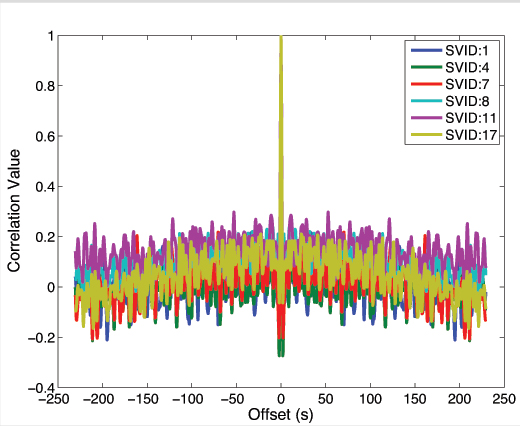
Put another way, autocorrelation time of the phase residuals decreases from hundreds of seconds when the antenna is static, as shown in Figure 11, to less than a second when the antenna is moved even slowly (a few centimeters per second), as shown in Figure 12. More vigorous antenna motion would be possible if the phone’s inertial devices were used to aid the phase tracking loops.
Figure 11. Autocorrelation functions corresponding to the phase residuals in Figure 9.Figure 12. Autocorrelation functions corresponding to phase residuals in Figure 10.
The shorter phase error decorrelation time resulting from random antenna motion effectively increases the information content per unit time that each double-differenced phase measurement provides to the CDGNSS filter, thus decreasing the time to ambiguity resolution.
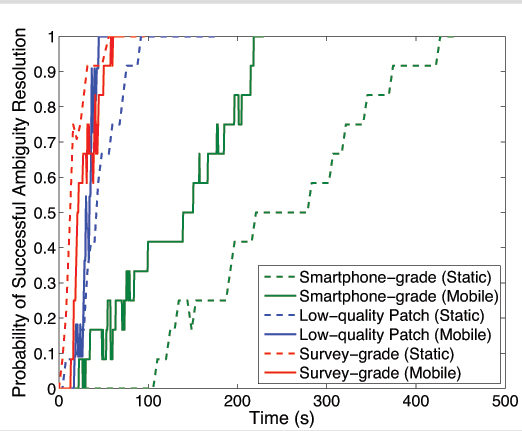
Figure 13 compares empirical success rates for three different antennas under static and dynamic scenarios. As expected, motion reduces the time-to-ambiguity resolution for the smartphone-grade and low-quality patch antenna. But, somewhat counterintuitively, motion increases the TAR for the survey-grade antenna. This discrepancy reflects a tradeoff within the CDGNSS filter. While it is true that the phase measurement errors decorrelate much faster when the antenna is moving — increasing the per-epoch information provided to the filter — it is also the case that the filter can no longer employ a hard motion constraint. For the high-quality antennas, the increased information per epoch due to faster phase error decorrelation is completely counteracted by a loss in information per epoch due to uncertainty (lack of constraint) in the motion model. Also, for the high-quality antennas, multipath in the reference antenna’s phase measurements is not insignificant compared to multipath in the mobile antenna, and this reference multipath exhibits the usual 100–200 second correlation time for a static antenna. On the other hand, phase error decorrelation via random antenna motion offers the lower-quality antennas a larger net information gain because their multipath-induced phase errors are so large. Consequently, for the smartphone-grade antenna, motion substantially reduces the 90 percent success TAR, which drops from 400 to 215 seconds.
Figure 13. Probability of successful ambiguity resolution versus time for three different antennas under static and dynamic scenarios.
Conclusions and Future Work
Centimeter-accurate positioning was demonstrated based on data sampled from a smartphone-quality GNSS antenna. An empirical analysis revealed that the extremely poor multipath suppression of these antennas is the primary impediment to fast resolution of the integer ambiguities that arise in the carrier phase differential processing used to obtain centimeter accuracy. It was shown that, for low-quality smartphone-grade GNSS antennas, wavelength-scale random antenna motion substantially reduces the ambiguity resolution time.
Future work will study the effectiveness of combining antenna motion with a motion trajectory estimate derived from non-GNSS smartphone sensors to further reduce the integer ambiguity resolution time. This technique, which is a type of synthetic aperture processing applied to the double-differenced GNSS phase measurements, effectively points antenna gain enhancements in the direction of the overhead GNSS satellites, thereby suppressing multipath arriving from other directions. Preliminary results show that this technique offers modest benefit beyond the unaided random motion technique discussed herein.
Acknowledgment
The material in this article was first presented at ION GNSS+ 2014 in the paper “Centimeter Positioning with a Smartphone-Quality GNSS Antenna.”
Kenneth M. Pesyna, Jr. is a Ph.D. candidate in the Department of Electrical and Computer Engineering at the University of Texas at Austin. He is a member of the University of Texas Radionavigation Laboratory and the Wireless Networking and Communications Group.
Robert W. Heath, Jr. is a Cullen Trust Endowed Professor in Electrical and Computer Engineering at UT-Austin, and director of the Wireless Networking and Communications Group. He received his Ph.D. in electrical engineeringfrom Stanford.
Todd E. Humphreys is an assistant professor in the department of Aerospace Engineeringand Engineering Mechanics at UT-Austin, and director of the UT Radionavigation Laboratory. He received a Ph.D. in aerospace engineering from Cornell University.
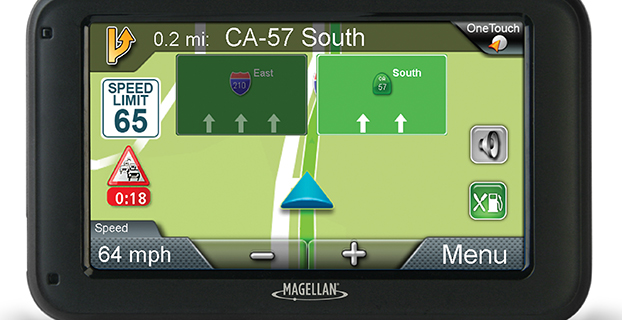
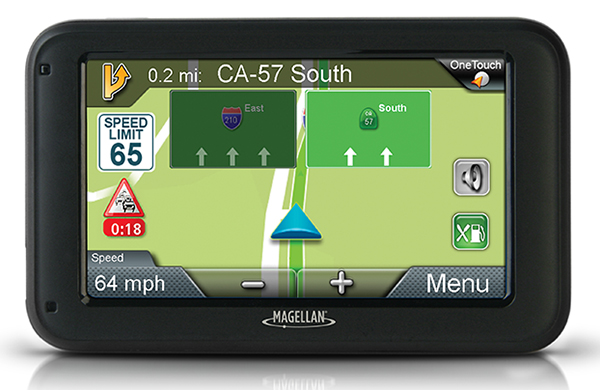
Magellan has introduced its newest lineup of 5-inch RoadMate auto navigators at the International Consumer Electronics Show, being held this week in Las Vegas. To provide a more realistic view of a user’s surroundings, each of the GPS models comes equipped with 3D renderings of buildings and landmarks.
The new models are: RoadMate 5322-LM, RoadMate 5330T-LM with real-time traffic alerts, and RoadMate 5375T-LMB with real-time traffic alerts, Bluetooth connectivity and portrait viewing mode.
The units will be displayed at CES in the Magellan booth, LVCC South Hall 2, MP25441.
“Our new RoadMate 5-inch GPS devices for 2015 have large, vibrant displays and include a vast collection of renowned Magellan navigation features,” said Stig Pedersen, Magellan associate vice president of product management. “Plus, each model includes 3D renderings of buildings and landmarks to make it easier and quicker for users to identify where they are. Whether driving to work, across country, or going to grandma’s, drivers can count on these Magellan navigation units to safely guide them to wherever their destination is.”
Below are a few of the features that the three RoadMate GPS devices share.
3D Renderings – Selected buildings and landmarks are presented in 3D for a more realistic view.
Lifetime Map Updates – Owners of these three models can download the latest map information (up to four times a year) for all 50 states and Canada.
Traffic Camera Alerts – Sends audible and visual warnings of upcoming red lights, speed cameras, and more; provided by PhantomALERT.
7,000 POIs – Includes branded and highway exit POIs to conveniently search for restaurants, hotels, gas stations, and more.
OneTouch Favorites Menu – Creates shortcuts to favorite destinations and searches.
Multi-Destination Routing – Users can plan their entire day or multi-day trip in one route.
Junction View – Realistic images of freeway signs and arrows guide drivers to the correct lane.
SmartDetour – Provides immediate options when traffic suddenly comes to a halt.
RoadMate 5330T-LM
In addition to the features above, the 5330T-LM also includes:
Free Lifetime Traffic Alerts – Helps users avoid traffic jams and delays, suggests detours, provides travel times; no hidden fees or subscriptions.
RoadMate 5375T-LMB
In addition to the features above, the 5375T-LMB also includes:
Free Lifetime Traffic Alerts – Helps users avoid traffic jams and delays, suggests detours, provides travel times; no hidden fees or subscriptions.
Portrait Viewing Option – Provides extended view of the road ahead.
Bluetooth Compatibility – Turns this RoadMate model into a hands-free speakerphone, making drive time safer and more productive.
The Magellan 5-inch RoadMate family of auto navigation devices will be available at retailers throughout the U.S. and Canada as well as online in March 2015. MSRPs are as follows: $149.99 (RM5322-LM); $159.99 (RM5330T-LM); and $199.99 (RM5375T-LMB).
Record-Breaking Year Ahead: Industry Revenues to Reach All-Time High of $223.2B in 2015
Revenues for the consumer electronics (CE) industry are projected to grow three percent in 2015 and to reach an all-time high of $223.2 billion, according to The U.S. Consumer Electronics Sales and Forecasts, the semi-annual industry report released today by the Consumer Electronics Association (CEA). The total revenues forecast was announced by CEA President and CEO Gary Shapiro during his opening remarks today at the 2015 International CES, running January 6-9 in Las Vegas.
CEA’s consensus forecast reflects U.S. factory sales to dealers and covers more than 100 CE products. The twice-annual report serves as a benchmark for the CE industry, charting the size and growth of underlying categories.
Emerging Technologies
The 2015 forecast projects that revenue for new, emerging product categories is expected to double, growing 108 percent year-over-year in 2015. These new technology categories include unmanned systems (unmanned aerial vehicles, unmanned vehicles and home robots); wearables such as health and fitness devices, smartwatches and smart eyewear; IP cameras; 3D printers; 4K Ultra-High Definition televisions; and connected thermostats.
While the emerging product categories represent less than five percent of the entire CE industry revenue forecast, they are expected to contribute almost $11 billion to overall CE revenue in 2015.
“Our forecast underscores that consumers’ love affair with technology shows no signs of slowing any time soon,” said Shapiro. “Consumer technology is all about continued innovation. In the blink of an eye, consumer demand has taken off for emerging categories such as wearables, unmanned aerial vehicles and 4K Ultra HD — categories that were too small to track just three years ago. Expect to see these burgeoning categories, as well as innovations across the full spectrum of consumer technology, on display this week at the 2015 International CES.”
The Wearable Revolution
The wearable device revolution is a key category to watch in the coming years, and especially in 2015. CEA projects overall wearable unit sales will reach 30.9 million units (a 61 percent increase from last year) and generate $5.1 billion in revenue in 2015 (a 133 percent increase). CEA’s wearables category encompasses fitness activity bands and other health and fitness devices, as well as smartwatches and smart eyewear.
Health and fitness devices: Led by the popularity of activity tracking devices, health and fitness devices will lead unit sales among all wearables in 2015 with a projected 20 million units. Revenue is expected to surpass $1.8 billion in 2015.
Other mobile devices:
Smartphones: As the sales leader of the industry, smartphone unit shipments are projected to reach 169.3 million this year, up six percent from 2014. Additionally, smartphone revenues are expected to generate $51.3 billion in 2015, a five percent increase from last year. Particular growth will be seen in screen sizes between 5.3 inches – 6.5 inches.
Tablets: Unit sales of tablets are projected to reach 80.7 million this year, a three percent increase from 2014. Revenues for tablets will reach $24.9 billion this year, down one percent.
“Mobile connected devices have reached an equilibrium, stabilizing the steep climb these products have experienced in recent years,” said Shawn DuBravac, Ph.D., chief economist, CEA and author of CEA’s soon-to-be released book Digital Destiny: How the New Age of Data Will Transform the Way We Work, Live, and Communicate. “Overall, improving economic conditions, consumer enthusiasm for new features and product categories, competitive manufacturer pricing and several other dynamics now at play should make 2015 an especially significant year for tech.”
Other CE categories expected to enjoy positive growth in 2015 include audio, electronic gaming and laptops. Automotive electronics will see continued growth due to new vehicle sales in 2015, reaching $14 billion in revenue, a 3.3 percent increase.
The U.S. Consumer Electronics Sales and Forecast 2010-2015 (January 2015) is published twice a year, in January and July, reporting U.S. factory sales-to-dealers. It was designed and formulated by CEA to be a comprehensive source of sales data, forecasts, consumer research and historical trends for the consumer electronics industry.
Wi2Wi Corporation is releasing the W2SG0021i, a miniature GNSS module based on the CSR SiRFStarV chip.
The W2SG0021i is a high-sensitivity, low-power stand-alone receiver designed for portable applications. It can concurrently track multiple satellite constellations (GPS, GLONASS, BDS, SBAS, and is Galileo-ready) and has ultra-fast time-to-first-fix, a small form factor, and high receive sensitivity for a broad spectrum of OEM products, including machine-to-machine (M2M) and consumer wearables.
The module provides precision commercial-grade GNSS location identification over -40C to +85C. Measuring 7 x 7 millimeters, the W2SG0021i addresses the need for a cost-effective and high-performance GNSS module for major markets worldwide, the company said.
M2M and wearable markets require GNSS modules with high position accuracy, low power, and very small form factor, said Wi2Wi CTO and vice president of engineering Tony Fardanesh. Wi2Wi pushes these limits in its GNSS, Wi-Fi, and Bluetooth solutions, he said.
Precision location features and the small form factor of W2SG0021i enable Wi2Wi to penetrate into the GNSS market globally. Wi2Wi continues to invest in the research and development of high-precision connectivity solutions, timing devices and frequency controllers to the global customer base, said CEO Hans Black.
The W2SG0021i samples and development kit will be available in Q1 2015.
Wi2Wi designs, manufactures and markets miniaturized embedded wireless connectivity solutions (incorporating both hardware and software), high-precision timing devices, and frequency controllers for premium industrial/medical, avionics, home automation and government markets.
u-blox has provided global positioning technology to Cohda Wireless‘ vehicle-to-vehicle (V2V) and vehicle-to-infrastructure (V2I) equipment, collectively called V2X. V2X will be a key technology for the next generation of advanced driver assistance systems (ADAS) as well as autonomous vehicles, the companies said.
Cohda’s DSRC (dedicated short-range communications) based V2X system uses accurate satellite positioning with embedded dead-reckoning technology provided by u-blox. The system enables early warning of imminent collisions, oncoming traffic, the presence of road workers and unsafe speed based on vehicles in the vicinity.
“Cohda’s V2X DSRC-based solutions make full use of u-blox’ advanced automotive-grade positioning technology to enhance driver safety through ample warning time and excellent non-line-of-sight performance. Such technology will soon be a standard feature embedded in all vehicles,” said Michael Ammann, VP platform partnerships at u‑blox.
“Our V2X vehicle warning systems are dependent on highly accurate position and velocity data to deliver the performance that is crucial to meet the safety demands of next generation cars,” said Fabien Cure, Chief Engineer at Cohda Wireless. “u-blox’ satellite positioning solutions, leading automotive dead reckoning technology, module roadmap and clear strategy to deliver lane accurate performance in challenging urban environments was convincing.”
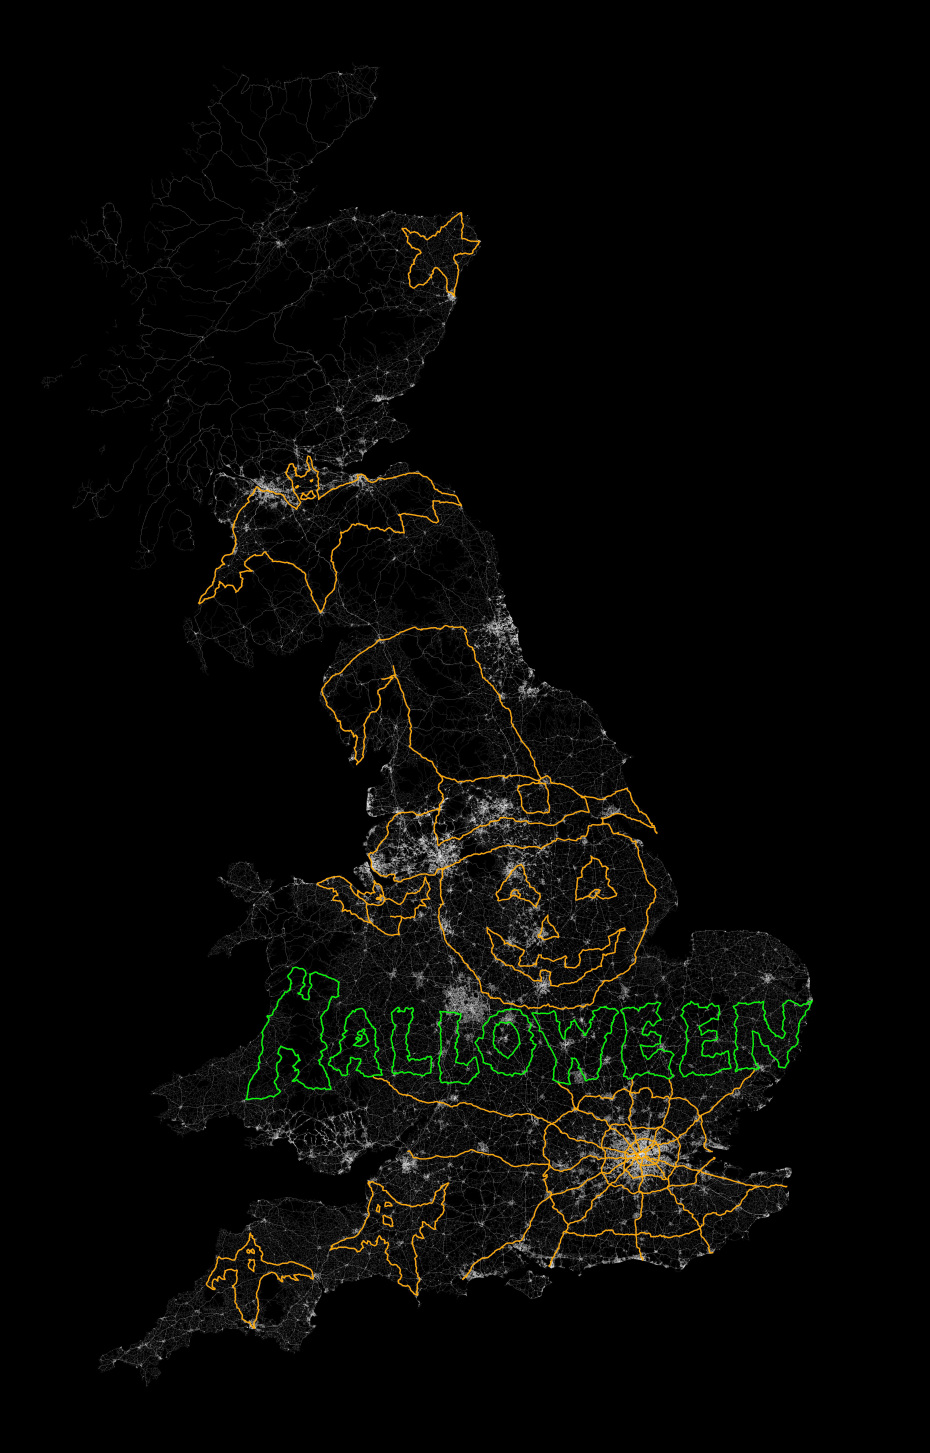
In October, Jeremy Wood drove all over the United Kingdom to create a Halloween message, reports Metro. Wood drove a 10,000-mile, painstakingly-plotted route through England, Wales and Scotland in a Vauxhall Corsa, plotting a 264,000 positions on the car’s GPS. Wood linked the positions on a virtual drawing to create a picture that shows bats, ghosts, a spider web, and a pumpkin in a witch’s hat, with the word “Halloween” underneath. The result is the image below.
Photo: VB
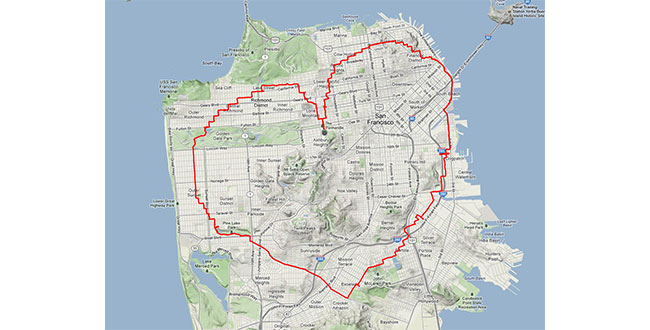
Wood isn’t the first GPS-inclined artist. In 2013, a man in San Francisco equipped with an iPhone and tracking app rode his bike 27 miles around the city. Two and a half hours later, Payam Rajabi had etched a heart shape onto a city map.
Photo: VB
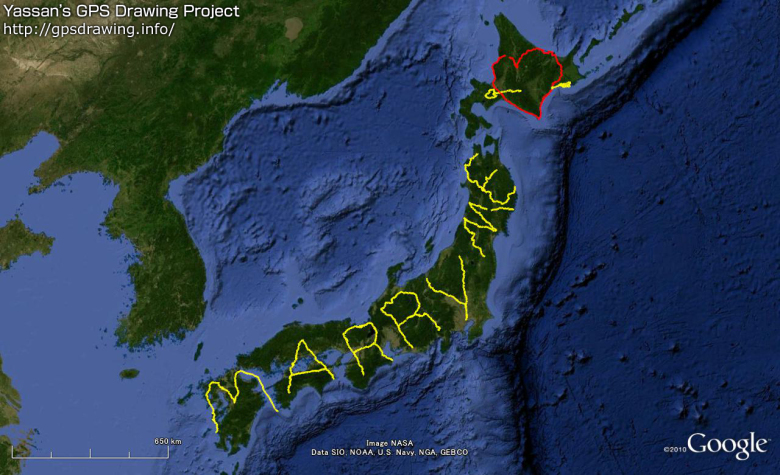
But the biggest devotee of GPS art could be Japanense artist Yassan, who in 2010 left behind his girlfriend for six months to travel across Japan, reports VB News. Carrying a GPS device, Yassan covered 7,163.7 km mostly by walking, but with some use of a car, ferry, and bicycle. He then used Google Maps to connect the GPS points he visited, resulting in this unique marriage proposal:
Photo: VB
Though he made the journey four years ago, his trek is now being featured in a new ad campaign and documentary by Hi-Tec, a company that makes hiking shoes and boots.
Yassan has been creating large-scale GPS drawings for years. Yassan was so inspired by the possibilities of GPS art that he quit his job in June 2008 to pursue his passion for making GPS drawings. Learn more about Yassan’s GPS Drawing Project on his website.