SPH Engineering has updated its UgCS software with a lidar toolset for UAVs. The toolset is designed to unlock the full potential of lidar sensors, making remote sensing more effective without human errors. Key features include precision calibration, flight patterns for route planning, anti-shake turns, and constant line spacing and buffer.
The UgCS lidar toolset allows users to optimize time and cost-effectiveness at all stages of data collection and processing. Time is saved on mission planning with flight patterns and turns designed for lidar surveys. During flight, users can acquire high-quality laser data with preset inertial measurement unit (IMU) initialization patterns and anti-shake lidar turns. During post-flight data analysis, the high accuracy of acquired data ensures users can get the desired results with one trip to the field and quality data analysis.
“We have received various requests from lidar producers and end-users to improve the accuracy of laser data collected with a UAV,” said Alexei Yankelevich, head of software development at SPH Engineering. “We have invested in UgCS R&D to focus mainly on automated IMU calibration commands, automatic calculation of required line spacing and overlap, and prevention of sensor shaking. Trial flights over SPH Engineering’s in-house test range have confirmed UgCS lidar toolset capacity to support main lidar market players.”
Common application areas include power-line inspections, road inspections, construction, mining, archaeology and forestry.
Earlier this year, we looked back at 2020 and reviewed how surveying has dealt with the worldwide pandemic while adapting to the new tools and technology being created. We discovered the need for surveyors did not diminish during this crisis, and in many places the demand has gone up significantly. Instruments, computers and measuring methods continue to increase in capability and complexity to help with the shortage of qualified field crews, yet we still need to expand our efforts to find the next generation of surveyors.
How do we find those future geospatial experts, data collectors and surveying professionals? The answer is right under our noses, and our current group of practitioners needs to get the word out.
What is the word, you ask?
Technology.
Younger generations understand technology better than most practicing surveyors. New devices, methods and operations are being invented at a fast pace, and our best and brightest should be considering using that technology in a rewarding career. Before we make the big pitch to them, however, we should refresh our understanding of recent surveying history to better understand why technology is a good thing.
How did we get here? A short historical look at measuring
The measurement methods, devices and instruments used by surveyors have radically changed in the past 50 years, and we have covered their evolution in past columns (Survey SceneMay 2016, May 2017 and Sept. 2019).
Instruments and devices used by surveyors vary in their function and output of information. Some are used to physically measure the distance from a stationary point to another, determine horizontal and vertical angles at a specific location, or determine grade differentials between various points. Other instruments are used to determine horizontal or vertical positions to establish locations and elevations. All these instruments are being used to gather positional data on any number of items, but the quality of the information may vary depending on the technology and method used. How?
Devices and methods for measuring distances
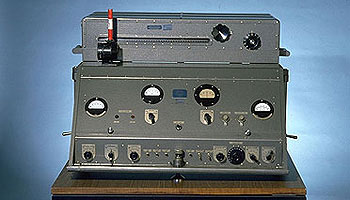
AGA Geodimeter NASM-2A. (Photo: NOAA)
Tools for measuring distances have been around for centuries. The Egyptians are famous for their “rope stretchers,” while early surveyors in Europe and the New Colonies were known to use the Gunter’s chain and a measuring wheel. In the early 1800s, steel tapes were invented to replace the chain. These measuring tapes continued to evolve well into the 20th century with varying metals, fiberglass and nylon-coated plastics.
In the mid-20th century, scientists and physicists began to experiment using light waves as a means of measuring terrestrial distances. These experiments led to the development of the first electronic distance meter (EDM), commercially produced by the Swedish company Svenska Aktiebolaget Gasaccumulator (AGA) in the early 1950s. Other methods of electronic measurement, including microwave and infrared wave technology, were also developed in the years following the introduction of the lightwave EDM.
For many years, the EDM was used independently from transits or theodolites to measure long distances. For those who needed to consistently measure long distances, the invention of the EDM was not just a time saver, but also provided much higher accuracy than manual measurements.
Other technologies were developed in the latter part of the 20th century, introducing the surveyor to laser scanning, but we can defer this topic until later in this column.
Devices for measuring angles
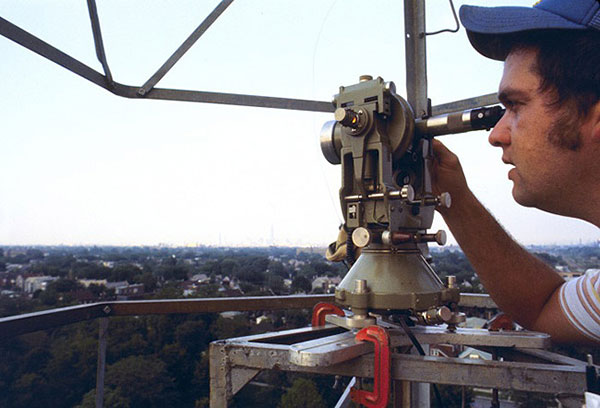
The T3 theodolite was introduced in 1925. With its 10.5-inch telescope, this theodolite had a range of up to 60 miles. It saw heavy use between 1952 and 1984. (Photo: NOAA)
The surveyor, like the astronomer, has consistently been at the forefront of developing optical instruments. The key has been combining high optical quality with a means of measuring horizontal and vertical angles within the instrument. The creation of the theodolite and the transit revolutionized the ability of the surveyor to accurately measure angles and apply trigonometric functions to determine mathematical computations. In addition, the surveyor’s compass was also developed to assist with angle measurement — with less accuracy but greater flexibility.
By the 1920s, optical theodolite technology was rapidly improving through the work of Switzerland’s Heinrich Wild. Beginning with the T2 and T3, these instruments provided accuracy and precision not previously available to the surveyor. Other manufacturers followed suit with similar instruments for the next several decades and were used in conjunction with the EDM for larger surveys. Anticipation grew with the competition to see which instrument company could marry the theodolite and the EDM into one easy-to-use, yet accurate, optical instrument.
Introducing the total station
By the late 1960s, technology had firmly entered the surveying world with a few electronic advancements. In 1968, Zeiss — a German company known for its lenses and optical systems — produced the first known tachymeter, combining a theodolite with an electronic distance meter. The tachymeter became better known as the total station, as it was capable of measuring angles and distances in one instrument. While somewhat crude and hard to use, the Elta 14 total station introduced the world to a future generation of surveying instruments that would revolutionize the field.
In the course of a few years, several manufacturers developed their own total stations. The biggest hurdle was combining the optics of the scope with the measuring axis of the EDM. By the end of the 1970s, most total stations were coaxial, therefore measuring angles and distances was done with one sighting.
Robotics were introduced in the early 1990s, with two servo motors to drive the horizontal and vertical movements of the total station. These movements were controlled remotely by the tracking system connected to the prism pole and data collector. Not requiring a human being to remain stationary and manually operate the total station provided cost savings and additional efficiency for the field crew.
Positions, everyone! Positions!
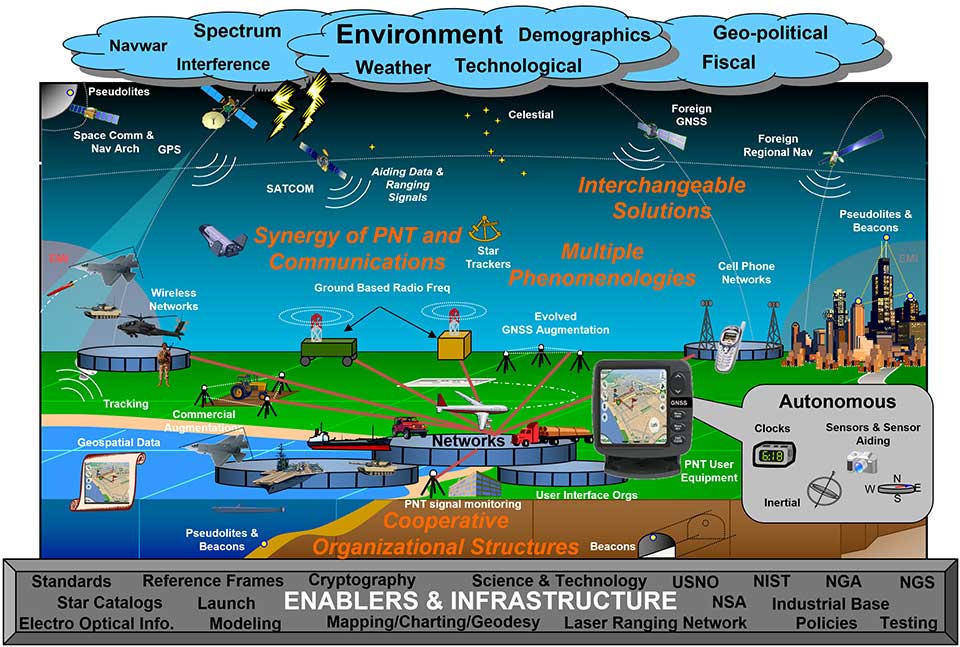
U.S. National PNT Architecture. (Graphic: U.S. Department of Transportation)
Positional measurement has revolutionized not just the surveying profession, but a large portion of everyday tasks as well. From monitoring travel times for your commute to providing your food-delivery driver with your location, position determination is the key element to these services. Satellite navigation is now the primary technology used for positioning, navigation and timing (PNT) and a big part of most aspects of surveying.
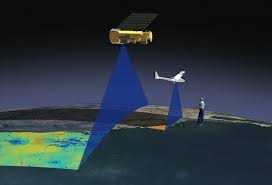
Remote sensing
Here is where we can discuss laser scanning and other remote sensing technologies. Remote sensing is the science and technology of gathering data from a distance. Traditionally this has been mostly done from aircraft, satellites and vessels. However, technology has expanded so that most practitioners now consider the use of laser scanning, lidar, photogrammetry, hyperspectral cameras, bathymetric sonar and simultaneous localization and mapping (SLAM) to be included in the category. Keep in mind that all these technologies are types of measurements; they are not the vehicle or instruments used for the measurement.
Image: NASA
These various sensor types can collect millions of data points in a short amount of time. While surveyors are adapting to working with point clouds and gigabytes/terabytes of data, it is a radical departure from our recent past using only total stations and GNSS receivers. Significant advancements in computer processing, data storage and programming have simplified the manipulation of point clouds, but they remain a challenging task for even newer surveyors to tackle.
Autonomous vehicles
Hobbyists have been building (and crashing) model airplanes and helicopters for many years. Most of the public does not realize that the big advancement in remote-control aircraft was the introduction of GNSS technology into the flight system. Sure, we all have GNSS receivers in our phones, but now to be included in our toys? This somewhat simple addition has turned unmanned aerial vehicles (UAV) into a revolutionary tool for several occupations, not just surveyors. More control and stability of the UAV means expanded uses for emergency personnel, utility providers, parcel delivery and much more. Being able to program a specific flight provides the UAV user with higher accuracy and precision, but it takes away the element of human control.
Image: Department of Transportation
Another vehicle gaining market share is the unmanned surface vessel (USV), used for performing hydrographic surveys. Like its UAV cousin, the USV is autonomous and is programmed to follow a specific route for greater accuracy and precision. Because of the shallow draft of a USV, it can be used in many areas deemed inaccessible by manned vessels.
An additional aspect of newer technology working with autonomous vehicles is collision avoidance systems. These systems have been implemented on newer UAVs and continue to improve, allowing their the use in tighter confines and spaces. By having a radar-based avoidance signal surrounding the entire UAV, collisions become less likely.
Geofencing is another advancement being implemented into more UAVs to help keep them from intruding into unauthorized spaces, by programming into their computer specific geographic areas that are off limits. UAVs are often also programmed to return to its takeoff location under certain circumstances.
Other technological advances to consider
Image: State Department
How much technology do you have in your home and office? Probably more than you realize. While one may immediately think about a smart speaker or home automation system (Alexa, Echo, Nest, etc.), other components offer simple yet productive solutions.
Remote control systems enable you to check whether your doors are locked and your garage door is shut. If not, a touch of a button does the job. Motion sensors enable you to detect intruders around and inside the house, of course. Environmental sensors now monitor for water leaks, moisture and gas/carbon monoxide and provide alerts. How about home automation that utilizes robotic technology? The Roomba vacuum, automatic pool cleaners, and even window washing systems activated when dirt is recognized on your exterior windows are just some of the robotic devices in the modern home.
Precision agriculture utilizes autonomous vehicle control to increase the precision of planting, spraying and harvesting crops. This increase in efficiency has led to higher yields and lower operating costs for the equipment. Another market starting to see more interest is the robotic lawn mowers that functions like the Roomba vacuum. While significantly more expensive than manual mowers, they offer features that can be considered for trade-offs for your time. Depending on your location and needs, they can be set on timers to run day or night and return to base when their battery runs low.
Adapting today’s technology to tomorrow’s surveying tasks
Another relevant technology that does not fit into any of the topics above is the inertial measurement unit (IMU). These sensors are now routinely paired with GNSS receivers in UAVs to help them compensate for pitch and roll. Because of their small form factor, IMUs will increasingly be incorporated into other measurement devices.
It is also safe to say that more handheld devices and smartphones will include lidar scanning capability, as the iPhone 12 Pro and iPad Pro already do. Application and software developers are writing code to make use of data from these devices, so plan on other hardware makers following Apple’s lead.
Voice and motion control will continue to be integrated into data collectors and workstations. By minimizing physical entries into an input system, computers will begin to recognize patterns and automate procedures to increase efficiencies. Programmable voice commands during field data collection will activate various procedures (for instance, specific roadway cross sections or curb island locations) and walk the user through a predetermined set of steps. The possibilities are endless, but we should prepare to take advantage of the technology.
Enticing future generations into a geospatial career
Image: Digital.gov
A geospatial career is so much more than just being a surveyor. Our profession needs bright minds who see the world differently. What does that mean?
Most surveying and mapping tasks used to produce 2D deliverables on paper. Today’s geospatial technicians fly UAVs, use point clouds, draft existing conditions in 3D, and analyze data for future applications. By applying what they are learning with new devices, technologies and software platforms, our younger generations can help the surveying and geospatial profession evolve into a data-rich environment that helps facilitate change for our planet. These efforts can help with climate change, provide better data for our communities, and bring societies back together.
Our profession is much more than gathering data; it is helping to make our world a better place through better data analysis and knowledge. Who would not want that?
By Ethan Sorrelgreen Chief Product Officer, Carmera
Ethan Sorrelgreen, Carmera
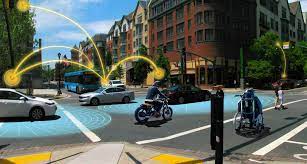
Since the early days of autonomous vehicles (AVs), maps — specifically, so-called “high-definition” maps — have played a critical role in their technology stack. Central to perception, localization and path planning, these highly detailed, highly precise maps provide vehicles a baseline understanding of the world around them, delivering key priors that form the basis of the AV’s navigational decision making.
These maps come with exacting standards: a 3D network graph, spatial accuracy within 10 centimeters, attribute support in the thousands, and so on. Additionally, with AV deployments becoming more frequent — covering broader, more complex driving domains — these requirements are growing ever more demanding.
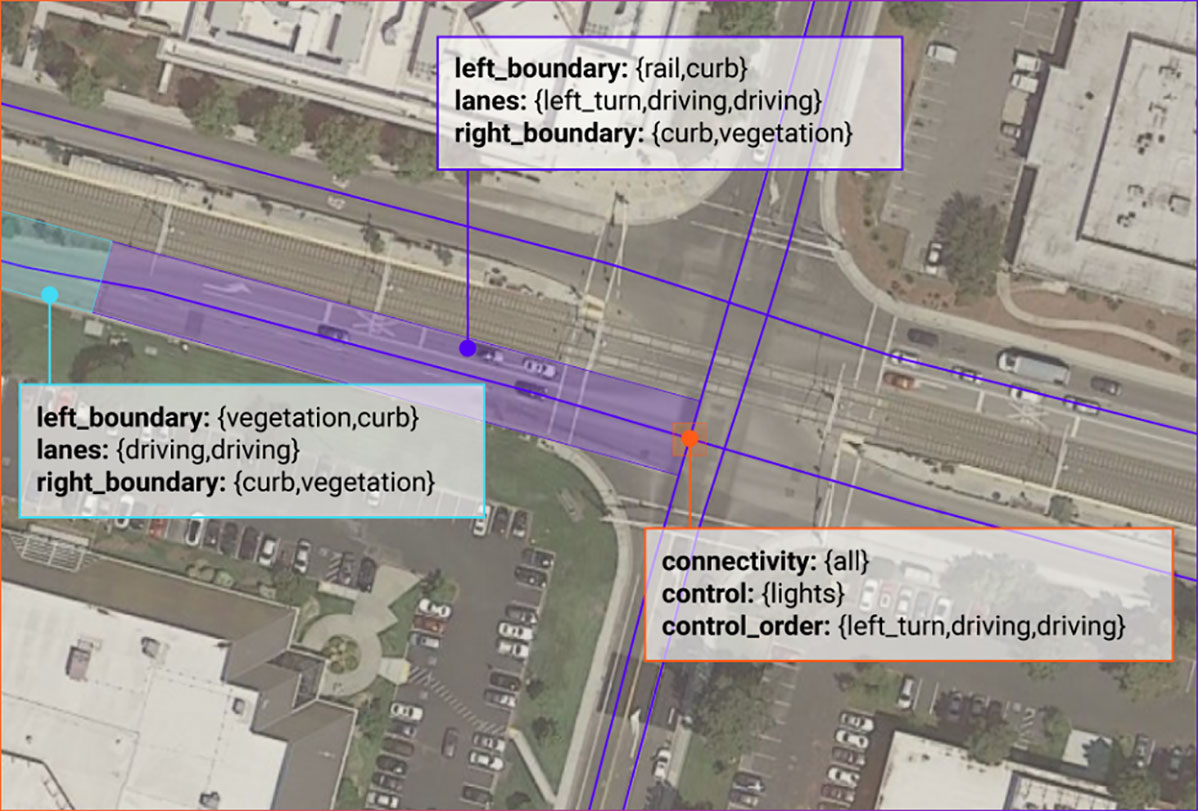
Of particular import is the increased need for temporal accuracy — that is, a map’s ability to represent current conditions (as opposed to conditions at some point in time). Roads — especially urban roads — are highly dynamic environments. Things like construction, repaving, signal upgrades and, now, on-street dining constantly affect the flow of traffic.
For example, in a summer 2020 survey of New York, Carmera found 88 drive-lane-impacting events (out of a total of 251 road events) over 72 hours in midtown Manhattan alone.
A map’s failure to reflect such events and changes can have a major impact on an AV’s reliability (Will the autonomous-driving feature remain engaged?), motion-planning (Will the AV safely and smoothly navigate through/around the obstacle?) and/or path planning (Will the AV choose the most efficient route despite the obstacle?). Maintaining a map, however, is exponentially more complicated than creating it. Not only does the data need to be good, it also needs to be fast and cheap to produce.
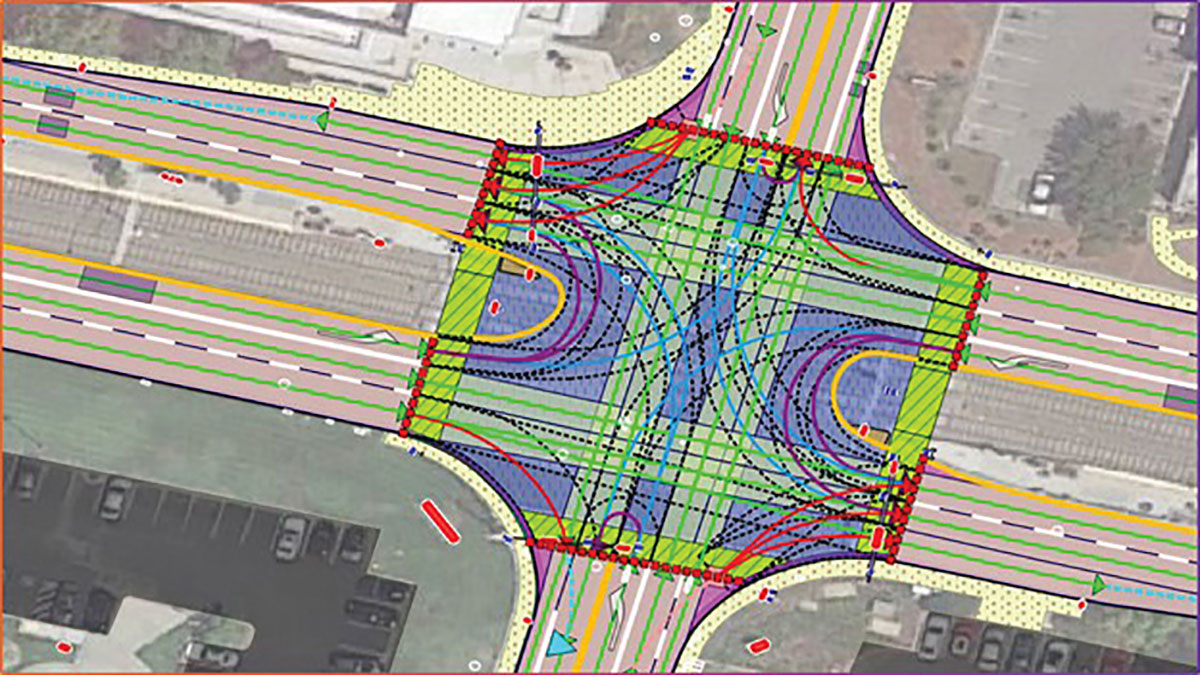
The key to solving the fast and cheap legs of this classic “good-fast-cheap” trilemma is simplifying the initial problem, using what Carmera calls a medium-definition map. If an HD map is a map with high feature detail and high spatial accuracy, then an MD map is a map with high feature detail but a slightly lower spatial accuracy. It essentially atomizes the dense, complex HD world into discrete, manageable blocks, or “zones.”
An MD map of a California intersection showing road features — including control attributes — placed with zonal accuracy. (Image: Carmera)
These zones — each a logical section of the road network — become the new unit of fidelity. The MD map catalogs all the features in a zone — a traffic light with a left arrow that controls the left two lanes, a bike path, a solid median, etc. — but not their precise location in the real world.
This simplified map provides the ideal basis for a system of triaging change, which dramatically lowers the cost — in both time and money — of HD map updates. Indeed, it provides the foundation for Carmera’s change-as-a-service offering — a modular, on-demand feed of road events and map updates that plug into existing consumer or HD maps.
Because of its lower spatial accuracy, an MD map can be updated with consumer-grade tools — a camera and a consumer-grade GNSS, let’s say — coupled with basic consumer vision algorithms. Contrast that to an HD map, which requires either expensive equipment, like a lidar rig, or — in Carmera’s case — sophisticated algorithms that can convert visual and telemetric data into HD road graphs.
MD map maintenance, therefore, is relatively cheap, which is good news for those who want to use MD data for next-generation consumer applications, such as natural-language navigation, or to support sub-L4 levels of automated driving (both excellent MD use cases).
An MD map of the same interaction, showing road features—including control attributes—placed with zonal accuracy. (Image: Carmera)
For HD updates, an additional pass is needed. Think of this as a tip-and-cue system: When a functional change in the map is detected (the tip), data from the identified zone is reprocessed using more complex algorithms to create the new HD vectors (the cue). In some cases — either because of customer requirements or because the change is superficial — a simple MD update may be sufficient. Thus, expensive computing resources are only deployed when needed.
This approach is equally effective for those using traditional lidar-based methods. There, the MD tip allows for targeted dispatching of lidar rigs, which results in significant cost-savings vis-à-vis the typical practice of sequential resurveying.
As technology evolves, so too will the role of the MD map.
Carmera sees a world where an AV’s onboard sensors will become so sophisticated that the HD maps’ utility may diminish. MD maps, however, will still provide vehicles key rules-of-the road relationships, helping optimize route planning and similar beyond-line-of-sight decision making. Employing this new standard now, therefore, not only makes driving safer today, it paves the way for the road ahead.
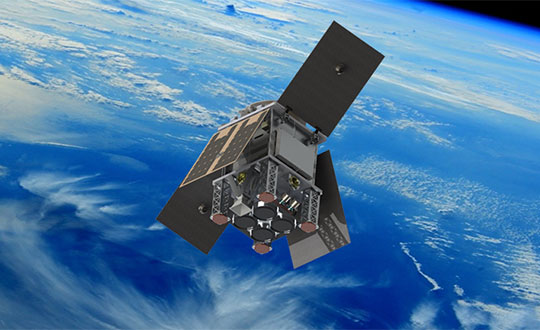
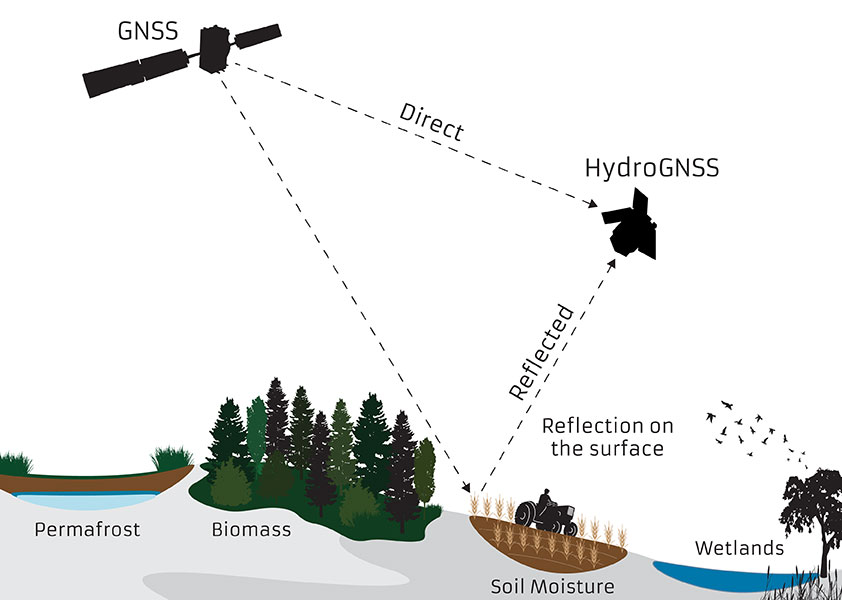
The small satellite will measure climate variables using GNSS Reflectometry
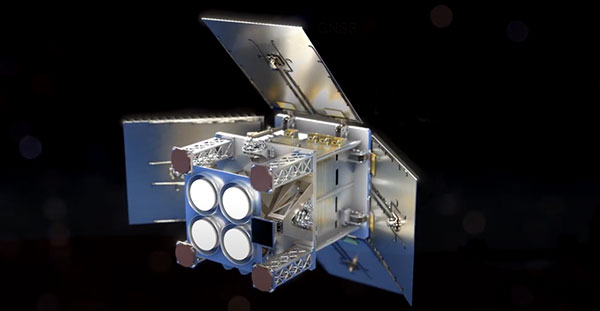
The European Space Agency (ESA) has selected HydroGNSS from Surrey Satellite Technology Ltd. (SSTL) for its second Scout Earth Observation small satellite mission. HydroGNSS is a 40-kg satellite that will be built and operated by SSTL.
ESA selected the first ESA Scout satellite, ESP-MACCS, in December 2020. ESP-MACCS focuses on understanding and quantifying processes in the upper atmosphere over the tropics — processes that play an important role in the overall evolution of the atmosphere.
HydroGNSS will take measurements of key hydrological climate variables, including soil moisture, freeze thaw state over permafrost, inundation and wetlands, and aboveground biomass, using GNSS reflectometry. It will complement missions such as ESA’s SMOS and Biomass, Copernicus Sentinel-1 and NASA’s SMAP.
Both small satellites are expected to be the first in a series of ESA Scout missions demonstrating how small satellites on a budget of less than €30 million and a three-year schedule can play an important role in Earth observation, and be scaled up for future missions.
Knowledge of these variables helps scientists understand climate change and contributes towards weather modelling, ecology mapping, agricultural planning and flood preparedness.
“SSTL pioneered GNSS reflectometry, providing the payloads on TechDemoSat-1 and the NASA CYGNSS mission for measuring ocean wind speeds, and I am delighted that we will now launch the first satellite mission specifically addressing hydrological measurements using this innovative technique,” said Phil Brownnett, SSTL managing director.
Previously, addressing hydrological variables such as these has required sizable and higher cost satellites with large aperture antennas, but GNSS reflectometry uses existing signals from GNSS as radar signal sources. These signals are reflected off the land, ice and ocean and can be collected by a low power receiver on a small satellite in low Earth orbit, and used to yield important geophysical measurements.
Image: SSTL
SSTL is working closely with partners to tackle the scientific and technological challenges involved. Partners include Sapienza, Tor Vergata and IFAC-CNR in Italy; FMI in Finland; IEC/IEEC in Spain; and NOC and the University of Nottingham in the United Kingdom (UK),
“The decision to implement HydroGNSS after ESP-MACCS demonstrates that the Earth observation community is very interested in the concept of Scout missions. We are confident that this interest will further flourish when we see the first data in 2024,” said Toni Tolker-Nielsen, ESA’s acting director of Earth Observation Programmes.
As well as the already established GNSS-Reflectometry measurements, new techniques will be explored on HydroGNSS, including use of Galileo signals, dual polarization, dual frequency and recovery of coherently reflected components. These new measurements are expected to improve the separation, resolution and quality of the climate variables under observation.
The HydroGNSS mission exemplifies the UK’s innovation in climate change research, according to SSTL. The 26th United Nations Climate Change Conference takes place in the UK Nov. 1-12.
Image: SSTL
“The UK is leading the way in using space to tackle climate change, with Earth Observation satellites providing some of the most important data to monitor our environment as we build back greener,” said Science Minister Amanda Solloway. “Using a UK satellite just the size of a microwave oven, this pioneering mission will build on the UK’s expertise in space research by measuring changes in the Earth’s water, providing crucial information to address climate change, improve farming and support wider disaster management.”
HydroGNSS paves the way for an affordable future constellation that can offer measurements with a temporal-spatial resolution not accessible to traditional remote-sensing satellites, thus offering new capacity to monitor very dynamic phenomena and helping to fill the gaps in our monitoring of the Earth’s vital signs for the future.
Atlantic — a remote sensing, surveying and consulting business — has purchased a Phase One Industrial 280MP large-format aerial solution to better serve its clients. The upgrade substantially increases Atlantic’s ability to efficiently capture a large area with extreme accuracy and quality.
Photo: Phase One Industrial
The massive Phase One Industrial 280MP aerial solution is a large-format camera system that easily integrates with smaller gyro-stabilized mounts creating a compact d lightweight system for use in a wide range of aircraft.
At its heart, the iXM-RS 280F is a dual-lens metric camera, with 90mm lenses for capturing RGB information, adding a near infrared (NIR) camera generates a four-band configuration, useful in agriculture, forestry and pipeline monitoring missions.
The iXM-RS280F camera has an image coverage width of more than 20,000 pixels whilst the cameras’ backside illuminated CMOS sensor supports very high dynamic range at 83dB. Its high light sensitivity provides superb image quality in challenging low light conditions, enabling operators to take advantage of more flight hours per day and more flight days per year.
“We’ve been using Phase One’s camera technology for over two years combined with our Optech lidar systems,” said Brian Mayfield, president and CEO of Atlantic. “We are very impressed with the technology and applaud Phase One’s innovative approach to designing a high-quality large format camera that produces exceptional results. The Phase One 280MP is yet another forward-looking technology resource that we’ve added to provide the most complete and cost-effective geospatial solutions for our clients.”
On June 26, the U.S. National Oceanic and Atmospheric Administration (NOAA) released the summary of the results of Commercial Weather Data Pilot (CWDP) Round 2. View the summary here.
In Round 2, NOAA evaluated GNSS radio occultation data from two U.S. commercial space companies: GeoOptics and Spire. NOAA concludes that, based on the results of CWDP Round 2, the commercial sector is able to provide radio occultation data that can support NOAA’s operational products and services.
“As a result, NOAA is proceeding with plans to acquire commercial RO data for operational use,” the summary states.
According to GeoOptics, the report highlights the unique qualities of its commercial GNSS-RO data and its ability to improve weather and space weather forecasts around the world.
“As today’s report demonstrates, commercial satellite data will enable NOAA to make significant improvements in forecasting worldwide within the consistent budget limitations under which it operates,” said GeoOptics CEO Conrad Lautenbacher.
NOAA anticipates release of a request for proposals soon for operational purchase of commercial radio occultation data, continuing an acquisition process that began in April with NOAA’s release of a draft Statement of Work.
NOAA has requested $15 million in FY 2021 to support Commercial Data Purchase. The FY 2021 Budget also requests $8 million for CWDP to investigate new commercial technologies beyond radio occultation.
By moving into this next phase of engagement with U.S. industry, NOAA is leveraging commercial space sector capabilities to support its operational products and services and to continue to improve its weather forecasting capabilities. NOAA plans to implement additional rounds of the CWDP to evaluate commercial capabilities beyond radio occultation data for potential operational use.
World View, the stratospheric exploration company, has reached an important milestone representing a key step toward persistent and navigational stratospheric flight.
After achieving the goal of more than 30 days aloft with full navigational control, the Stratollite completed its 32-day mission over the weekend, showcasing its enhanced long-duration flight capability.
Before this mission, the longest Stratollite flight was 16 days, achieved in June 2019. This mission moves World View closer to scaled commercial operations, making the unique data and information sets it can provide available to commercial and government Earth-observation and remote-sensing customers around the world.
Notable accomplishments from the mission:
Executed four continuous days of station-keeping (mission objective) with an average distance of 20 km from the first predetermined target location, followed by an intentional navigation to the second station-keeping target location 1,230 km away.
Achieved 2.5 days of continuous station keeping at the second station-keeping target with an average of 40 km from the second target location.
Averaged an altitude of 19.5 km during both station-keeping exercises.
Traveled more than 11,200 km during the mission, covering Arizona, Utah, Nevada, Colorado, New Mexico, Texas, Oklahoma, Nebraska, Iowa and Kansas.
Demonstrated complete navigational control during the mission from World View’s remote Mission Control in Tucson, Arizona.
The total mission duration was 32 days, 5 hours and 14 minutes
Executed more than 1,000 trajectory-control maneuvers over the entire mission.
“This is another encouraging milestone for the team and our customers that confirms we are on the right track,” said Ryan Hartman, World View president and CEO. “It sets the stage for a challenging set of missions ahead of us as we continue to push the envelope and demonstrate the ability of the Stratollite to meet customer requirements.”
World View’s flight operations team landed the Stratollite at a predetermined landing zone in Iowa on Saturday, Sept. 28, to conclude the mission. The system landed on command, was recovered, and will be refurbished for reuse on future missions.
World View will continue to increase the cadence of its Stratollite flight operations. The company plans to launch multiple missions focused on demonstrating optical imaging and synthetic aperture radar sensing systems with further enhancement of station-keeping and navigational performance.
About the Stratollite. World View’s Stratollite is a long-endurance stratospheric flight vehicle capable of station-keeping over areas of interest for remote sensing and communications.
The craft can travel 95,000 feet above the Earth. World View is already routinely flying payloads to the edge of space for a wide variety of government, commercial, and education customers.
World View’s proprietary altitude-control technology allows it to harness stratospheric winds to steer the Stratollite to and from desired locations and loiter above them for long durations.
Stratollites can carry a wide variety of commercial payloads (sensors, telescopes, communications arrays, etc.), launch rapidly on demand, and safely return payloads back to Earth after mission completion.
Among its wide variety of uses, the Stratollite will help researchers greatly advance knowledge of planet Earth, improve our ability to identify and track severe weather, and assist first responders during natural disasters.
The multi-signal positioning symposium will be convened by Marcelo Santos of Canada, and co-conveners will include Australi’s Allison Kealy, Greece’s Vasilis Gikas, Australia’s Jinling Wang and Poland’s Pawel Wielgosz.
The symposium will key in on positioning applications. It will focus on theoretical and practical advancements, as well as innovative applications and architectures for multi-signal positioning, remote sensing and applications. It will also address issues and opportunities coming from multi-constellation signals.
Organizers will accept submissions that address navigation, timing and guidance systems for autonomous vehicles, intelligent transport systems, personal mobility, and other safety and liability critical applications. Abstracts must be submitted via the online submission system by Feb. 18.
Drones and robots complement traditional platforms, delivering insights in unique use cases.
Guest column by Mike Fuller
Geographic surveys have changed in the last 150 years. What started with early film cameras strapped to hot air balloons, kites and homing pigeons has advanced — both in terms of sensors and the platforms on which they’re deployed. These innovations — which include drones and robots — are changing the way we can collect data, enabling us to gather greater detail and providing richer insights about the world around us.
These nascent platforms are set to explode in popularity. The global market for remote sensing platforms will more than double in the next four years. It’s projected to reach more than $21 billion by 2022, driven in large part by use of drones, according to an October 2017 report from MarketsandMarkets.
Despite the anticipated growth in drone and robot usage, they will not replace traditional remote sensing platforms such as airplanes, satellites and vehicles. The new technologies bring with them some limitations with regard to the number, size and weight of sensors they can carry, capture rates, area covered and and line-of-site restrictions.
As a result, drones and robots will offer new capabilities that complement the traditional platforms and provide greater geographic detail, as well as the ability to be quickly deployed and constantly monitor areas where humans cannot routinely go.
How far we’ve come
To understand how far geographic information system (GIS) mapping and remote sensing technology has come, it’s important to consider how it started. Inventors in the 1800s relied on early film cameras and somewhat unreliable, imprecise airborne platforms — such as hot air balloons, pigeons and kites — to conduct land surveys and do surveillance.
The introduction of a new kind of “bird” — the airplane — opened up new opportunities in the 1900s, supporting the use of more accurate aerial photography for reconnaissance and mapping.
Satellite technology launched remote sensing into space in the 1970s, supporting the collection of detailed multispectral data that led to improved understanding of minerals, soils, urban growth, agriculture and other geographic features.
Even though the technology has become more sophisticated, GIS professionals still leverage data from many of these historical platforms:
Manned aircraft – planes and helicopters
Satellites – high-resolution satellites and cubesats
Terrestrial – survey vehicles and handheld devices
But — much like the impact of airplanes and satellites — we’re on the precipice of another significant milestone for remote sensing. Marked by use of burgeoning drone and robotic technology, this new technology will complement traditional platforms and deliver more insights than ever before possible.
Rise of drones and robots
Drones and robots are the newest remote sensing platforms catching the eye of the GIS community. Not only are they cool and cutting-edge, they open up a new class of use cases that were previously not possible with traditional aerial survey methods. They offer new opportunities to monitor remote areas, and their form factors and cost enables a higher frequency of data collection compared to aerial survey.
Because of their unique features, users are envisioning how these platforms can be implemented for remote sensing in many fields, such as energy, oil and gas, aviation, forestry, transportation, emergency management, and natural resource preservation and restoration.
When the frequency of data from these platforms is coupled with analytics and cloud infrastructure, it is possible to acquire, analyze and act in ways that were not possible before.
Keep in mind, though, that each technology comes with trade-offs. Users should assess their goals, and weigh these factors, to determine if drones or robots will deliver the results they wish to achieve. Let’s take a closer look:
Drones
Drones are capable of delivering ultra-high-resolution data, with ground sample distances (GSD) of 1 cm and accuracy of under 5 cm. However, accuracy is highly variable; it can vary based on the drone model, terrain and software used to process the collected data.
The form factor of many drones also limits the ability to do multi-sensor flights. A drone typically can cover no more than a few square miles per day with a visible or multispectral camera, compared to manned aircraft that span hundred of thousands of acres a day carrying hyperspectral, lidar and orthophotography devices simultaneously.
Because they can be deployed quickly, and on a daily basis, drones offer a cost-effective, practical approach for covering small areas compared to other aerial survey methods. But drone usage currently faces a significant impediment.
Current regulations require operators to maintain sight of the devices during all flights. These line-of-site restrictions limit the distance a drone can go on each flight, and require operators to change locations multiple times for a single survey. As a result, frequent revisits can be labor intensive.
Battery life also plays a role in the usability of drones. Most commercial drones can fly for only about 45 minutes, despite continued improvements in battery technology. Combined with the line-of-site restrictions, battery life impacts the amount of territory drones can cover. Most can handle only a few square or linear miles during each flight, making helicopters or airplanes better suited for projects that span hundred of miles or more.
Despite some of the drawbacks, drones are proving ideal in many use cases — from damage assessment and power restoration after hurricanes to data collection for hydraulic modeling, stream restoration design and aquatic habitat assessment.
For example, drones equipped with bathymetric and terrestrial laser scanning sensors are ideal for supporting riverine mapping applications. In these cases, drones offer an effective alternative when the waterway cannot be accessed, or it is too dangerous to use ground- or water-based survey methods for collecting channel geometry.
Robots
Robotic platforms are flexible, enabling users to attach a variety of sensors, including thermal cameras, lidar and sniffers for natural gas or other hazardous material. They are rarely hampered by payload restrictions, like drones.
And, with programming, robots can return to their chargers when their batteries dip below a certain threshold.
Like drones, there are many potential applications for terrestrial remote sensing robots. One use is for precision agriculture to test soil, water and plant health.
Many utilities are expressing serious interest, too, for robots. These robots can include onboard spectral, thermal and lidar sensors, precision navigation and hazard cameras to perform fine-scale spatial mapping and can acquire a wide array of data from electrical substations.
In this scenario, the robotic platform could detect physical and spectral changes, identify objects, monitor corrosion, detect liquid and gas leaks, and conduct thermal monitoring. Using this model, utilities could track substation environments remotely, saving time associated with physical inspections and enabling earlier detection of potential problems.
Systemwide approach required
Traditional remote sensing platforms — airplanes, satellites and vehicles — will continue to play an important role in GIS mapping. Drones and robots give us new tools that will have a dramatic impact on the amount of detailed geographic information collected.
For these new platforms to be used effectively as complements to traditional platforms, the industry must adopt a systems approach that takes into consideration a number of factors:
The end application
The sensors and acquisition protocol that will collect data at the precision required by the end application
The actionable analytics that need to be extracted from the data
How the data and insights integrate with the business processes used for decision making.
By taking this approach, those who work in a variety of fields can gather the insights they need to do their jobs more effectively and efficiently, while leveraging the unique strengths offered by these emerging platforms.
Remote sensing of atmospheric gas concentrations is important in monitoring global greenhouse gas levels and industry monitoring. Monitoring is usually carried out via satellite sensing or laborious ground-based measurements.
With aerial measurement, a wider area can be measured efficiently, and repeat measurements taken of days, weeks and months gathering time-series data.
Custom drone with gas sensor (circled).
This spring, a study by QuestUAV and the British Geological Survey (BGS) used a custom QuestUAV Q200 airframe equipped with two sensors, one tuned for methane (CH4) and one for CO2. The sensors use an open-path gas mass spectrometer — a fiber-guided laser beam passed laterally across open atmosphere on top of the drone to a reflector and then back to the sensor itself.
Signals from the sensors were fed into a multi-core processing unit on board the drone. All readings were stamped with time and location provided by the standard GPS and flight units in the Q200.
The completed drone was commissioned in March. Over several months, trial flights were run over gas releases initiated manually on the ground over the test site. The recorded sensor data was processed immediately on return to base, and the data passed to BGS for analysis and appraisal.
The team plans to fine-tune the operational workflow and maintenance tasks for regular missions.
Pennsylvania State University assistant professor of geography Anthony Robinson discusses the university’s online geospatial program at the 2017 Esri User Conference, which took place July 10-14 in San Diego, California. The university added a graduate certificate in remote sensing and earth observation to its offerings.
GNSS-R Data collections. The measured reflection tracks are shown in yellow over the Globe. A sequence of Delay Doppler Maps from one track is shown below — the spread of each is related to the sea surface roughness and surface wind speed.
New weather datasets, which could prove highly valuable for weather forecasting and for longer term climate monitoring, have just been made available from the Space GNSS Receiver-Remote Sensing Instrument (SGR-ReSI) instrument on board TechDemoSat-1, a small technology demonstration satellite launched by Surrey Satellite Technology Ltd (SSTL) in 2014.
With support from the European Space Agency, SSTL and the National Oceanography Centre (NOC) are continuing to work on the data received from TechDemoSat-1 and have been steadily improving the calibration of the measurements and researching new techniques and applications.
New data, including delay Doppler maps and wind speed analysis over oceans, has been released on the MERRYBS website (Measurement of Earth Reflected Radio-navigation Signals By Satellite).
Looking to the future, the NASA CYGNSS mission due to launch later this year will fly eight satellites carrying SSTL’s SGR-ReSI instrument to measure the winds within cyclones, hurricanes and typhoons.
The SGR-ReSI instrument was developed by SSTL and is able to calculate TechDemoSat-1’s position and speed in much the same way as does a car-based SatNav, by measuring ranges and triangulating its position from high-altitude GNSS satellites orbiting 20,000 km above the satellite itself. The SGR-ReSI also carries a high-gain nadir (downward-pointing) antenna to utilize GNSS reflectometry, a technique where the GNSS signals scattered off the Earth’s surface are collected and measured.
A calm ocean will give a clean reflection, while a rough, wind-driven ocean will spread the signal out. SSTL’s partner, the National Oceanography Centre in Southampton, has developed an algorithm that calculates from the signals the ocean roughness and in turn estimates the wind speed at the surface of the ocean.
To validate the algorithm, NOC has compared the wind speed measurements from the SGR-ReSI against radar measurements from EUMETSAT’s MetOp satellite. These wind speed measurements are valuable for weather forecasting, and could also prove to be of significant benefit to the scientific community for climate monitoring.
The GNSS reflections off ice are much stronger than reflections off the ocean, and it has been possible to demonstrate from the results a new method for measuring the changing location of ice edges over time, and the potential for a new method of measuring ice height and thickness.
GPS reflections are not only collected by the SGR-ReSI over the ocean, but over land, where measurements to date show strong variations that could contain valuable geophysical information about the land surface. For instance, healthy vegetation will absorb more of the signal while damp soil can cause stronger reflections. Soil moisture is considered an essential parameter for climate monitoring, and is not currently measured with sufficient coverage over the globe.
TechDemoSat-1 was in part funded by Innovate UK and is jointly operated by SSTL in Guildford and by the Satellite Applications Catapult in Harwell.
SSTL received funding to support the development of the SGR-ReSI and ground processing from the UK CEOI, SEEDA, Innovate UK and the European Space Agency.
The below videos show processing and application of the SGR-ReSI data.
Video 1: This video shows in about 20 times real-time speed the motion of the TechDemoSat-1 satellite over an orbit, indicated by a white cross on the world map. The specular reflections targeted by the SGR-ReSI are shown by yellow spots, and the measurement tracks are shown in yellow.
The four Delay Doppler Map channels from measurement tracks are shown in yellow. The four Delay Doppler Map channels from the SGR-ReSI are shown at the top right.
The spreading horseshoe shape is caused by reflections being received away from the specular point, and a rougher ocean causes more spreading. When reflections are received from over land and over ice, there is much less spreading.
The red band on the map indicates the collection of “raw” unprocessed data, which takes a few minutes to transfer before the processed Delay Doppler Maps resume.
Video 2: This video shows reflections over the Northwest Passage, with and without ice.