Tag: remote sensing

  • Seeing the unseen: How AI-powered geospatial tech is transforming utility safety

    Seeing the unseen: How AI-powered geospatial tech is transforming utility safety

    Every six minutes, somewhere in the United States, an underground utility line is damaged by careless excavation. Such incidents not only disrupt electrical, gas, and other services but also create serious environmental hazards. For example, a broken gas line could trigger an explosion that puts people and property at risk. Utilities and local distribution companies (LDCs) are embracing geospatial analytics and artificial intelligence (AI) to prevent or limit damage to buried cables and pipelines.

    The Common Ground Alliance (CGA) estimates that in 2019, excavation damage cost U.S. utilities $30 billion, including the cost of lost service, emergency response, and repairs. The Pipeline and Hazardous Materials Safety Administration (PHMSA) estimates that pipeline excavation incidents continue to rise, averaging 1.45 per day in 2024.

    Despite local regulations and 811 lines to “call before you dig,” excavation breaches continue to grow due to a lack of visibility and up-to-date information about underground lines. Utilities can’t give contractors and excavation crews accurate information about buried assets that are invisible from the surface.

    Satellite imaging and spectral sensing technology provide utilities with the means to monitor rights-of-way, identify excavation threats, and troubleshoot problems such as gas and water leaks. AI-powered geospatial analytics are the modern canary in the coal mine for hazardous leaks and service disruptions.

    Keeping Track of Buried Service Assets

    Keeping track of underground assets is an ongoing challenge for pipeline operators, utilities, and LDCs. The traditional method of tracking buried assets is periodic field observations. Right-of-way inspections and 811 locate ticket programs are typically initiated before third-party excavations, but these manual methods leave a dangerous visibility gap.

    Inspections are needed every 30 to 90 days, which is costly since they require rolling trucks with human inspectors. Manual inspections can also provide only limited coverage, particularly in remote and hard-to-access areas. Even with regularly scheduled inspections, encroachments may go undetected for weeks or months. The result is a vulnerability window between inspections.

    The CGA reports that failure to notify 811 and inaccurate location information are among the top contributors to excavation incidents. Even when appropriate dig notices are filed, construction grading or trenching often begins before infrastructure owners can respond to dig requests.

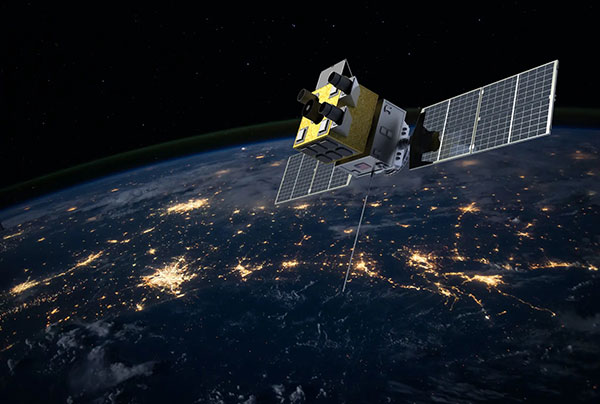
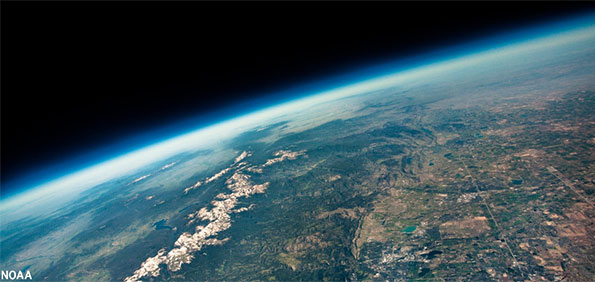
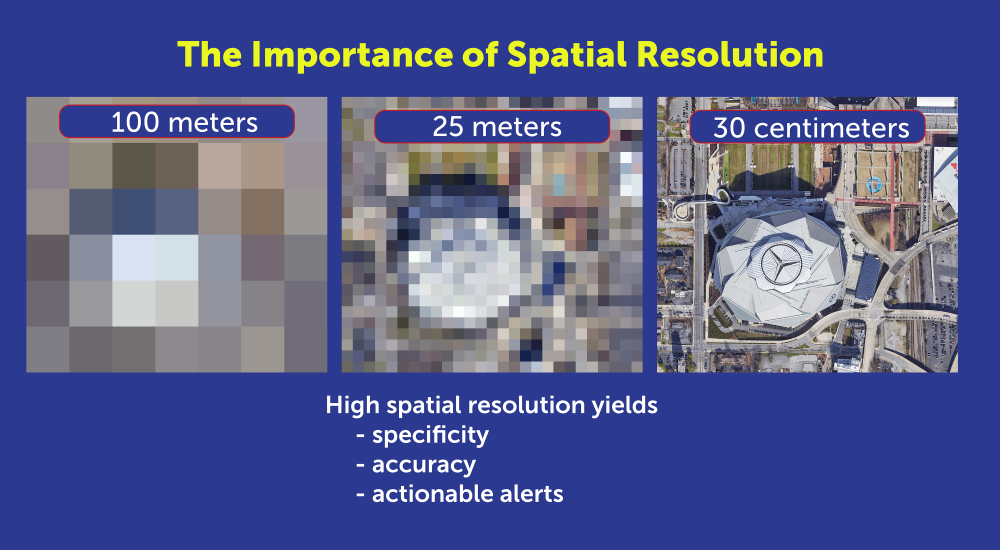
    Advances in remote sensing, AI, and GIS now enable utilities to monitor rights-of-way from 270 miles up. Using satellite imaging and AI algorithms, utilities can continuously monitor pipeline and cable corridors and help close the visibility gap. Commercial satellite images from providers such as Airbus and Vantor (formerly known as Maxar) can provide high-resolution imagery for cloud-based AI processing that can detect changes as small as 30 centimeters, about the size of a dinner plate. Using satellite imaging is also faster and more cost-effective than using drones or aircraft, because cloud computing resources can analyze images in hours, rather than days or weeks.

    High-resolution imagery is necessary for specific, accurate alerts. (Photo: Satelytics)
    High-resolution imagery is necessary for specific, accurate alerts. (Photo: Satelytics)

    To power geospatial analytics, remote sensing technology (RST) captures multispectral and hyperspectral data from high-resolution satellite sensors, then uses AI-powered algorithms to analyze spectral signatures. Spectral imaging can detect a wide range of surface activity, including soil disturbances, vegetation changes, soil grading and trenching, new construction starts, heavy equipment use, new access roads, and encroachment on utility easements; activities that could indicate a risk to buried cables and pipelines.

    Integrating Geospatial AI with ArcGIS

    To make potential problems easier to identify, high-resolution images and geospatial analyses can be fused with GIS asset layers and corridor models to pinpoint anomalies that could indicate excavations or construction that interfere with utility rights-of-way.

    Utilities that already use ArcGIS as their system of record can readily integrate results from geospatial analytics into existing workflows. For example, users can visualize and detect disturbed layers using ArcGIS Pro, tracking surface risk trends and KPIs with ArcGIS dashboards.

    Monitoring the utility corridor for unwanted structures. (Image: Satelytics)
    Monitoring the utility corridor for unwanted structures. (Image: Satelytics)

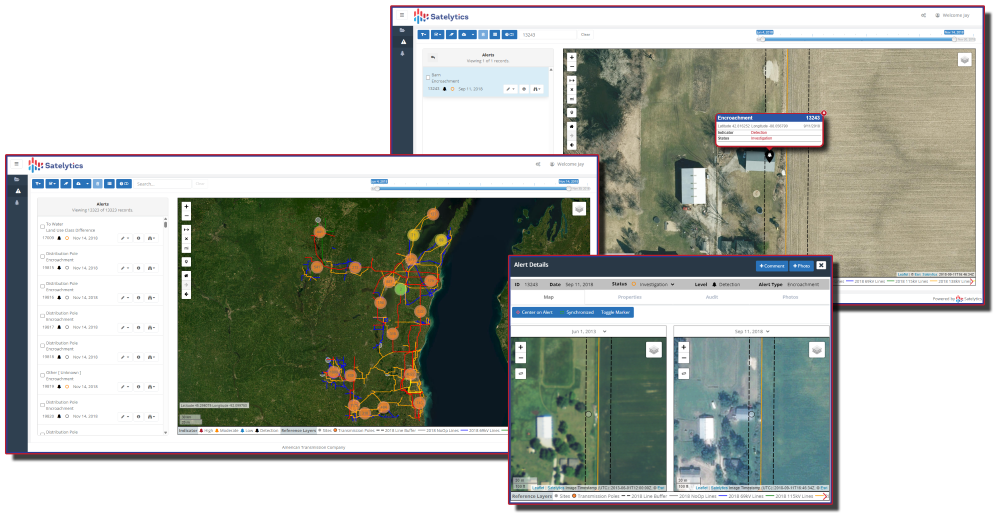
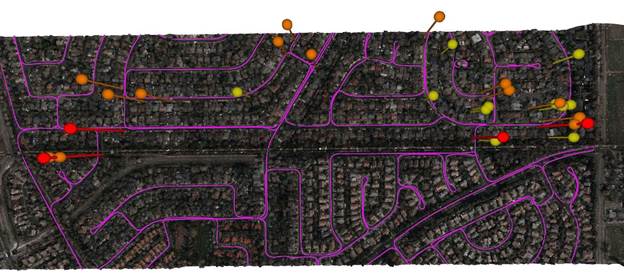
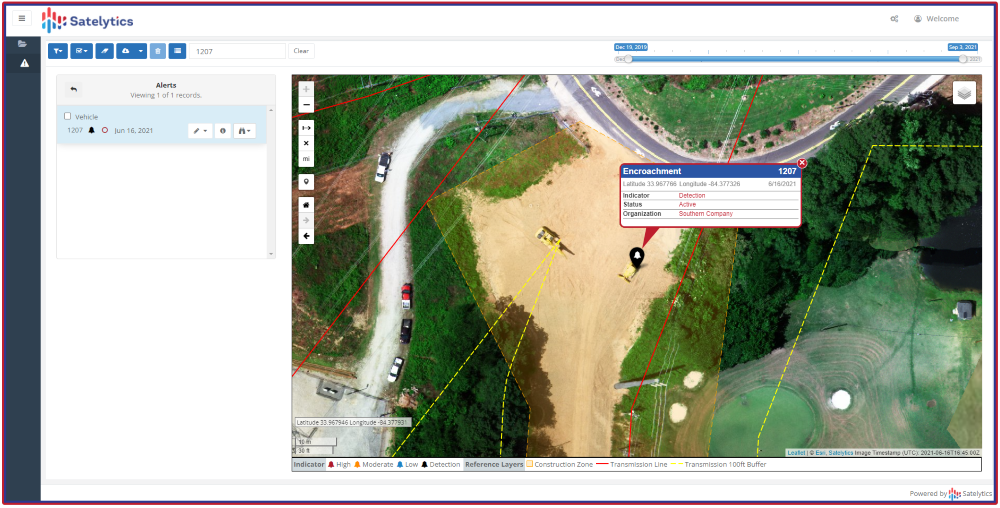
    To show how this works, Southern Company, which owns Georgia Power, Alabama Power and Mississippi Power, needed to identify new construction along its service corridors to detect potential encroachments before construction. Southern Company established a quarterly monitoring schedule with Satelytics, a provider of cloud-based geospatial analytics software.

    Using data from the Pleiades 1A and 1B satellites, Satelytics captured multispectral imagery at 50-centimeter resolution, then used AI-poweredanalytics to detect changes, such as new barns, parking lots, or other construction. Encroachment alerts were delivered through the Satelytics web portal, and the geospatial data was transferred directly to Southern Company’s ArcGIS system via application programming interfaces (APIs).

    Southern Company then compared items flagged in the satellite images with field visits to fine-tune the AI models. Following the pilot program, the AI models were refined to flag only those encroachments that posed a danger or a problem.

    Flagging encroachment risks from space. (Image:: Satelytics)
    Flagging encroachment risks from space. (Image:: Satelytics)

    AI-powered geospatial analytics strengthens Enhanced Positive Response (EPR) by documenting risk locations, including map layers and images, and providing evidence of corridor conflicts and surface changes. While AI accelerates detection, ground truthing remains essential. As shown in our Southern Company example, on-site validation is required to improve machine learning algorithms to increase accuracy. Integrating Field Maps and Survey 123 into AI workflows can verify findings and prioritize responses.

    Using AI and GIS for Predictive Dig Safety

    Geospatial AI technology is becoming an essential tool for more than just excavation monitoring. Using AI to analyze satellite images offers other benefits, such as measuring gas leaks or tracking water and oil leaks. Combining AI, GIS, and historical data will soon be used for predictive excavation risk management, identifying high-risk areas in advance of filing an excavation permit.

    Predictive analytics will continue to play a larger role in excavation monitoring. AI analytics will provide construction forecasts and enable permit intelligence layers in GIS. The same data can power dynamic risk scoring dashboards and support three-dimensional corridor safety twins.

    As new building construction continues to boom, utilities are harnessing the latest technology to prevent excavation incidents and protect underground assets. Combining satellite imagery, AI, and GIS provides the advanced tools needed to maintain continuous asset awareness, closing the visibility gap for underground cables and pipelines. Pipeline operators, electric utilities, and LDCs are reducing operating costs and minimizing environmental impact by leveraging geospatial analytics powered by artificial intelligence.

    Sean Donegan is CEO of Satelytics, a company that uses cloud-based, geospatial analytics to analyze multispectral and hyperspectral imagery to identify pipeline leaks and other environmental issues. Donegan has over 30 years of experience building technology and software companies.

  • Seen & Heard: Tracking pythons and wild camels

    Seen & Heard: Tracking pythons and wild camels

    “Seen & Heard” is a monthly feature of GPS World magazine, traveling the world to capture interesting and unusual news stories involving the GNSS/PNT industry.


    Image: Apple
    Image: Apple

    Apple Products Meet Accuracy with GPS

    Apple launched the Ultra Watch, which contains a dual-frequency GPS antenna that can receive L5 signals, as well as the iPhone 14, which features a dual-band GPS receiver combining the L1 and L5 signals. The company is also harnessing signals from more than 70 satellites to boost the accuracy of its services such as SOS alerts and alerting emergency responders, per The National News. The dual-frequency abilities of the new products provide accurate location for calculating distance, pace and routes. The L5 signals also are a critical component of Apple’s health and safety features, providing more accuracy than in previous products.


    Image: dwi septiyana/iStock/Getty Images Plus/Getty Images
    Image: dwi septiyana/iStock/Getty Images Plus/Getty Images

    Collar Accidently Tracks Python

    Wildlife researchers in Key Largo, Florida, accidently discovered a way to locate and eradicate invasive Burmese pythons, per WFLA News Channel 8. The team of researchers were observing racoons and possums that were fitted with tracking collars to note their behavior. After months of observation, a possum collar sent a mortality signal due to lack of movement. To the researchers’ surprise, the collar then started moving again. They later discovered the possum had been eaten by a python. While this was not the intent of the team’s research, they proved this could be an effective way to lower the increasing population of the invasive python species.


    Image: Pavliha/ iStock/Getty Images Plus/Getty Images
    Image: Pavliha/ iStock/Getty Images Plus/Getty Images

    Remote-Sensing Finds Wild Camels

    Scientist Liu Shaochuang and his team have used satellite remote-sensing technology to study and track wild camels. Shaochuang studies the interrelationship between endangered animals and their environments, which may help protect the species against climate change. To track a camel, Shaochuang attaches a GNSS-enabled collar, which transmits the camel’s location every day. The short message function is provided by China’s BeiDou satellite system, which transmits and receives signals in real time. Based on the data, Shaochuang and his team can observe migratory paths, living environments and possible threats.


    Image: Screenshot of CNN video
    Image: Screenshot of CNN video

    Former South Carolina Attorney Convicted with Location Data

    On March 3, Alex Murdaugh was convicted of killing his son Paul Murdaugh and wife Maggie Murdaugh. With limited evidence, the prosecution used a phone video and vehicle navigation data to prove Alex’s guilt. During the trial, Alex claimed he was visiting his mother during the time the murders took place. However, General Motors OnStar data accessed by investigators from his Chevrolet Suburban contradicted the alibi, putting Alex at the scene of the crime during the time of the murders. Plus, in a smartphone video taken by Paul that night, Alex’s voice could be heard, placing him at the scene.

  • Inertial Labs releases laser for remote-sensing apps

    Inertial Labs releases laser for remote-sensing apps

    (Image: Inertial Labs)
    (Image: Inertial Labs)

    Inertial Labs has released a remote sensing payload instrument. The Resepi Hesai XT32 laser is designed for accurate remote-sensing applications. The Resepi laser can be used with commercially available lidar scanners, including Velodyne, Quanergy, Ouster, RIEGL, LIVOX and Hesai, as well as with UAVs.

    Resepi is completely modular, so users have full control for customization. The remote sensing device uses a GPS-aided inertial navigation system with NovAtel RTK/PPK single- or dual-antenna GNSS receiver, integrated with a Linux-based processing platform. It also comes with a 2 TB USB memory drive and has an embedded Wi-Fi cellular modem.

    Resepi has 3-5 cm point-cloud accuracy and can reach heights of more than 200 m above ground level. It is compatible with most UAV models; however, it is typically used with DJI M300, DJI M210 or DJI M600 models.

    The device is suitable for scanning and mapping, precision agriculture with lidar, simultaneous localization and mapping (SLAM) algorithm development, utility inspection and construction site monitoring. Resepi-supported software includes Hexagon NovAtel, PCPainter and PCMaster.

  • Precision Agriculture: GNSS Is Now Standard on Most Tractors

    Precision Agriculture: GNSS Is Now Standard on Most Tractors

    (Photo: CHC Navigation)
    (Image: CHC Navigation)

    The earliest article about GPS and agriculture that I found in my collection of this magazine(*) is from the July/August 1992 issue: “Using GPS in Agricultural Remote Sensing,” by Eileen M. Perry of the Remote Sensing Research Laboratory of the USDA Agricultural Research Service. Thirty years later, you cannot buy a tractor from a major manufacturer that does not come equipped with a GNSS-based guidance system, and precision agriculture routinely makes use of remote sensing data and geographic information systems (GIS). The data are collected by Earth observation satellites, manned aircraft, UAVs and sensors on farm machinery. The GIS are used to collect, manage and analyze these data and create maps for the variable-rate machines to follow when seeding, irrigating, spraying fertilizer, herbicide and pesticides, and harvesting.

    In this cover story, managers at Trimble, Tallysman Wireless, and ComNav Technology give their perspective on precision agriculture. Additionally, Gavin Schrock explains recently introduced options for tiered precise point positioning (PPP) services, using Trimble’s CenterPoint RTX as an example.

    Proponents of precision agriculture and equipment vendors have always claimed that it reduces inputs (water, seeds, fertilizer and pesticide) and environmental impacts while increasing yields and profits. However, I have never been able to find any independent, reliable and comprehensive study of precision agriculture’s return on investment. If you are aware of any, please let me know, at [email protected].

    — Matteo Luccio, Editor-in-Chief

    Check out these perspectives on precision agriculture:

    Trimble

    Tallysman Wireless

    Comnav Technology


    * I have the entire collection of GPS World’s print edition, except for the first issue, the 10 issues in the second year (1991), and the September through December 1993 issues. I would be thrilled to receive those missing issues, or facsimiles, from anybody who has them.

  • NV5 Geospatial uses remote sensing for utility distribution management

    NV5 Geospatial uses remote sensing for utility distribution management

    NV5 Geospatial's distribution network data shows pole usage. (Image: Nv5 Geospatial)
    NV5 Geospatial’s distribution network data shows pole usage. (Image: Nv5 Geospatial)

    Asset and vegetation management applications help utilities minimize risk and improve the reliability of electric distribution networks

    Geospatial data firm NV5 Geospatial is applying remote-sensing data analysis to improve the way utilities manage their distribution networks. The company mapped more than 5.5 million miles of utility distribution networks in the United States using a combination of lidar and orthoimagery sensors on mobile and airborne platforms to acquire data for both asset and vegetation management.

    Analysis of this geospatial data enables electric utilities to minimize risk and maximize reliability, while increasing efficiency.

    “An aging grid, workforce shortages, increasing energy demands and an uptick in major weather events are combining to create a perfect storm that could impact reliability, customer service and safety for electric utilities across the country,” said Eric Merten, vice president, Commercial Group at NV5 Geospatial. “A boots-on-the-ground approach to management cannot keep up with demands related to aging equipment, compliance, pole loading and vegetation encroaching on infrastructure.

    “NV5 Geospatial’s innovative remote-sensing applications and data analysis tools give utilities the power to proactively address problems in their distribution network before they impact operations or customers,” Merten said.

    A distribution network (purple) and vegetation risks (red/yellow pins). (Image: NV5 Geospatial)
    A distribution network (purple) and vegetation risks (red/yellow pins). (Image: NV5 Geospatial)

    Built on the success of its remote-sensing applications for utility transmission networks, NV5 Geospatial’s distribution management solutions offer end-to-end capabilities — from acquiring accurate, high-quality geospatial data to data analysis and visualization using custom viewers and enterprise geospatial information systems (GIS) — and can be customized to meet the use cases and budgets of utility companies.

    Using NV5 Geospatial’s tools, distribution network asset managers can achieve compliance with National Electrical Safety Code (NESC) clearance guidelines, and get clear visibility into joint use of poles to prevent pirating.

    The NV5 Geospatial remote-sensing data also can help quantify vegetation with distribution rights-of-way and determine risk based on proximity to wires and poles.

  • Xplore and UP42 partner to bring satellite data to geospatial customers

    Xplore and UP42 partner to bring satellite data to geospatial customers

    Xplore's multi-sensor XCRAFT satellite. (Image: Xplore)
    Xplore’s multi-sensor XCRAFT satellite. (Image: Xplore)

    The agreement will enable direct access to Xplore’s satellite tasking and archive of high-resolution data

    Xplore Inc., a commercial space company providing space as a service, has signed a partnership agreement with UP42, a geospatial developer platform and marketplace. The agreement will enable direct access to Xplore’s satellite tasking and archive of high-resolution data.

    Xplore’s XCRAFT satellite platform is engineered to collect data with multiple instruments including still and video imagery, hyperspectral, ultraviolet and infrared spectroscopy. Xplore’s satellite is capable of achieving user-defined video flyovers.

    Data generated with Xplore’s diverse sensors will address a wide variety of use cases across the Earth observation industry including agriculture, forestry, oil and gas, maritime, change detection and intelligence, and creative media content. Additionally, customers can obtain more informative, rich layers of data from Xplore’s data-fusion products.

    The combined power of bringing Xplore’s high-value imagery products to market via the UP42 platform will accelerate the commercial use of private remote-sensing data, according to Xplore.

  • Seen & Heard: Goodbye to QE2, saving Ukrainian heritage

    Seen & Heard: Goodbye to QE2, saving Ukrainian heritage

    “Seen & Heard” is a monthly feature of GPS World magazine, traveling the world to capture interesting and unusual news stories involving the GNSS/PNT industry.

    Photo:
    Screenshot: Lying in State Queue tracker

    Queue Tracker for the Queen

    After the passing of Queen Elizabeth II on Sept. 8, the British government launched a live queue tracker app to give people an idea how long they would have to wait to pay their respects at her lying in state at the Palace of Westminster. The app also used What3Words to help locate the end of the line using a three-word tag. The queue grew dramatically in the days before the funeral as tens of thousands lined up, some waiting as long as 16 hours. The app also showed locations of public toilets, drinking water and first-aid stations along the queue route.


    Lake Sarez. (Photo: Astronaut Photography Collection/NASA)
    Lake Sarez. (Photo: Astronaut Photography Collection/NASA)

    A Dam Problem Solved

    Lake Sarez, deep in the Pamir mountains of Tajikistan, was created only a century ago when a strong earthquake triggered a massive landslide. The area experiences considerable seismic activity, which could result in massive flooding downstream should a landslide dam break. With the help of 40 donkeys, 10 scientists and 30 staff from the National Time Service Center of the Chinese Academy of Sciences transported and installed a BeiDou-based deformation monitoring system at the dam. The team had to resolve technical problems in the rugged area, such as providing sufficient solar power and communications. With the system now operating, the dam is being monitored in real time down to the millimeter.


    Figure 3. (Image: CC BY 4.0, Remote Sensing 14, no. 17: 4274) Photo:
    Figure 3. (Image: CC BY 4.0, Remote Sensing 14, no. 17: 4274)

    Counting the Forest for the Trees

    Integration of aerial and ground-based mobile mapping sensors and systems is enabling a team of Purdue digital forestry researchers to locate, count and measure more than a thousand trees in a matter of hours. “The quick, accurate inventory of the global forest ecosystem will improve our ability to prevent forest fires, detect disease, perform accurate carbon counting and make informed forest management decisions,” said Songlin Fei, the Dean’s Remote Sensing Chair. The Purdue-made systems integrate GNSS and inertial navigation devices with lidar and cameras, deployed with manned aircraft, drones and backpack-mounted systems. The technology gathers a variety of information about each tree, including height, trunk diameter and branching formation. The team maintains the precise location and time tags of all acquired features.


    Photo: Skeiron
    Photo: Skeiron

    Saving Ukranian Heritage

    By the end of May, at least 367 incidences of destruction had occurred to Ukraine’s museums, churches, theaters and libraries. Through the project #SaveUkranianHeritage, mapping company Skeiron is capturing sites in high detail using laser scanning and photogrammetry. For a UNESCO-protected church in Lviv, the team gathered more than 300 individual laser scans and 6,000 photos to create a 3D model. The company has two laser scanners — a Leica C10 and Leica ScanStation P20, DLSR cameras and a drone. To support the project with funding or equipment, visit skeiron.com.ua/en/saveukrainianheritage/.

  • ISRO offers free online course on GNSS

    ISRO offers free online course on GNSS

    Logo: Indian Space Research OrganisationA free 12-day online course on GNSS will be offered by the Indian Institute of Remote Sensing (IIRS), part of the Indian Space Research Organization (ISRO).

    “Overview of Global Navigation Satellite System” (Course-ID: 107) will be held Sept. 19-30. The course is designed to help with the urgent demand for trained manpower in remote sensing, geographic information systems (GIS), GNSS and associated geospatial technologies. The course will introduce GPS and GNSS, receivers, processing methods, errors and accuracy.

    The course will cover the following topics:

    • GPS receivers, processing methods, errors and accuracy
    • satellite-based augmentation systems and GPS-aided and GEO-augmented navigation (GAGAN)
    • GPS signal characteristics and data formats (broadcast and precise ephemeris)
    • Indian Regional Navigation Satellite System (IRNSS)
    • DGPS demonstration
    • advanced GNSS processing
    • development of satellite navigation technology, TRANSIT, TSKLON, GNSS (GPS, GLONASS, Galileo and BeiDou), principles of GNSS, segments and applications
    • satellite navigation.

    The course is open to undergraduate and postgraduate students; technical or scientific staff of central or state government; and faculty or researchers at university or institutions.

    Course study materials — lecture slides, recorded video lectures, open-source software and handouts of demonstrations — will be made available through the IIRS learning management system E-CLASS.

    Visit the IRSS website for details.

  • Ticket presale open for INTERGEO 2022

    Ticket presale open for INTERGEO 2022

    Photo: INTERGEO

    The INTERGEO Expo & Conference focuses on innovations for a smarter world. INTERGEO 2022 will take place October 18-20 in Essen, Germany.

    Topics including the importance of geoinformation for internal security, monitoring for disaster control and prevention, open data, digital twins alongside their use in construction and housing, mobility, sustainability and climate change, BIM and engineering applications with UAV, laser scanning and monitoring will be discussed during the 2022 event.

    Additionally, the outdoor area of Messe Essen will show live demonstrations of the latest UAV applications in surveying, agriculture, construction, security and many more.

    According to INTERGEO organizers, 300 international companies are already registered at the Expo, from innovative young start-ups to international key players such as Autodesk, Esri Inc., Hexagon, Trimble, Topcon and many more. The organizers expect around 500 exhibitors by October.

    “All the international key players in the industry will be there.There was no doubt about it – they all want to get back to their customers, to visitors, to the live atmosphere and the power of meetings”, says Prof. Dr-Ing. Hansjörg Kutterer, President of the organiser DVW e.V., Association for Geodesy, Geoinformation and Land Management.

    For those who are unable to attend the event in Germany, there will be some opportunities to participate in the Expo remotely.

    Up close and personal

    Digital Twins will receive their big break at the Conference 2022. Their use in building information modeling, smart planning and construction as well as mobility will be the focus of the event. Digital twins will be used to further development of urban data platforms in the context of smart cities and their variety of applications, as well as the use of smart city solutions in terms of innovation and sustainability and a basis for predictions and scenarios in the event of disasters.

    The main topics in 2022 are Digital Twins and their value creation, 4D geodata and Geospatial IoT, potentials of remote sensing, BIM 4.0, industrial surveying, measurement systems and robotics, smart cities and mobility in the context of climate change and sustainability, mobile mapping, web services and GeoIT in disaster relief, spatial reference and positioning, earth observation and Galileo.

    Hansjörg Kutterer points out the high innovative power of the industry: “We are experiencing high dynamics in segments such as mobility, environment and sustainability, climate protection and urbanization. Geo-IT has positioned itself as a solution provider for these topics. Problem-solving without Geo-IT is unthinkable in these subject areas. Come to Essen on the 18th to 20th of October and visit Intergeo Expo and Conference.”

    How to attend

    Tickets for INTERGEO are now available. An early-bird registration rate is available until August 31. Tickets can be found at https://www.intergeo.de/en/tickets.

    Registration for new exhibitors is open as well. All information, such as application procedures and funding amounts, can be found on the INTERGEO website at www.intergeo.de/en/.

  • New surveying and mapping textbook available for download

    New surveying and mapping textbook available for download

    A new surveying and mapping textbook is now available on the OPEN Textbook network.

    book coverWritten in English, the book provides an academic introduction to the field of surveying and mapping. It is based on handouts and readers written for the third-year course “Surveying and Mapping” in the civil engineering bachelor’s program at Delft University of Technology in The Netherlands.

    The textbook covers a wide range of measurement techniques, from land surveying using GPS/GNSS and remote sensing to the associated data processing, the underlying coordinate reference systems, and the analysis and visualization of the acquired geospatial information.

    Although a few parts of the book are specific to The Netherlands, for the most part the material is applicable globally.

    Surveying and Mapping

    Authors: Christian Tiberius, Hans van der Marel, René Reudink and Freek van Leijen / Delft University of Technology / The Netherlands

    ISBN (softback/paperback): 9789463664905

    ISBN (ebook): 9789463664899

    DOI: https://doi.org/10.5074/T.2021.007

    The book is freely available as an OPEN Textbook by the TU Delft library.

  • Geospatial technologies in the suborbital domain

    Geospatial technologies in the suborbital domain

    View from a weather balloon at 100,000 feet. (Photo: NOAA)
    View from a weather balloon at 100,000 feet. (Photo: NOAA)

    We’re at 103,000 feet. As you look up the sky looks beautiful but hostile. …Can see for over 400 miles. The sky [above me] is absolutely black. …I can see the beautiful …deep, dark, indescribable blue [sky below], which no artist can ever duplicate. It’s fantastic.”

    — Capt. Joseph W Kittinger, USAF, Operation Excelsior III, August 16, 1960

    This month, our journey begins in the future. Imagine you are in Alamogordo, New Mexico, a town with a rich history in America’s space program. You are here for a proof-of-concept, real-world exercise. After two years spent training, you are on a team that will test the viability of a stratospheric airframe, or high-altitude platform station (HAPS).

    The exercise is a joint venture between several large corporations and U.S. government agencies. The HAPS began as a telecommunications support platform, but now includes many different industries. It will test backup systems for GPS and other sensing technologies.

    Remote sensing is an obvious use case, and sensors are onboard to collect hyperspectral and thermal images, synthetic aperture radar, lidar, magnetometry, weather and other types of data. Some equipment is mounted on top of the platform to point toward space to monitor satellites and orbital debris. Also aboard are are satellite relays and space-based communications systems. Additionally, a Hubble-like observatory will support NASA research.

    On the ground at the command center, other teams are working on the project. A mapping and survey team is in the field to ground truth the precision, accuracy and resolution of the HAPS data.

    Autonomous vehicle manufacturers are testing telemetry data from the HAPS for improved precision navigation. Teams of imagery analysts and geospatial analysts are assessing the quality and value of the products, including full-motion video live-streamed from the HAPS.

    Aerospace engineers are studying the performance of the airframe and monitoring its structural integrity. Meteorologists are providing upper air wind and weather forecasts. Several teams of engineers are managing various robotics systems onboard, and more scientists and engineers from multiple companies and agencies are testing their equipment.

    The solar-powered Helios in flight. (Photo: Aerovironment)
    The solar-powered Helios in flight. (Photo: NASA/Aerovironment)

    Your Mission as a Stratonaut

    Most tests and modifications are being handled remotely, but some require replacing the systems. This can only be accomplished by physically going to the sub-orbital station. Imagine this is your job.

    You are a remote sensing technician specially designated as a stratonaut. Your training familiarized you with the various systems onboard. You trained how to use your pressure suit — its dangers, risks and capabilities — and how to interface with the suit’s augmented reality system. You know how the HAPS operates, its schematics, and the interiors of the three connected dirigibles. You can navigate your way around the HAPS and access the various decks and compartments as well as the sensors, equipment, charging ports, fuel cells and motors. You can fly the drones, dock with the station, and enter its hangar bays. You can do maintenance on the autonomous robots and the remote-controlled robots onboard the station. You know the security and safety protocols. All this you know and more; and, if things go wrong, you know what to do.

    Vision of the Alpha, Bravo and Charlie HAPS stations. (Image: William Tewelow)
    Vision of the Alpha, Bravo and Charlie HAPS stations. (Image: William Tewelow)

    On this mission day, it’s early morning. Sunlight is beginning to pierce the sky above the Alamogordo base station. Two technicians are helping you into your pressure suit. Another technician at a desk has your helmet hooked up to the computer. The LED lights encircling the facemask blink slowly, indicating data is being uploaded. The augmented reality face shield glows a soft blue as the data flashes across it.

    Overnight at the command center, operators controlled descent of the HAPS from 100,000 feet. It takes 10 hours to reach 65,000 feet, the altitude for your rendezvous with the station. You will fly up to the HAPS in a cargo delivery drone and dock at the forward hangar bay of Station Bravo (the second dirigible). You’ll be installing an enhanced high-resolution hyperspectral sensor array in the station’s lower observation deck.

    While you are busy with the installation, the autonomous robot onboard will be in the hangar bay, swapping out the station’s spent fuel cells with fresh ones carried up by the cargo drone. Each weighs 250-pounds. After this task, the cargo drone will fly to Stations Alpha and Charlie and swap out their spent fuel cells.

    Once all three are completed, the cargo drone will return to Station Bravo and take you to the top of Station Charlie to install a satellite laser relay (SLR) communications system. A remote-controlled robot operated by the engineering team at base command will meet you and carry the SLR up to the tower. While you are installing the SLR, the cargo drone will dock and recharge for your return trip. The entire mission will take seven-hours and 45 minutes.

    Many functions currently done with satellites could be performed for tactical and operational commanders using near-space assets, much more cheaply and with much greater operational utility. By operationally grouping near-space with space, the functional expertise synergies would allow much more efficient delivery of space effects to the joint commander.

    — Lt. Col. Edward B. Tomme, Ph.D., USAF, Air Power Research Institute

    Two Types of Pseudolites

    High-altitude, long-endurance (HALE) airframes — also referred to as pseudo-satellites, pseudolites and stratolites — are of two types.

    Heavier than air. The heavier-than-air (HTA) type is a lightweight, fixed-wing aircraft with extremely long wingspans. It can stay aloft for a month or more.

    HTAs are limited to carrying small payloads. They typically rise to 100,000 feet during the day powered by their solar cells, and at night descend to 60,000 feet, repeating this cycle until the batteries need replacing. The HTA platform is good for short-term missions over a broad area of interest because it normally flies in large circular patterns.

    Lighter than air. The other type of pseudo-satellite is a lighter-than-air (LTA) airframe. The typical example is a dirigible, but these platforms can take on many shapes and sizes. LTAs can be enormous, with lifting capacities upward of 100,000 pounds. They operate as geostationary platforms loitering indefinitely over an area of interest and remain at the same altitude day and night. An LTA can last for 10 years or more.

    The best solution is a combination of the two. A large LTA can serve as a base station to support several small HTA platforms.

    Together, NASA and the Space Force seek to advance, protect and sustain activities in, from and to space. This is truly a new era of strategic collaboration that will benefit commercial, civil and national security in space.

    — John W. Raymond, General, Chief of Space Operations, United States Space Force

    A stratospheric based telecommunications platform proposed by the Elefante Group. (Image: FCC)
    A stratosphere-based telecommunications platform proposed by the Elefante Group. (Image: FCC)

    HAPS Alliance

    Furthering the development of the pseudo-satellite industry is a consortium of 49 companies and universities called the HAPS Alliance, which advocates for investment in this area.

    The stratosphere has become increasingly important for commercial interests and national security. HAPS can provide the best of what manned aircraft operating at lower altitudes can offer, combined with the benefits of satellites, minus much of the downside of each.

    Limits of aircraft. Aircraft operating at lower altitudes offer high resolutions and targeted collection. They can be easily retasked and rerouted, and equipment can be easily repaired or replaced. Aircraft are limited by constraints of time, fuel, weight, distance and weather.

    Limits of satellites. Satellites, on the other hand, provide broad area coverage and long-term, operational endurance, but they are 240 miles or more above the Earth traveling at 17,500 miles per hour, or they are 18,000 miles above the Earth to maintain a geostationary orbit. It is a trade-off between resolution and dwell time.

    Other drawbacks of satellites are their expense. Launching is costly and recovery is nearly impossible to make repairs. Doing so is impractical.

    HAPS do not have those limitations. They can provide long-term, persistent operations over an area of interest at very high resolutions. They also can carry a complete package of sensors and equipment with the additional benefit that most everything can be repaired or replaced with minimal cost.

    Locations of HAPS to cover the borders of the Continental United States. (Image: William Tewelow)
    Locations of HAPS to cover the borders of the Continental United States. (Image: William Tewelow)

    How HAPS Will Improve Geospatial Data

    These systems are going to improve geospatial information. HAPS will improve spectral resolutions by a factor of 10x or better. The improved location accuracy data will impact navigation, surveying, construction, emergency services, logistics, transportation, aviation, agriculture and most other industries.

    The HAPS will act in tandem with cellular networks on the ground to improve internet connectivity and telecommunications. They will improve national security while monitoring the effects of climate change, deforestation, urban sprawl, ozone, pollution and natural disasters such as floods, forest fires, tornadoes, hurricanes and more.

    Provided testing proves HAPS a success, the pseudosatellite era is going to greatly impact most everyone’s life. If you are lucky, you might actually become a stratonaut. If you are interested, now is the time to prepare.

    This point of observation commands an area nearly 50 miles in diameter. The city, with its girdle of encampments, presents a superb scene. I have pleasure in sending you this first dispatch ever telegraphed from an aerial station.

    — Thaddeus S. C. Lowe, First Chief Aeronaut, Union Army Balloon Corps, Civil War, 1861


    Headshot: William Tewelow
    William Tewelow

    William Tewelow is a Senior Aeronautical Information Specialist for the Federal Aviation Administration. He is a designated Geographic Information Systems Professionals (GISP). He served on special assignment to the U.S. Department of Transportation and led a national strategic geospatial initiative under the authority of the White House Open Data Partnership. He was among the first in the nation to earn a Geospatial Specialist Certification from the U.S. Department of Labor while working at NASA Stennis Space Center.

    He is a 2016 graduate of the FAA’s management fellowship Program for Emerging Leaders. He has degrees in Geographic Information Technology and Intelligence Studies and is earning a master’s degree in Organizational Leadership with a focus on Performance Management. He is a mentor with the FAA’s National Mentor Program.

    Tewelow retired from the U.S. Navy after serving 23 years as a Geospatial and Imagery Intelligence Specialist, a Naval Aviator, a Meteorologist, and a Tactical Oceanographer earning three achievement medals. He is married, enjoys traveling, connecting people, solving problems, and interested in new technology. His favorite quote is, “A man’s mind changed by a new idea can never go back to its original dimension.” ~ Oliver Wendell Holmes


  • Mapping Marvel: Lost cities found

    Mapping Marvel: Lost cities found

    Photo: Mlenny/iStock/Getty Images Plus
    Photo: Mlenny/iStock/Getty Images Plus

    GPS and airborne light detection and ranging (lidar) have revolutionized archaeology. In just a little more than a decade, dozens of previously hidden cities and settlements have been discovered under heavy tree canopy and in other terrain. Many of the sites are in difficult-to-access areas, such as high atop mountains, in vast deserts, or enclosed in thick, nearly impenetrable foliage. Many were only the stuff of legend.

    Others are right under our feet. In 2018, early settlements were uncovered in New England, including now-abandoned walls, roads and building foundations.

    With the development of lidar, archaeologists gained perhaps their most powerful tool since carbon dating. Lidar began as a million-dollar classified technology. Now lidar units are small enough to attach to unmanned aerial vehicles (UAVs).

    Lidar devices send more than 100,000 laser pulses to the ground every second and use their return times to calculate precise elevation data that allow researchers to build three-dimensional maps of a landscape, while GPS receivers provide its coordinates. Lidar fly-overs have revealed ancient cities, temples, causeways, irrigation systems and other structures, which are then ground-truthed by excavation teams.

    “Lidar has completely changed the way we survey ancient Maya cities and what we can know about them, and it is a thousand times better than [what we used] before,” Francisco Estrada-Belli told GPS World. Estrada-Belli is a research professor at Tulane University’s Middle American Research Institute.

    The application of lidar to archaeology began in 2009, when NASA sponsored a remote-sensing project that showed lidar’s usefulness below the forest canopy. The project revealed the surprisingly vast scope of Caracol, the largest Mayan archaeological site in Belize. Urban Caracol maintained a population of more than 100,000 people with an immense agricultural field system and elaborate city planning.

    Since then, lidar has been used the world over to uncover buried secrets from early Roman fortifications in Italy to landscape changes from World War I. Just this August, lidar unearthed sobering evidence of a massacre by Nazi Germany in Poland during World War II.


    Image: F. Estada-Belli/Pacunam Lidar InitiativePhoto:
    Image: F. Estada-Belli/Pacunam Lidar InitiativePhoto:

    A landmark project in Guatemala illustrates the benefits of lidar. The ancient city of Tikal was one of the best-mapped regions of the Mayan world, but the Pacunam Lidar Initiative quintupled the amount of mapping done in 50 years in a single summer, with 61,000 structures found in an 810-square-mile area invisible to the naked eye because of overgrown vegetation. What experts had mistaken for unusable swampland, for instance, had actually been farmland, crisscrossed with canals. The area may have been home to a population of up to 10 million people. Results were published in Science in 2018.