The average age of surveyors in the United States is nearly that of retirement. Can new technology attract a new generation to the profession?
“We do not fully understand the trend in the United States,” said Simon Peng, ComNav Technology, “but in China we find that modern survey technology — such as UAV/lidar mapping and total stations — make field work simple. New trends such as computer imaging, point clouds and building information models (BIM) attract young surveying engineers.”
Using the equipment in the field is becoming increasingly easier, said Bernhard Richter, Leica Geosystems. “Our goal is that operating the field equipment should not be more difficult than playing with your smartphone. That means that you don’t need the super expert in the field so much anymore.” However, he argued, “someone who studied surveying should now be more the data manager, have the expertise to put the data in geospatial relation, and know in which reference frame he is operating.”
For example, that person needs to know about orthometric and ellipsoidal heights, especially for engineering projects between countries that might have different height codes. “Anybody who has an interest to geolocate an object can capture the data and upload it to the cloud environment,” Richter said. “Then there are the data managers. Certainly, they need to know the physical limits of surveying technology, and they need to manage the complexity of modeling Earth. They need to become data managers to really put data to work.”
“The anticipated number of new professionals is not necessarily replacing all the surveyors who are expected to retire over the next 10 years,” said Boris Skopljak, Trimble. To tackle this challenge Trimble is using a two-pronged approach: attracting younger workers by raising awareness of surveying as a future career and modernization of the profession. For the first prong, Skopljak cited “phenomenal programs out there, such as Get Kids into Survey.” He pointed out that many Trimble employees are part of those education programs, “promoting inclusion of not just a younger generation, but also of women and minority groups that are heavily underrepresented in our industry today.”
For the second prong, “Digital data capture workflows present opportunities. A very common interview question we ask these days is ‘Do you play video games?’ Generally, those young professionals who are gamers thrive in the 3D environment. The technology aligns well with the interests of younger folks.”
Additionally, a growing number of educational institutions are evolving their curriculums to meet these needs, said Skopljak. Trimble is establishing Trimble Technology Labs in selected academic institutions around the world that are helping students access the latest technology and the best modern engineering practices. Boosting productivity also helps compensate for the declining number of surveyors, because it reduces the number of people needed to get the job done. “As the technology becomes easier to digest and operate and more focused on the workflows, it also becomes easier for companies to standardize it and attract talent,” Skopljak said.
One of the biggest threats to the survey profession, according to Huff, is that it “let bits and pieces of traditional surveys fall off to the wayside.” Geographic information systems (GIS) use the same positioning technology, he pointed out. “Fifty years ago, that was more of a function of the surveyor than it was necessarily the GIS profession. In many ways, while the surveyor is aging — the licensed cadastral surveyors certainly are aging — there is a new generation of folks coming through who are leveraging the new technology, such as drones and mobile mapping systems.”
This new generation, Huff argued, will achieve the same accuracies as the previous one partly because it’s getting easier to do so. “We definitely have more of a generation of digital users that can leverage the technology to do things where even my mentors performed many calculations by hand, on the fly, from plain tables in their logbooks with sine, cosine and tangent in them. Now, I think that technology and 3D immersive technology, which hinges on GPS location, attracts a younger crowd to certain facets of the profession.”
François Freulon, Septentrio, agreed that new technologies now available “can be easily adopted by new generations in the profession,” yet added that “quality surveying requires a good formation and experience in the field.” Therefore, he argued, “surveying education systems will need to adapt their programs and incorporate newer techniques such as new positioning modes and corrections.
Surely RTK remains as the main accuracy technique, but this could change quickly in the coming years as correction services bring better performance and regional coverage.”
“Nothing can remain immense if it can be measured,” Hannah Arendt wrote in 1958 in The Human Condition. This could be the guiding inspiration for any geodesist or surveyor throughout history. In about 240 B.C., Eratosthenes became the father of geodesy by ingeniously measuring Earth’s circumference using the Sun, a well, a vertical column, the distance a camel caravan traveled from Syene to Alexandria and some basic mathematics. His estimate of 46,000 kilometers was 16% too large but remarkably close considering that he lacked any modern measuring tool. (For a great account of this epic feat, see John Noble Wilford’s The Mapmakers.)
Geodesy, a branch of applied mathematics, is concerned with accurately measuring and understanding three of Earth’s fundamental properties: its geometric shape, its orientation in space, and its gravity field. Earth’s true shape varies from the mathematically smooth surface of an ellipsoid due to local differences in its density that cause variations in the strength of the gravitational pull, in turn causing regions to dip below or bulge above a reference ellipsoid.
This undulating shape is the geoid, which geodesists have defined as the three-dimensional surface along which the pull of gravity is a specific constant. It serves as the zero-level surface for height measurements globally, and all GNSS are pegged to it. It is a hypothetical surface that essentially represents an extension of the idealized mean sea level over (actually, mostly under) Earth’s land surface. Unlike the surface of the oceans, however, it is unaffected by wind, waves, the Moon, or forces other than Earth’s gravity.
Surveyors are content with measuring much smaller portions of Earth’s surface, from single lots to national boundaries. Unlike Eratosthenes, they work with the latest fruit of modern science and technology — including GNSS receivers, robotic total stations, inertial measurement units, lidar, other sensors and unmanned aerial vehicles — and can measure distances with millimeter precision.
When I started in this business a little more than 20 years ago, we used to group GPS receivers by accuracy into three buckets: consumer grade, resource/mapping grade and survey grade. As accuracy has increased for all GNSS receivers, the boundaries between those categories, especially between mapping and surveying, have blurred. Additionally, we now have way more GNSS satellites — in some parts of the world, as many as 70 are in view at one time — and a panoply of public and private, ground-based and satellite-based corrections services.
So, surveyors have a growing set of tools, and they are constantly getting more accurate and more user-friendly.
Now, let me throw another number in the mix: 66. That is the average age of surveyors in the United States. In the short run, employment for surveyors hinges in part on the vagaries of the economy. In the long run, however, population growth and climate change will force large investments in infrastructure. On most construction sites, the first to arrive and the last to leave are the surveyors. We know what their tools are, but who will they be?
The surveying profession is intrinsically involved with many functions of today’s communities and environment. When we take a closer look at the roles we play, the surveyor is usually found in the middle. Here are a few examples.
For new developments and infrastructure, surveying takes place after a client decides to begin a project. Site data must be collected, drafted and presented to the client, engineers and architects for design.
Upon completion of the engineering design, the surveyor provides layout services for the construction company to build the structure.
Once the improvements are completed, the surveyor provides surveys as well as record drawings for confirmation of construction to satisfy government agencies and financial backers.
In a property dispute, the surveyor becomes the center of attention — our professional opinion determines the correct location of the subject boundary.
This responsibility also extends to the geospatial sectors within the surveying profession. Data collection is a critical step to creating and maintaining efficient geographic information system (GIS) databases that correctly depict existing infrastructure and parcel boundary layers. With the surveyor at the center of many of these duties and tasks, no wonder that we sometimes feel we have a bullseye on our backs.
Knowing how to compute the center is an important aspect of the surveyor’s duty.
However, the word center takes on a different connotation when it comes to data and objects. Properly identifying the center of specific sets of data or objects is important when working with construction information and geospatial data. Properly measuring and marking the center of an installation has its challenges, so knowing how to compute the center is an important aspect of the surveyor’s duty.
Why is the center of an object important?
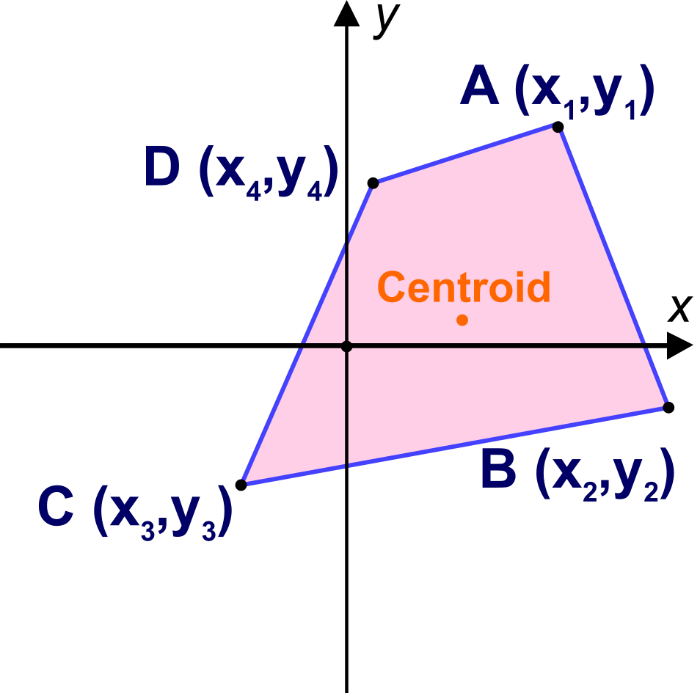
Every object that is definable in a two-dimensional space has a physical center. Whether the object is a regular or irregular polygon in plane geometry, there are various methods for determining its center.
Figure: Tim Burch
These figures are easy to understand and simple to solve. More complex figures require more calculations, including coordinate geometry.
Figure: Tim Burch
These examples of regular and irregular polygons have something in common: all are based upon two-dimensional space, which is flat. But what happens if we need to determine the center of a shape that does not fall on a 2D surface? What if the data being reviewed for a center resides on a spherical surface and contains diverging axes?
As surveyors, we break our work down to smaller coordinate systems to work around the fact that our data resides on a spherical surface, but some datasets require the information to remain as latitude and longitude. One dataset is population counts, otherwise known as the census.
The U.S. Census and the ‘center of population’
The U.S. Census Bureau has been at work since early colonial times. This excerpt from the bureau website explains its purpose and foundation.
The U.S. Constitution requires only that the decennial census be a population count. Since the first census in 1790, however, the need for useful information about the United States’ population and economy became increasingly evident.
The decennial census steadily expanded throughout the nineteenth century. By the turn of the century, the demographic, agricultural, and economic segments of the decennial census collected information on hundreds of topics. The work of processing these data kept the temporary Census Office open for almost all the decades following the 1880 and 1890 censuses.
Recognizing the growing complexity of the decennial census, Congress enacted legislation creating a permanent Census Office within the Department of the Interior on March 6, 1902. On July 1, 1902, the U.S. Census Bureau officially “opened its doors” under the leadership of William Rush Merriam.
Counting the citizens of the United States was one thing, but mapping them was another. Once the final count was completed and mapped, the information was used to determine a unique location: the center of population. Here is more from the Census Bureau on the calculation basis:
The concept of the center of population as used by the U.S. Census Bureau is that of a balance point. The center of population is the point at which an imaginary, weightless, rigid, and flat (no elevation effects) surface representation of the 50 states (or 48 conterminous states for calculations made prior to 1960) and the District of Columbia would balance if weights of identical size were placed on it so that each weight represented the location of one person.
More specifically, this calculation is called the mean center of population.
This sounds like an easy exercise for a room of mathematicians and mappers, right? On the contrary, my fellow geospatialists!
How do they determine the center of population?
Computing the center of population for the United States would be much easier if we existed on a two-dimensional plane, as previously discussed. Since we don’t, however, it requires a much more difficult method of calculation to get us closer to a real-world solution:
To avoid unduly complex factors in the computations, the mathematical formulae used were those that would be precise for a true sphere. On such a sphere, the north-south distances between parallels of latitude are identical and distances in degrees may be used as units of distance. On the other hand, distances between meridians on longitude lines are not constant but decrease from the equator toward the poles. However, if the length of one degree along the equator is used as the unit of measurement, then the length in degrees of an east-west line at any other latitude can be adjusted to the measurement standard by multiplying by the cosine of the latitude.
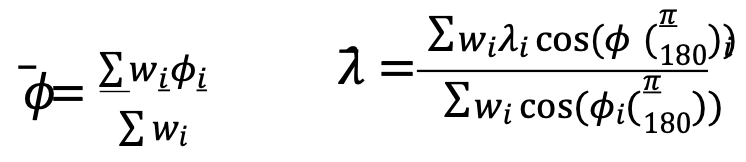
The center of population computed by the Census Bureau is the point whose latitude (𝜙) and longitude (λ) satisfy the equations:
where 𝜙𝑖, 𝜆𝑖 and 𝑤𝑖 are the latitude, longitude and population attached to the basic small units of area used in the computation.
Stated in less mathematical form, the latitude of the center of population was determined by multiplying the population of each unit of area by the latitude of its population center, then adding all these products and dividing this total by the total population of the United States. The result is the latitude of the population center.
East-west distances were measured, or computed, in substantially the same manner, but with the inclusion of a correction for latitude. For these distances, a degree of longitude at the equator was the unit of measurement. East-west distances along the equator could be measured in degrees, but any east-west degree distance north of the equator — where all the United States is located — had to be adjusted to recognize the convergence of meridians toward the poles. This adjustment required that each east-west distance, stated in degrees of longitude, be multiplied by the cosine of the latitude. This mathematical relationship is precise for a sphere and a very close approximation for the earth.
The computation required that the longitude of each of the thousands of selected points be multiplied by the cosine of the latitude of the point and by the population associated with the point. These products were added and divided by the sum of the products for the same thousands of points, each of which was obtained by multiplying the cosine of the latitude of a point by the appropriate population figure. The result was the longitude of the center of population.
(Courtesy of the Geography Division, U.S. Census Bureau, published November 2021)
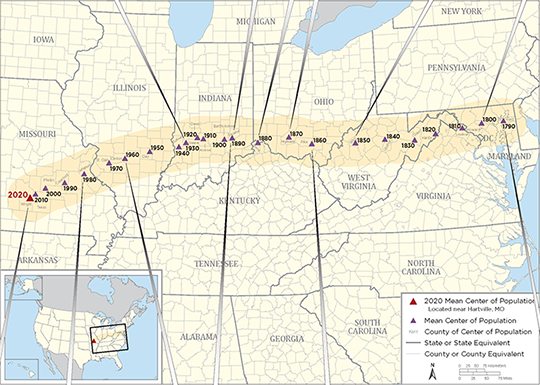
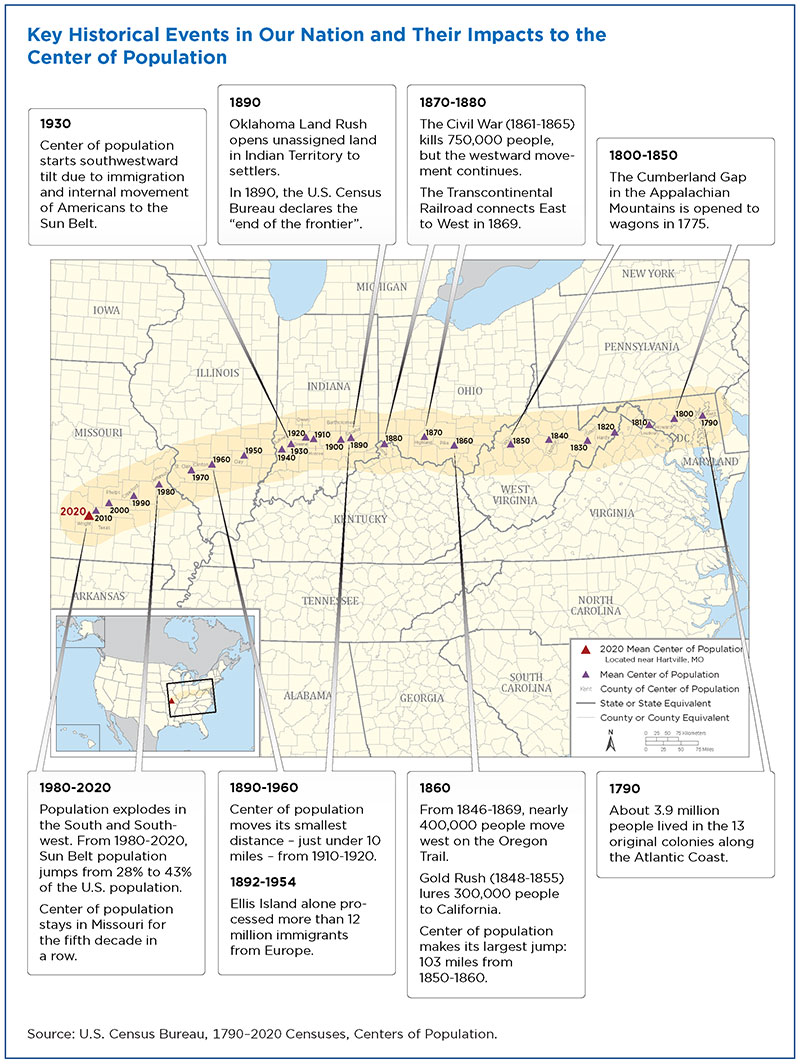
Here is a graphic from the U.S. Census identifying significant historical events along with the westward movement of the center of population:
Image: U.S. Census Bureau
Here are the locations with corresponding latitude/longitude for the centers from 1790 to 2020:
Mean Center of Population of the United States, 1790–2020
Census year
North latitude
West longitude
Approximate location
United States
2020
37.415725
92.346525
Wright County, MO, 14.6 miles northeast of Hartville.
2010
37.517534
92.173096
Texas County, MO, 2.7 miles northeast of Plato.
2000
37.69699
91.80957
Phelps County, MO, 2.8 miles east of Edgar Springs.
1990
37.87222
91.21528
Crawford County, MO, 9.7 miles southeast of Steelville.
1980
38.13694
90.57389
Jefferson County, MO, 1/4 mile west of DeSoto.
1970
38.46306
89.70611
St. Clair County, IL, 5 miles east-southeast of Mascoutah.
1960
38.59944
89.20972
Clinton County, IL, 6-1/2 miles northwest of Centralia.
1950
38.80417
88.36889
Clay County, IL, 3 miles northeast of Louisville.
Conterminous United States
1950
38.83917
88.15917
Richland County, IL, 8 miles north-northwest of Olney.
1940
38.94833
87.37639
Sullivan County, IN, 2 miles southeast by east of Carlisle.
1930
39.06250
87.13500
Greene County, IN, 3 miles northeast of Linton.
1920
39.17250
86.72083
Owen County, IN, 8 miles south-southeast of Spencer.
1910
39.17000
86.53889
Monroe County, IN, in the city of Bloomington.
1900
39.16000
85.81500
Bartholomew County, IN, 6 miles southeast of Columbus.
1890
39.19889
85.54806
Decatur County, IN, 20 miles east of Columbus.
1880
39.06889
84.66111
Boone County, KY, 8 miles west by south of Cincinnati, OH.
1870
39.20000
83.59500
Highland County, OH, 48 miles east by north of Cincinnati.
1860
39.00667
82.81333
Pike County, OH, 20 miles south by east of Chillicothe.
1850
38.98333
81.31667
Wirt County, WV, 23 miles southeast of Parkersburg.
1840
39.03333
80.30000
Upshur County, WV, 16 miles south of Clarksburg. Upshur County was formed from parts of Barbour, Lewis, and Randolph Counties in 1851.
1830
38.96500
79.28167
Grant County, WV, 19 miles west-southwest of Morefield. Grant County was formed from part of Hardy County in 1866.
1820
39.09500
78.55000
Hardy County, WV, 16 miles east of Moorefield.
1810
39.19167
77.62000
Loudoun County, VA, 40 miles northwest by west of Washington, DC.
1800
39.26833
76.94167
Howard County, MD, 18 miles west of Baltimore. Howard County was formed from part of Anne Arundel County in 1851.
1790
39.27500
76.18667
Kent County, MD, 23 miles east of Baltimore.
Data: U.S. Census Bureau
Not to be confused with the geographic center…
The geographic center of area is the point at which the surface of the United States would balance if it were a plane of uniform weight per unit of area. That point, approximately 44.967° north latitude and 103.767° west longitude, is located west of Castle Rock in Butte County, South Dakota, as it has been since Alaska and Hawaii became states.
The geographic center of the conterminous United States (48 states and the District of Columbia) is located near Lebanon in Smith County, Kansas, at approximately 39.833º north latitude and 98.583º west longitude.
The center of population as geospatial data
The plotting of the center of population makes for an interesting study of westward expansion in early U.S. history. Once the contiguous 48 states were founded, plotting the center shifts to regional changes . The truly interesting part of these calculations and plotting for the past several centuries falls into an area of expertise called geospatial data.
While some liberties were taken early on using large, populated areas as one data point, we now can count literally every person and their geospatial location. However, it needs to be recognized that early efforts to count our population and track its center every 10 years meets the criteria for being called geospatial data. They just didn’t yet know what that meant.
Speaking of surveyors…
Here are several events and initiatives happening this month, an important month for surveyors.
2022 National Surveyors Week
National Surveyors Week was established by the National Society of Professional Surveyors as an annual event to bring public recognition to the surveying profession and the vital services surveyors provide to the advancement and betterment of human welfare.
During this week, thousands of professional surveyors throughout the country will take part in local activities designed to introduce a new generation to the profession and highlight the use of technology in their day-to-day work.
Global Surveyors’ Day 2022 will be held Monday, March 21. This annual event is a way to globally recognize groundbreakers, pioneers, individuals and the industry that has shaped our history and continues to be of great value to our communities.
2022 Global Surveyor of the Year
Image: NSPS
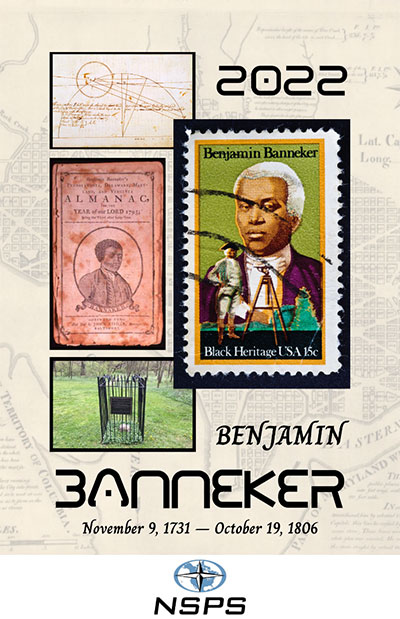
As part of the Global Survey Day and National Surveyors Week, every year on March 21 a professional surveying association is tasked with choosing a Global Surveyor of the Year. For 2022, the National Society of Professional Surveyors has been selected to choose a person with a historical surveying background for this prestigious honor. After thorough consideration, NSPS has chosen Benjamin Banneker (1731–1806) for 2022 Global Surveyor of the Year.
The selection was brought before the NSPS Board of Directors during our Spring 2021 meeting and passed by a majority vote. While Banneker’s career as a surveyor was limited in time and experience, his additional contributions to math, science, astronomy and publication of a groundbreaking almanac have earned him a significant place in American history.
We also selected Banneker because of his ability to overcome the adversity of being a free Black man in early colonial America. Through much self-teaching, he was able to excel at the contributions previously listed in a period when Blacks were not accepted for their educational abilities.
The selection committee chose Banneker over the three presidents who are famously chiseled on Mount Rushmore and Henry David Thoreau, an author who also surveyed to fund his writing career. The committee felt that Banneker’s contributions not just to the surveying profession made him deserving of this honor, but considered his total body of work created when Black men were not generally accepted as capable human beings. Our world needs more people like Benjamin Banneker and would be a better place because of them.
No time like the present to promote our geospatial professions
Surveying and geospatial careers are more important than ever, so examples like the center of population help depict applications that us these skills. Please consider promoting our wonderful professions during these events and throughout the year. The profession you promote may provide an opportunity to bring new faces and ideas to our ranks very soon.
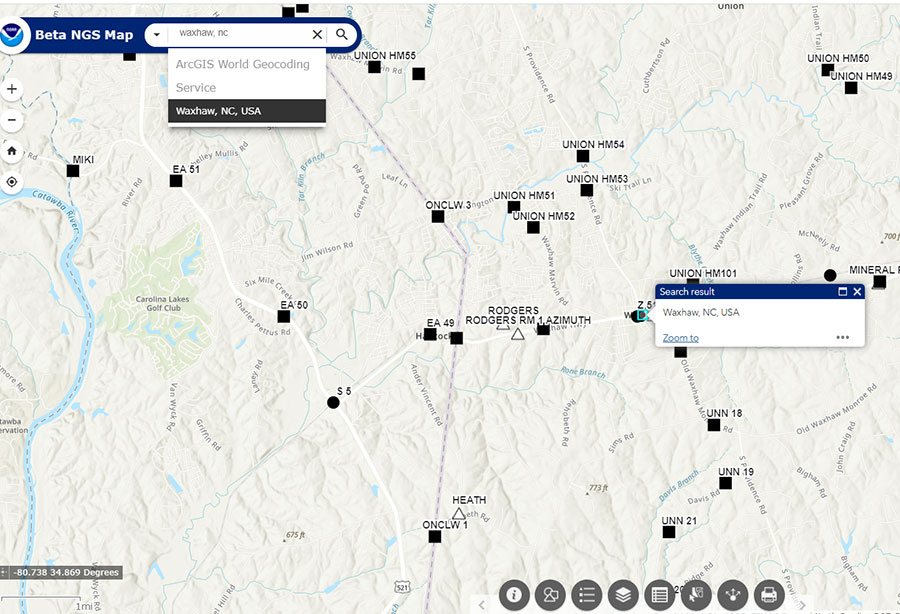
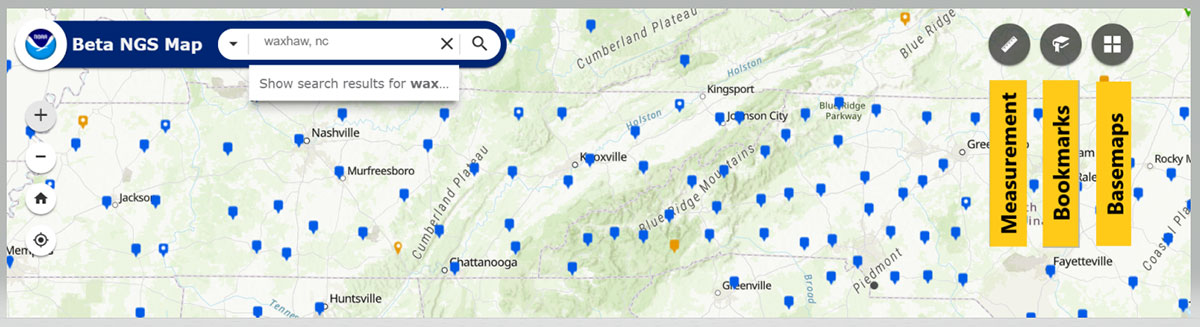
On Nov. 9, the National Geodetic Survey (NGS) announced the release of a new Beta NGS Map. This web application allows users to view multiple datasets that are useful to anyone planning or performing a survey project, or anyone that’s just looking for NGS marks.
The map enables users to access NGS datasheets, OPUS Shared Solutions, and the NOAA CORS Network. It also provides a measuring tool, multiple basemaps, and the ability to export data.
I recently used this tool on my iPhone to locate marks when I was traveling. It’s an amazing tool that is easy to navigate, and a useful tool for identifying marks to be included in a project.
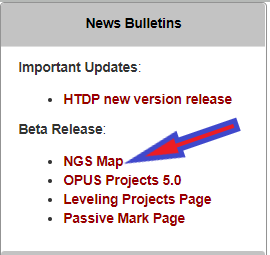
The NGS homepage provides a link to the Beta NGS Map (see below).
Image: NGS Website
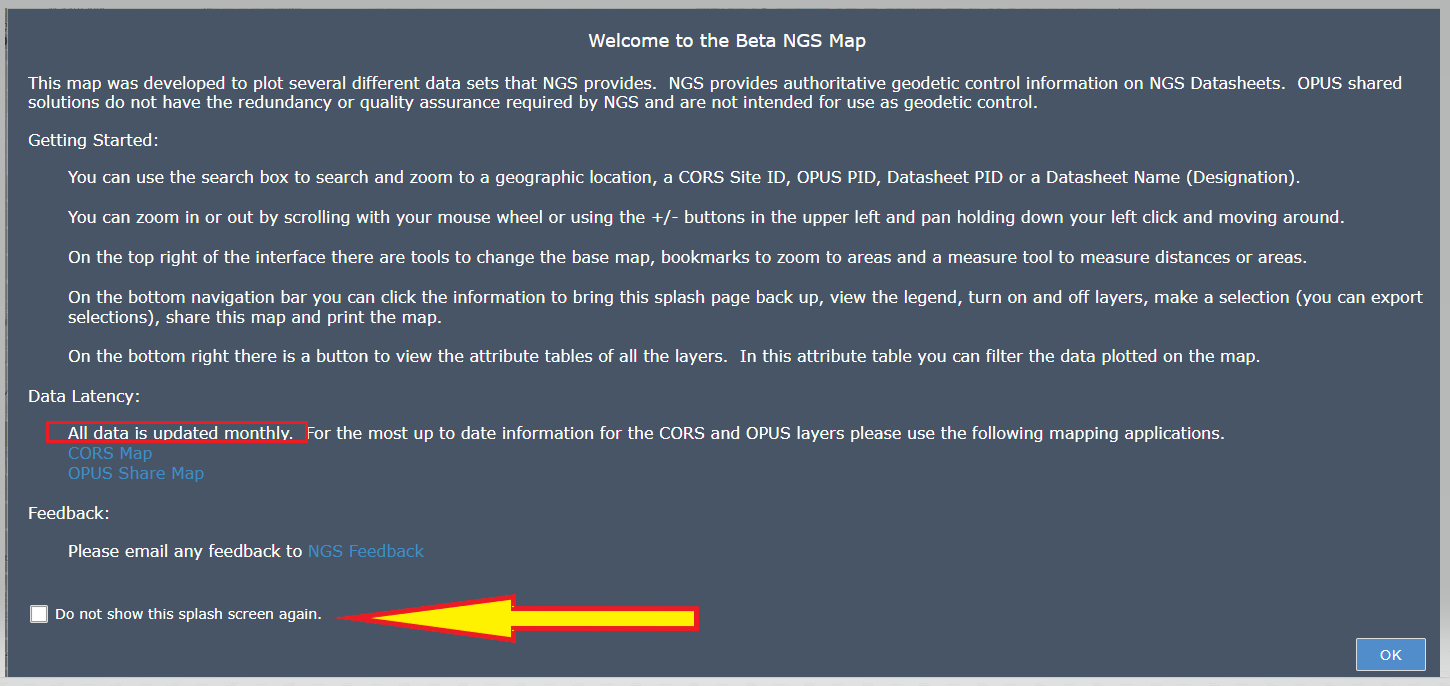
When you first click on the NGS Map link a short narrative appears that provides a brief set of instructions on how to use the map (see below). There’s a box that you can check so that the narrative will not appear every time you access the site. It’s important to note that the data for the CORS and OPUS Shared results are updated monthly. This could be an issue in some instances, therefore users should always check the NGS website for the latest information for the NOAA CORS Network or OPUS Shared map.
Beta NGS Map. (Image: NGS website)
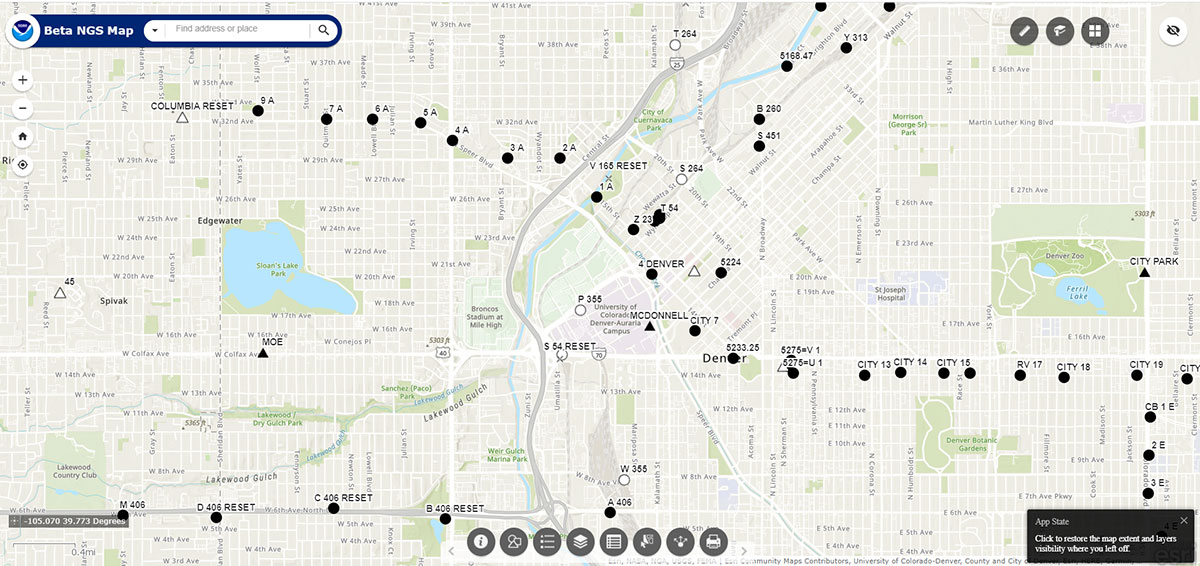
After you click OK at the bottom right of the page, a sample map will appear.
Sample map of Denver region. (Image: NGS website)
The map allows the user to type in a location (geographic location, CORS Site ID, OPUS PID, Datasheet PID or Datasheet Name) to start a search. See the “Waxhaw, North Carolina, Region” map as an example of entering a geographic location.
Waxhaw, North Carolina, Region. (Image: NGS Website)
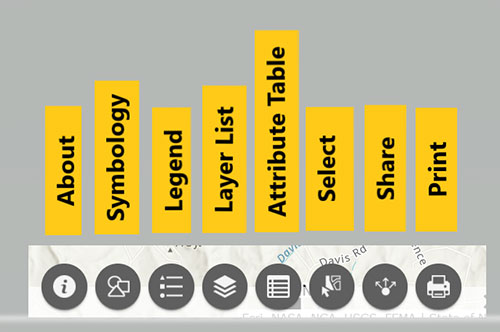
The bottom navigation bar has eight buttons.
List of buttons at the bottom of the map. (Image: Dave Zilkoski)
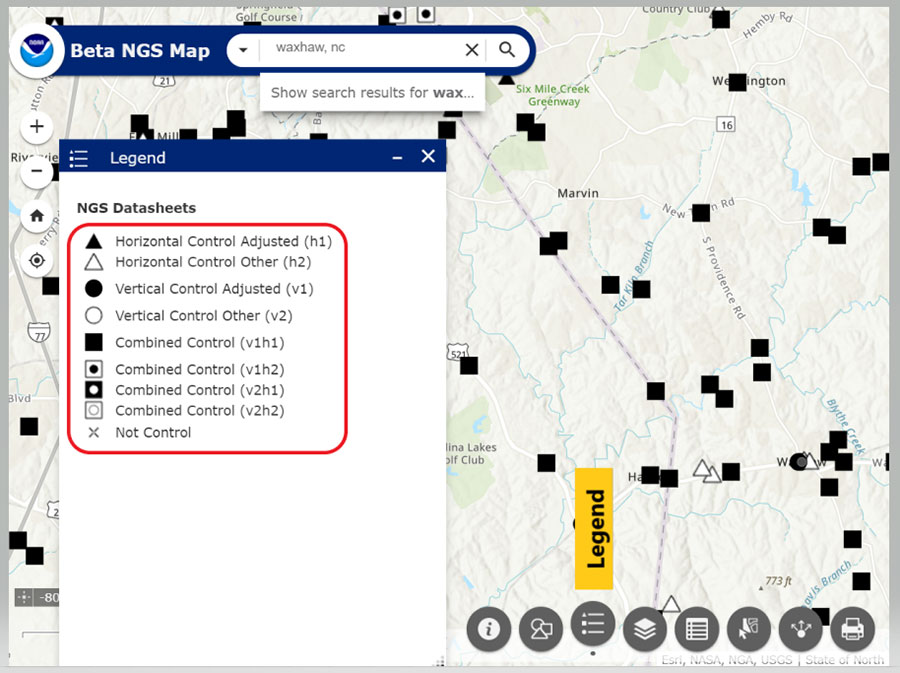
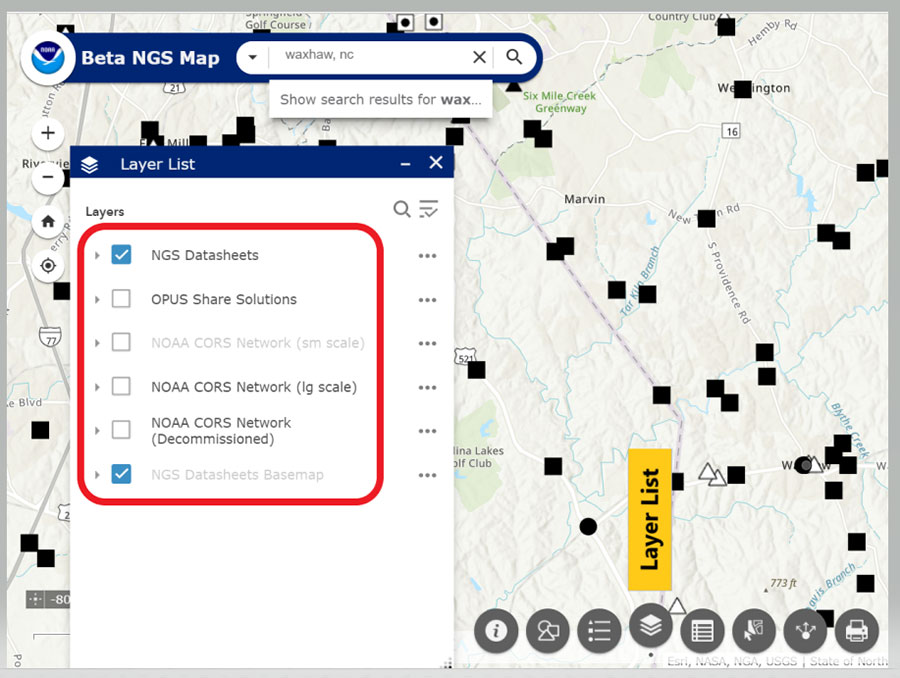
When clicked, a window pops up providing information about that particular button. (For example, see “Map with Legend Information” below.) The legend will include all layers that have been selected. In my example, the datasheet layer was the only layer I had selected (see “Map with Layer Information”.)
Map with legend information. (Image: NGS Website highlighted by Dave Zilkoski)Map with layer information. (Image: NGS website highlighted by Dave Zilkoski)
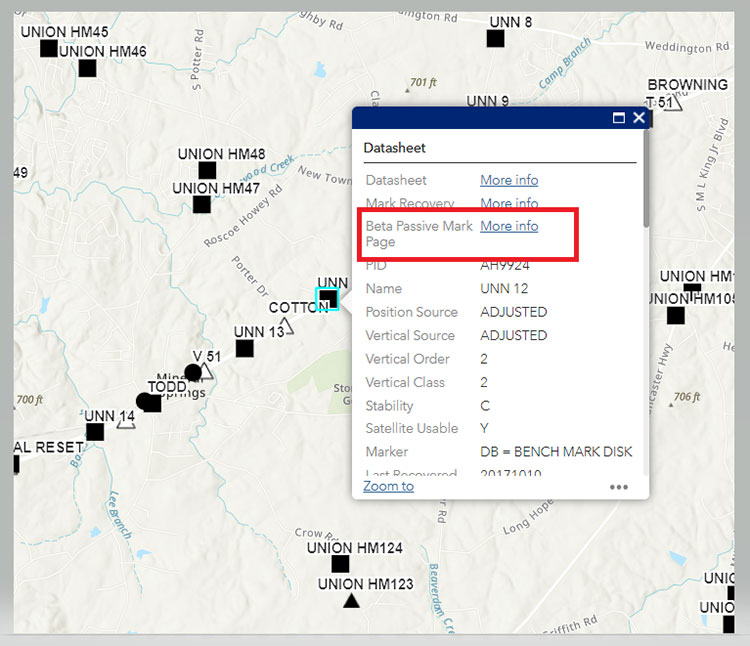
When the user clicks on a symbol, a box will appear with information about the mark. See “Information for Station UNN 12” below.
Information for Station UNN 12. (Image: NGS Website)
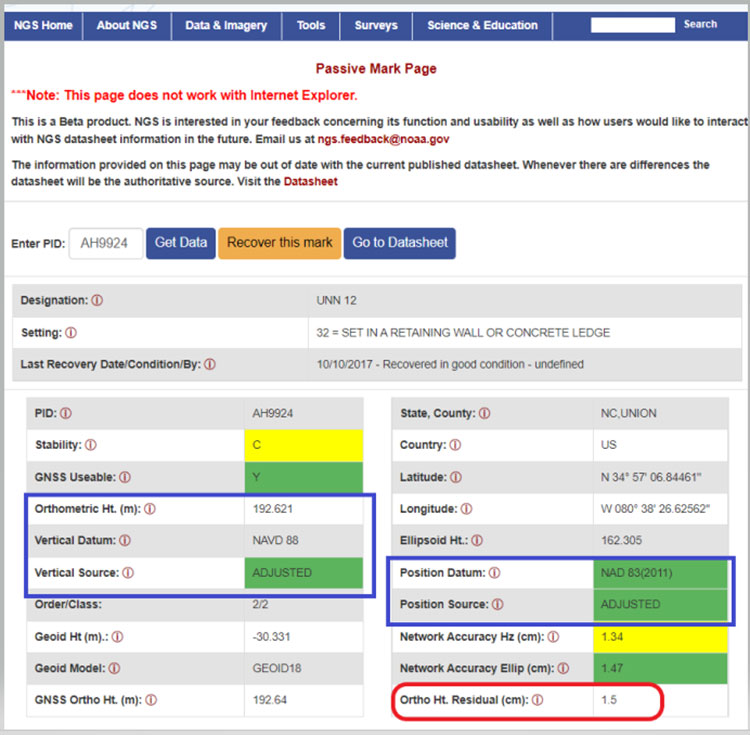
The box contains information from the NGS datasheet as well as a link to the actual NGS database. A nice feature of this webtool is that it provides a link to NGS’s Beta Passive Mark webtool. My October 2020 Survey Scene column highlighted the features of the NGS’s Passive Mark tool. The box captioned “Passive Mark Page for Station UNN 12” is an example of the tool. I’ve highlighted several items important to individuals planning surveys, such as the mark’s coordinates, datums and source, and the Orthometric Height residual (the difference between the estimated geoid height and the modeled hybrid geoid height).
Passive Mark Page for Station UNN 12. (Image: NGS website)
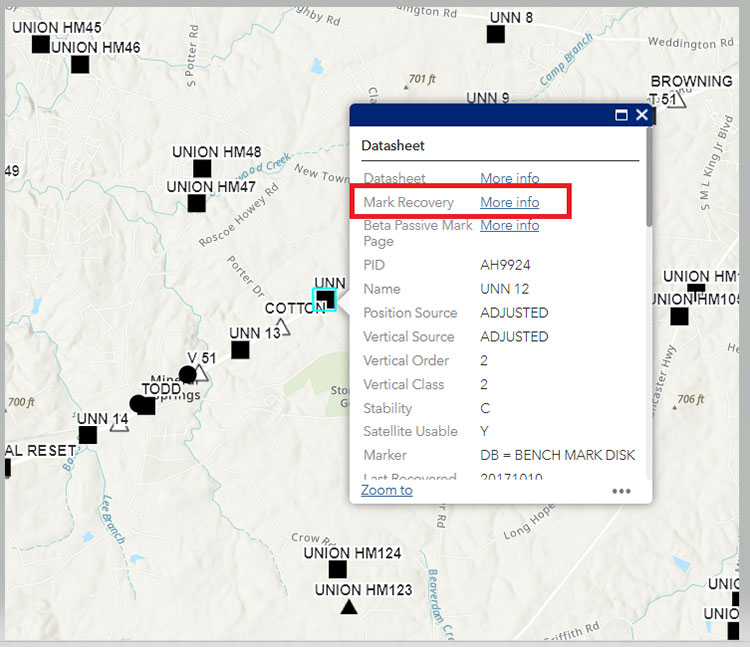
Another great feature is that the user can click on the Mark Recovery link to provide the latest recovery information for a mark (see the box titled “Mark Recovery Link for Station UNN 12 “).
Mark Recovery Link for Station UNN 12. (Image: NGS website)
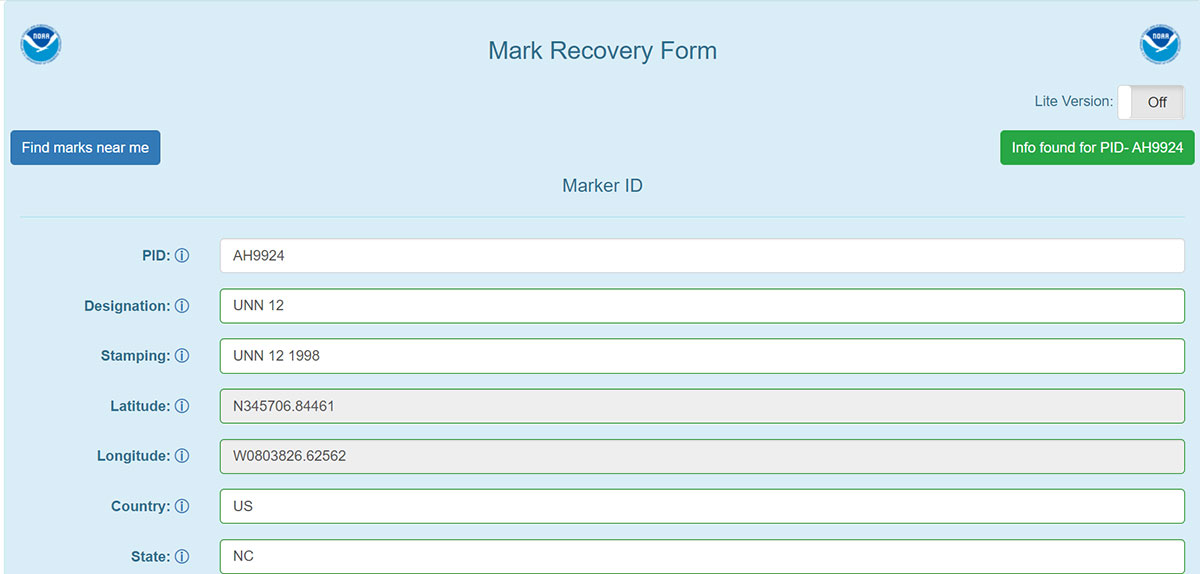
When a user clicks on the More info link for the Recovery Mark option, a Mark Recovery Form is provided for the user to enter the recovery information for the mark. The routine fills in the fields based on the current data in NGS’s database (see the box titled “Mark Recovery Form for Station UNN 12”). The user can enter changes or new information about the mark. This information is very important to users planning surveys. Just because a mark has been occupied by GNSS in the past doesn’t mean that it’s still a good station for occupation by GNSS. The environmental conditions around the mark could have changed since the last time it was occupied; for example, new buildings and/or growth of trees may now obstruct the GNSS signals.
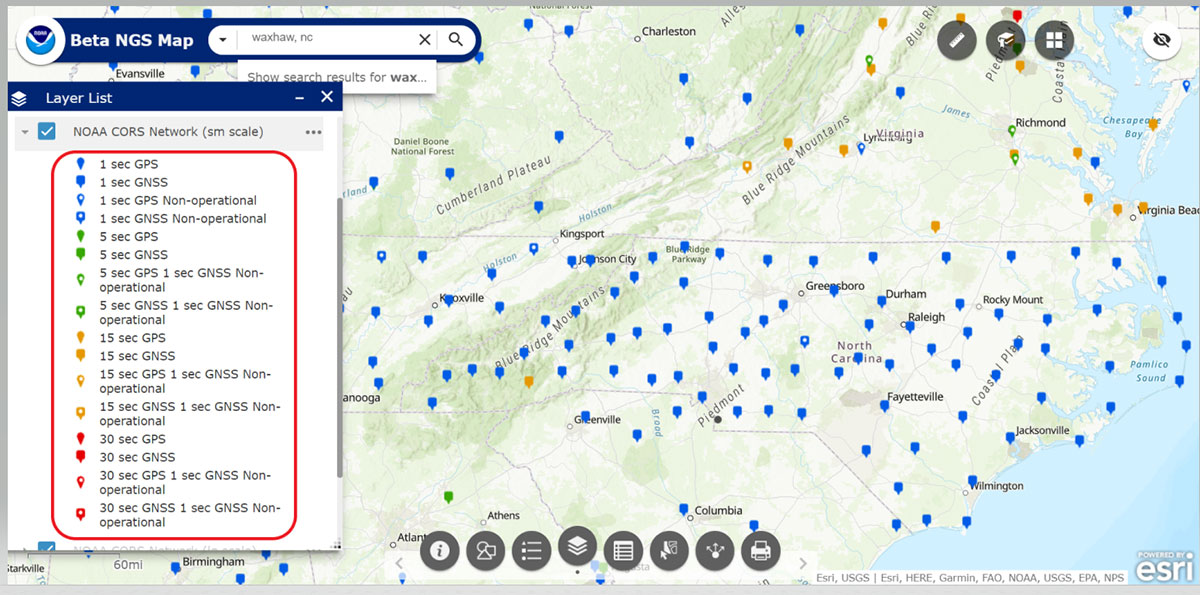
As previously stated, the NOAA CORS Network is one of the layers available. The box titled “Map of NOAA CORS Network in the North Carolina Region” depicts the locations of the NOAA CORS in North Carolina. The layer list provides some of the attributes of the CORS, such as the sampling rate and which GNSS signal are collected at the site.
Map of NOAA CORS Network in the North Carolina Region. (Image: NGS website)
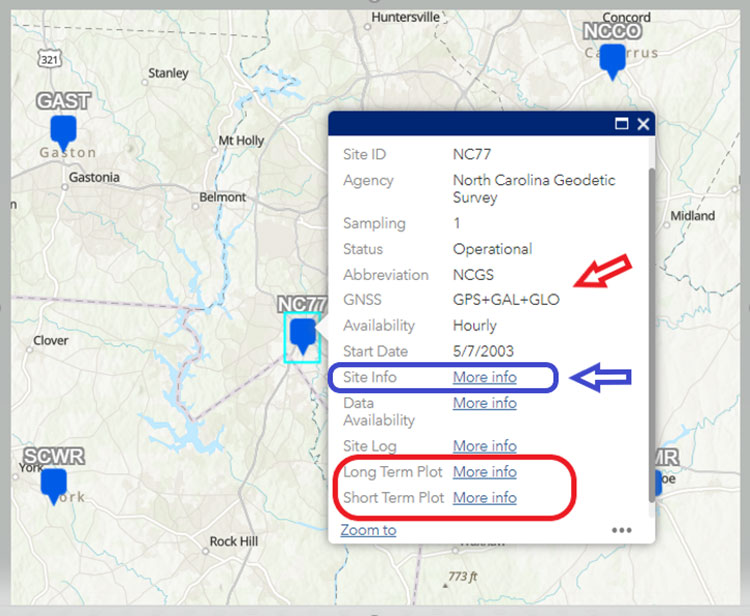
When a user clicks on a specific CORS, a box appears with information for that particular CORS. I’ve highlighted several items in the box titled “Information on CORS Site ID NC77.” In my example, CORS NC77 collects GPS, Galileo,and GLONASS data. Also, users can obtain long-term and short-term plots of the CORS.
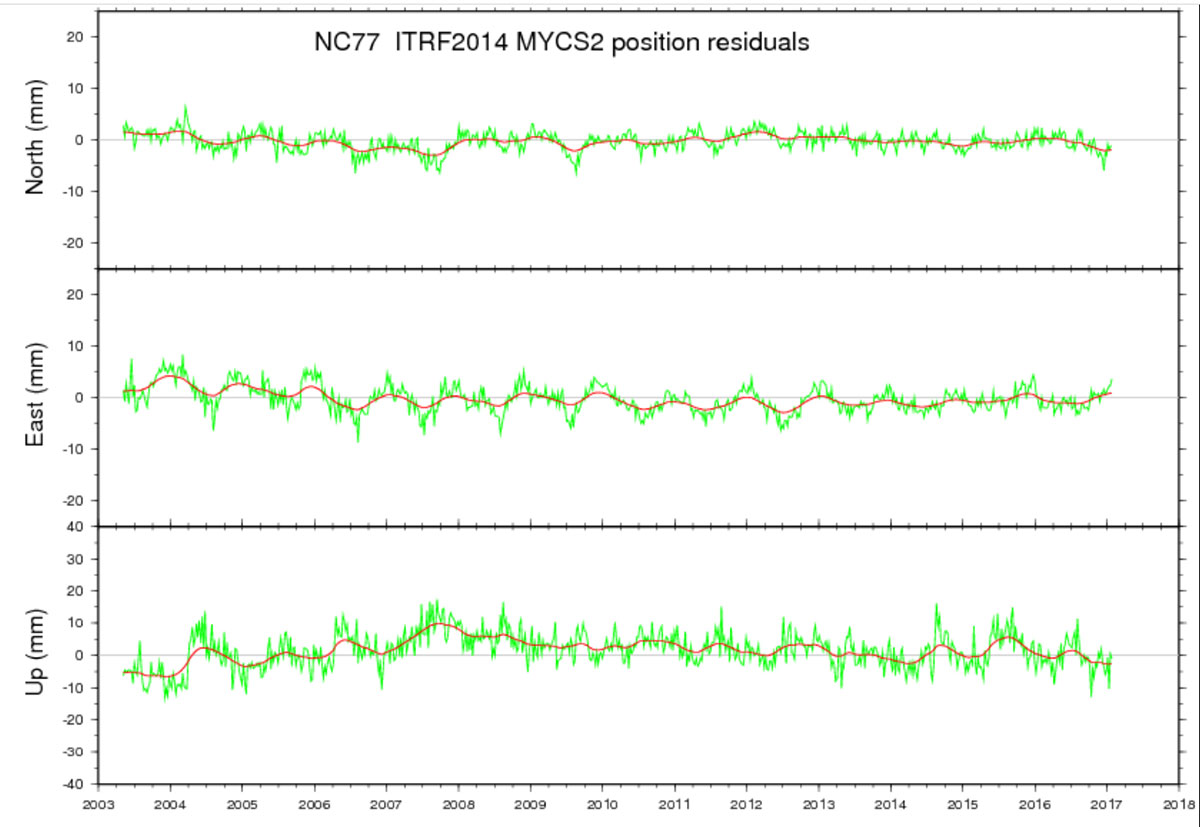
Once again, this feature is important to users planning and performing GNSS survey projects. As in the other features, clicking on the More Info link will bring up the plots. The plots for CORS NC77 are provided in the boxes titled “Long-Term Plot Information on CORS Site ID NC77” and “Short-Term Plot Information on CORS Site ID NC77” below.
Information on CORS Site ID NC77. (Image: NGS website)Long-Term Plot Information on CORS Site ID NC77. (Image: NGS website)
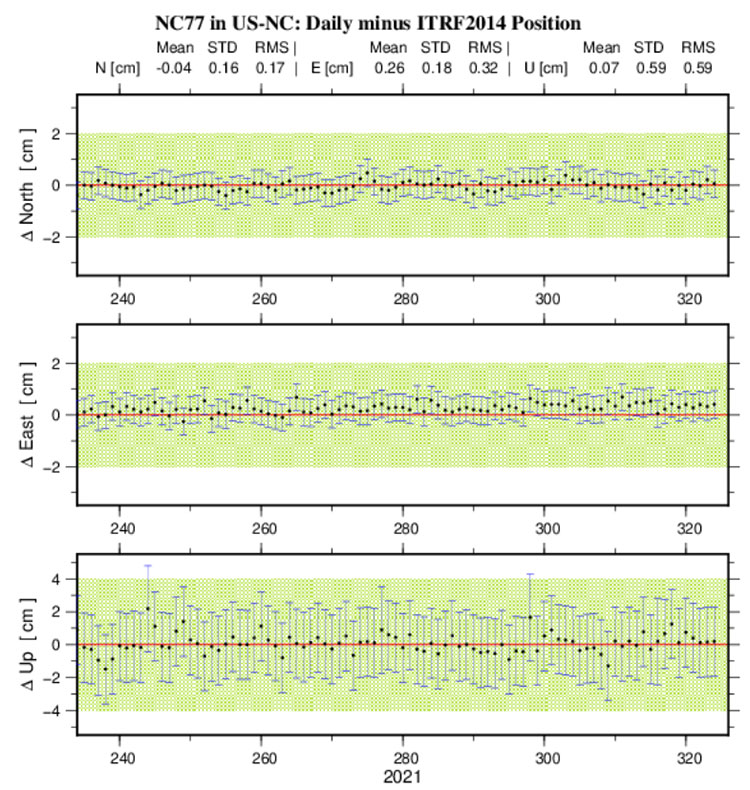
In the short-term plot, the red line is the published position, and the green hashed area is the tolerance of the NGS position, that is +/- 2 cm horizontal and +/–4 cm vertical. All the error bars are 1 sigma values. This information is useful when selecting NOAA CORS to be included in a survey project.
The short-term plot contains the mean, standard deviation and RMS values for the north, east and up components of the site. When planning a GNSS project, users typically identify several NOAA CORS to be included in the project. However, not all CORS are equal.
I evaluate CORS using the following criteria:
Designated as “operational”
Computed (i.e., measured) velocities rather than modeled (i.e., predicted) velocities.
“Consistent” data depicted in short-term time-series plots.
Network accuracies ~1 to 1.5 cm horizontally and less than ~2 to 3 cm in ellipsoid height.
Clicking on the More Info button for Site Info of NC77 provides a webpage where most of this information can be obtained.
Before conducting any post-processing, the analyst should ensure that all CORS included in the project have data for all of the occupations and that the station’s short-term plots indicate stability.
Short-Term Plot Information on CORS Site ID NC77. (Image: NGS website)
Tool buttons are situated in the top right section of the map. Included are a measurement tool to measure distances between marks and areas, a bookmarks tool to zoom to areas, and a basemaps tool to change the basemap. See the box titled “Useful Tools.”
Useful tools. (Image: NGS website)
Some users may find the measurement tool helpful when planning a survey. The box titled “Using the Measurement Tool” is an example of measuring the distance between two stations.
Using the measurement tool. (Image: NGS website)
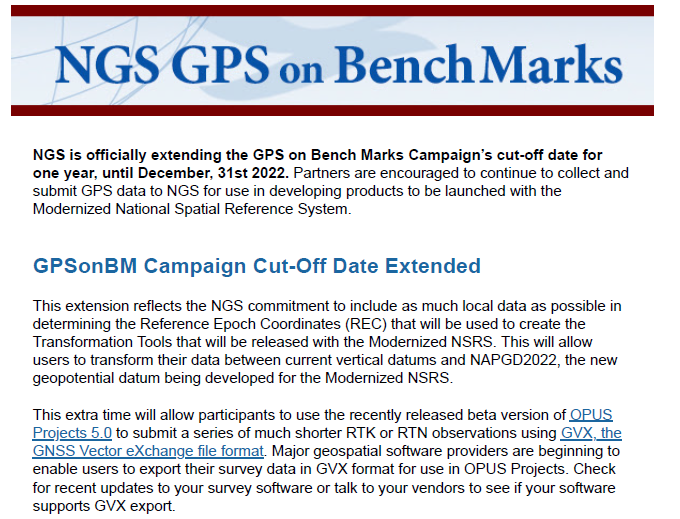
The last item that I’d like to highlight is that on Nov. 18, NGS has officially extended the GPS on Bench Marks campaign’s cut-off date for one year until December 31, 2022. See the box titled “NGS GPS on Bench Marks Notice.”
NGS GPS on Bench Marks Notice. (Image: NGS website)
NGS is anticipating that this extra time will allow users to provide additional GPS on Bench Marks data using the recently released beta version of OPUS Projects 5.0.
As stated in the NGS news release, this extension reflects NGS’ commitment to include as much data as possible in determining the Reference Epoch Coordinates (REC) that will be used to create the Transformation Tools to be released with the Modernized NSRS.
I encourage everyone to try the new Beta NGS Map. As in all of NGS beta products, NGS would like users to try the tools and provide feedback on what they liked and what they didn’t like. They are trying to develop tools useful to everyone, but that won’t be possible unless they hear from users.
The surveying profession has experienced a plethora of advancing technology over the past two decades and it does not look like there will be a slowdown any time soon. From robotic total stations to laser scanning to the use of multiple GNSS constellations, the profession is constantly adapting these emerging technologies into a useful tool for daily applications. For most practicing surveyors, it is a challenge to keep up with not just the hardware of these advancements, but also with software, which is being developed in parallel. Have you tried to open and draw a simple figure in any of the industry standard CAD programs lately?
The complexity of these programs, while advancing the capability of many technical professions, forces even the casual user to maintain a regular habit of software education and training. While it may seem primitive to say that a practitioner is a “practicing” surveyor, on-the-job training never stops. Just when the profession thinks there are no more significant advancements, something comes out of left field that truly blindsides us. (See the adoption of UAVS by the surveying profession compared to the public sector…) What do I think will be one of the next “big things” to revolutionize surveying? The technology is already here, and we need to seriously get on board with adoption before we miss another opportunity to highlight the expertise of the profession.
VIRTUAL REALITY and AUGMENTED REALITY (VR & AR)
First, we need to know that virtual reality (VR) and augmented reality (AR) are different, even though many people use these terms interchangeably. The differences are as follows:
Virtual Reality (VR)
VR is a virtual world generated by computers and programming.
VR is a closed environment that is fully immersive.
VR requires a device (specialized glasses and/or a headset).
Users in the VR experience are limited by the programming and their computer’s abilities.
The VR experience may be based upon real-world conditions but is a fictional setting.
Users of VR can travel and experience conditions in real and fictitious places.
VR can allow users to have experiences that are not physically possible in the real world.
VR is 75% virtual + 25% real (industry “rule of thumb”)
Augmented Reality (AR)
AR is typically based on actual physical places.
AR is an open environment that is partly immersive.
In AR, the user controls the environment.
AR combines virtual elements and experiences with real world conditions.
Experiences in AR can be accessed by computer, tablet, and smartphones.
AR is useful for product visualization and evaluation.
AR is 75% real + 25% virtual (industry “rule of thumb”)
It is important to know these difference between the two technologies in order to implement the correct one for the task at hand. However, both will play an important in surveying for generations to come.
One of the surveyor’s biggest responsibilities is to complete an accurate site conditions model by topographic methods. Once the topographic survey is completed, site designers will utilize this information to create a unique project that works with the existing site conditions. Advances in CAD software and technology allow engineers and architects to design in 3D and blend the new site with the existing conditions, drainage, and utilities. These designs can be further refined into virtual reality models to give the project’s stakeholders a better indication of what the final product will be when construction is completed.
The key takeaway here is that the surveyor is responsible for delivering the existing conditions model. A model that accurately represents the subject site but in digital form enables the design of the project to be more efficient and realistic to meet the client’s expectation. Surveyers, however, will not use virtual reality as much as augmented reality, for many good reasons.
USES OF AUGMENTED REALITY TECHNOLOGY FOR SURVEYING
AR is still in its infancy. Because surveyors have an interest in the existing and proposed conditions of sites, the use of AR becomes an important tool for the future. Merging proposed information with existing site conditions can become the norm, but like many emerging technologies, the profession will need to learn how to embrace it.
To get a better idea of how the technology works and why surveyors need to consider using it, let us look at an application that showcases AR: Pokémon Go. Yes, the smartphone game app that took the world by storm in 2016 and captivated many “trainers” to search the streets for Ultra Balls and characters. (There are still more than 100 million active players worldwide.) Players of all ages have continued to search for elusive items and characters in a high-tech scavenger hunt that is constantly changing, and all based upon the real world around us. By merging a real-time view with game entities at random geographic locations, players move about our world using one of the best examples of AR.
How does this apply to the surveying profession? Surveyors could utilize AR in everyday tasks but that would require having a fully developed 3D design model that could merge with the existing conditions in their visual device. There are a variety of devices for utilizing AR, including smartphones and tablets. Many of the new data collectors running Windows and Android operating systems can also be used for incorporating AR into the field operation. Here are some examples of AR how can be utilized for surveying tasks:
While construction staking, AR can be used to assist with structure and improvement location. A quick visual check can help confirm staking calculations are consistent with engineering design.
Use AR to visually check installed improvements, including curbs, utility structures, and paving. Any deviation from the proposed design should be quite evident.
When establishing property corners, AR will help the field crew quickly determine whether the calculated location is accessible. This can be used for staking out pre-calculated boundary points and/or proposed lot corners in a new subdivision.
Here are a few ideas as to how surveyors could utilize AR in everyday tasks in the future:
As public utilities are becoming more available within GIS shape files with geographic locations, they could be utilized with AR to help visually establish locations in the field. Mainline utilities and service lines would become easier to physically verify using AR.
Another GIS shapefile entity, the parcel line layer, could be used to help the surveyor understand where the property owner believes the line(s) to be as opposed to the actual monumented location.
All reference monuments and benchmarks established by public agencies using geographic location information could enhance the “treasure hunt” of confirming local datum points.
SURVEYING USING AR TO PROTECT THE PUBLIC
Geospatial information has revolutionized our world, so using AR to help when trouble strikes can potentially be a lifesaver. Recently, an oceanfront condominium in Florida collapsed due to structural failure. While the age of the structure precluded it from having any digital geographic location data, any new similar development could be measured and recorded to assist with future emergency needs. Almost all new development has digital surveying, engineering, and architecture and must use local horizontal and vertical datums. Using the proposed information and verifying with post-construction record drawings, the digital record can be created.
It doesn’t take a design flaw to create a public hazard. For instance, a gas leak could render any building, such as the Florida condo, susceptible to catastrophic damage. By having a digital model of the underground structure, emergency crews could use AR to help locate potential open spaces in the building. As is the case with installing fire suppression systems and emergency exits, the cost to create a digital model of a completed building will be well worth it to save lives.
Underground utility corridors within cities, campuses, or manufacturing facilities could also utilize geospatial locations to establish a digital map for future use with AR. It will take time and significant cost to map existing facilities, yet it should be required for new sites to provide this information for emergencies and for use when designing expansions within the site. Having this utility information to use with AR during the design phase could lead to identifying potential problems before construction starts.
Haiti after an earthquake. (Photo: 1001nights/E+/Getty Images)
Another reason to plan for future safety is how much uncertainty we face in today’s society. At press time, we are coming up on the 20th anniversary of 9/11. We also just watched Haiti suffer another devastating earthquake. The 2021 hurricane season has also been very active, so that danger looms large, too. Disasters happen all the time with little to no warning. Our world is much more advanced than we were at the turn of the century, so we can use these advancements to map our infrastructure. Let us hope we never need to use the digital information for another disaster akin of 9/11. Instead, let us use it to ensure that we can get to someone in a remote spot if necessary.
THE ROAD TO FUTURE MAPPING AND AUTOMATION
As previously discussed, establishing a digital twin of our world could help provide a better map for establishing parcel ownership, reducing construction conflicts, and offering better planning tools for future expansion. Will it be completed within my lifetime? No, and I doubt it will be done within the next couple of generations after me.
We can, however, get a significant start on capturing the necessary information to begin the process of digitization. Technology has exceeded my expectations just within the past decade, so I can only hope that more advancements will help with building this digital beast. More architects and engineers are utilizing BIM (building information modeling) for 3D design and collaboration. Most municipalities and counties have built some form of GIS that uses one of the standard geographic datums. Surveyors have fully embraced GNSS technology so state plane and national geographic coordinate systems have become the norm. In addition, we are seeing a wide number of consultants use autonomous vehicles (aerial, hydro, and terrestrial) with photogrammetry, LiDAR, and SLAM remote sensing. Another bit of good news is that computing power is higher than ever and that storage space is cheap for all this data. We should also include how 5G has expanded our reach and, with cloud storage, we can work from just about anywhere. We can do so much more than most of us ever dreamed of, so we need to leverage that into creating a digital entity that can be helpful.
Photo: RyanJLane/E+/Getty Images
HOW TO IMPLEMENT THE LATEST TECHNOLOGY
Augmented reality is one of many new technologies surveyors need to introduce into their toolbox. Many of you may be asking where to begin; my answer, depending on your age, may offend you.
Hire a Gen Zer. Really.
As a Gen Xer, I have come to realize my limitations on technology and being able to fully implement it. The Z generation, while lacking the experience of us wily old guys, see things much differently. The smartphone/tablet/computer, and even the latest data collectors, are designed with them in mind. They grew up playing computer games based in virtual reality, developed excellent hand-eye coordination, and find efficient ways of getting things done. Our surveying world is almost completely digital (when is the last time a client only wanted paper copies of a plat?), so now is the time to make the leap and ditch the drafting table. We have as much to learn from them as they do from us. Together, we can get the surveying profession ready for the next generations. It has been a great profession for us, so let us hand it off to the Z generation. They will (eventually) be glad we did.
GNSS signal convergence means significant time savings for surveyors
Photo: Trimble
Trimble has announced enhancements to its Trimble RTX correction services, tailored to meet the evolving needs of geospatial professionals and part of an ongoing strategy to deliver high-accuracy correction services to users worldwide.
Enhancements are designed to reduce convergence times, provide more reliable and robust signals, and make the workflow for surveyors easier. The enhancements further enable geospatial professionals to untether from the cost and complexities of GNSS base stations and complete fieldwork faster.
Surveyors in many regions worldwide can now spend less time in the field with CenterPoint RTX correction service, converging in typically three minutes compared with up to 15 minutes in the past. The breakthrough convergence-time reduction is available on Trimble GNSS receivers with ProPoint technology and will benefit land surveyors working around the globe by enabling them to start surveying faster.
In addition, CenterPoint RTX now supports the BeiDou III (BDS-III) constellation, which contributes to convergence time improvements. Support for BDS-III and convergence time improvements is available globally via IP/cellular and regionally via satellite delivery. Convergence times for the CenterPoint RTX Fast regions remain unchanged at less than one minute. CenterPoint RTX Fast coverage is available coast-to-coast in the U.S. and Western Europe.
Geospatial professionals will be able to work more reliably in challenging GNSS environments, such as urban multipath or under tree canopy, due to the addition of BDS III and GPS III satellite signals into the Trimble RTX solution. Even as GNSS satellites are retired and new ones become operational, Trimble RTX will consistently track and deliver robust and reliable corrections.
Using a Trimble receiver with ProPoint technology with Trimble Access field software and CenterPoint RTX correction service, surveyors will benefit from a streamlined workflow that simplifies how they work in their local coordinate systems. Surveyors can collect data using CenterPoint RTX correction service without the need for a site calibration or an offset.
“Our teams collaborate to continually improve the Trimble RTX-based real-time correction services integration with our geospatial solutions,” said Ron Bisio, senior vice president of Trimble Geospatial. “Surveyors worldwide rely on Trimble to develop products and services that help them get their work done quicker and easier, and this Trimble RTX update is another example of how we continue to deliver surveyors the tools they need to do their jobs even more efficiently.”
“We are celebrating 10 years of providing Trimble RTX-based correction services and each year our services outperform the year before,” said Lisa Wetherbee, general manager of Trimble Advanced Positioning. “We continue to enhance the performance and overall customer experience to help geospatial professionals increase their productivity and provide them peace of mind that our services and people will be there for them around the clock.”
Trimble RTX subscriptions for Trimble RTX-compatible GNSS receivers are available through Trimble’s Authorized Business Partners or Trimble’s online store.
Earlier this year, we looked back at 2020 and reviewed how surveying has dealt with the worldwide pandemic while adapting to the new tools and technology being created. We discovered the need for surveyors did not diminish during this crisis, and in many places the demand has gone up significantly. Instruments, computers and measuring methods continue to increase in capability and complexity to help with the shortage of qualified field crews, yet we still need to expand our efforts to find the next generation of surveyors.
How do we find those future geospatial experts, data collectors and surveying professionals? The answer is right under our noses, and our current group of practitioners needs to get the word out.
What is the word, you ask?
Technology.
Younger generations understand technology better than most practicing surveyors. New devices, methods and operations are being invented at a fast pace, and our best and brightest should be considering using that technology in a rewarding career. Before we make the big pitch to them, however, we should refresh our understanding of recent surveying history to better understand why technology is a good thing.
How did we get here? A short historical look at measuring
The measurement methods, devices and instruments used by surveyors have radically changed in the past 50 years, and we have covered their evolution in past columns (Survey SceneMay 2016, May 2017 and Sept. 2019).
Instruments and devices used by surveyors vary in their function and output of information. Some are used to physically measure the distance from a stationary point to another, determine horizontal and vertical angles at a specific location, or determine grade differentials between various points. Other instruments are used to determine horizontal or vertical positions to establish locations and elevations. All these instruments are being used to gather positional data on any number of items, but the quality of the information may vary depending on the technology and method used. How?
Devices and methods for measuring distances
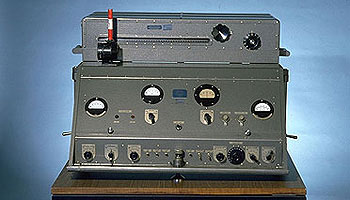
AGA Geodimeter NASM-2A. (Photo: NOAA)
Tools for measuring distances have been around for centuries. The Egyptians are famous for their “rope stretchers,” while early surveyors in Europe and the New Colonies were known to use the Gunter’s chain and a measuring wheel. In the early 1800s, steel tapes were invented to replace the chain. These measuring tapes continued to evolve well into the 20th century with varying metals, fiberglass and nylon-coated plastics.
In the mid-20th century, scientists and physicists began to experiment using light waves as a means of measuring terrestrial distances. These experiments led to the development of the first electronic distance meter (EDM), commercially produced by the Swedish company Svenska Aktiebolaget Gasaccumulator (AGA) in the early 1950s. Other methods of electronic measurement, including microwave and infrared wave technology, were also developed in the years following the introduction of the lightwave EDM.
For many years, the EDM was used independently from transits or theodolites to measure long distances. For those who needed to consistently measure long distances, the invention of the EDM was not just a time saver, but also provided much higher accuracy than manual measurements.
Other technologies were developed in the latter part of the 20th century, introducing the surveyor to laser scanning, but we can defer this topic until later in this column.
Devices for measuring angles
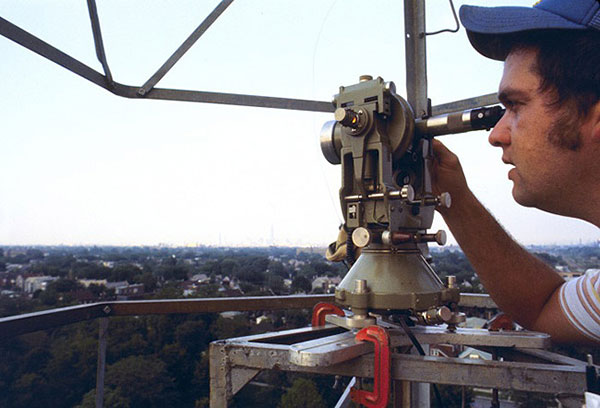
The T3 theodolite was introduced in 1925. With its 10.5-inch telescope, this theodolite had a range of up to 60 miles. It saw heavy use between 1952 and 1984. (Photo: NOAA)
The surveyor, like the astronomer, has consistently been at the forefront of developing optical instruments. The key has been combining high optical quality with a means of measuring horizontal and vertical angles within the instrument. The creation of the theodolite and the transit revolutionized the ability of the surveyor to accurately measure angles and apply trigonometric functions to determine mathematical computations. In addition, the surveyor’s compass was also developed to assist with angle measurement — with less accuracy but greater flexibility.
By the 1920s, optical theodolite technology was rapidly improving through the work of Switzerland’s Heinrich Wild. Beginning with the T2 and T3, these instruments provided accuracy and precision not previously available to the surveyor. Other manufacturers followed suit with similar instruments for the next several decades and were used in conjunction with the EDM for larger surveys. Anticipation grew with the competition to see which instrument company could marry the theodolite and the EDM into one easy-to-use, yet accurate, optical instrument.
Introducing the total station
By the late 1960s, technology had firmly entered the surveying world with a few electronic advancements. In 1968, Zeiss — a German company known for its lenses and optical systems — produced the first known tachymeter, combining a theodolite with an electronic distance meter. The tachymeter became better known as the total station, as it was capable of measuring angles and distances in one instrument. While somewhat crude and hard to use, the Elta 14 total station introduced the world to a future generation of surveying instruments that would revolutionize the field.
In the course of a few years, several manufacturers developed their own total stations. The biggest hurdle was combining the optics of the scope with the measuring axis of the EDM. By the end of the 1970s, most total stations were coaxial, therefore measuring angles and distances was done with one sighting.
Robotics were introduced in the early 1990s, with two servo motors to drive the horizontal and vertical movements of the total station. These movements were controlled remotely by the tracking system connected to the prism pole and data collector. Not requiring a human being to remain stationary and manually operate the total station provided cost savings and additional efficiency for the field crew.
Positions, everyone! Positions!
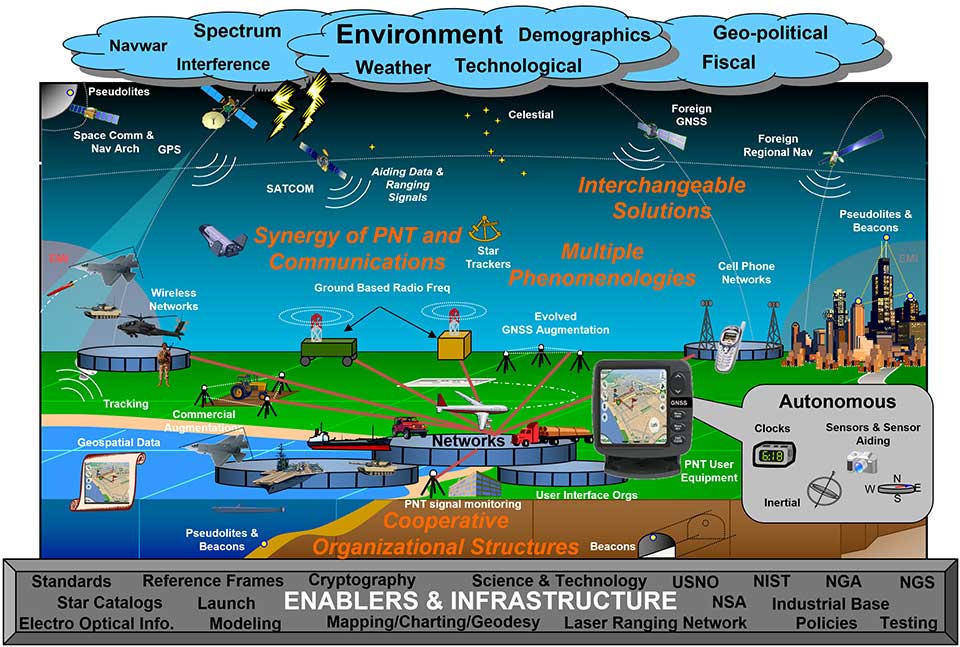
U.S. National PNT Architecture. (Graphic: U.S. Department of Transportation)
Positional measurement has revolutionized not just the surveying profession, but a large portion of everyday tasks as well. From monitoring travel times for your commute to providing your food-delivery driver with your location, position determination is the key element to these services. Satellite navigation is now the primary technology used for positioning, navigation and timing (PNT) and a big part of most aspects of surveying.
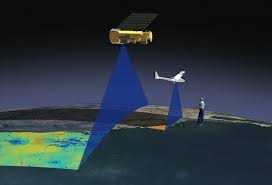
Remote sensing
Here is where we can discuss laser scanning and other remote sensing technologies. Remote sensing is the science and technology of gathering data from a distance. Traditionally this has been mostly done from aircraft, satellites and vessels. However, technology has expanded so that most practitioners now consider the use of laser scanning, lidar, photogrammetry, hyperspectral cameras, bathymetric sonar and simultaneous localization and mapping (SLAM) to be included in the category. Keep in mind that all these technologies are types of measurements; they are not the vehicle or instruments used for the measurement.
Image: NASA
These various sensor types can collect millions of data points in a short amount of time. While surveyors are adapting to working with point clouds and gigabytes/terabytes of data, it is a radical departure from our recent past using only total stations and GNSS receivers. Significant advancements in computer processing, data storage and programming have simplified the manipulation of point clouds, but they remain a challenging task for even newer surveyors to tackle.
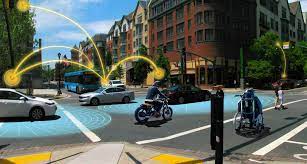
Autonomous vehicles
Hobbyists have been building (and crashing) model airplanes and helicopters for many years. Most of the public does not realize that the big advancement in remote-control aircraft was the introduction of GNSS technology into the flight system. Sure, we all have GNSS receivers in our phones, but now to be included in our toys? This somewhat simple addition has turned unmanned aerial vehicles (UAV) into a revolutionary tool for several occupations, not just surveyors. More control and stability of the UAV means expanded uses for emergency personnel, utility providers, parcel delivery and much more. Being able to program a specific flight provides the UAV user with higher accuracy and precision, but it takes away the element of human control.
Image: Department of Transportation
Another vehicle gaining market share is the unmanned surface vessel (USV), used for performing hydrographic surveys. Like its UAV cousin, the USV is autonomous and is programmed to follow a specific route for greater accuracy and precision. Because of the shallow draft of a USV, it can be used in many areas deemed inaccessible by manned vessels.
An additional aspect of newer technology working with autonomous vehicles is collision avoidance systems. These systems have been implemented on newer UAVs and continue to improve, allowing their the use in tighter confines and spaces. By having a radar-based avoidance signal surrounding the entire UAV, collisions become less likely.
Geofencing is another advancement being implemented into more UAVs to help keep them from intruding into unauthorized spaces, by programming into their computer specific geographic areas that are off limits. UAVs are often also programmed to return to its takeoff location under certain circumstances.
Other technological advances to consider
Image: State Department
How much technology do you have in your home and office? Probably more than you realize. While one may immediately think about a smart speaker or home automation system (Alexa, Echo, Nest, etc.), other components offer simple yet productive solutions.
Remote control systems enable you to check whether your doors are locked and your garage door is shut. If not, a touch of a button does the job. Motion sensors enable you to detect intruders around and inside the house, of course. Environmental sensors now monitor for water leaks, moisture and gas/carbon monoxide and provide alerts. How about home automation that utilizes robotic technology? The Roomba vacuum, automatic pool cleaners, and even window washing systems activated when dirt is recognized on your exterior windows are just some of the robotic devices in the modern home.
Precision agriculture utilizes autonomous vehicle control to increase the precision of planting, spraying and harvesting crops. This increase in efficiency has led to higher yields and lower operating costs for the equipment. Another market starting to see more interest is the robotic lawn mowers that functions like the Roomba vacuum. While significantly more expensive than manual mowers, they offer features that can be considered for trade-offs for your time. Depending on your location and needs, they can be set on timers to run day or night and return to base when their battery runs low.
Adapting today’s technology to tomorrow’s surveying tasks
Another relevant technology that does not fit into any of the topics above is the inertial measurement unit (IMU). These sensors are now routinely paired with GNSS receivers in UAVs to help them compensate for pitch and roll. Because of their small form factor, IMUs will increasingly be incorporated into other measurement devices.
It is also safe to say that more handheld devices and smartphones will include lidar scanning capability, as the iPhone 12 Pro and iPad Pro already do. Application and software developers are writing code to make use of data from these devices, so plan on other hardware makers following Apple’s lead.
Voice and motion control will continue to be integrated into data collectors and workstations. By minimizing physical entries into an input system, computers will begin to recognize patterns and automate procedures to increase efficiencies. Programmable voice commands during field data collection will activate various procedures (for instance, specific roadway cross sections or curb island locations) and walk the user through a predetermined set of steps. The possibilities are endless, but we should prepare to take advantage of the technology.
Enticing future generations into a geospatial career
Image: Digital.gov
A geospatial career is so much more than just being a surveyor. Our profession needs bright minds who see the world differently. What does that mean?
Most surveying and mapping tasks used to produce 2D deliverables on paper. Today’s geospatial technicians fly UAVs, use point clouds, draft existing conditions in 3D, and analyze data for future applications. By applying what they are learning with new devices, technologies and software platforms, our younger generations can help the surveying and geospatial profession evolve into a data-rich environment that helps facilitate change for our planet. These efforts can help with climate change, provide better data for our communities, and bring societies back together.
Our profession is much more than gathering data; it is helping to make our world a better place through better data analysis and knowledge. Who would not want that?
NavVis has launched NavVis IVION Core, a reality capture platform for management of 3D scans with intuitive tools for creation, collaboration and publication. Previously known as NavVis IndoorViewer, NavVis IVION Core makes mobile mapping workflows more efficient, speeds up model creation and delivery, and adds value to data, the company said.
“NavVis IVION Core represents the future of reality capture software,” said Lisa Cali, head of Product Web and Cloud at NavVis. “We want to offer our users a next-generation platform that not only transforms their mobile mapping workflows but also extends them so that they can do more with their spatial data.”
With all the existing features of NavVis IndoorViewer, such as point cloud downloads and virtual measurements, NavVis IVION Core offers a refreshed look and new features and improvements.
Enhancements are expressly designed to support laser scanning service providers, surveyors and AEC companies. These include multi-site functionality, updated user management, and site coordinate systems for survey-grade geo-registration of data.
Multiple sites, one space. The multi-site functionality means users are able to host multiple sites, including several buildings, in one instance. The new home screen displays a map view with markers showing the location of each site. It’s easy to navigate and provides the user with a clear overview of each site or project across the globe, with quick switching between sites from the central dashboard. Each site has a unique website address and user permissions, providing complete control over site usage.
Updated user management system. This improvement gives users more clarity and control over their projects. Admins can grant specific access and permissions for each site and get an overview of the permissions of each user. From an editor to a visitor, accessibility and permissions can now be set easily and viewed clearly from one instance.
Site coordinate system. Users can now enter the latitude and longitude or a custom spatial reference system, allowing for survey-grade geo-registration of data. Selecting a site coordinate system also ensures that data is aligned to the exact location of a site, making it easier and faster to upload and download data.
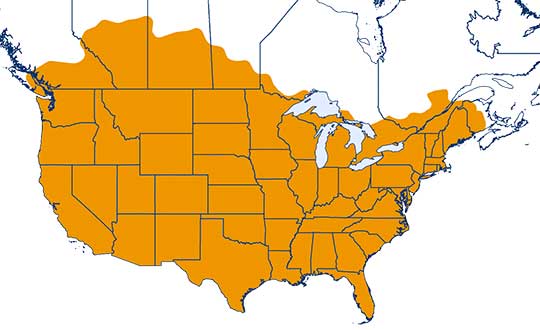
One-inch GNSS accuracy in under a minute, delivering seamless high-precision performance across the U.S. and southern Canada
Trimble has completed expanding its CenterPoint RTX Fast correction service, with coverage now spanning the contiguous U.S. and southern Canada. This expansion is central to Trimble’s vision to transform how and where users can leverage precision and accuracy.
Coverage of Centerpoint RTX Fast. (Image: Trimble)
Designed for autonomous applications in both on-road and off-road markets, the coverage and performance of the service enables industry professionals to re-think what is possible when using augmented positioning for improving safety, performance, productivity and operational efficiency.
The CenterPoint RTX Fast subscription service delivers horizontal positioning accuracy of 1 inch (2 centimeters) or less in under a minute, with the versatility of satellite or cellular delivery. This expanded coverage makes it the largest, high-performance GNSS correction network in the world, according to Trimble.
Base stations not required. The service encompasses more than 5 million square miles across North America and Europe. By using the service, said Trimble, farmers, land surveyors and GIS professionals can untether from the cost and complexities of GNSS base stations.
In addition, Trimble RTX Fast offers a single, continuous correction technology platform for enabling a broad range of safety-critical autonomous applications in markets such as automotive, agriculture and construction.
“This achievement is a major milestone in the continuous evolution of our correction service and autonomy strategy. We are delivering unmatched access to fast, reliable, highly accurate positioning in more areas than ever before,” said Patricia Boothe, senior vice president of Trimble’s Autonomy Sector. “Whether enhancing performance in the autonomy ecosystem or simplifying traditional mapping and surveying workflows, RTX Fast users can gain greater accuracy to improve productivity and operate safely — ultimately transforming the way they work and drive.”
CenterPoint RTX Fast subscriptions for Trimble RTX-compatible GNSS receivers are available through Trimble’s Authorized Business Partners or Trimble’s online store.
Small businesses, including many surveyors, are being hit particularly hard by the current economic situation caused by the measures required to fight the COVID-19 pandemic because most of them do not have large cash reserves.
The CARES Act, signed into law on March 27, contains $349 billion to keep small businesses afloat. The funds are administered by the Small Business Administration (SBA) through participating banks.
Hundreds of thousands of borrowers have been approved for, or received, aid under the so-called Paycheck Protection Program, meant to give small businesses loans that would be forgiven if they were used to pay employees, rent, or mortgage principal. The program is one of four that the SBA is administering as part of the CARES Act.
The other three are the Economic Injury Disaster Loan (EIDL) loan advance, which will provide up to $10,000 of economic relief to businesses that are currently experiencing temporary difficulties; the SBA Express Bridge Loans, which enables small businesses who currently have a business relationship with an SBA Express Lender to access up to $25,000 quickly; and the SBA Debt Relief, which provides a financial reprieve to small businesses during the pandemic.
These programs — an unprecedented challenge for the SBA, which is already struggling with a surge in coronavirus-related loan applications through other programs such as its disaster loan program — were marred by technical and logistical glitches from the start.
On April 16, while many small-business owners were desperately trying to apply for loans, the SBA ran out of the relief money. Its website’s COVID-19 page announced: “SBA is unable to accept new applications at this time for the Paycheck Protection Program or the Economic Injury Disaster Loan (EIDL)-COVID-19 related assistance program (including EIDL Advances) based on available appropriations funding. EIDL applicants who have already submitted their applications will continue to be processed on a first-come, first-served basis.”
As of press time, Congress and the White House are negotiating the possible release of additional rescue funds.
Carlson Software has released its Scan2K Laser Scanner, a versatile, fast, easy-to-use solution for the creation of accurate 3D survey data up to a range of 2K (2,000) meters. Carlson introduced the product at the Pennsylvania Society of Land Surveyors’ 2020 Conference.
Carlson’s Bradley Husack, Special Projects Engineer, and Michael Hyman, Regional Director with the Scan2K at the Pennsylvania Society of Land Surveyors’ conference. (Photo: Carlson)
Built with surveyors in mind, the Scan2K is at home in the field with its weather-proof housing, user-friendly sunlight-visible touch screen interface with simple, menu-driven operations for quickly collecting and georeferencing point cloud data. With an integrated high-resolution camera, inclinometers, a compass, and an L1 GNSS receiver, the Scan2K can be deployed in many environments and orientations, including mobile operations.
Carlson’s partner on the Scan2K project is Teledyne Optech, a world leader in 3D survey systems. Carlson will be the exclusive global distributor of the OEM Scan2K solution.
“The Scan2K addresses the diverse range of applications for a laser scanner in the surveying and mining industries,” said Bradley Husack, a Special Projects Engineer at Carlson. “Carlson is bringing to market an all-in-one solution that now leads the market in versatility, speed, and value.”
The Carlson Scan2K has a simple, sunlight-visible touchscreen interface. (Photo: Carlson)
Beyond its impressive 2,000 meter range, the Scan2K also has short- and medium-range modes, as well as the capability to record over 500,000 points per second, all within the chosen scanning target window.
Additionally, each laser pulse from the Scan2K records up to four returns, providing the capability to record the first return for a blocking object (such as a leaf) as well as the last return for an object behind it (such as a wall), and the versatility to exclude one or the other.
The Carlson Scan2K comes bundled with ATLAScan software, a powerful yet simple solution for registering the point cloud, as well as Carlson Point Cloud Advanced for feature extraction into Carlson’s suite of CAD office products.
The Scan2K comes ready to be equipped with an additional external camera, an external GNSS receiver, or for mobile operation.
Whether on a tripod, a vehicle, or another moving platform, the performance offered by the Scan2K easily makes it a versatile terrestrial laser scanner for the market.
MicroSurvey Software, part of Hexagon, has released its new field data-collection software platform for Android users.
FieldGenius for Android, version 1.0, is first release of the company’s new multi-platform field software built on the Android platform. It supports most popular GNSS sensors on the market today.
FieldGenius is third-party, brand-neutral data-collection software used by many surveyors. The new release builds on decades of innovation MicroSurvey has invested into the original FieldGenius software, providing users with an easy-to-use and intuitive mobile data-collection software package for the next generation.
New features include dynamic data panels synchronized with the map views. A fresh user interface provides familiarity for existing FieldGenius users while offering new tools, simplified workflows and readily available data that surveyors require at the point of work to make informed decisions in the field.
“Surveyors, dealers, and distributors from every corner of the world have been demanding an Android based version of MicroSurvey FieldGenius for years,” said Marc Veinotte, global sales and OEM manager at MicroSurvey. “This is the first release of our new multi-platform field data collection software that will provide a consistent user experience across a wide cross section of data collection devices. MicroSurvey continues its hardware neutrality strategy offering support for almost every brand of popular and upcoming GNSS receiver on the market today.”
Early adopters of FieldGenius for Android will receive additional benefits and participate in the newly created MicroSurvey Technology Innovation Group (MTIG).