Dewberry, a privately held professional services firm, has been selected as a consultant to Civis Analytics to perform comprehensive data analytics, including flood hazard and property loss modeling and damage estimation, to support the city of Houston’s post-Hurricane Harvey recovery efforts.
Hurricane Harvey flooding in Houston. (Photo: FEMA)
The granular, structure-level understanding of this catastrophic flooding event will be critically important to the city’s efforts to catalog impacts and direct resources to the rebuilding and recovery efforts, Dewberry said.
The resulting data will be made accessible to authenticated city staff and non-profit organizations through the new Houston Estimation and Analysis of Loss (HEAL) platform. A cloud-based system that will be used in disaster mitigation planning, HEAL will aggregate data, analytics, tools and visualizations in a web-based environment available to city, state and federal officials and other stakeholders.
Hurricane Harvey flooding in Houston. (Photo: FEMA)
The data development effort featured a hindcast model of the historic Hurricane Harvey storm event, which dropped 51 inches of rainfall within the city of Houston and surrounding areas over five days in August.
The HEAL platform will provide the city with a comprehensive data collection and analytical architecture with the ability to calculate and report unmet needs at various levels, such as structure, parcel and census block.
The analytics will include extensive modeling to estimate flood depth and extent and the structural and contents losses created by it. Model validation will use a wide set of data from debris removal pickup locations, and community field data collection, to federal assistance information, as well as non-traditional sources such as social media videos.
Hurricane Harvey flooding in Houston. (Photo: FEMA)
For this complex project, Dewberry’s innovative approach has involved strong applications of science and engineering including meteorological data processing, 2D flood risk modeling, and damage assessment to replicate post-Harvey conditions in Houston.
Nearmap aerial imagery in ArcMap. (Screenshot: Nearmap)
The Shelby County, Tennessee, Emergency Communications District has implemented Nearmap high-resolution aerial imagery to geocode and plot new addresses and developments into its 911 mapping systems.
The mapping systems help fire and rescue, emergency medical services and law enforcement get instant access to updated maps needed to get to the right locations as soon as possible.
The Emergency Communications District is responsible for establishing local emergency telephone service, providing the network call-handling equipment, and updating the geographic information systems (GIS) data for each Public Safety Answering Point within Shelby County.
Nearmap provides frequently updated, high-quality aerial captures to ensure that the district’s GIS data, geocoding and the 911 mapping systems are up to date, providing public safety and law enforcement the most accurate information, the company said.
Benefits of Nearmap aerial imagery for the Emergency Communications District include:
The imagery is delivered through the cloud as a subscription service, making it accessible to all team members via mobile and desktop.
Nearmap imagery is taken at least twice a year, both leaf-on and leaf-off to provide different views of locations in different seasons.
Aerial captures integrate directly into Esri ArcMap, ArcPro and ArcGIS Online applications, so GIS information can overlay directly onto the high-resolution imagery.
Before Nearmap, Shelby County’s aerial image process required a contracted flight to photograph the county areas. Because of the high cost of capturing those images, the county purchased images once every two years, after pooling resources from various county entities.
“With our old aerial imagery provider, there were issues with mosaicking separate images together, and since the imagery was taken every two years, many rural and unincorporated areas were out of date,” said Timothy Zimmer, GIS administrator for Shelby County’s Emergency Communications District.
With out of date images, the county had to develop alternate methods to locate addresses for the 911 systems. Now, the combined impact of data services, base maps, Nearmap imagery and third-party data are improving all aspects of public safety, including law enforcement, fire and emergency medical services, Nearmap said. Even other agencies are using the district’s imagery and GIS data.
“There’s a certain context and currency you can get from Nearmap imagery that you simply can’t get from any other imagery products,” Zimmer said. “Other agencies, such as the County Clerk and the Utility Company, are using our addressing data because Nearmap has helped enable us to be much more current.”
GIS is growing in importance to urban development, whether for environmental impact studies, geofencing or building information modeling (BIM). Sharing GIS data with developers is critical to a coordinated approach to smart city growth.
By Christine Easterfield, Principal Analyst, Cambashi
Just over half the world’s 7 billion population lives in cities. In Europe, this rises to three quarters, and 30 cities worldwide have populations of more than 10 million — the majority in India, China and South America.
This trend will continue. It is projected that the global population will reach almost 10 billion by 2050, which means cities will need to cope with increasing demands on housing, transport and communications.
Growing urban populations place considerable stress on housing stock. Cities need to provide scope to build new, but also to look at best use of existing properties.
In the growing urban population, there will always be a proportion that needs more support as employment rates shift and wages do not always keep up with city expenses. Social housing projects need to keep pace, and making the most of city resources opens opportunities for smart buildings.
The role of GIS
Proposed Indianapolis zoning map. (Image: City of Indianapolis)
Coordinating new build and refurbishment plans across a city requires planning and organization, and a set of tools to support planners and designers. The layout of city-planning zones is the starting point for many new developments — sharing data about these areas is typically achieved using a GIS (geographic information system).
The standard city map with records of roads, emergency routes, bike routes, key buildings, new development zones, existing housing stock, utility services and street lighting are a central resource for most cities.
Sharing data between these city maps and developers’ plans is critical to a coordinated approach to city growth.
Environmental impact
The early stages for many developments involve an environmental impact study. How will the new development fit into the existing landscape? What restrictions are imposed because of the conditions of the site or the current demands on local resources? What options are there for addressing these constraints?
This last point is important for acceptance of the development. Being able to show a level of flexibility to accommodate local concerns and developers’ challenges will build a cooperative relationship. The ability to easily integrate building plans with the city map means that confidence is quickly built into the new plans.
Combining the geography of the city view with the building model destined for development provides a perfect foundation for an integrated GIS/BIM model to take the development from drawing board to handover.
Maintaining a digital twin of a development, in the form of a BIM, provides a rich source of information about the as-built building — exact measurements, materials used, changes from the original design and more. Integrating this with the city maps held in GIS means a continuous dataset can be formed.
Tools for construction site inspection and reporting
Photo: Alen Ajan/Fotolia.com
Developing building information models (BIMs) requires monitoring the build activity and accurate recording of the construction. The best way to do this is as it happens.
Simple-to-use tools that are robust enough to cope with a construction site are becoming more available from software providers. These support gathering data by construction teams and contractors as the work is completed.
As well as recording data, these tools are also useful in registering the progress and completion of tasks. Many enable interaction with central systems that can send changes and updates directly to the site for immediate action.
The same tools can register the location of the user, enabling safer working practices to be enforced.
The practice of geofencing to monitor or even restrict access to parts of a construction site, by registering the location of a device against a predefined region on a map of the site, can track critical activities and react with the most appropriate action if an incident is reported.
Remote site inspection and reporting
The Aeryon SkyRanger. (Photo: Aeryon Labs)
The safest inspections don’t involve human intervention at all. Sending an unmanned aerial vehicle, UAV or drone, to fly over your site removes risk to staff when viewing hazardous environments.
Photographic imagery collected by drone can be loaded into GIS tools and accurately registered against the map of the area to provide a seamless view of the site.
Data integration is key
The range of data that can be accurately gathered and viewed together now covers original 3D designs, 2D construction plans, inspection photo-imagery and as-built updates.
Integration of BIM and GIS tools means that these different data types can be viewed together and in the same spatial context.
Support for building operation, management and maintenance in the wider context of a smart city
On-the-spot data capture of accurate as-built building information models that can seamlessly integrate with existing city plans leads to a data resource that cities can build on to improve safety, security and facilities for their citizens.
So what should the smart city planner be looking for?
Existing geospatial and data management tools already address many of these challenges, and when an opportunity for a technology refresh is presented, the approach to smart city support should be a big part of the mix.
Christine Easterfield
Christine Easterfield is principal analyst for Cambashi. She has more than 20 years’ experience in the software business. Her experience has covered geospatial asset management for the utility industry: assessing market needs and opportunities, managing customer requirements, liaising with development teams and running global product introduction programs.
Previous roles include programming, training, consultancy and product marketing management.
She has worked for a range of companies from multinationals to small start-ups, resulting in an understanding of how different sized organisations operate, grow and manage change. Christine has a BSc in Computational Sciences and an MA in English Literature.
Aerial imagery specialist Spookfish has expanded its capture program into New South Wales (NSW), now covering the NSW coast and Sydney’s entire metropolitan area. Spookfish’s coverage in NSW now spans from Newcastle to Kiama and from Lithgow to Manly.
The expansion into NSW marks the next stage of a nationwide rollout for Spookfish. In the past 12 months, the company has expanded coverage into the South Australian, Victorian, Australian Capital Territory and now NSW markets, in addition to its Western Australian coverage.
The expansion of coverage will give businesses and government agencies across Sydney and regional NSW the opportunity to access high-resolution aerial imagery and save thousands of dollars by reducing the time spent on site.
Spookfish now covers the entire Sydney metropolitan area, home to 71% of the NSW population. The city’s growth presents development opportunities for businesses, all of which need to fit within city planning regulations. High-resolution aerial imagery will play an important role in the planning stages.
Spookfish also captures regional cities and towns, including Albury and Wagga Wagga, at the same consistent specification as capital cities.
With the addition of Perth, Melbourne and Adelaide’s entire metropolitan areas, Spookfish offers users access to more than 55,000 square kilometers of high-resolution imagery across Australia. The platform provides customers a clear view on any device with no data caps to give users access to unlimited high-resolution aerial imagery without the risk of unexpected costs.
“Sydney has the greatest population density in Australia, and continues to grow with new projects commissioned to meet this growing population,” said Jason Waller, Spookfish CEO. “We are very pleased to be able to offer businesses access to high resolution imagery of this unique city, to help drive effective and precise planning of developments and urban areas.
“Every day our platform is being discovered by many Australian businesses, helping them save time and money by providing precise aerial imagery with the timeliness and convenience of cloud delivery. We offer our customers a service like no other, where they can access extremely high resolution images at an affordable price across very large areas, with no data caps.”
Spookfish utilizes a fleet of specialized planes to capture imagery for its platform. With regular updates in capital cities across Australia, customers have an up-to-date and evolving view of their world.
Synthetic aperture radar (SAR) imagery from Maxar’s MDA RADARSAT-2 satellite will become available to SecureWatch subscribers on Oct. 1, according to DigitalGlobe.
SecureWatch, DigitalGlobe’s cloud-based geospatial intelligence (GEOINT) platform, will now combine the company’s high-resolution optical imagery and MDA’s SAR imagery in one platform, enabling defense and intelligence analysts to deliver actionable insights to decision makers regardless of weather and light conditions, the company said.
Maxar’s MDA will refresh hundreds of global sites on a weekly basis using RADARSAT-2’s Wide Ultra Fine format (3 meter resolution, 50 kilometer scene width).
RADARSAT-2 imagery allows users to observe features and changes that go undetected using other imaging techniques, and provides day and night coverage regardless of weather.
SecureWatch users can access timely RADARSAT-2 imagery using current subscription plans. When combined with 30 cm optical imagery, analysts will have an even more uniquely powerful and reliable toolset to perform analysis to make decisions with confidence, the company said.
“Adding RADARSAT-2 imagery to SecureWatch is a perfect demonstration of Maxar Technologies’ unique promise: create valuable, integrated and innovative solutions that address customers’ critical challenges,” said Mike Greenley, group president of MDA. “MDA’s RADARSAT-2 information has played a key role in supporting security missions for over two decades, and partnering with our sister company, DigitalGlobe, immediately enhances our offerings and expands our global reach.”
“SecureWatch subscribers now have an exciting new tool to enrich GEOINT gathering and decision-making,” said Dan Jablonsky, DigitalGlobe president. “Combining SAR and optical imagery takes analysts’ abilities to the next level to deliver powerful insights into what’s happening in their areas of interest and allows them to save lives, resources and time.”
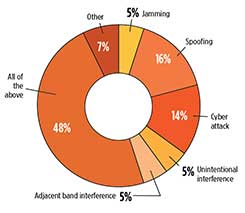
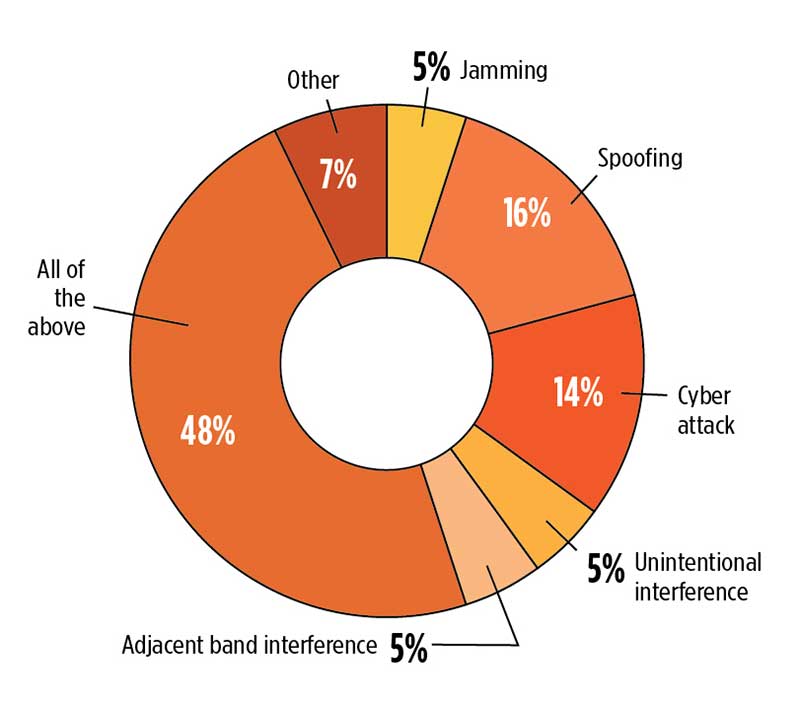
What is the greatest threat to GNSS over the next three years? Click to enlarge. (Source: GPS World 2018 State of the GNSS Industry report)
When we designed the survey of the global PNT community for the 2018 State of the GNSS Industry report, we put a couple of new wrinkles into the online questionnaire. We wanted to know, succinctly, what you felt was the number one obstacle to growth for your organization. And, with the same brevity, what you saw as the number one opportunity for growth.
The answers most frequently given within each sector — mobile, OEM, survey, UAV, transportation, machine control, mapping and defense & government — appear on those respective pages in this issue. They weren’t the only answers, by far.
Obstacles to Growth
Other stumbling blocks that were called out included security, competitors (sometimes mentioned by name), politics (sometimes mentioned by party), budgets, funding, understanding, ignorance, management, bureaucracy, age, and that enduring favorite, time.
The most frequently cited obstacles to growth were:
regulation, and
the lack of qualified staff, personnel, engineers.
One ingenious survey-taker somehow found a way to cram 21 words into an answer box meant for only one or two. “In my industry, deep technical talent that addresses the specific issues. Without that, the ‘big picture’ judgments are often just wrong.”
This problem is not new, nor is it particular to the GNSS/PNT industry. The fact that it is with us year after year suggests that it is not getting enough effective attention. Talented engineers can be imported, yes, if the homegrown supply falls short. In the current political climate, this may not be a strategy with legs. Even given a totally benign immigration regulatory landscape, it is far from a panacea. More on this in a moment.
Growth Opportunities
Various flavors of technology integration, both multi-GNSS and non-GNSS, led the pack in nearly every sector. Other popular answers included customization, broadband, autonomous navigation, Galileo, international markets, alt-nav, Brexit, the Cloud, M-code, anti-jamming, connectivity, flexibility, more clients, and, in riposte to the aforementioned obstacle: training, education, or simply engineering.
The great American thinker Margaret Mead said, “We are continually faced with great opportunities which are brilliantly disguised as unsolvable problems.”
If your organization encounters this perennial problem, this shortage of qualified staff that stifles innovation, inhibits growth, and causes you to pass on new ventures that are just out of reach, here’s the biggest whopping opportunity of all: get involved with higher education and engineering graduate schools in your area.
The talent is there. If you’re not out actively cultivating, encouraging, training and recruiting it, those bright young engineering people will be drawn instead to Internet ventures or gaming software or other industries that sap the soul but nourish the pocket — and those are your true competitors.
Esri is updating the ArcGIS Living Atlas of the World, a vast collection of geographic information from around the globe. The updates include new data and capabilities for users to gain insight for helping in decision making, as well as a more complete and dynamic picture of the world.
The new features were introduced at this year’s Esri User Conference, held July 9–13 in San Diego, California.
The new Earth Systems Monitor app, powered by Living Atlas data, showing Sea Surface Temperature. (Image: Esri)
Earth Systems Monitor. This new app (currently in beta) is powered by Living Atlas data. It allows users to see — on a 2D map or a 3D globe — historical, forecasting and real-time data for depicting land, the oceans and even the human footprint.
Users can see where events or phenomena such as marine temperature shifts are occurring at any time on the planet, or even model global population growth and its effects, the company said.
The configurable app will be released later this year. The app can be used with Living Atlas data layers or with other layers from an organization’s own data or ArcGIS Online.
Wayback Imagery. This digital archive of the World Imagery basemap enables users to access more than 80 different versions of world imagery captured over the past five years.
Each record in the archive represents a version of world imagery as it existed on the date it was published. Users can move back and forth in time and choose the imagery they want to use.
OpenStreetMap Vector Basemap. Moving to a local scale, OpenStreetMap (OSM) is an open, collaborative project to create a free editable map of the world, built by a community of mappers who contribute and maintain data about roads, trails, buildings, restaurants and more.
Until now, OSM was only available as a raster basemap in ArcGIS Online. The new vector basemap, introduced in beta, will be available for free to all ArcGIS users and developers.
“The Living Atlas shows how our community of users continues to contribute to the innovations that power our technology,” said Jack Dangermond, Esri founder and president. “The beauty of these new features is that they transform the data that users are supplying into valuable online services like Earth Systems Monitor.”
Living Atlas can be used to create indexes displaying properties such as vegetation health or soil moisture and quantifying the changes over time, enabling better understanding of the environment.
Earth Systems Monitor, OSM Vector Basemap and Wayback Imagery are all examples of how online GIS technology is transforming traditional mapping organizations into web service providers, Esri said. These innovations are just the latest steps in creating a living digital twin of the systems and processes that help run organizations, cities and even nations.
By fostering the adoption of apps, web maps, and collaborative efforts, Living Atlas is supporting end users who face increasing geospatial data demands, enabling them to be self-sufficient with the application of location intelligence across their organizations.
Wayback Imagery is currently accessible, while both OSM Vector Basemap and Earth Systems Monitor will be available soon in ArcGIS Online.
Remote GeoSystems Inc., a global provider of geospatial video recorder hardware and GIS integration software and solutions, has become an official Silver Partner in the Esri Partner Network after successfully building its business as an Emerging Business Partner in the Esri Startup Program.
Esri offers a Startup Program enabling the most promising emerging businesses to incorporate these innovations into their services and solutions.
Now in its third year, the Esri Startup Program provides the ArcGIS software, online services, support, community involvement and training to kick-start product development or enrich existing solutions.
Remote GeoSystems was one of the first early-stage startups accepted into the program.
“As a small technology company bootstrapping the development and innovative product sales efforts, access to Esri’s flagship ArcGIS platform and team support was invaluable,” said Jeff Dahlke, managing director of Remote GeoSystems.
The LineVision Desktop. (Image: Remote Geosystems)
In its three years in the program, Remote GeoSystems was able to successfully develop and go to market with an array of geospatial video solutions. The company’s LineVision Esri ArcMap Add-in and stand-alone LineVision Desktop with Esri Mapping commercial software tools provide georeferenced video playback, analysis, collaboration and reporting using the Esri ArcGIS platform.
In addition, the new Video GeoTagger and Video GeoEditor (coming soon) products, also built with Esri mapping technology, will be available for use on the ArcGIS Marketplace.
These professional geospatial video and integrated GIS Full Motion Video (FMV) software tools are suitable for airborne, drone and mobile mapping surveys, critical infrastructure inspection and public safety applications.
“The Remote Geo team is building some very feature-rich and capable Esri-based solutions and Add-ins while also bringing a valuable mix of GIS, GPS, deep location-based video expertise and multi-industry experience,” said Francis Kelly, Esri Global Partner Programs manager. “We are excited to work with Remote Geo as their business matures and they continue to contribute to the Esri user community as part of the Esri Partner Network.”
“As a company that was once a startup, we understand the early years for any business are hard,” said Katie Decker, Esri Startup Team community manager. “We are impressed with how the Remote Geo team executed on the opportunities provided by the program, bringing the value of geospatial video to a broader audience using the Esri platform. Their experience is what we envisioned when we implemented the program and we look forward to continuing to work with them.”
Remote GeoSystems LineVision Esri-based solutions key features often include:
Play videos from single and multi-camera video data collection platforms
“Click-on-Map” video navigation
Set a custom geo-fence around the moving position marker
Load shapefiles, imagery and ArcGIS Online datasets
Save geotagged video and photo data as geoProjects for simple project reporting, archive and search
Support for DJI Drone Video data.
All Remote GeoSystems Esri-based solutions are and/or will soon be available in the ArcGIS Marketplace.
The startup PlanetWatchers has developed Foresights, a risk management and geospatial analytics platform designed specifically to help clients manage forestry assets quickly, effectively and accurately.
Foresights identifies areas of new or potential risk, and delivers operations tracking and forest damage management services. The company plans to add satellite-driven analytics, inventory data and forest productivity services to the platform. before the end of the year.
The Foresights platform covers larger geographic areas and delivers results faster and more accurately than traditional project-based companies, traditional inventory methods and off-the-shelf processing tools, the company said.
PlanetWatchers combines multi-source satellite imagery data, topography maps, soil maps, meteorological data and near real-time ground input from operational teams to deliver optimized insights. The tool is capable of detecting disturbances as small as 0.1 ha (0.25 ac) related to pest, disease and drought damage.
Foresights will help forest managers “easily access crucial business intelligence and detailed insights and analytics on a regular basis so they can make proactive and informed decisions and take immediate remedial action,” said Ariel Smoliar, PlanetWatchers’ CEO and co-founder. “Without these higher levels of data and improved frequency of information, they could see negative impacts on their forestry management decisions, their supply chains and, ultimately, their profits.”
Reports identifying locations that require immediate mitigation can be viewed in existing GIS systems and are geolocated for forestry field teams, including offline capabilities for teams operating in remote areas without cellular reception.
“Foresights also fills a data gap known as the ‘Last Mile of Analytics’,” Smoliar said. “When we deliver satellite images to our clients, they shouldn’t have to then analyze and extract information. We remove this pain point for them by providing deep analysis of optical and radar satellite images, and compiling actionable insights and reports, including detailed maps of locations of interest. Our clients are shown not only the location of the disturbance, but also the issue and its cause, granting them vital intelligence they can act on with very little lag time. Foresters will no longer need to process or analyze imagery: this is the game-changing value of the Last Mile of Analytics.”
The Forest Operations service provides foresters with insights to track progress of various forest harvest operations such as thinning and clearcutting. This information assists operations managers in optimizing their wood supply chain and efficiently and effectively managing resources.
The Forest Disturbance service delivers location-specific reports to forest owners and managers detailing areas with identifiable disturbances that could degrade the quality, yield, and profitability of forests. Some disturbances that Foresights can identify to help commercial foresters respond proactively include growth and uniformity issues over time, illegal logging, insect infestations and disease, competitive vegetation, storm damage, drought, wildfires and more.
Under the grant, TCarta will enhance and automate multiple techniques for deriving seafloor depth measurements from optical satellite imagery.
The Project Trident research seeks to transform existing satellite-derived bathymetry (SDB) techniques by using machine learning and computer vision technology to enable accurate depth retrieval in variable water conditions.
If successful, these enhanced bathymetric techniques will improve operations related to oil and gas exploration and production, coastal infrastructure engineering, environmental monitoring and geointelligence activities, the company said.
“Our goal with Project Trident is to expand the geographic scope of SDB in shallow coastal areas,” said Kyle Goodrich, TCarta president. “SDB technology currently derives water depths only in calm, clear waters, which limits its applicability.”
Beta testers sought
TCarta is seeking beta testers for participation in Project Trident research. If you are interested, contact Project Trident Principal Investigator Kyle Goodrich at [email protected] or complete the online Project Trident survey.
TCarta won the grant for Project Trident in partnership with jOmegak of San Carlos, California, and DigitalGlobe of Westminster, Colorado, in Phase 1 of the NSF Small Business Innovation Research program.
The one-year research project will be carried out at the TCarta facility in Denver.
In 2014, TCarta successfully commercialized a proprietary technique for digitally extracting water depth measurements down to 20 meters from high-resolution DigitalGlobe WorldView satellite imagery.
The SDB products became popular with organizations operating in shallow coastal waters because the technology is more cost-effective and timely than traditional airborne and ship-borne bathymetric methods — with no adverse effects on the environment, the company added.
“In the current SDB process, we use manual stereo photogrammetry methods to measure seafloor ground control points in digital satellite imagery, but this is extremely time consuming,” said Goodrich. “We are developing an automated photogrammetric process to extract a greater number of ground truth points from high-resolution WorldView imagery.”
Project Trident aims to integrate wave kinematics, a technique patented by jOmegak to calculate water depths in shallow waters by analyzing the patterns and speed of waves detected in satellite imagery. Wave kinematics has been applied successfully using Sentinel-2 and WorldView satellite imagery.
“Thanks to the NSF grant, we are taking a giant leap forward on TCarta satellite-derived bathymetry methodologies and aim to exponentially accelerate them with the latest in machine learning and computer vision technologies,” said Goodrich.
Looking southwest towards Leilani Estates with Fissure 8 erupting in the background. (Image: Ron Chapple/GEO 1)
High-resolution lidar surveys help first responders, scientists and government agencies monitor Kilauea conditions and predict future lava flows.
Independent geospatial data firm Quantum Spatial Inc. (QSI) has conducted high-resolution lidar surveys of areas surrounding the Kilauea volcano eruption in Hawaii.
The emergency response effort was part of the U.S. Geological Survey’s (USGS) Rapid Response Imagery Products (RRIP) in support of the Kilauea’s 2018 East Rift Zone – Remote Sensing Acquisition Requirement.
The USGS Hawaiian Volcano Observatory (HVO), along with emergency responders, government agencies and academics, will use the data to better understand the conditions and characteristics of the Kilauea volcano, which has been continually erupting since May 3.
Data also will assist planners in modeling potential lava flows, which may better predict and respond to future flows and enhance safety of residents.
The USGS National Geospatial Program (NGP) selected QSI to perform the first of two planned surveys over the active volcanic area. The QSI team, which included GEO1 and Windward Aviation, deployed within days to acquire high-resolution lidar at point densities averaging from 40 to 80 ppsm, with up to 150 ppsm in select areas and 100-mp digital imagery using a Riegl dual VUX-1 LR sensor pod equipped with ABGPS/IMU mounted on a Hughes 500D helicopter.
Five distinct locations, covering an area of 57 square miles, were targeted:
Kīlauea Summit Caldera
Pu’u O’o Crater and flow
Chain of Craters Road / Kaoe
Puna Geothermal Venture (PGV)
Western Leilani Estates lava field.
The project required 11 missions over the course of six days, operating at times as low as 500 feet above the ground and above active flows and nearby erupting calderas. With a need for a quick turn around, QSI deployed an analyst with the flight crew to post process each mission within hours of collection.
The data was uploaded to the Geospatial Repository and Data Management System (GRiD) interface, developed by the U.S. Army Corps of Engineers (USACE), where additional data products have been developed and provided to the response team that includes FEMA, Hawaii’s Emergency Operations Center (EOC) and the Hawaii County Civil Defense.
After data collection, QSI measured topographic shifts during the processing by comparing new data with a 2011 lidar collection from the same area. Survey specialists and USGS experts confirmed within hours of processing QSI’s lidar data that areas within the site had shifted up to 1.5 meters east, 2 meters to the north and 1 meter in elevation.
USGS scientists will continue to examine the new topographic data to better understand the nature of these shifts, and integrate it into lava flow models for more accurate predictive modeling.
“Airborne lidar and imagery remote sensing surveys are invaluable tools for understanding the effects of active volcanic eruptions, which change the topography as fissures emerge and lava flows extend to the ocean,” said Michael Shillenn, vice president at QSI. “We were honored to work with the USGS and others on this critical project. We believe that data and analysis provided by the QSI team will provide insights into future scenarios, enabling emergency responders to protect the surrounding community.”
A voter enters a polling place. (Image: iStock.com/YinYang)
With the mid-term elections coming ever nearer, states are turning to geographic information systems (GIS) to help manage them.
Digital geographic representation of precinct boundaries within a GIS allow for transparency and ease of use for voters, candidates and electoral management, according to the National States Geographic Information Council (NSGIC).
GIS also enables the optimal siting of polling places for both voter access and the cost efficiency of operating polls.
Finally, GIS provides a platform for automated quality-control processes that ensure accurate voter precinct assignments.
“An electoral system with integrity — enhanced by accurate, authoritative geographic data and presented clearly and transparently — has never been more important,” said NSGIC President Andy Rowan.
Why GIS is an improvement over address files
NSGIC’s Geo-Enabled Elections project brings together geographic information systems (GIS) leaders in state government, local elections officials and state elections offices, national GIS and elections organizations, and federal partners to identify opportunities to integrate GIS into elections systems across the country.
The overall goal is to strengthen elections management and citizen engagement. The project aims to provide the impetus for replacing non-spatial “address file” tables with the visual and analytical advantages of election precinct and voter data in a natively GIS format.
Geo-enabled elections overcome the four fundamental challenges with the existing address list approach to precinct management, according to Rowan.
In the address list approach, Rowan said,
No actual boundaries are stored explicitly in the systems,
Quality control is difficult without a method to visualize precinct assignment using aerial photography and boundary information that can change frequently,
There is no efficient method for applying large-scale precinct boundary updates, and
The process is usually not aligned efficiently with other state and local address or boundary-management processes.
To this end, the project conducted a nationwide survey on elections data in the first half of this year. More than two-thirds of states responded.
Here are key takeaways from the baseline survey.
Addresses
The survey found that 55 percent of responding states confirm voter registration addresses against a database of known addresses such as a driver’s license or state ID database, a statewide point address set, a master address database used for 911 call routing, or a commercially available address database.
“The results indicate a need to advocate for coordination between state agencies (such as the state elections department and the department of motor vehicles) and encourage integration of the voting system and other systems,” said Jamie Chesser, the Geo-Enabled Elections project manager.
Election Precincts
More than half of responding states indicated they maintain statewide mapping of precincts. Within this group, 40 percent also maintain a layer of sub-precincts in digital mapping systems.
“There remains a need to develop local precinct data content and procedural standards to examine the relationship between precincts, local and state boundaries, and residential structures,” Chesser said.
Other Data
In all, 82 percent of states keep up-to-date spatial data of city and county boundaries, which is essential for computer-based mapping of precincts.
“Statewide spatial data — especially city, county, school, and special district boundaries – are essential to mapping precinct boundaries across the state,” Chesser said. “The survey reflected, however, that accuracy of current city and county boundary mapping varies
considerably.”
A substantial majority, 79 percent of respondents, confirm their mapping of state-level district-based elected offices are accessible online in a digital mapping format.
Survey responses were coordinated by state government representatives who focus on the development and deployment of mapping data and systems across state agencies and local governments.
Later this year, NSGIC will release the results of a study probing the spatial approach to elections management from the perspective of state elections officials.
The two-year Geo-Enabled Elections project, underwritten by the bipartisan Democracy Fund Voice, convenes a wide variety of stakeholders to explore ways geographic information systems and related processes can enhance elections management and citizen engagement across the U.S.