Surrey Satellite Technology’s Space GNSS Receiver Remote Sensing Instrument (SGR-ReSI) is the primary payload onboard NASA’s CYGNSS constellation, launched today, Dec. 15, from Cape Canaveral Air Force Station in Florida.
The Cyclone Global Navigation Satellite System (CYGNSS) mission is part of the NASA Earth System Science Pathfinder Program that aims to improve extreme weather prediction by studying how tropical cyclones form.
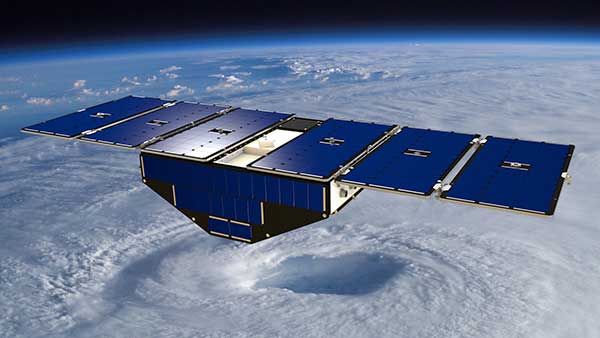
Artist’s concept of one of the eight CYGNSS satellites in orbit. (Image: NASA/University of Michigan)
The CYGNSS space segment consists of a constellation of eight micro satellites, each carrying the Surrey SGR-ReSI as the observatory payload in the form of a delay Doppler mapping instrument (DDMI). Making use of reflected global positioning signals, the DDMI collects ocean surface roughness data using a technique called GNSS reflectometry, providing CYGNSS with a new method for looking inside hurricanes. Wind speed will be estimated from this reflectometry data.
“At the end of last year, we delivered the SGR-ReSI flight models, low-noise amplifiers, and antennas to Southwest Research Institute for final integration into the CYGNSS observatories — marking a significant hardware shipment out of our Englewood, Colorado, manufacturing facility,” said Clare Martin, vice president of programs at Surrey Satellite Technology U.S.. “All of us at Surrey are proud that our instrument is playing an integral role in this mission, and we will watch with great interest as the satellites are put to work.”
The CYGNSS team is made up of the University of Michigan Department of Climate and Space Sciences and Engineering, Southwest Research Institute (SwRI), Surrey Satellite Technology and Sierra Nevada Corporation.
Surrey Satellite Technology demonstrated the concept of GNSS reflectometry for the first time on its UK-DMC mission launched in 2003, and subsequently developed the SGR-ReSI, which is currently flying on Surrey’s TechDemoSat-1 mission.
CYGNSS is NASA’s first Earth science small satellite constellation, designed to help improve forecasting hurricane intensity, hurricane tracks and storm surges.
CYGNSS will measure previously unknown details crucial to accurately understanding the formation and intensity of tropical cyclones and hurricanes.
“This is a first-of-its-kind mission,” said Thomas Zurbuchen, associate administrator for NASA’s Science Mission Directorate at the agency’s headquarters in Washington. “As a constellation of eight spacecraft, CYGNSS will do what a single craft can’t in terms of measuring surface wind speeds inside hurricanes and tropical cyclones at high time-resolution, to improve our ability to understand and predict how these deadly storms develop.”
The CYGNSS mission is expected to lead to more accurate weather forecasts of wind speeds and storm surges — the walls of water that do the most damage when hurricanes make landfall.
Using the same GPS technology that allows drivers to navigate streets, CYGNSS will use a constellation of eight micro satellite observatories to measure the surface roughness of the world’s oceans. Mission scientists will use the data collected to calculate surface wind speeds, providing a better picture of a storm’s strength and intensity.
Unlike existing operational weather satellites, CYGNSS can penetrate the heavy rain of a hurricane’s eyewall to gather data about a storm’s intense inner core. The eyewall is the thick ring of thunderstorm clouds and rain that surrounds the calm eye of a hurricane. The inner core region acts like the engine of the storm by extracting energy from the warm surface water via evaporation into the atmosphere.
The latent heat contained in the water vapor is then released into the atmosphere by condensation and precipitation. The intense rain in eyewalls blocks the view of the inner core by conventional satellites, however, preventing scientists from gathering much information about this key region of a developing hurricane.
“Today, we can’t see what’s happening under the rain,” said Chris Ruf, professor in the University of Michigan’s Department of Climate and Space Sciences and Engineering and principal investigator for the CYGNSS mission. “We can measure the wind outside of the storm cell with present systems. But there’s a gap in our knowledge of cyclone processes in the critical eyewall region of the storm — a gap that will be filled by the CYGNSS data. The models try to predict what is happening under the rain, but they are much less accurate without continuous experimental validation.”
The CYGNSS small satellite observatories will continuously monitor surface winds over the oceans across Earth’s tropical hurricane-belt latitudes. Each satellite is capable of capturing four wind measurements per second, adding as many as 32 wind measurements per second for the entire constellation.
CYGNSS is the first complete orbital mission competitively selected by NASA’s Earth Venture program. Earth Venture focuses on low-cost, rapidly developed, science-driven missions to enhance our understanding of the current state of Earth and its complex, dynamic system and enable continual improvement in the prediction of future changes.
PlanetiQ has signed a contract with Antrix Corporation Limited, the commercial arm of the Indian Space Research Organization (ISRO), for the launch of PlanetiQ’s first two weather satellites on a Polar Satellite Launch Vehicle (PSLV) during the fourth quarter of 2016.
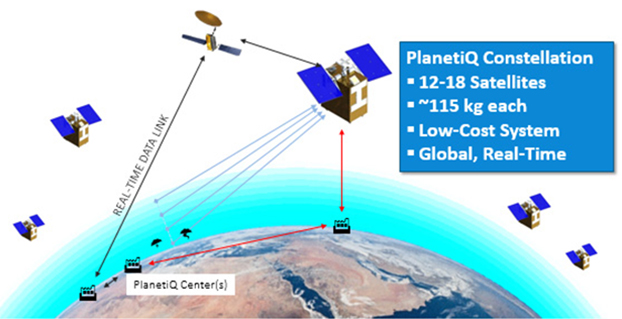
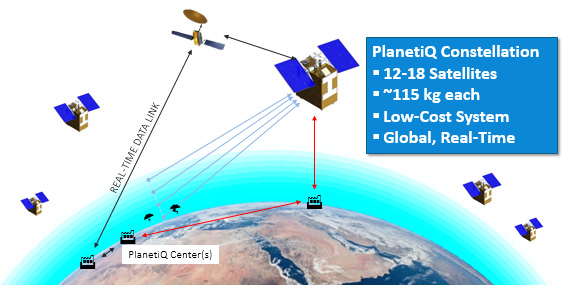
Ten more satellites are planned for launch in 2017 to complete an initial set of 12 satellites that will dramatically improve global weather forecasting, climate monitoring and space weather prediction, and enable advanced analytics for numerous industries worldwide.
The ISRO’s PSLV is among the world’s most reliable launch vehicles with 30 consecutive successful flights. It has launched 51 satellites for international customers from 20 countries, in addition to 33 Indian national satellites.
“The stellar track record of the PSLV combined with our seven-year satellite design life provides the reliability and data continuity not just desired, but required by the operational weather forecast community,” said Chris McCormick, Chairman and CEO of PlanetiQ. “Within days after launch, we will validate and start delivering high-quality data and services to our customers.”
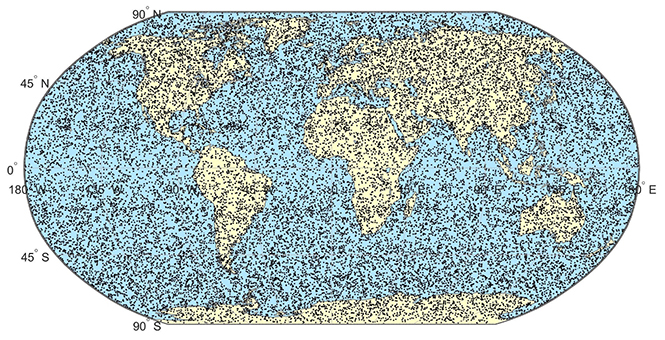
24 hours of data from 12 PlanetiQ satellites = ~34,000 occultations/day.
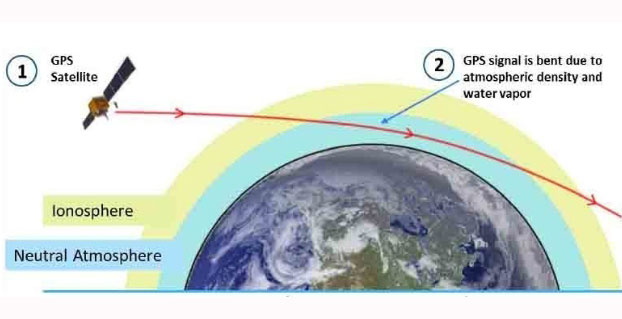
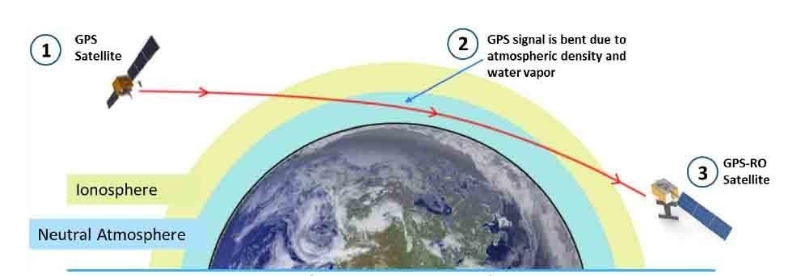
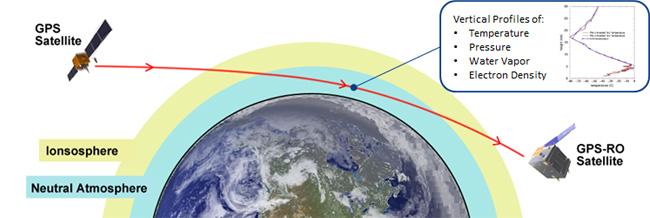
Each of PlanetiQ’s 10-kilogram microsatellites will fly PlanetiQ’s Pyxis-RO sensor, an advanced satellite weather sensor in a small package that can penetrate through clouds and storms down to the Earth’s surface. Pyxis-RO uses a technique called radio occultation to track the bending of GPS and other signals as they travel through Earth’s atmosphere, and then converts the bending angle into high-precision measurements of global temperature, pressure and water vapor in the atmosphere, and electron density in the ionosphere.
Pyxis-RO quadruples the data collection capability of radio occultation sensors on orbit today by tracking signals from all four major satellite navigation systems — GPS, Galileo, Beidou and GLONASS. With 12 satellites on orbit, PlanetiQ will collect 34,000 occultations per day, evenly distributed around the globe with high-density sampling over both land and water.
Each occultation is a vertical profile of atmospheric data with high vertical resolution, comprised of measurements less than every 200 meters from the Earth’s surface up into the ionosphere. The data is similar to that collected by weather balloons, but more accurate, more frequent and on a global scale.
“The world today lacks sufficient data to feed into weather models, especially the detailed vertical data that is critical to storm prediction. That’s why we see inaccurate or ambiguous forecasts for storms like Hurricane Joaquin, which can put numerous lives at risk and cost businesses millions of dollars due to inadequate preparation or risk management measures,” McCormick said. “Capturing the detailed vertical structure of the atmosphere from pole to pole, especially over the currently under-sampled oceans, is the missing link to improving forecasts of high-impact weather.”
PlanetiQ has selected Blue Canyon Technologies to build its weather satellite constellation, set to launch in 2016 and 2017. PlanetiQ chose BCT as a partner in developing the world’s first commercial constellation dedicated to weather, climate and space weather based on BCT’s development track record and its cutting-edge, low-cost design approach that has delivered hundreds of components and systems for numerous space missions, PlanetiQ said.
“Weather is the next commercial space frontier, as demand grows not only for better forecasts of day-to-day weather, severe storms and hurricanes, but also for weather and climate data solutions that enhance weather readiness, support risk management and increase business intelligence,” said Anne Hale Miglarese, president and CEO of PlanetiQ. “Together, PlanetiQ and BCT bring the innovation, technical expertise and experience to cost-effectively produce the high-quality data needed to transform the weather satellite industry and deliver unprecedented economic value.”
PlanetiQ has co-located its aerospace engineering team at BCT’s Boulder facilities, where both the satellites and sensors will be manufactured and integrated, and is already working side-by-side with BCT on the initial set of 12 microsatellites. Working together with the PlanetiQ team, BCT has dramatically reduced the satellite size and weight without sacrificing any instrument capabilities.
“We are certainly pleased to be chosen by PlanetiQ. Weather is emerging as a major growth sector for aerospace, and our partnership with PlanetiQ positions BCT and the state of Colorado to play a leading role,” said George Stafford, president and CEO of BCT. “Our systems and components match well with PlanetiQ’s instrument requirements, and we are glad to be working on this spacecraft and mission.”
In early June, PlanetiQ announced the successful testing of its first “Pyxis” weather sensor and is setting up for production with BCT. Pyxis collects dense, precise measurements of global temperature, pressure and water vapor — similar to data collected by weather balloons but on a global scale — using a technique called GPS Radio Occultation (GPS-RO). Among the satellite data sources currently ingested into computer weather models, GPS-RO has shown the most cost-effective, highest impact per observation on forecast accuracy. But only a sparse amount of GPS-RO data exists today.
Pyxis is the only GPS-RO sensor in such a small package that is powerful enough to provide more than 10 times the amount of data available from GPS-RO sensors currently on orbit, and to routinely probe down into the lowest layers of the atmosphere where severe weather occurs.
“The small size and weight of the Pyxis sensor — combined with BCT’s high-performance mission experience — will allow us to quickly field a constellation to provide the highest quality, most cost-effective weather data ever available,” said PlanetiQ FounderChris McCormick, who leads PlanetiQ’s instrument team and developed the sensors for the only GPS-RO constellation that has provided operational weather forecast data. “With 12 satellites providing 8 million data points per day, GPS-RO will easily become the most important contributor to weather forecast accuracy at a fraction of the cost of traditional weather satellites.”
PlanetiQ has started testing its first Pyxis weather instrument with successful processing of GPS signals. The Pyxis represents a new paradigm in satellite weather sensor technology that can penetrate through clouds and storms to produce the highly calibrated data required to dramatically improve weather forecasting, climate monitoring and space weather prediction, all at a much lower cost than traditional satellite weather instruments, PlanetiQ said.
Pyxis will track GPS signals traveling through Earth’s atmosphere and convert them into dense, precise measurements of global temperature, pressure and water vapor — similar to data collected by weather balloons but on a global scale — using a technique called GPS radio occultation (GPS-RO).
Pyxis is the only GPS-RO sensor in such a small package that is powerful enough to routinely probe down into the lowest layers of the atmosphere where severe weather occurs. In addition, Pyxis is able to track signals from all four major satellite navigation systems (GPS, Galileo, Beidou and GLONASS).
PlanetiQ’s planned microsatellite constellation, with an initial set of 12 satellites launching in 2016 and 2017, will deliver more than 8 million observations per day of temperature, pressure and water vapor, or more than 10 times the amount of data available from GPS-RO sensors currently on orbit.
GPS-RO has shown the highest impact per observation on forecast accuracy among the satellite data sources ingested into computer weather models, and is particularly effective at improving predictions of high-impact weather such as hurricanes, severe weather outbreaks and winter storms. However, the amount of GPS-RO data available to date has been sparse.
The Pyxis sensor development team is based in Boulder, Colo., and led by PlanetiQ Founder Chris McCormick, who was instrumental in designing the sensors on the U.S.-Taiwan Constellation Observing System for Meteorology, Ionosphere, and Climate (COSMIC), the world’s first and only satellite constellation of proven GPS-RO sensors.
“Weather has an immense human and societal impact and affects businesses on a daily if not hourly basis, with a $9.7 trillion economic influence globally,” said Anne Hale Miglarese, president and CEO of PlanetiQ. “Improving the weather forecast and developing innovative risk analytics tools are critical to mitigate these growing costs, and the key is more high-quality weather data.”
“The Earth’s atmosphere is radically under-sampled at present especially over the oceans, which cover 70 percent of the Earth’s surface. With the speed of innovation in sensor technology, space hardware and launch, the weather forecast will dramatically change for the better in the near future,” McCormick said. “The Pyxis represents a major step forward in improving forecast accuracy for both routine weather and big storms, while leveraging the latest advances in science, technology and miniaturization to drive down costs.”
Explore further:
PlanetiQ President and CEO Anne Hale Miglarese discussed the project on The Weather Channel in August 2014.
Attila Komjathy, a NASA Jet Propulsion Laboratory principal investigator and adjunct professor in the University of New Brunswick’s Department of Geodesy and Geomatics Engineering, was named a Fellow of the Institute of Navigation in January for his work on remote sensing of the Earth’s ionosphere using signals from GNSS.
The company PlanetiQ plans to use GNSS to make real-time weather forecasts. PlanetiQ plans to launch a commercial weather satellite constellation by 2017, composed of 12 to 18 small satellites that will capture data as GNSS satellites pass through Earth’s orbital horizon.
The satellites will use radio occultation to collect data that will supplement computer models on weather, producing more accurate and timely weather forecasts and assessments, PlanetiQ said. The satellites will measure how GPS, GLONASS, and BeiDou radio waves bend as they travel through the atmosphere, a technique that provides snapshots of temperature, pressure and water vapor, as well as insight into whether solar storms are active in the ionosphere, reports Discovery News.
Figure credit: PlanetiQ.
More than 30,000 occultation measurements can be collected each day.
PlanetiQ is one of five companies in the United States looking to commercialize weather forecasting. GeoOptics is working on a similar system and plans to launch its first satellite this year.
Explore further:
PlanetiQ President and CEO Anne Hale Miglarese discussed the project on The Weather Channel in August 2014.
Attila Komjathy, a NASA Jet Propulsion Laboratory principal investigator and adjunct professor in the University of New Brunswick’s Department of Geodesy and Geomatics Engineering, was named a Fellow of the Institute of Navigation in January for his work on remote sensing of the Earth’s ionosphere using signals from GNSS.
By Simon Lutz, Marc Troller, Donat Perler, Alain Geiger, and Hans-Gert Kahle
A team of Swiss researchers is using data from a network of GPS receivers and the technique of tomography to obtain profiles of how moisture is distributed with height, which might lead to better weather forecasts.
INNOVATION INSIGHTS by Richard Langley
WEATHER FORECASTING IS STILL AN IMPERFECT ART. Humankind has been trying to predict the weather for millennia. Early attempts were based on general observations such as “Red sky at night, shepherd’s delight; Red sky in morning, sailor’s warning.” But it was only with advances in scientific thought and the invention of measuring devices, such as the mercury barometer, that more specific predictions could be made.
Towards the end of the 18th century, the father of modern chemistry, Antoine Laurent Lavoisier, said “It is almost possible to predict one or two days in advance, within a rather broad range of probability, what the weather is going to be; it is even thought that it will not be impossible to publish daily forecasts, which would be very useful to society.”
Forecasting ability has improved over the years as measurement technology, communications, and the understanding of atmospheric processes have improved. Meteorologists use measurements from various types of sensors together with mathematical models describing the physics of the atmosphere to predict its future state. The temporal and spatial density of the measurements and the sophistication of the models have a direct impact on the success of the forecasts. Weather stations on the Earth’s surface, radar installations, radiosondes, and satellite sensors all provide data for modern forecasts. Yet better sampling of the current state of the atmosphere, particularly the distribution of water vapor, is required to produce more accurate and more timely forecasts of its future state. GPS can help.
The signals from the GPS satellites must transit the atmosphere on their way to a receiver on the Earth’s surface. The atmosphere’s atoms and molecules slow down the signals so that they arrive slightly later than they would if the Earth was surrounded by a vacuum, and this effect shows up in the GPS receiver measurements. The receiver or measurement processing software needs to remove or model the effect to obtain accurate receiver positions. On the other hand, if all parameters affecting GPS measurements such as satellite and receiver coordinates are well known, then the delay imparted by the atmosphere can be estimated. It is possible to separate the effect of water vapor from that of the dry gases such as nitrogen, oxygen, and carbon dioxide and to provide a measure of the atmosphere’s moisture content. Several national weather agencies are ingesting such estimates from networks of GPS receivers into experimental or operational numerical weather forecast models. But these values represent an integrated measure of moisture above a receiver. Profiles of how moisture is distributed with height would be more useful and might lead to better weather forecasts. In this month’s column, a team of Swiss researchers discuss how they use data from a network of GPS receivers and the technique of tomography to obtain such profiles.
“Innovation” features discussions about advances in GPS technology, its applications, and the fundamentals of GPS positioning. The column is coordinated by Richard Langley, Department of Geodesy and Geomatics Engineering, University of New Brunswick.
Water vapor plays an essential role in the dynamics and thermodynamics of the atmosphere — especially storm systems — on local, regional, and global scales. It is a precursor of precipitation. Furthermore, a significant fraction of the energy released to the atmosphere comes from water vapor via latent heat. And much of the “greenhouse effect” is caused by the presence of water vapor in the atmosphere.
Beginning in 1992, a number of researchers successfully tested the hypothesis that the Global Positioning System (GPS) could be used to detect long- and short-term global and regional air-mass changes by estimating the amount of water vapor in the air above a GPS receiver. The arrival of GPS signals at a receiver is delayed by the presence of the Earth’s atmosphere. The satellite signals slow down when they encounter the atmosphere’s electrons, atoms, and molecules. In particular, the signals are affected by the presence of water vapor. Through a careful analysis of the GPS receiver’s measurements, the amount of water vapor along the signal path can be estimated. This is an integrated value that depends on the density of the water vapor molecules, or alternatively, the associated humidity at each point along the signal path. But from a single integrated value, there is no way to determine the profile of humidity — how the humidity varies with height above the surface. However, if a network of GPS receivers is deployed over a region, it is possible to determine the three-dimensional structure of humidity in the atmosphere above the receivers using tomography in a similar way to that used for medical imaging — albeit with radio waves rather than X-rays.
At the Swiss Federal Institute of Technology in Zurich (familiarly known by its German abbreviation ETH), we have developed the Atmospheric Water Vapor Tomography Software (AWATOS) for estimating humidity profiles. We have tested it with data from various measurement campaigns, including one in Hawaii. We have also used it to determine 40 humidity profiles over Switzerland with data from the Automated GNSS Network for Switzerland (AGNES) of the Swiss Federal Office of Topography, Swisstopo. And recently, we have implemented it in an operational testbed analyzing AGNES data together with observations from the Automated Swiss Weather Station Network (ANETZ) of the Swiss Federal Office of Meteorology and Climatology, MeteoSwiss.
To assess the potential of ground-based GPS water vapor tomography to support meteorological forecasting systems, the tomographic results must be available within near real-time and must be produced with an accuracy comparable to that of existing meteorological measurement techniques and numerical weather prediction models. With those goals in mind, we have carried out a project to determine humidity profiles in a region of the Swiss Alps. In this article, we outline the project, including the background theory, and discuss how we validated the results by comparing them to radiosonde measurements and weather prediction models.
Theoretical Background
Before looking at the project, we will briefly describe the theory behind our tomographic technique.
Radio Wave Refractivity. The propagation of radio waves through the Earth’s ionosphere and the electrically neutral atmosphere (the air) is accompanied by phase and amplitude variations caused by the varying refractive index of the media. Since the effect of the ionosphere on GPS signals can be removed almost completely by processing measurements on both the L1 and L2 frequencies, we are only concerned with the effect of the neutral atmosphere here. In 1951, Essen and Froome published a general formula for the refractive index of air, n, and the corresponding atmospheric refractivity, N, using the three meteorological parameters: total (barometric) air pressure, p, measured in hectopascals; air temperature, T, in kelvins; and the partial pressure of water vapor, e, in hectopascals (see Equation 1). The associated empirically determined constantsk1, k2,andk3 have been continuously improved over the years.
In the weighted mean formula for non-dispersive radio wave refractivity for air with 0.0375 percent carbon dioxide content, k1 is set to 77.6890 kelvins per hectopascal, k2 to 71.2952 kelvins per hectopascal, and k3 to 375463 kelvins-squared per hectopascal. The k1 term of Equation 1 can be associated with dry refractivity (Ndry), the refractivity of the dry constituents of air, and the second and third terms with the wet part (Nwet), which is proportional to the partial water vapor pressure.
Tropospheric Refraction. The speed of propagation of a radio wave is governed by the refractivity or index of refraction along the signal (slant) path. The path itself is determined by Snell’s Law relating angle of incidence to angle of refraction at the boundary of two media with differing refractive indices. As mentioned previously, GPS measurements include the additional or excess delay due to the presence of the neutral atmosphere. Since the bulk of the effect occurs in the lower, denser part of the atmosphere — the troposphere — we commonly refer to it as the tropospheric delay. The tropospheric slant path delay, , between station p and satellite r is defined by the following integral along the signal ray path, s:
By integrating the individual components of N in Equation 2 and applying Equation 1, the tropospheric slant path delay can be written as a function of the meteorological parameters p, T, and e.
Tropospheric delay as a function of the observation zenith angle, , (90° minus the elevation angle) is calculated using appropriate mapping functions. The mapping function, , is defined as the ratio of the electrical path length through the troposphere at a particular geometrical zenith angle to the electrical path length in the zenith direction. Typically, separate mapping functions are used for the dry and wet components. Furthermore, the slant wet delay, , for elevation angles down to 3 degrees can be represented as the sum of the isotropic term, ZWDp (zenith wet delay at station p) with its corresponding mapping function, and a non-isotropic component, :
The Tomographic Voxel Model. Separate slant delays only provide integrated measures of the tropospheric refractivity — a one-dimensional view, if you like. To get the three-dimensional structure of refractivity, we need a different approach. We divide the troposphere into small volume elements or voxels (short for volumetric pixel). With multiple, simultaneous raypaths criss-crossing the model volume, it is possible, in principle, to estimate the refractivity of each voxel and hence get a height profile of refractivity.
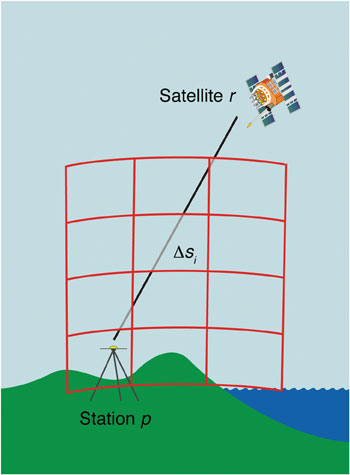
The tomographic voxel model is a three-dimensional geometrical structure with ellipsoidal borders. The grid spacing defines the resulting resolution of the tomographic analysis. In the horizontal plane, the voxel model covers the whole catchment area. For each voxel, an unknown but constant refractivity is introduced. Figure 1 illustrates the principle by means of one single observation.
FIGURE 1 Principle of GPS tomography. The refractivity in the atmosphere along the raypath of a GPS satellite signal to a ground-based receiver is discretized by a three- dimensional voxel model.
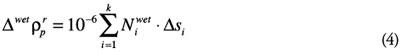
According to Equation 2, the wet part of the slant path delay ( ) for one observation between station p and satellite r can be expressed as a summation over each individual voxel i of the voxel model with a total of k voxels, through which the GPS signal passes:
The refractivity value, Ni, of each voxel is determined by performing a least-squares adjustment. A priori models and inter-voxel constraints can be introduced into the tomographic inversion system. The a priori tomographic model consists of selected voxels, which have externally estimated refractivity values. Inter-voxel constraints provide a spatially smoothing characteristic, as the actual state (or the refractivity) of the atmosphere is smoothly changing from point to point.
Double-Difference GPS Tomography. The software package AWATOS is based on double-difference GPS observations; that is, the difference of measurements made by a pair of receivers between a pair of satellites. Common errors such as those of satellite and receiver clocks difference out. The remaining errors in the observation equation are primarily just those due to atmospheric refraction. The influence of the ionosphere can be corrected to first order by using a linear combination of dual-frequency data as previously mentioned.
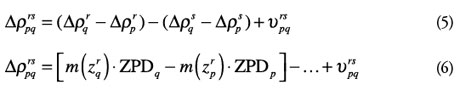
Therefore, in double-difference processing, the tropospheric slant path delay, , can be reconstructed by combining four observations (between two stations p and q and two satellites r and s). Similar to Equation 3, the total double-difference path delay, , can be written as a function of the GPS processing output (the zenith path delay, ZPD, and the double-difference phase residual ):
Usually, the dry and wet path delays are treated individually with appropriate models and mapping functions. This separation is carried out within the software package AWATOS for both the path delays and the phase residuals.
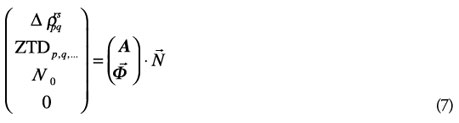
Introducing the double-difference slant path delays, , as well as the estimation of the zenith total delays, ZTD, for each station, a priori refractivity values, N0, and inter-voxel constraints , (with the scalar product condition ), into the tomographic equation system, the final form of the inversion equation for the unknown refractivity, N, according to Equation 4 including the design matrix A of the observations is:
To obtain only the wet part of the resulting refractivity field (values of refractivity and their gradients, , the individual components of the tomographic observation vector (the left-hand side of Equation 7) have to be correspondingly preprocessed. This is done by introducing additional meteorological observations or numerical data as well as tropospheric mapping functions and models.
Data Description
We recently carried out two measurement campaigns to study the feasibility of our method on a non-permanent densification network in the Swiss Alps. We were interested in investigating such a small-scale high-resolution configuration to see how it can help to determine and model water vapor over a local, mountainous catchment area. We also carried out these campaigns with an eye towards the development of a near real-time analysis procedure with a high update rate of less than one hour and the potential to support short- and medium-range weather forecasts and hydrological hazard assessment.
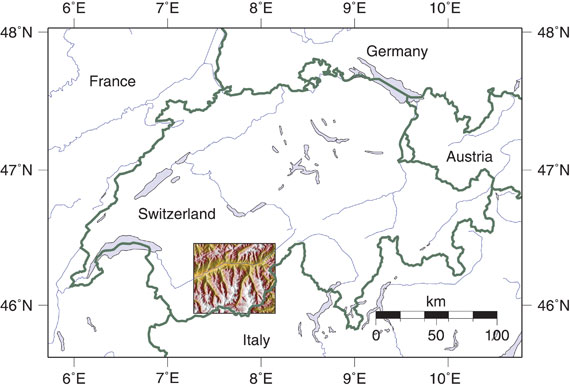
The Project Area. Two field campaigns, each lasting seven days, were carried out in an area of about 50 kilometers by 50 kilometers in the eastern part of the mountainous canton of Valais in the southwest of Switzerland (see Figure 2) in July and October 2005. This region was selected because of its high degree of exposure to hydrological hazards such as flooding of river valleys.
Figure 2. Project area (identified by the rectangle) in the Swiss Alps in the southwest of Switzerland. The elevation of the topography varies from 500 meters to over 4000 meters above mean sea level.
Besides the impact of the fast-changing meteorological situation in the project area, the rough topography is also a challenge for high-precision GPS analysis because of limited fields of view.
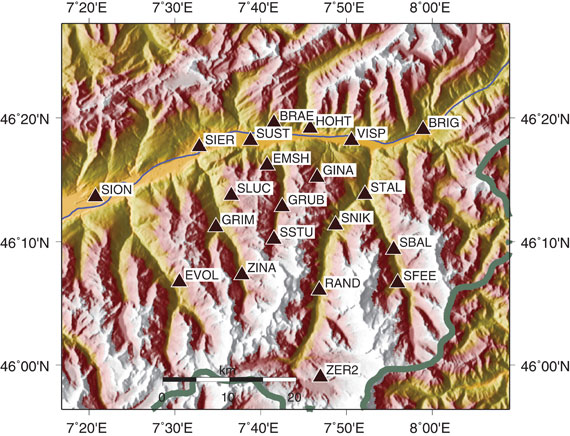
GPS Network and Meteorological Data. Ground-based geodetic GPS stations with dual-frequency receivers were deployed for continuous measurement during the period of the two campaigns. The network was complemented by permanent GPS stations from the national network. The ensemble of all stations used in July 2005 is portrayed in Figure 3.
Figure 3. The 21 GPS stations in the project area in the mountainous canton of Valais (see also Figure 2) used during the measurement campaign in July 2005. The stations’ altitudes vary between 527 meters (SION) and 3119 meters (ZER2).
In October 2005, the non-permanent three-dimensional geodetic Turtmann network was operated with six additional stations in the vicinity of the stations BRAE, SUST, and EMSH (see Figure 3). Furthermore, for this second campaign, data from three stations of the permanent geodynamics/tectonics network in Valais, TECVAL, in the northwestern part of the project area was available.
Several GPS stations were collocated with non-permanent meteorological measurement systems collecting surface temperature, humidity, and air pressure data. Also, rainfall was recorded for validation purposes at five ANETZ stations within the project area. The temperature, humidity, and air pressure observations were processed with the software package Collocation of Meteorological Data for Interpolation and Estimation of Tropospheric Path Delays (COMEDIE) developed at the Geodesy and Geodynamics Lab, ETH Zurich. COMEDIE provides a four-dimensional modeling of meteorological data in space and time. It is based on the method of least-squares collocation and interpolation, meaning that the model is described by a functional and a stochastic part. The interpolated data was used for the separation of the total delay (and refractivity) into a dry and a wet part and to obtain a priori values, N0, for the tomographic analysis (see Equation 7).
To compare the results from GPS processing and tomography, independent measurement techniques were used during the measurement campaigns: solar spectrometry, using the Geodetic Mobile Solar Spectrometer (GEMOSS), for integrated path delays as well as weather balloon soundings up to the tropopause for meteorological profile data.
The Numerical Weather Model COSMO-7. MeteoSwiss uses the COSMO-7 model, developed by the Consortium for Small-scale Modelling, for its operational numerical weather forecasts. The model domain is covered by a grid of 383 × 325 points over western and central Europe with a horizontal resolution of 7 kilometers. The model consists of 45 levels vertically distributed between the filtered orography (or mountain topography) and an altitude of 22.5 kilometers.
For comparison and validation, a subset of the reanalyzed COSMO-7 vertical grid point profile data was processed in order to obtain refractivity profiles as well as integrated and interpolated time series of zenith path delays using another of our software packages, Collocation and Interpolation of Tropospheric Path Delays (COITROPA).
Results
We processed the GPS data from the two measurement campaigns and have compared the results with those from GEMOSS, COMEDIE, radiosonde data, and COSMO-7.
GPS Data Processing. The GPS processing yields high-quality receiver coordinates, tropospheric parameter estimates (ZPD), and ionosphere-free double-difference residuals to reconstruct the slant path delays (see Equation 5). International GNSS Service (IGS) precise products, including satellite orbits, were used to analyze the data, and for ray tracing in AWATOS.
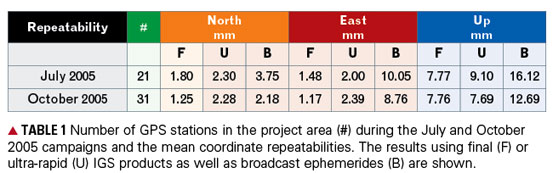
Bernese GPS Software, version 5.0, was chosen for the processing of the GPS data due to its flexibility, modular design, and state-of-the-art modeling characteristics. The network solution was obtained by using minimally constrained coordinates of selected stations of the IGS reference frame with baseline lengths of up to 1,000 kilometers. The mean repeatabilities for the north, east, and up components of the daily coordinate solutions for all stations within the project area are given in Table 1. Final as well as ultra-rapid orbits and broadcast ephemerides were used to compare the best possible results with those that could be expected in real time.
The larger number of stations during the October campaign has a positive influence on the mean coordinate repeatabilities in the horizontal plane, whereas the up component remains at the same order of magnitude. Depending on the antenna and receiver types, there was a slightly positive or negative correlation discovered between the trend of the daily coordinates and the ZTD estimates.
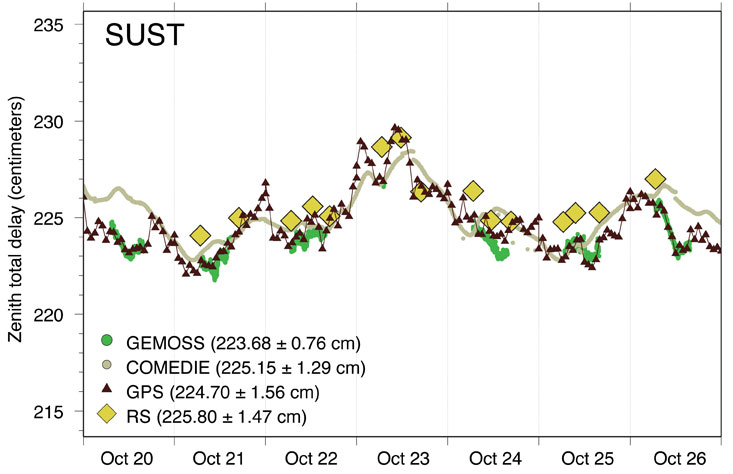
Comparison of ZTD Time Series. The time series of zenith total delays (ZTD) from GPS, GEMOSS, integrated ground meteorological data (COMEDIE), and radiosondes coincide well. In particular, the passage of a cold front with heavy rainfall in the middle of the October 2005 campaign is reflected in the two local delay maximums on October 23 (see Figure 4).
Figure 4. Comparison of zenith total delay (ZTD) at station SUST obtained with COMEDIE, GPS, the local radiosondes (RS) and solar spectrometry (GEMOSS) for the October campaign in 2005. The mean values of the ZTD time series and the standard deviation are given for each technique for comparison purposes in parentheses.
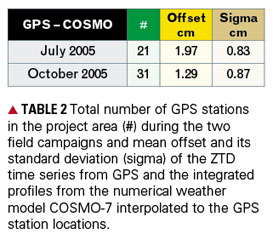
The ZTD from the balloon soundings show an almost systematic overestimation. This may be due to an inaccurate self-calibration of the sensors or a lack of data in the upper atmosphere, and the related mismodeling of the zenith path delay. Differences in the COMEDIE time series are due to meteorological inhomogeneities in the lowest part of the troposphere and the influence of distant radiosondes, which were added to get the vertical information in the upper part. The interpolated ZTD values derived from the numerical weather model COSMO-7 are on average smaller than the GPS estimates (see Table 2).
The ZTD time series of both methods, GPS and the numerical weather model, correlate well with rainfall data. There is a slow increase of the zenith path delay before the precipitation event due to the accumulation of atmospheric water vapor and an abrupt decrease afterwards. Usually, the impact of short periods of localized precipitation is more clearly represented in the GPS data of the dense observation network than in the data of the weather model. The COSMO-7 time series seem to be too smooth.
Effect of Voxel Model Resolution. In order to assess the quality of the results obtained by applying the high-resolution GPS tomographic technique, special time series contour plots were created. They consist mainly of the wet refractivity profiles for each voxel model column between mean sea level and an altitude of 10 kilometers. The height of the nearest GPS station is given by a dashed line.
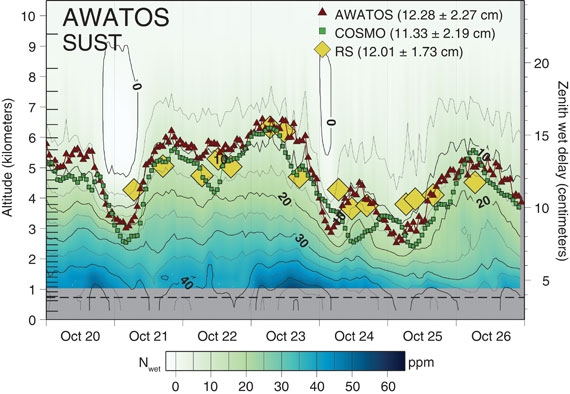
Figure 5 and Figure 6 give two examples from station SUST in the northwest of the project area (see Figure 3) during the October 2005 campaign. Figure 5 shows the wet refractivity variation from a 16-layer voxel model with 5-kilometer horizontal grid spacing, whereas Figure 6 was calculated with 32 layers with the same horizontal resolution.
Figure 5. Vertical wet refractivity distribution (in parts per million) from a 16-layer voxel model (the increasing vertical distances with height of the voxels are given by black tick marks on the left-hand side) in October 2005. The time series of integrated wet delays (ZWD) from 15 radiosondes (RS), the interpolated profiles from the numerical weather model COSMO-7, and the GPS tomographic results (AWATOS) are shown for comparison purposes with a corresponding scale on the right-hand side. Mean values and their standard deviations are shown in parenthesesFigure 6. Vertical wet refractivity distribution (in parts per million) from a 32-layer voxel model over the timespan of the October campaign in 2005 and ZWD time series of integrated AWATOS, COSMO-7, and the corresponding radiosonde (RS) profiles for comparison purposes.
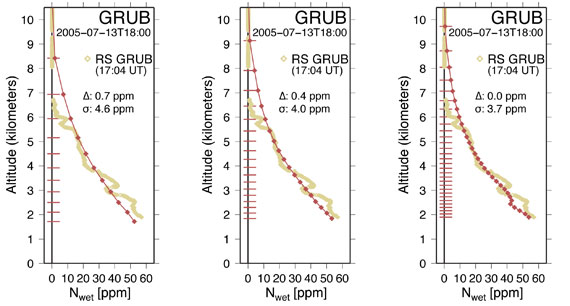
The integrated wet refractivity profiles and the reference radiosonde measurements agree better the more layers that are introduced into the tomographic voxel model. The largest differences between the results with different numbers of layers can be detected in the middle troposphere between 4- and 6-kilometers altitude (see Figure 7). It is also recognizable that in the lower troposphere, voxel models with a large number of layers are even able to resolve refractivity inversions.
Figure 7. Tomographic wet refractivity profiles (in parts per million) from 16-, 26-, and 43-layer voxel models, and that of the corresponding radiosonde (RS) launched at station GRUB at 1844 meters above mean sea level on July 13, 2005, 17:04 UTC.
We analyzed tomographic voxel models with horizontal resolutions of 15, 10, 7.5, 5, 3.75, and 3 kilometers. Increasing the horizontal resolution of the model leads to an increase in the estimated wet refractivity above an altitude of 6 kilometers compared to both the radiosondes and the numerical weather model. Due to the mean distance of about10 kilometers between the ground-based GPS stations in the project area, the best results were obtained with a similar resolution.
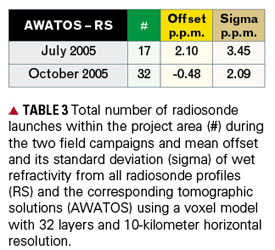
Table 3 gives the results of the comparison between the wet refractivity profiles of the tomographic analysis and the radiosondes launched within the project area.
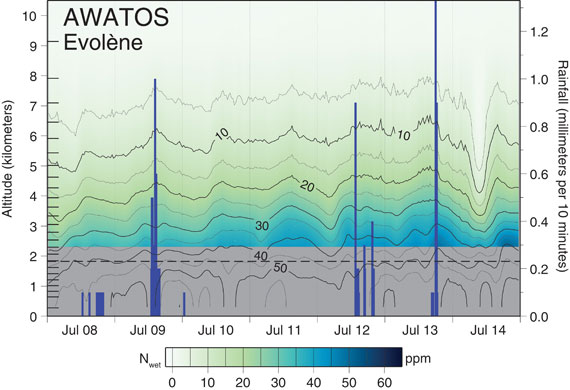
Effect of Temporal Resolution. The tomographic results shown here are based on one-hour time windows for the GPS double-difference data. Higher update rates are also possible without changing the input options of AWATOS. Figure 8 shows the wet refractivity variation based on a 10-minute window together with rainfall data at the ANETZ station Evolène in the western part of the project area.
Figure 8. Wet refractivity distribution at station Evolène (EVOL) in the western part of the project area from a 26-layer tomographic voxel model with an update interval of 10 minutes. Rainfall data in millimeters per 10 minutes is shown as vertical bars with the corresponding scale on the right-hand side.
Even though the wet refractivity profiles are affected by higher-frequency variations in the upper troposphere, precipitation and weather changes are still recognizable in the 10-minute time series.
Although the Bernese GPS Software is not designed for real-time parameter estimation, near real-time conditions can be simulated by introducing specific input files. Thus, the sensitivity of AWATOS to real-time conditions can be assessed. In terms of coordinate repeatability, the results of the horizontal components degrade by about 30 percent when using the predicted part of the ultra-rapid products (see also Table 1). Using broadcast ephemerides, the three-dimensional accuracy suffers even more.
Implications. We collected input data for both the spatially and temporally high-resolution GPS tomographic analysis and the validation of the results. The inhomogeneous distribution of rainfall in the local project area would necessitate even more rain gauges in the meteorological measurement network to perform a hydrological hazard assessment.
The comparison of independent techniques showed that the ZTD time series agree within 2 centimeters on average; that is, to better than 1 percent. The correlation of the GPS data and the data derived from the numerical weather model is greater than 70 percent. However, local rain showers are sometimes more clearly represented by the data of the dense GPS network than by COSMO-7.
It is possible to increase the spatial and temporal resolution in GPS tomography, so it can enhance numerical weather models. The better agreement of the tomographic profiles with radiosonde data, compared to the COSMO-7 estimates, indicates that the numerical weather prediction models will benefit from additional information on the vertical distribution of water vapor provided by high-resolution GPS tomography.
To assess the potential of near real-time GPS tomography, IGS satellite products with short latency and fast update rates were tested in the GPS processing. With ultra-rapid orbits, we obtained satisfactory results for the tropospheric parameters in almost real-time mode. The use of predicted orbits in the tomographic processing degrades the results of the wet refractivity profiles by 20 percent compared to using final (that is, best available) products.
Conclusions
In this brief article, we have shown that high-resolution GPS tomography is well suited for application in mountainous regions, especially in view of its potential to contribute to hydrological hazard assessment. We have been able to estimate the wet refractivity field with a spatial
and temporal resolution comparable with the current and the next generation of numerical weather models (COSMO-2 with 2-kilometer horizontal resolution).
We have been successful in illustrating several beneficial aspects of GPS tomography in supporting high-resolution numerical weather prediction models. We would also point out that tomographically determined wet refractivity fields may also be used in conjunction with directly estimated integrated slant path delays to adjust the GPS observations, especially those obtained at low elevation angles. Implemented in GPS processing software, GPS tomography could provide completely anisotropic tropospheric corrections for very high-accuracy positioning applications.
Acknowledgments
The research discussed in this article was financially supported by the Swiss National Science Foundation and the Swiss Geodetic Commission.
The Swiss Federal Office of Meteorology and Climatology, MeteoSwiss, and the Swiss Federal Office of Topography, Swisstopo, provided necessary data sets for processing, analyzing, and validating the results.
Furthermore, O. Heller and Dr. A. Somieski supported the field work and several residents or public organizations in the canton of Valais offered their premises for temporary mounting of the campaign measurement systems.
SIMON LUTZ is a research fellow at the Astronomical Institute of the University of Bern, Switzerland, and a member of the Center for Orbit Determination in Europe analysis center team. He received M.S. and Ph.D. degrees in geodesy and geodynamics from the Swiss Federal Institute of Technology (ETH), Zurich, Switzerland.
MARC TROLLER is a communications, navigation, and surveillance (CNS) expert at Swiss Air Navigation Services Ltd., Skyguide, Switzerland. He received M.S. and Ph.D. degrees in geodesy and geodynamics from ETH Zurich.
DONAT PERLER is a Ph.D. candidate at ETH Zurich. He received an M.S. degree in computer science from ETH Zurich.
ALAIN GEIGER is a professor in the Geodesy and Geodynamics Lab of the Institute of Geodesy and Photogrammetry at ETH Zurich. He received an M.S. degree in physics and a Ph.D. in geodesy and geodynamics, both from ETH Zurich.
HANS-GERT KAHLE is professor emeritus of geodesy and geodynamics at ETH Zurich and was leader of the Geodesy and Geodynamics Lab from 1979 to 2009. He received a Ph.D. degree from the University of Kiel, Germany, and the habilitation in geophysics from ETH Zurich.
FURTHER READING
• Seminal Paper on Use of GPS for Meteorology
“GPS Meteorology: Remote Sensing of Atmospheric Water Vapor Using the Global Positioning System” by M. Bevis, S. Businger, T.A. Herring, C. Rocken, R.A. Anthese, and R.H. Ware in Journal of Geophysical Research, Vol. 97, No. D14, 1992, pp. 15787–15801, doi:10.1029/92JD01517.
• Other Studies on Using GPS to Monitor the Atmosphere
“Using the Global Positioning System to Study the Atmosphere of the Earth: Overview and Prospects” by J.L. Davis, M.L. Cosmo, and G. Elgered in GPS Trends in Precise Terrestrial, Airborne, and Spaceborne Applications edited by G. Beutler, G.W. Hein, W.G. Melbourne, and G. Seeber, editors, Volume 115 of the International Association of Geodesy Symposia, Springer Verlag, Berlin, 1996, pp. 233–242.
“GPS Meteorology: Direct Estimation of the Absolute Value of Precipitable Water” by J. Duan, M. Bevis, P., Fang, Y. Bock, S. Chiswell, S. Businger, C. Rocken, F. Solheim, T. van Hove, R. Ware, S. McClusky, T.A. Herring, and R.W. King in Journal of Applied Meteorology, Vol. 35, No. 6, 1996, pp. 830–838, doi:10.1175/1520-0450(1996)035<0830:GMDEOT>2.0.CO;2.
• Effect of the Atmosphere on GPS Positioning
“Atmospheric Modelling in GPS Analysis and Its Effect on the Estimated Geodetic Parameters” by T.R. Emardson and P.O.J. Jarlemark in Journal of Geodesy, Vol. 73, No. 6, 1999, pp. 322–331, doi:10.1007/s001900050249.
“Determination of the Spatial and Temporal Variation of Tropospheric Water Vapour Using CGPS Networks” by M. Troller, A. Geiger, E. Brockmann, and H.-G. Kahle in Geophysical Journal International, Vol. 167, No. 24, 2006, pp. 509–520, doi:10.1111/j.1365-246X.2006.03101.x.
“Diagnosis of Three-Dimensional Water Vapor Using a GPS Network” by A.E. MacDonald, Y. Xie, and R.H. Ware in Monthly Weather Review, Vol. 130, No. 2, 2002, pp. 386–397, doi:10.1175/1520-0493(2002)130<0386:DOTDWV>2.0.CO;2.
“3-D Refractivity Field from GPS Double Difference Tomography” by M. Troller, B. Bürki, M. Cocard, A. Geiger, and H.-G. Kahle in Geophysical Research Letters, Vol. 29, No. 24, 2149, 2002, 4 pp. doi:10.1029/2002GL015982.
• Radio Wave Refractivity of Air
“Refractive Index Formulae for Radio Waves” by J.M. Rüeger in Proceedings of the XXII International Federation of Surveyors (FIG) International Congress, Washington, D.C., April 19–26, 2002.
• Previous GPS World Articles on Tropospheric Propagation Delay
The September “Innovation” column in this magazine, “It’s Not All Bad: Understanding and Using GNSS Multipath,” by Andria Bilich and Kristine Larson, mentions the use of multipath in studying soil moisture, ocean altimetry and winds, and snow sensing. An experiment the authors conducted, designed to study soil moisture, yielded a surprise bonus: a new methodology for measuring snow depth via GPS multipath. It has important implications for weather and flood forecasting, and could also bring new insight to bear on GPS antenna design.
In the “Innovation” column, the authors wrote, “Motivated by our studies showing that multipath effects could clearly be seen in geodetic-quality data collected with multipath-suppressing antennas, we proposed that these same GPS data could be used to extract a multipath parameter that would correlate with changes in the reflectance of the ground surface. . . .
“We carried out an experiment designed to more rigorously demonstrate the link between GPS signal-to-noise ratio (SNR) and soil moisture. Specifically, we were interested in using GPS reflection parameters to determine the soil’s volumetric water content — the fraction of the total volume of soil occupied by water, an important input to climate and meteorological models. Traditional soil moisture sensors (water content reflectometers) were buried in the ground at multiple depths (2.5 and 7.5 centimeters) at a site just south of the University of Colorado.”
Here Comes the Storm. During the experiment, two late-season snowstorms swept over Boulder. Larson and colleagues discovered that changes in multipath clearly correlated with changes in the snow’s depth, as measured by hand and with ultrasonic sensors at the test site. While it has been long recognized that snow can affect a GPS signal, this demonstrates for the first time that a standard GPS receiver, antenna, and installation — deliberately designed to suppress multipath — can be used to measure snow depth.
On September 11, Geophysical Research Letters, published by the American Geophysical Union, featured an article titled “Can We Measure Snow Depth with GPS Receivers?” by Larson and Felipe Nievinski of the Department of Aerospace Engineering Sciences, University of Colorado; Ethan Gutmann and John Brown of the National Center for Atmospheric Research; Valery Zavorotny of the National Oceanic and Atmospheric Administration; and Mark W. Williams, from UC’s Department of Geography, all based in Boulder.
The authors adapted an algorithm used for modeling GPS multipath from bare soil to predict GPS SNR for snow, introducing a uniform planar layer of the snow on the top of soil. The algorithm treats both direct and surface-reflected waves at two opposite circular polarizations as plane waves that sum up coherently at the antenna. They write:
“The amplitude and the phase of the reflected wave is driven by a polarization-dependent, complex-value reflection coefficient at the upper interface of such a combined medium with a known vertical profile of the dielectric permittivity e. The reflection coefficient is calculated numerically using an iterative algorithm in which the medium is split into sub-layers with a constant e. For the soil part, we use a known soil profile model that depends on the soil type and moisture. For frozen soil, soil moisture (liquid water) is low, as for very dry soil. For the snow part, we take a constant profile with e, considering relatively dry and wet snow layer thicknesses.
“After calculating the complex amplitude of the reflected wave at each polarization, we multiply it by a corresponding complex antenna gain. The same procedure is applied to the complex amplitude of the direct wave. After that, the modulation pattern of the received power, or the SNR, as a function of the GPS satellite elevation angle is obtained by summing up coherently all the signals coming from the antenna output and taking the absolute value square of the sum.”
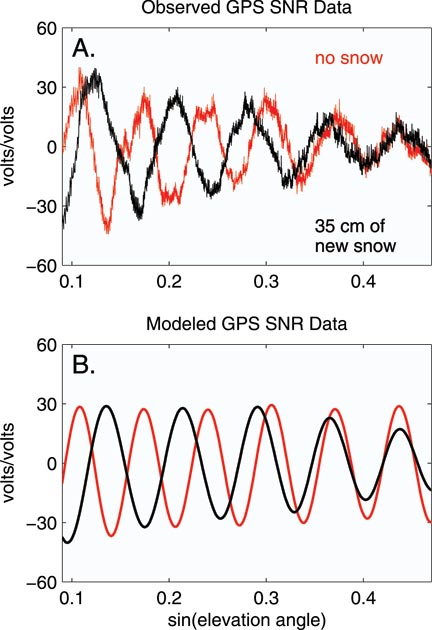
Figure 1(a) shows GPS SNR measurements for one satellite on the day immediately before and the day immediately after an overnight snowfall of 35 centimeters (roughly 10 inches). Figure 1(b) shows the corresponding model predictions for multipath. The two figure portions amply demonstrate that the multipath has a significantly lower frequency if snow is present as compared with bare soil. The authors further noted that the model amplitudes do not show as pronounced a dependence on satellite elevation angle as the observations, and state the necessity of further work on antenna gains in order to use model amplitude predictions.
Figure 1. (a) GPS SNR measurements for PRN 7 observed at Marshall GPS site on days 107 (red) and 108 (black) after direct signal component has been removed. Approximately 35 centimeters of snow had fallen by day 108. (b) Model predictions for GPS multipath from day 107 with no snow on the ground (red), and day 108 after 35 centimeters of new snow fall had accumulated (black) using an assumed density of 240 kg m-3 (figures reproduced by permission of American Geophysical Union).
How Deep the Snow. The authors propose that the hundreds of geodetic GPS receivers operating in snowy regions of the United States, originally installed for plate deformation studies, surveying, and weather monitoring, could also provide a cost-effective means to estimate snow depth.
Currently, a few conventional monitor points measure snow depth, but only at that point, and the data does not extrapolate well. Snow forms an important component of the climate system and a critical storage component in the hydrologic cycle. Accurate data of the amount of water stored in the snowpack is critical for water supply management and flood control systems. As more snow falls at higher elevations, varying greatly even within one valley or watershed, current remote-sensing snow monitors do not supply adequate data. Further, snow may be redistributed by wind, avalanches, and non-uniform melting, so that continuous data would be very helpful.
Using GPS multipath to map snow depth could improve watershed analyses and flood prediction — and, carried steps further, produce data to help better understand multipath, bringing innovation to future antenna designs.
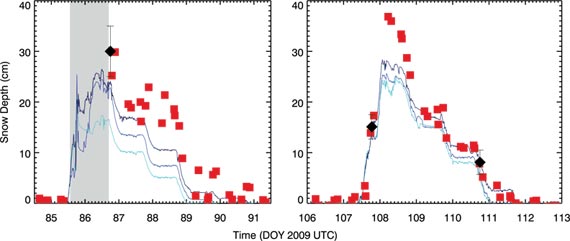
FIGURE 2. Snow depth derived from GPS (red squares), the three ultrasonic snow depth sensors (blue lines), and field measurements (black diamonds). Bars on field observations are one standard deviation. GPS snow-depth estimates during the first storm (doy 85.5–86.5) are not shown (gray region) because the SNR data indicate that snow was on top of the antenna.
Kristine Larson was featured as one of the “50 GNSS Leaders to Watch” in the May 2009 issue of GPS World.
Manufacturer
For the experiment a Trimble NetRS receiver was used with a TRM29659.00 choke-ring antenna with SCIT radome, pointed at zenith.