Analysts forecast the GIS market in India to grow at a CAGR of 8.19 percent over the period 2012-2016, according to a report released by Research and Markets. One of the key factors contributing to this market growth is the increasing demand from the government sector. The GIS market in India has also been witnessing the development of next-generation systems. However, the need for high initial investment could pose a challenge to the growth of this market, the report says.
The report, the GIS Market in India 2012-2016, has been prepared based on an in-depth market analysis with inputs from industry experts. The report covers the GIS market in India landscape and growth prospects in the coming years. The report also includes a discussion of the key vendors operating in this market.
The key vendors dominating this market space include Autodesk Inc., Esri Inc., GE Energy, Hexagon AB, Hitachi Zosen Corp., MacDonald, Dettwiler and Associates Ltd., and Rolta India Ltd.
GeoMobile Innovations announced they are conducting an ArcPad 10 workshop on the Oregon State University campus September 12-13, 2013. Taught by ArcPad “guru” Craig Greenwald, the workshop will provide an extensive overview and hands on training opportunity for new and current ArcPad users or GIS administrators who manage and support field crews using ArcPad.
“We will review the new features in the newly-released ArcPad 10.2 such as integration with ArcGIS Online as well as cover the entire soup-to-nuts ArcPad workflow,” said Greenwald, a 7-year veteran of the ArcPad team. “We will also discuss integrating high-accuracy GIS data collection in ArcPad, an increasingly popular trend.”
The workshop will be conducted in Corvallis, Oregon on the beautiful Oregon State University campus. Corvallis is nestled in the heart of Oregon’s Willamette Valley, within 60-90 minutes of the Portland Metropolitan area, mountains, and the spectacular Oregon coast.
Those interested are encouraged to inquire/register quickly. Class size is limited.
GeoMobile Innovations Inc., located in Corvallis, Oregon USA, specializes in ESRI Mobile GIS platforms and has years of experience in field to office data workflow projects, with a forte in high quality Mobile GIS application development. An ESRI Business Partner (reseller, developer, and consultant), GeoMobile’s mission is to work as a partner with clients, empowering them to improve return on investment by implementing quality Mobile GIS and field data collection solutions.
The U.S. Census Bureau released an interactive, online map pinpointing the wide array of languages spoken in homes across the nation, along with a detailed report on rates of English proficiency and the growing number of speakers of other languages.
The 2011 Language Mapper shows where people speaking specific languages other than English live, with dots representing how many people speak each of 15 different languages. For each language, the mapper shows the concentration of those who report that they speak English less than “very well,” a measure of English proficiency. The tool uses data collected through the American Community Survey from 2007 to 2011.
“This map makes it easy for anyone to plan language services in their community,” said Nancy Potok, the Census Bureau’s acting director. “Businesses can tailor communications to meet their customers’ needs. Emergency responders can use it to be sure they communicate with people who need help. Schools and libraries can offer courses to improve English proficiency and offer materials written in other languages.”
According to the announcement, the languages available in the interactive map include Spanish, French, French Creole, Italian, Portuguese, German, Russian, Polish, Persian, Chinese, Japanese, Korean, Vietnamese, Tagalog and Arabic. After selecting one of these languages from the menu, users will see a national population density map, with each dot representing about 100 people who speak the language at home placed where these speakers are concentrated. The map also allows users to zoom in to a smaller geographic area, where each dot represents 10 people. The dots were placed in a random location within census tracts to protect the confidentiality of speakers.
Increase in Non-English Speakers
Also released by the U.S. Census Bureau, the report, Language Use in the United States: 2011, [PDF] details the number of people speaking languages other than English at home and their ability to speak English, by selected social and demographic characteristics. It shows that more than half (58 percent) of U.S. residents 5 and older who speak a language other than English at home also speak English “very well.” The data, taken from the American Community Survey, are provided for the nation, states and metropolitan and micropolitan areas.
The report shows that the percent speaking English “less than very well” grew from 8.1 percent in 2000 to 8.7 percent in 2007, but stayed at 8.7 percent in 2011. The percent speaking a language other than English at home went from 17.9 percent in 2000 to 19.7 percent in 2007, while continuing upward to 20.8 percent in 2011.
“This study provides evidence of the growing role of languages other than English in the national fabric,” said Camille Ryan, a statistician in the Census Bureau’s Education and Social Stratification Branch and the report’s author. “Yet, at the same time that more people are speaking languages other than English at home, the percentage of people speaking English proficiently has remained steady.”
Of the 60.6 million people who spoke a language other than English at home in 2011, almost two-thirds (37.6 million) spoke Spanish.
Reflecting the overall trend, the percentage speaking Spanish at home grew from 12.0 percent in 2005 to 12.9 percent in 2011. In contrast to the overall trend, however, the percent who spoke Spanish at home but spoke English “less than very well” declined from 5.7 percent to 5.6 percent over the period.
The recent increase in non-English speakers continues a trend dating back three decades. Between 1980 and 2010, the number of people speaking a language other than English climbed 158 percent, compared with 38 percent for the overall population 5 and older. The seven-fold increase in Vietnamese speakers was the highest percentage jump among 17 of the most common languages, while Spanish speakers posted the largest numerical gain (25.9 million). In contrast, the number speaking Italian, German, Polish, Yiddish and Greek declined over the period.
Other highlights:
In addition to English and Spanish, there were six languages in 2011 spoken at home by at least 1 million people: Chinese (2.9 million), Tagalog (1.6 million), Vietnamese (1.4 million), French (1.3 million), German (1.1 million) and Korean (1.1 million).
The prevalence of people speaking non-English languages at home varied widely across states, from 44 percent of the population in California to 2 percent in West Virginia.
Laredo, Texas, led all metro areas with 92 percent of residents age 5 and older speaking a language other than English at home.
Metro and micro areas in the West, South and Northeast tended to have higher levels of people speaking non-English languages at home. Those in the Midwest tended to have lower levels, with the exception of Illinois.
Of Spanish speakers, 45 percent of foreign-born naturalized citizens spoke English “very well” compared with 23 percent of foreign-born noncitizens. Those who were native-born, had at least a bachelor’s degree or were not in poverty were more likely to speak English “very well.”
Eighty percent or more of French and German speakers spoke English “very well.” In contrast, less than 50 percent of those who spoke Korean, Chinese or Vietnamese spoke English “very well”. The rate for Spanish speakers was 56 percent.
HERE announced that it will make available its indoor Venue Maps to Qualcomm Atheros, Inc., a subsidiary of Qualcomm Incorporated. Leveraging indoor map data from HERE that is tightly coupled to the core indoor positioning engine will help Qualcomm IZat location technologies deliver more precise positioning (within 3-5 meters) to mobile devices inside buildings. Improving the overall indoor location experience for consumers, this combination is expected to accelerate the development and use of compelling location-based experiences as well as promotions in shopping malls, transportation hubs and entertainment venues around the globe.
“In our quest to deliver location awareness everywhere, Qualcomm Atheros is propagating indoor location capabilities to ensure the best possible experiences in a wide variety of places,” said Cormac Conroy, vice president of the mobile, computing and location business unit at Qualcomm Atheros. “Our collaboration with HERE complements the capabilities of our IZat location platform to deliver the exceptional accuracy that is required for businesses and app developers looking for ways to reach mobile consumers and create additional revenue opportunities from location-based services.”
To map buildings, HERE reports that mapmakers visit venues from airports to zoos to sports complexes, museums and other facilities around the world to ensure map data is precise and no detail is forgotten. They collect building floor plans and then validate against the real world which includes double-checking the names of points of interest and ensuring that rich features such as ATM machines, restrooms and escalators are included.
“Indoor spaces are among the new frontiers in mapping and HERE is uniquely positioned to bring its global leadership in outdoor mapping to inside venues,” said Cliff Fox, senior vice president of Location Content at HERE. “Not only have we been the first to map some of the most recognized buildings in the world, but we also offer the world’s broadest coverage of indoor spaces with currently more than 9,000 venues consisting of 50,000 unique buildings mapped in 69 countries. With our continuously expanding reach in coverage and focus on efforts to improve accuracy, we can support Qualcomm Atheros in its quest to provide access to accurate location information and services to consumers as they move about venues.”
Venue Maps complement Qualcomm Atheros’ end-to-end IZat indoor positioning capabilities to deliver always-on location awareness to mobile devices in more places. IZat is comprised of Qualcomm Atheros’ broad technology portfolio, including cellular, global navigation satellite system (GNSS), Wi-Fi, sensor and cloud-based assistance solutions, as well as its widely deployed location core, already found in more than one billion devices on mobile networks worldwide.
Metaio and AUDI AG announced the release of the Audi A3 eKurzinfo augmented reality mobile application, available for free download on iOS devices.
The new app can recognize over 300 individual elements of the Audi A3 – from the insignia on the windshield wipers and entertainment system to actual engine components under the hood – in order to return relevant how-to information or even virtual overlays of maintenance instructions animated in real-time 3-D. Metaio’s cloud-based architecture pushes digital information directly to the device, meaning the user will never have to update the app.
According to the announcement, the new design of the Audi A3 eKurzinfo app brings the most intuitive user experience with it: using Metaio’s latest 2-D and 3-D augmented reality tracking technology, the user positions the camera of the mobile device directly over individual vehicle elements, instantly detecting and returning information on the desired subject. For example, after scanning the engine compartment, the app would return information with an animated overlay showing how to locate the engine coolant and refill it to the appropriate level.
In the future, Metaio sees visualization technology decreasing the need for lengthy, costly and complex user manuals. Car owners should be able to access information instantly and directly from the car itself.
“After the remarkable success of the first version of the eKurzinfo application, we are delighted to continue our partnership with the Audi AG. We see enormous potential in the field of interactive service applications. In the future it will be possible to automatically retrieve the specific information relevant in a certain situation”, Dr. Thomas Alt, CEO of Metaio.
The Audi eKurzinfo app is available in English, German and Japanese.
Autodesk, Inc. announced the launch of Autodesk FBX Review for Microsoft Windows 7 and Windows 8 enabled devices. The standalone app gives professional artists and animators a powerful, lightweight tool to conduct detailed reviews of a wide range of 3D assets, including detailed 3D models, environments and character animations.
“We’ve consistently observed our customers’ need to speed up project iteration, while maintaining high-fidelity assets that are faithful to the original design,” said Chris Bradshaw, senior vice president, Autodesk Media & Entertainment. “FBX Review streamlines the asset review process, providing greater flexibility for mobile, decentralized creative teams.”
Intuitive, Full-Featured Asset Review
According to the announcement, modern workflows include numerous internal and external clients and stakeholders, many in different locations. Autodesk FBX Review allows any user on a Windows device or platform to view 3D assets with a robust feature set, without using commercial 3D animation software. For example, an artist working in Autodesk Maya can send an animation file to anyone who has installed FBX Review, and the recipient will have a full menu of features with which to view the assets.
By supporting a wide range of open 3D file formats, from popular digital creation formats like .fbx, .3ds, and .obj to .dxf, an Autodesk AutoCAD format, FBX Review gives artists the freedom to use their favorite 3D tools. Reviewers can then choose to view assets with various shading options, animations, cameras or lighting options in the Microsoft DirectX 11 enabled viewport. Supported viewing options include:
Static and Dynamic Tessellation
Displacement and Vector Displacement Maps
Skin Deformations and Animation
Real-Time Shadow Maps
Reflection Maps
Light and Ambient Occlusion Maps
Image Based Lighting
Ground and Sky Ambient Color
To evaluate animations and scenes, FBX Review offers easy-to-use controls to cycle through animation takes and different camera angles to quickly play, pause and scrub-through animations. Scenes can be viewed with the cameras and lights native to the file or with the in-app perspective and orthographic cameras.
Mobile-Friendly Design
Autodesk FBX Review’s mobile support provides a near seamless way to continue the production cycle away from the workstation. Developed from the ground up for the Windows 8 platform, the mobile app incorporates the same full feature set as the desktop app, with a simple user interface that leverages the touch screen display, such as a multi-view camera that allows reviewers to pan, circle or zoom in on assets and touch sensitive animation playback and lighting controls. The mobile app simply requires Microsoft Windows 8 OS, 50 MB of disk space for installation and only 4GB of RAM. For optimal asset viewing, mobile devices should also include a graphics card that supports Microsoft DirectX 11.
Esri has released ArcPad 10.2. ArcPad is mobile mapping and field data collection software designed for GIS professionals. The new version of ArcPad improves synchronization with the ArcGIS platform and speeds data collection in the field with new automation options.
Esri’s reported its latest release of ArcPad gives users the ability to directly open ArcGIS feature services in ArcPad and synchronize edits with hosted or on-premises GIS. The new capability significantly improves mobile workflows by enabling disconnected editing of published services. In addition, ArcPad gives users the ability to automate edits with a Quick Fields option, which can be customized to autopopulate any field during data collection.
According to the announcement, for users who rely on desktop workflows that revolve around file sharing and distribution, ArcPad 10.2 includes new ArcGIS Online integration. With this option, users can store their ArcPad projects and QuickProject templates as an ArcPad package in their ArcGIS Online accounts for sharing with members of their group. ArcGIS Online subscribers can also browse ArcGIS Online from inside ArcPad with the ability to select and download a project or template, creating an easy, collaborative workflow.
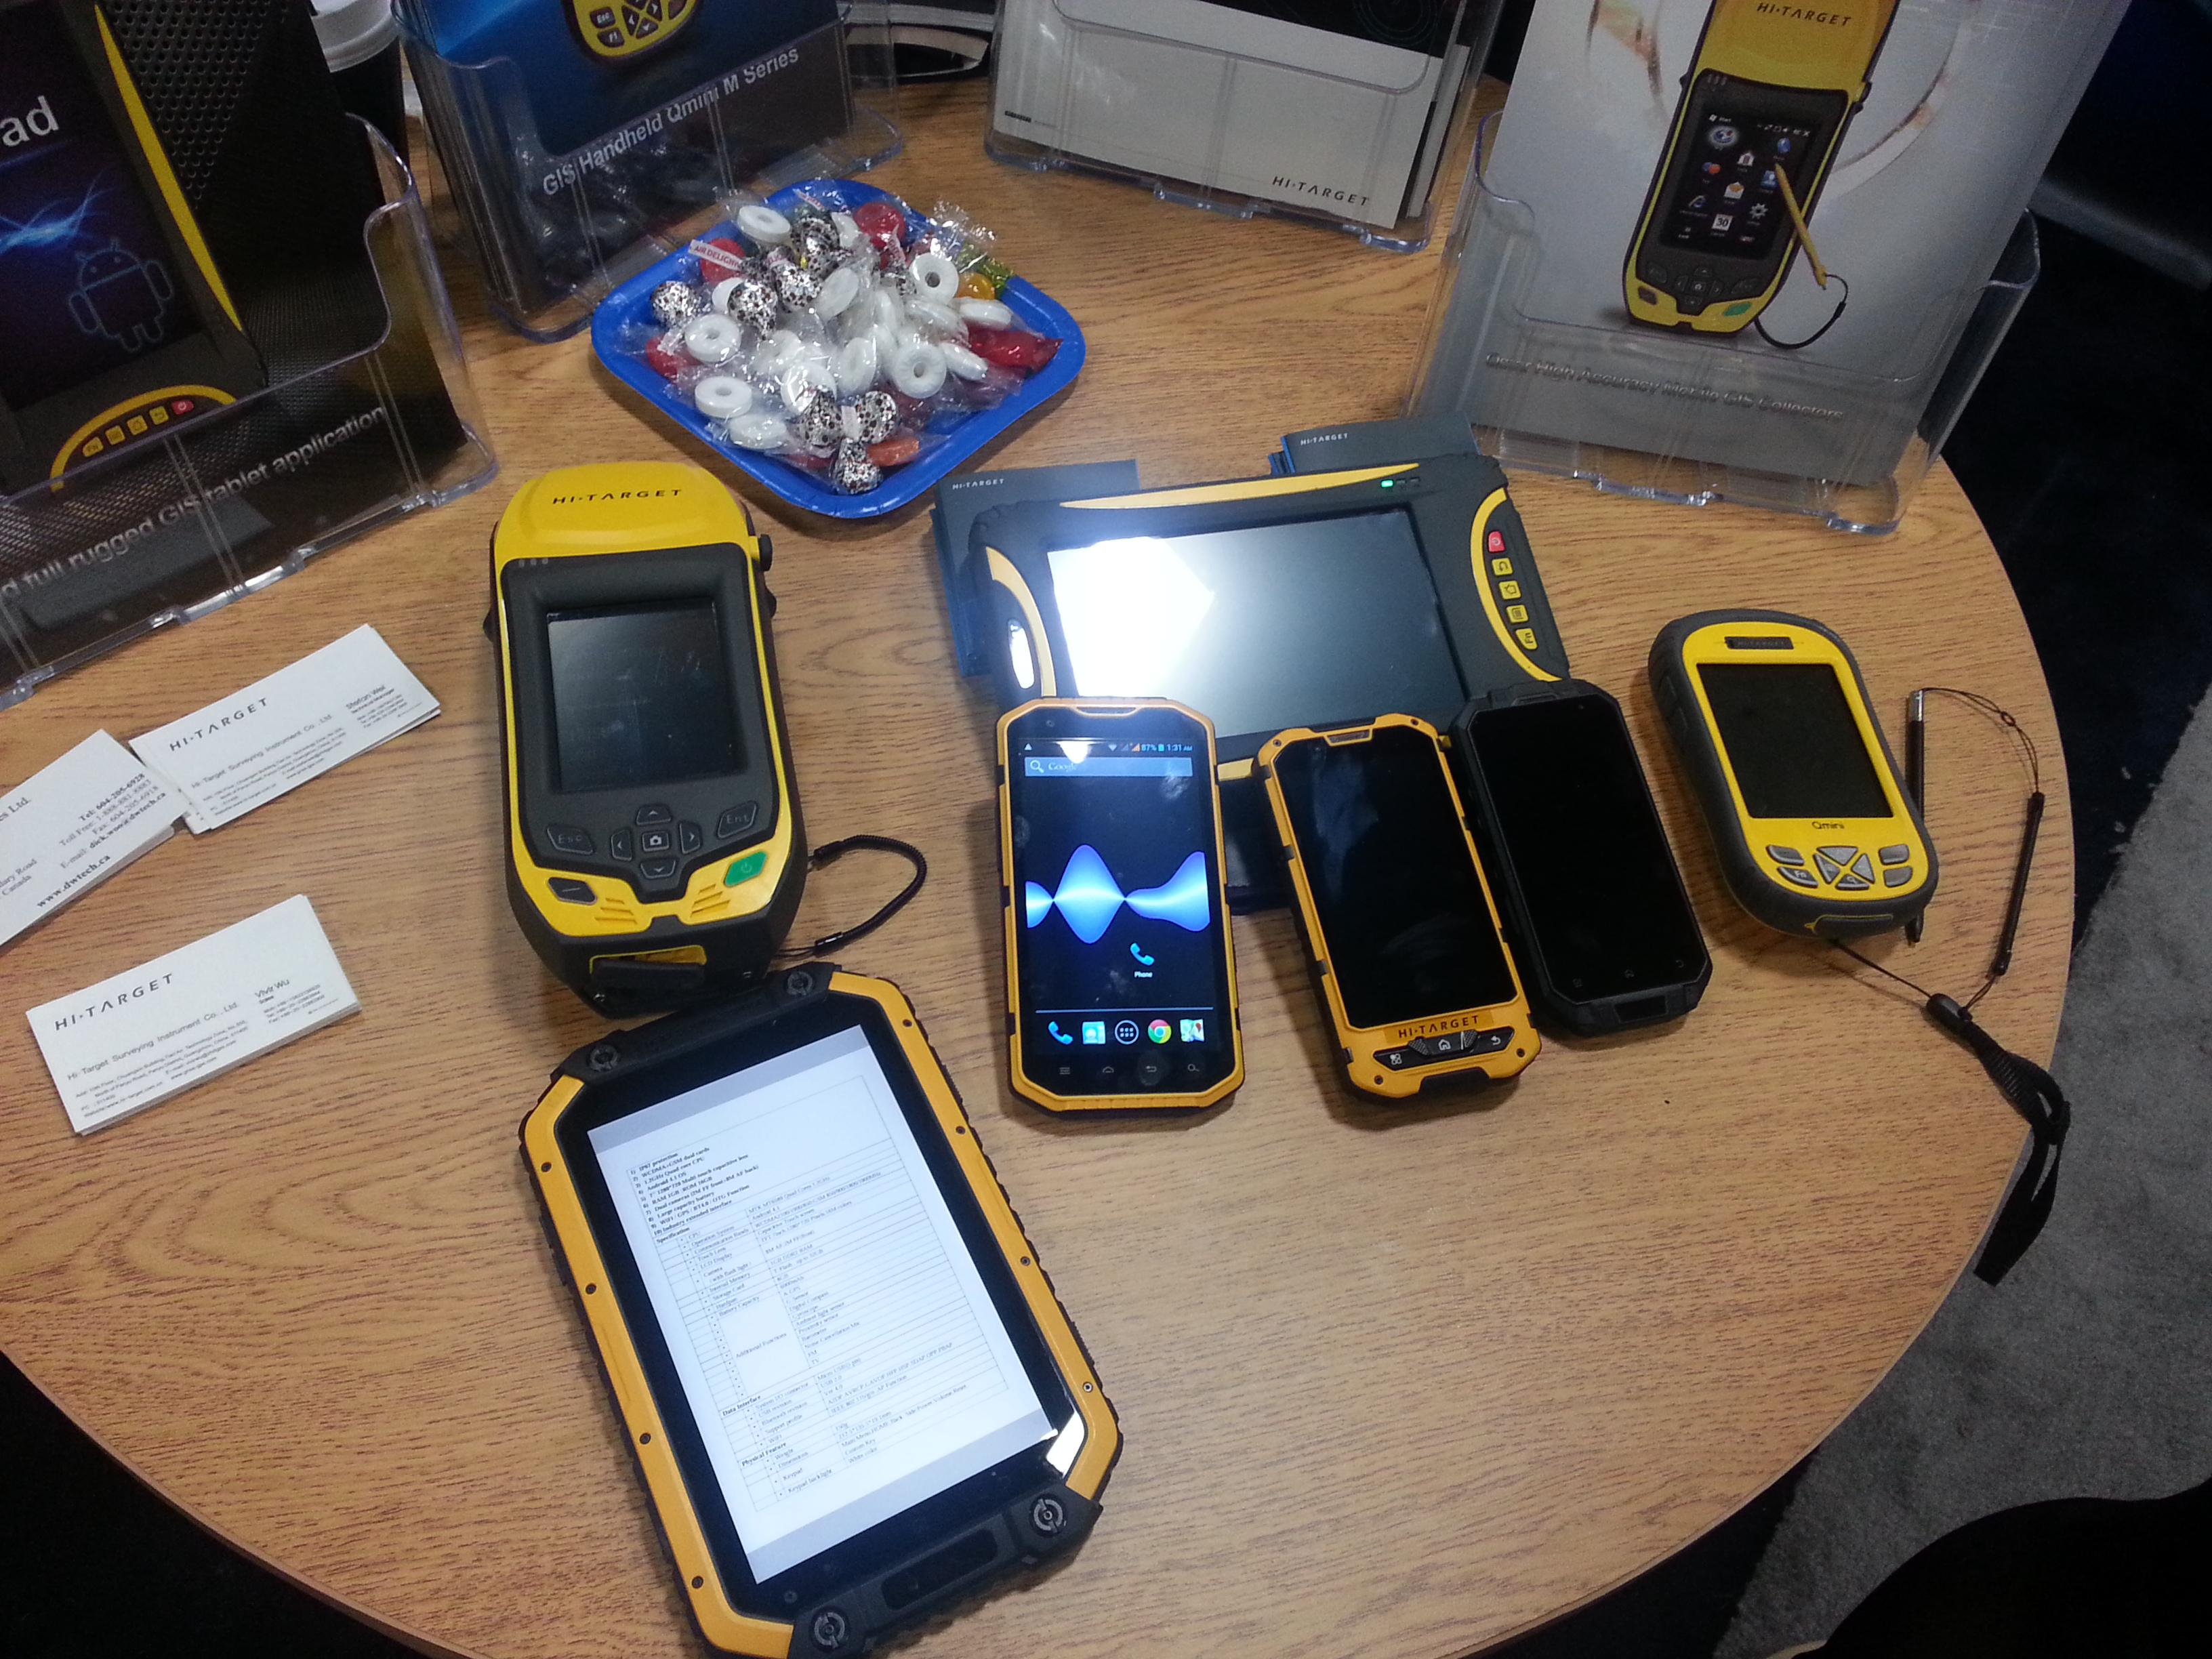
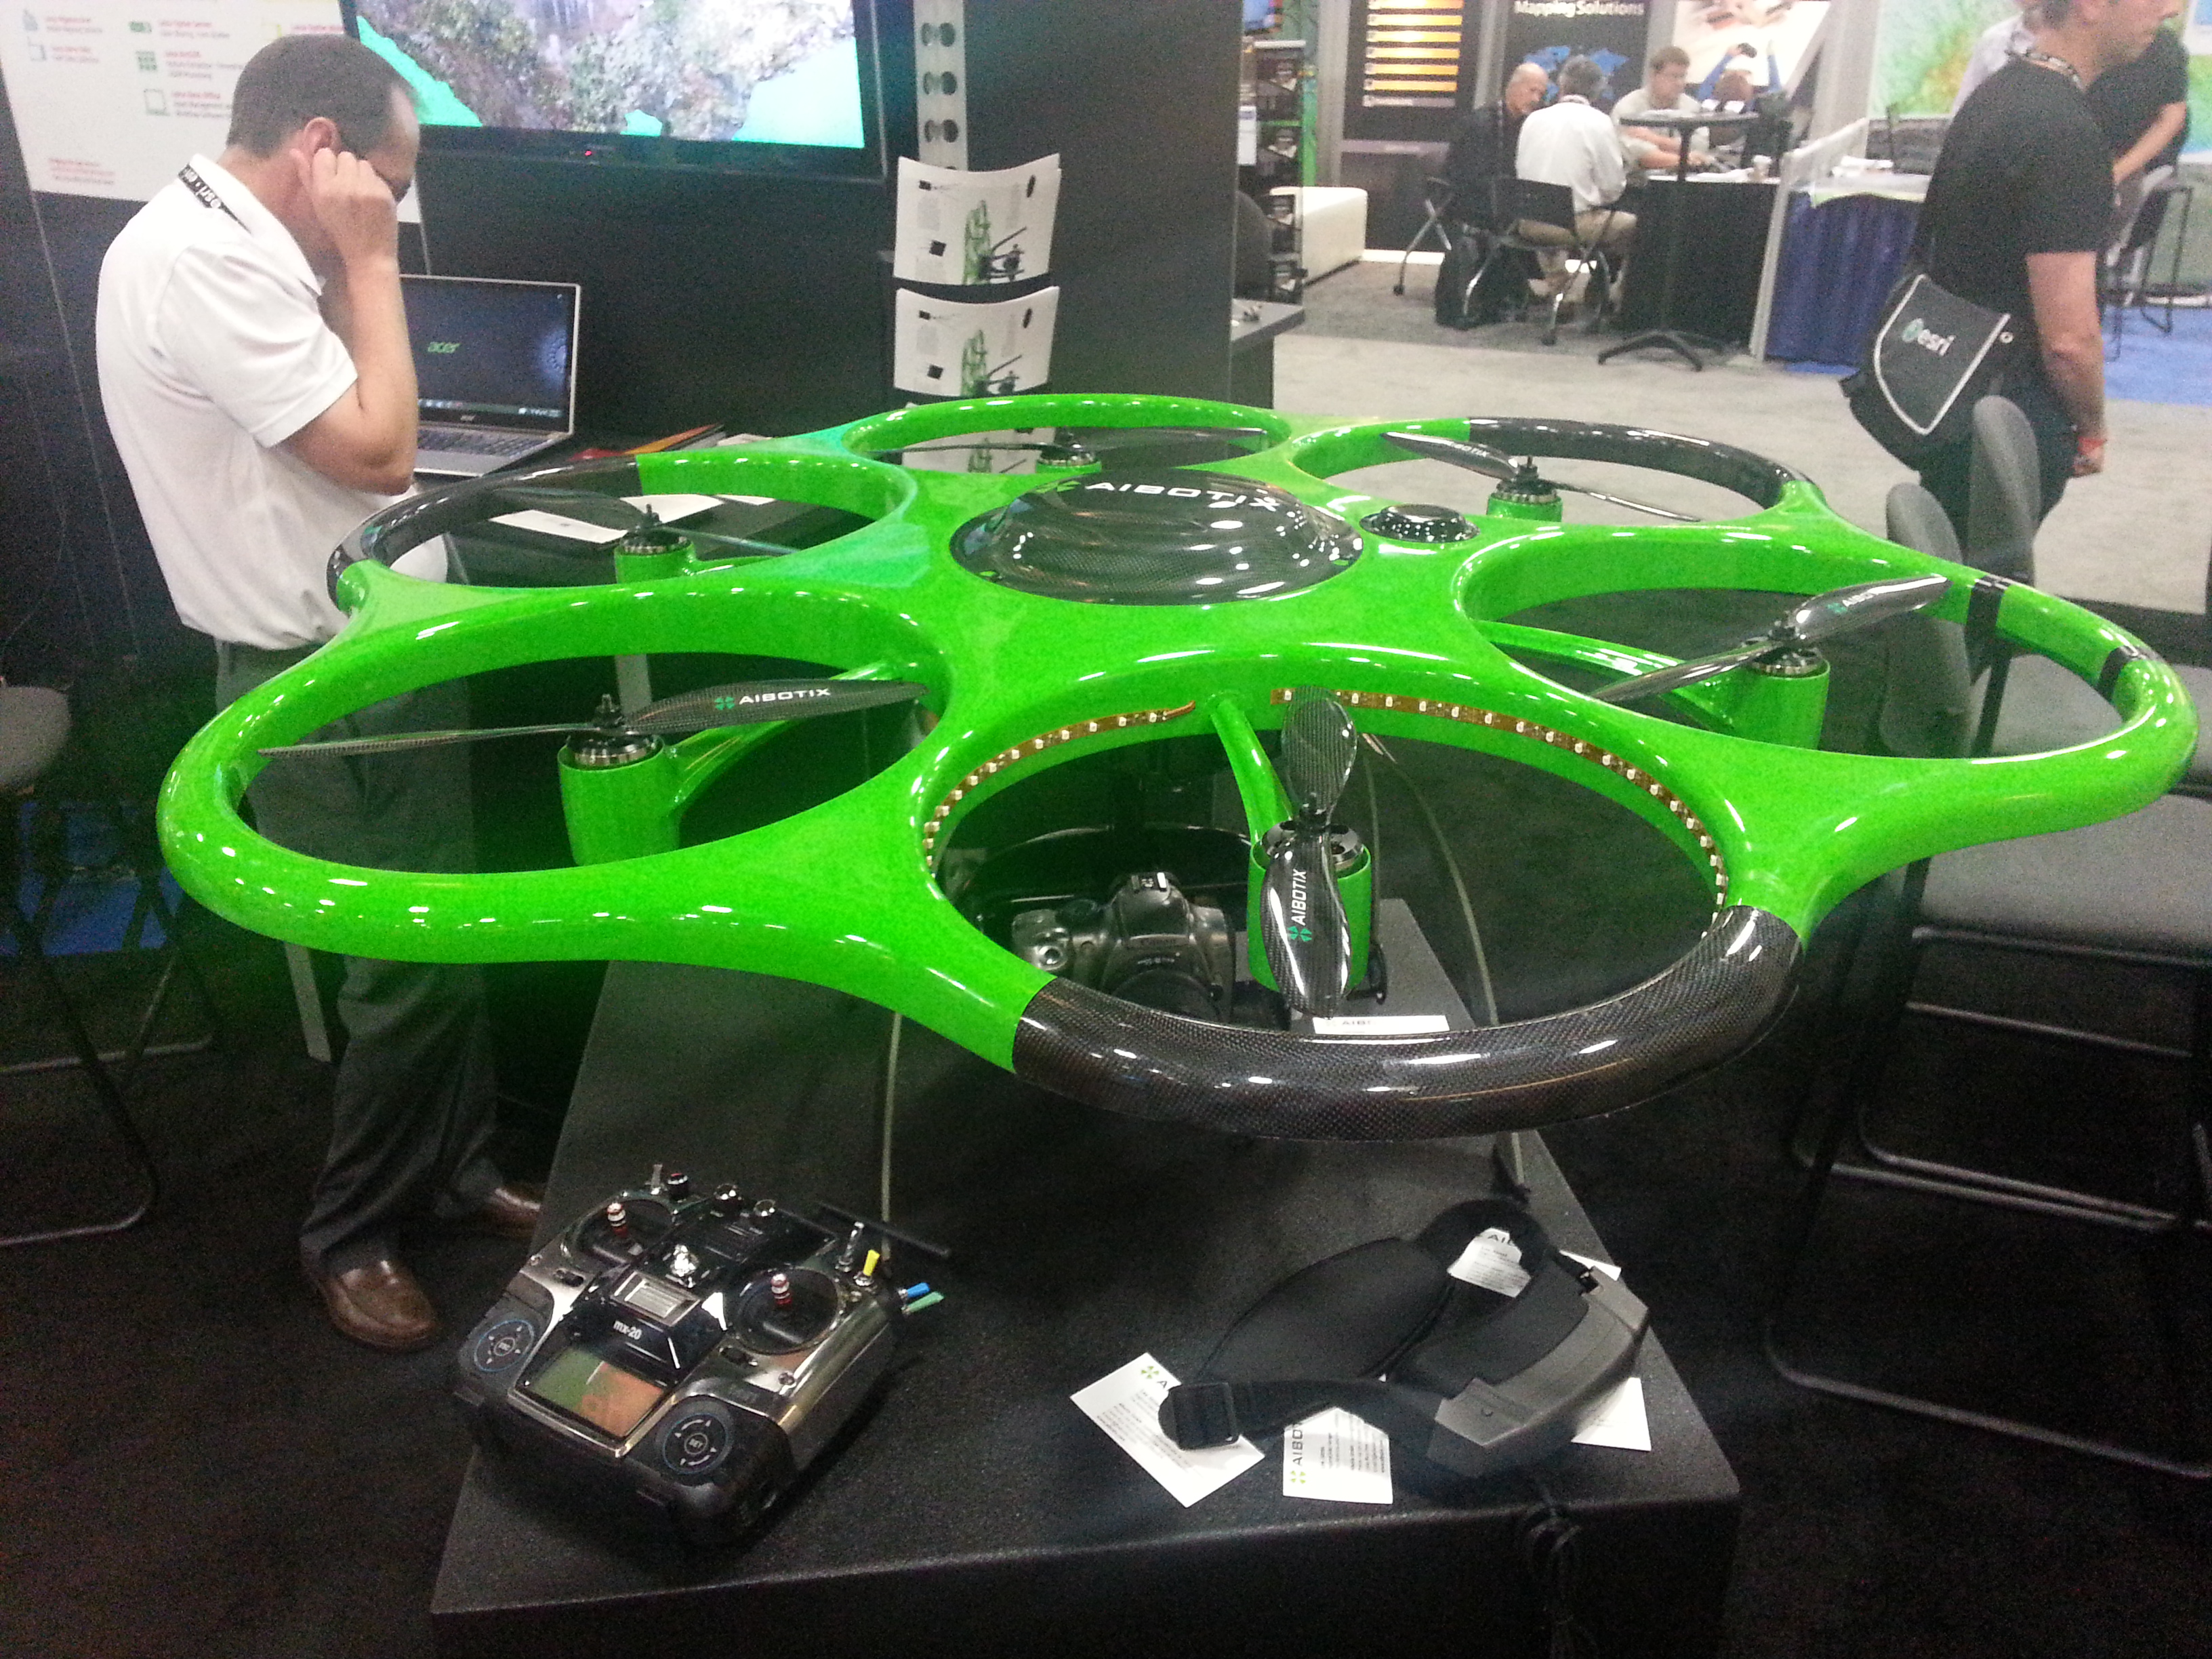
The Esri Survey Summit and Esri International User Conference (UC) were held in July in San Diego, California (they’re held San Diego every year). As always, these events are a whirlwind of spatial data technology, covering surveying software to handhelds/tablets, GNSS/GPS units, UAVs, handhelds/tablets, and plotters. There are only two conferences in the world where you will experience such a breadth and depth of hardware/software spatial technology: the Esri International User Conference (UC) and Intergeo.
The Esri UC, which is preceded by the Esri Survey Summit, is a vendor-specific conference, so you won’t see any Esri competitors there (such as Autodesk, Intergraph, MapInfo, Bentley, and Smallworld). Intergeo, set for October 8-10, is vendor-independent, so anyone can attend if you pay the fee, but it’s always located in Germany, which puts it out of reach for many North and South Americans. It’s also much more focused on business and a trade show than the UC. Finally, the Esri UC offers many more technical sessions than Intergeo. In my opinion, one of the greatest values of the Esri UC is the diverse, GIS-centric technical sessions available for about any vertical market you can imagine, from utility infrastructure to municipal engineering and wetland science. If you’re interested in browsing the technical sessions from last month’s Esri UC, you can do so here.
Survey Summit
The bulk of the Survey Summit was held the weekend before the Esri UC. This is an event where surveyors and GIS professionals (sometimes the same person) interact. The concept is solid, as surveying and GIS technologies are converging. However, this year’s Survey Summit suffered from a lack of attention from the organizers and, consequently, attendance took a hit. Only about 150 people attended, when the conference really should attract 750-1,000 people. Yes, tight travel budgets can be attributed to the decline in attendance, but there wasn’t buzz created leading up to the conference, and the content was marginal. For the first time since I can remember, there was no exhibition area for vendors. Note to Survey Summit organizers: I get that you’re busy on other projects, but if you want this to be a serious conference, you’ve got to put more energy into it.
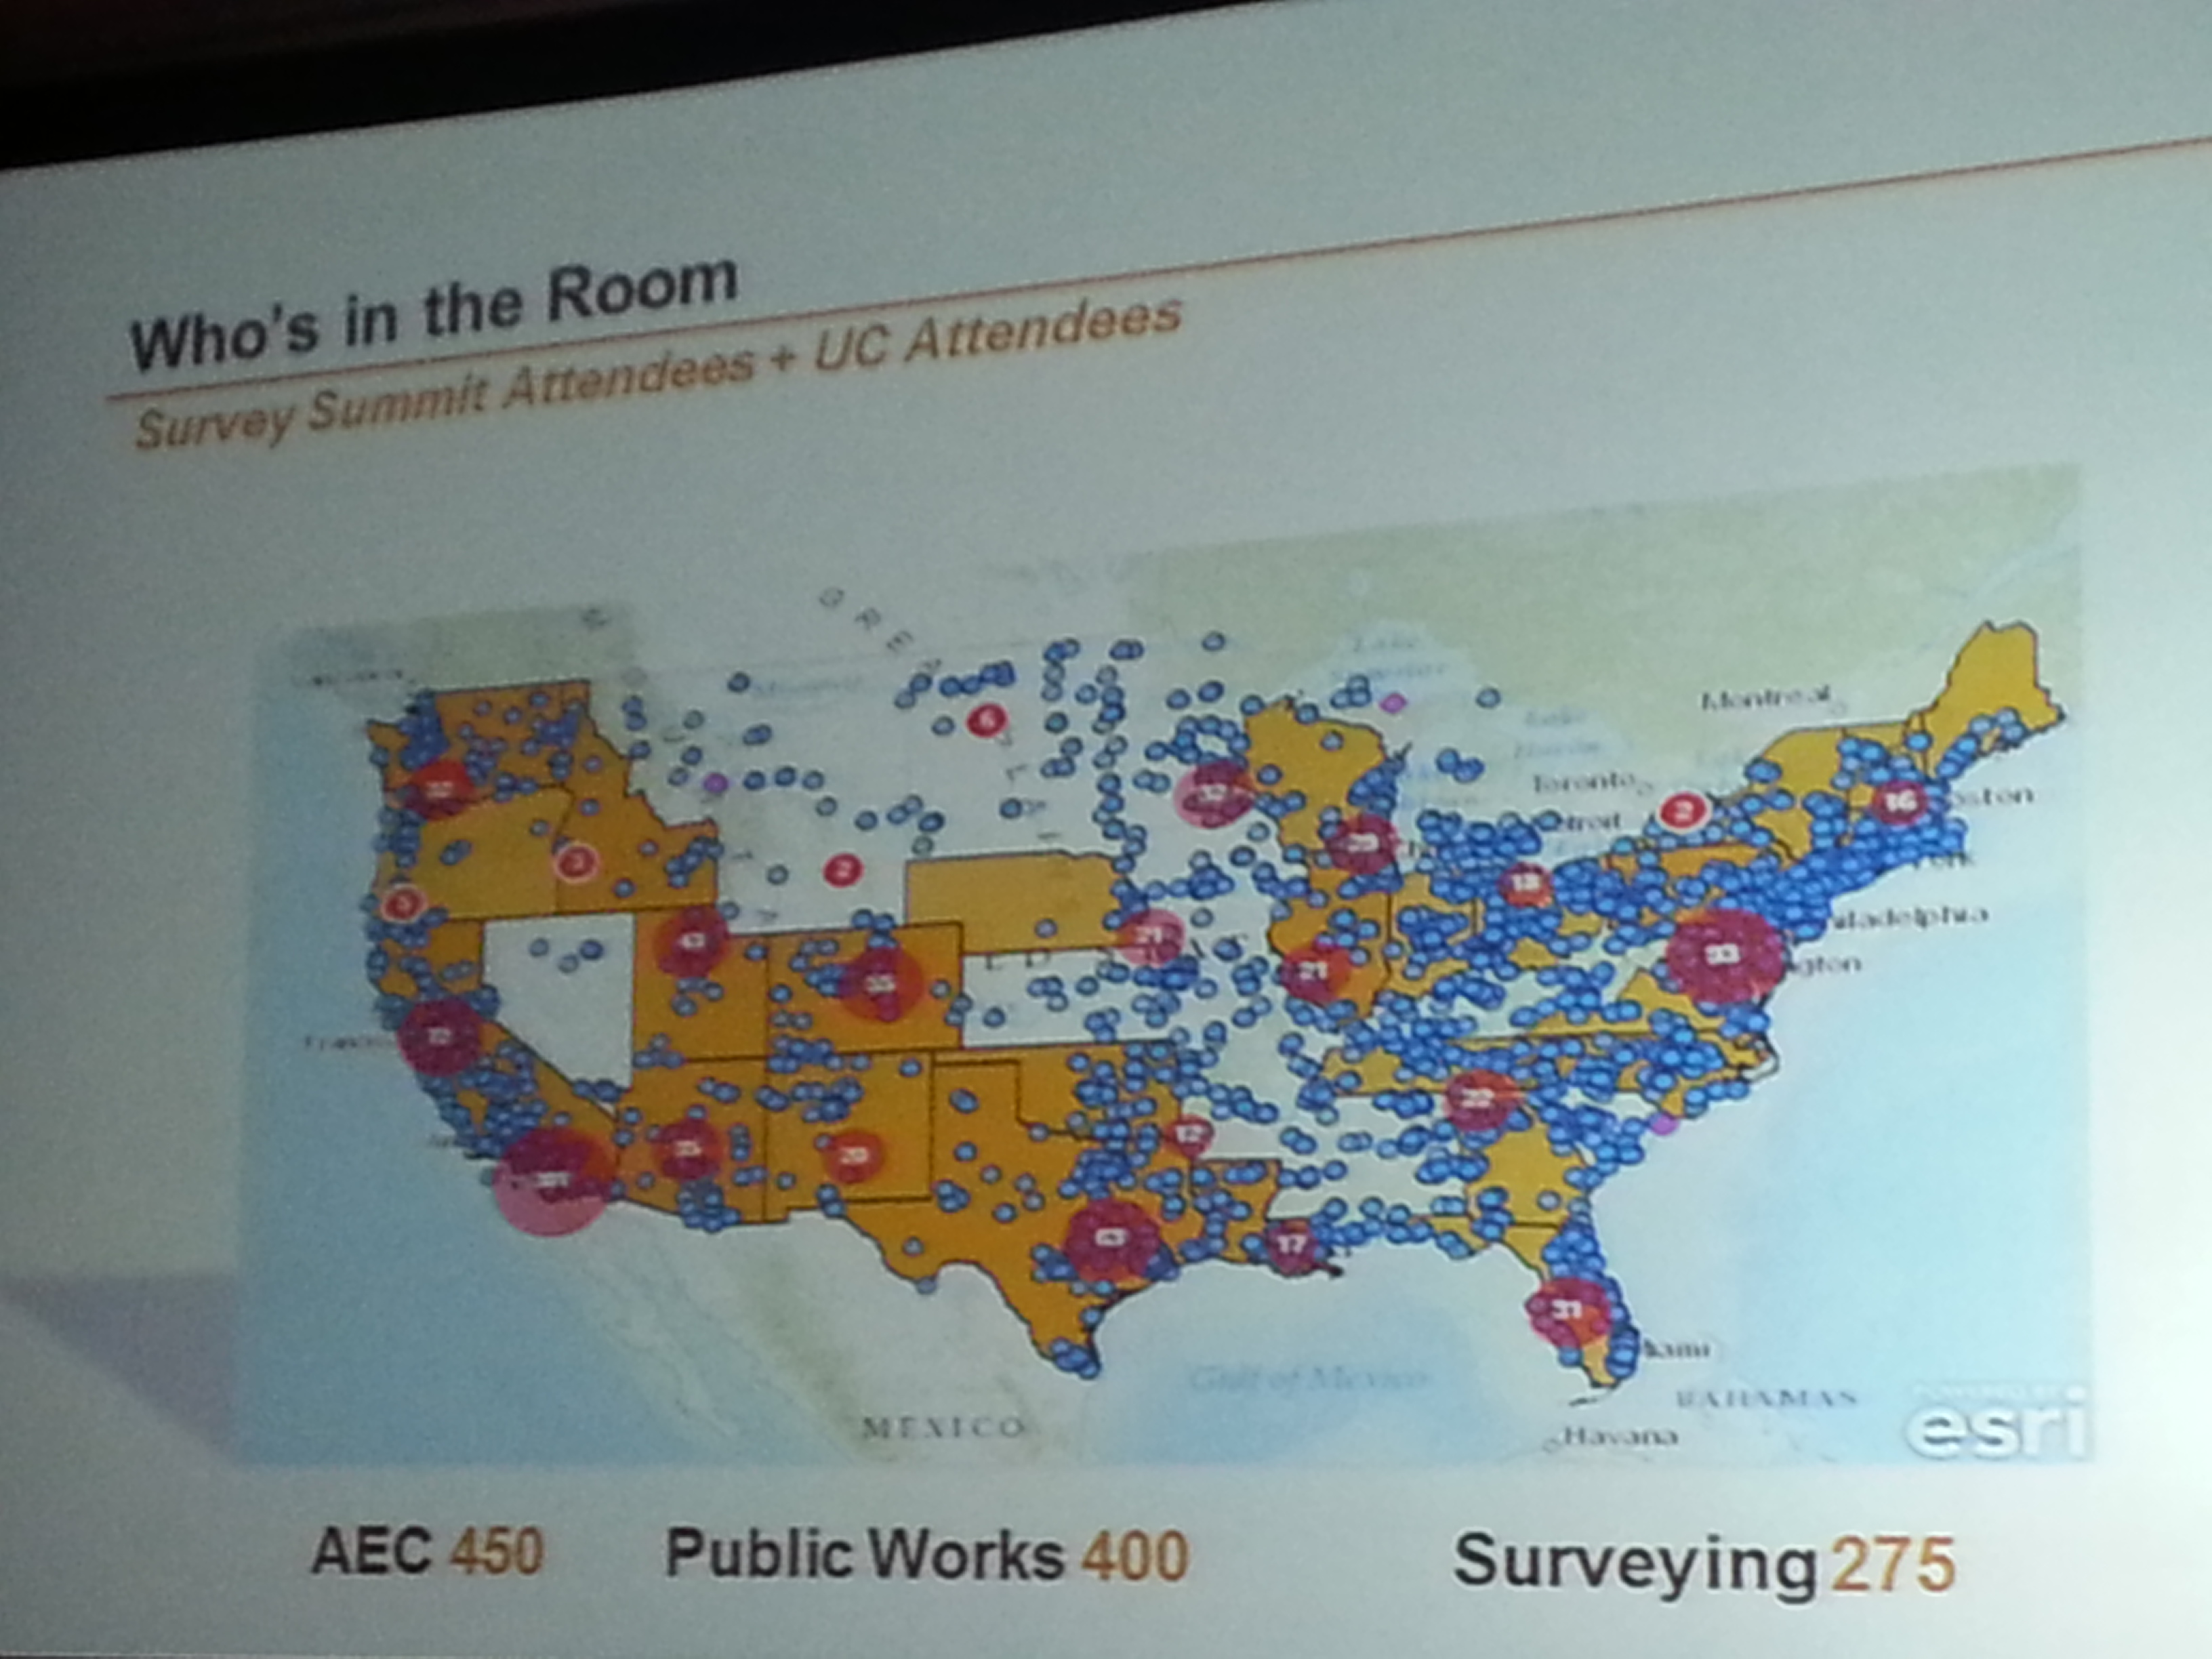
Who’s in the Room. Survey Summit + UC.
Who’s in the Room. Survey Summit + UC.
Most interesting take-aways from the Survey Summit:
• Esri programmers responsible for the geographic datum transformations in ArcGIS were at the Survey Summit and engaged. Esri needs to do a lot of work in this area to accommodate high-precision GIS and surveying, and it seems the company is taking it seriously, but it can’t come soon enough.
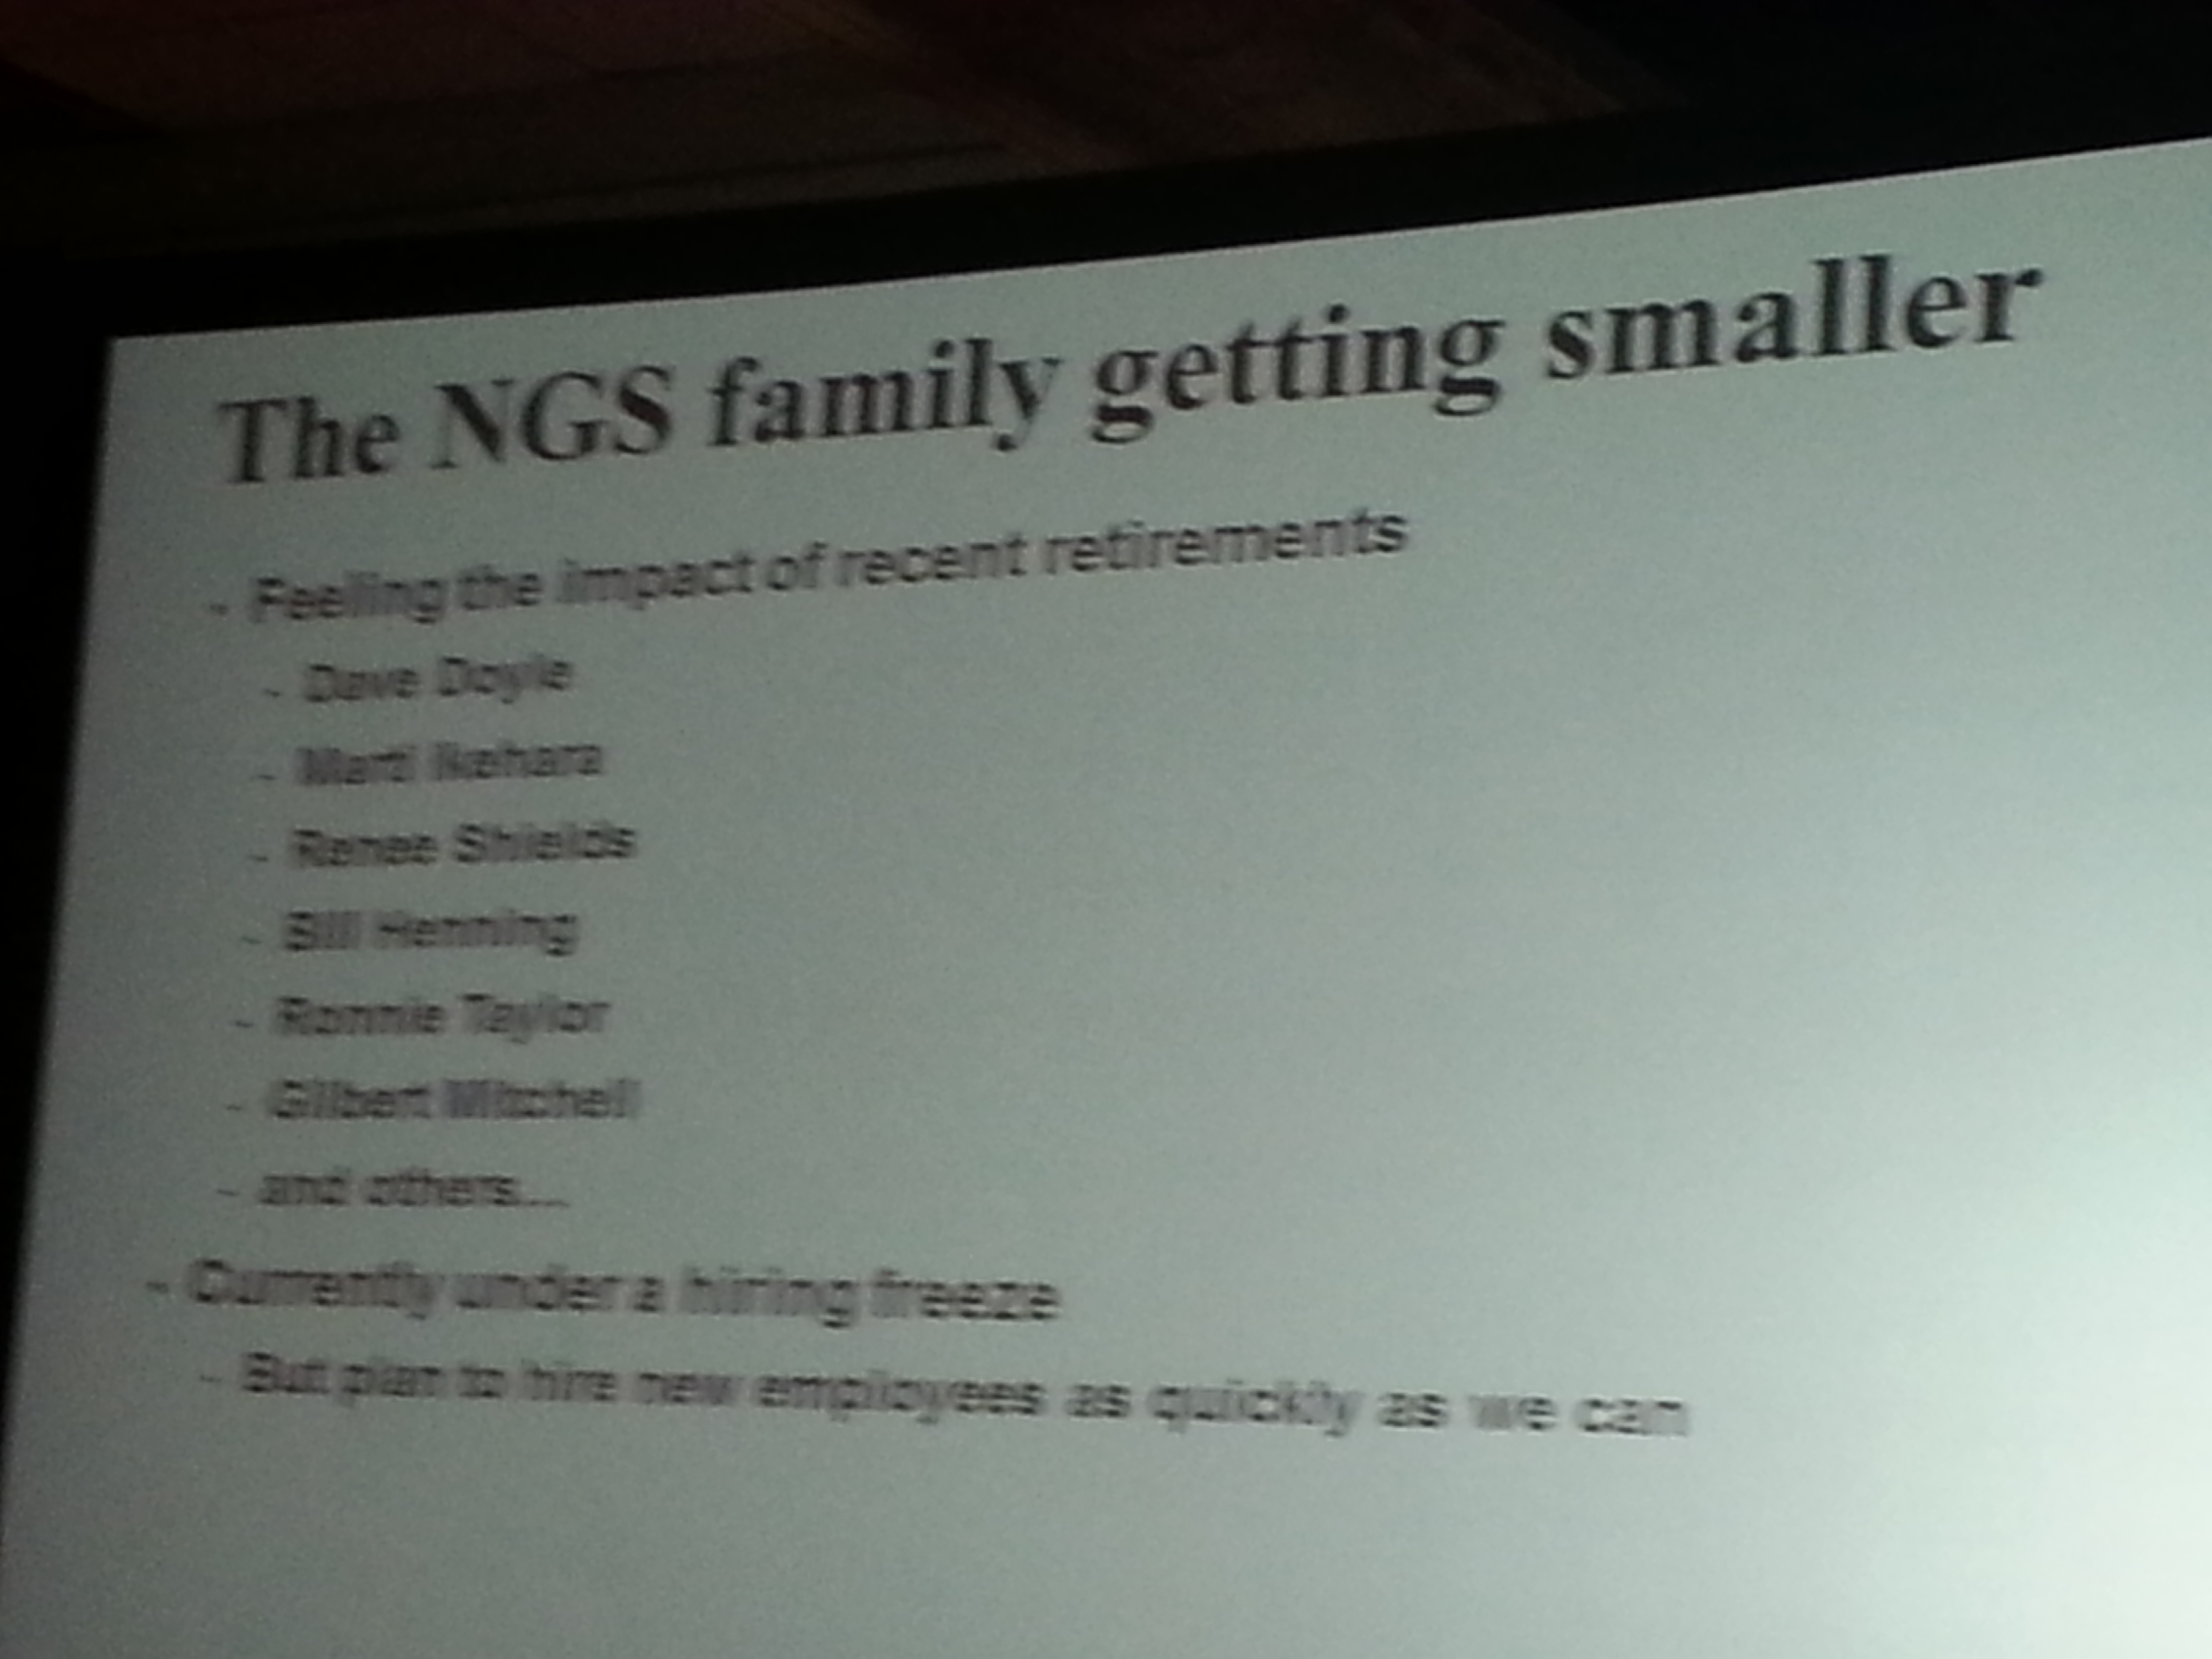
• National Geodetic Survey (NGS) usually sends a pack of people to the conference. This year, it all fell on Michael Dennis, who delivered a record number of presentations. The NGS is getting smaller. It employs about one third of the people it used to. People with a tremendous amount of knowledge and outreach throughout the years such as Dave Doyle and Bill Henning have retired recently, and there’s a hiring freeze at NGS. While geodesy for GIS is becoming more important, we are losing geodesy expertise at the federal level.
Most interesting quotes from the Survey Summit:
• “GIS isn’t an acronym for Get It Surveyed; it’s an acronym for Get Involved Seriously.” — Curt Sumner, National Society of Professional Surveyors
• “Think about what’s not going to change in the next 10 years, that’s the more important question.” — Brian Matsubara, Amazon Web Services
Esri International User Conference Keynote
The challenge is that Esri President Jack Dangermond sets the bar so high every year that there’s an expectation that he will “wow” us again. That didn’t happen this year. Mind you, I’m a huge fan of Mr. Dangermond. I love it that he’s kept Esri a privately held company (no public shareholders) and the way he dismisses investor community analysts. I love it that he has a vision, sticks to it, and yet doesn’t hesitate to make significant changes as he sees fit. He told Investor’s Business Daily, “We’ve never borrowed money,” conceding that this meant the company grew more slowly than it might have. “We had to be very, very, very conservative with money. …It drove careful decision making. We were never at the (beck) of outside shareholders or banks. What that means is we could focus on our users and employees.”
Think about a guy who, at 67 years of age, struck up a relationship with pop musician Will.I.Am, who ended up speaking in front of thousands of attendees at the Esri UC this year. You can view a video of Will.I.Am’s and other keynote conversations here. By the way, Will.I.Am says he’s going to attend the Massachusetts Institute of Technology (MIT) this fall, studying computer science. I’m impressed.
Esri International User Conference
Attendance at this year’s conference was probably down from last year, likely from reduced government travel budgets. On the conference opening day, Jack reported that 12,000 people were in attendance from 130 countries, making it the largest gathering of geospatial users in North America.
During the plenary session, four technologies were emphasized. None of them are new or earth-shattering, but each are pushing forward:
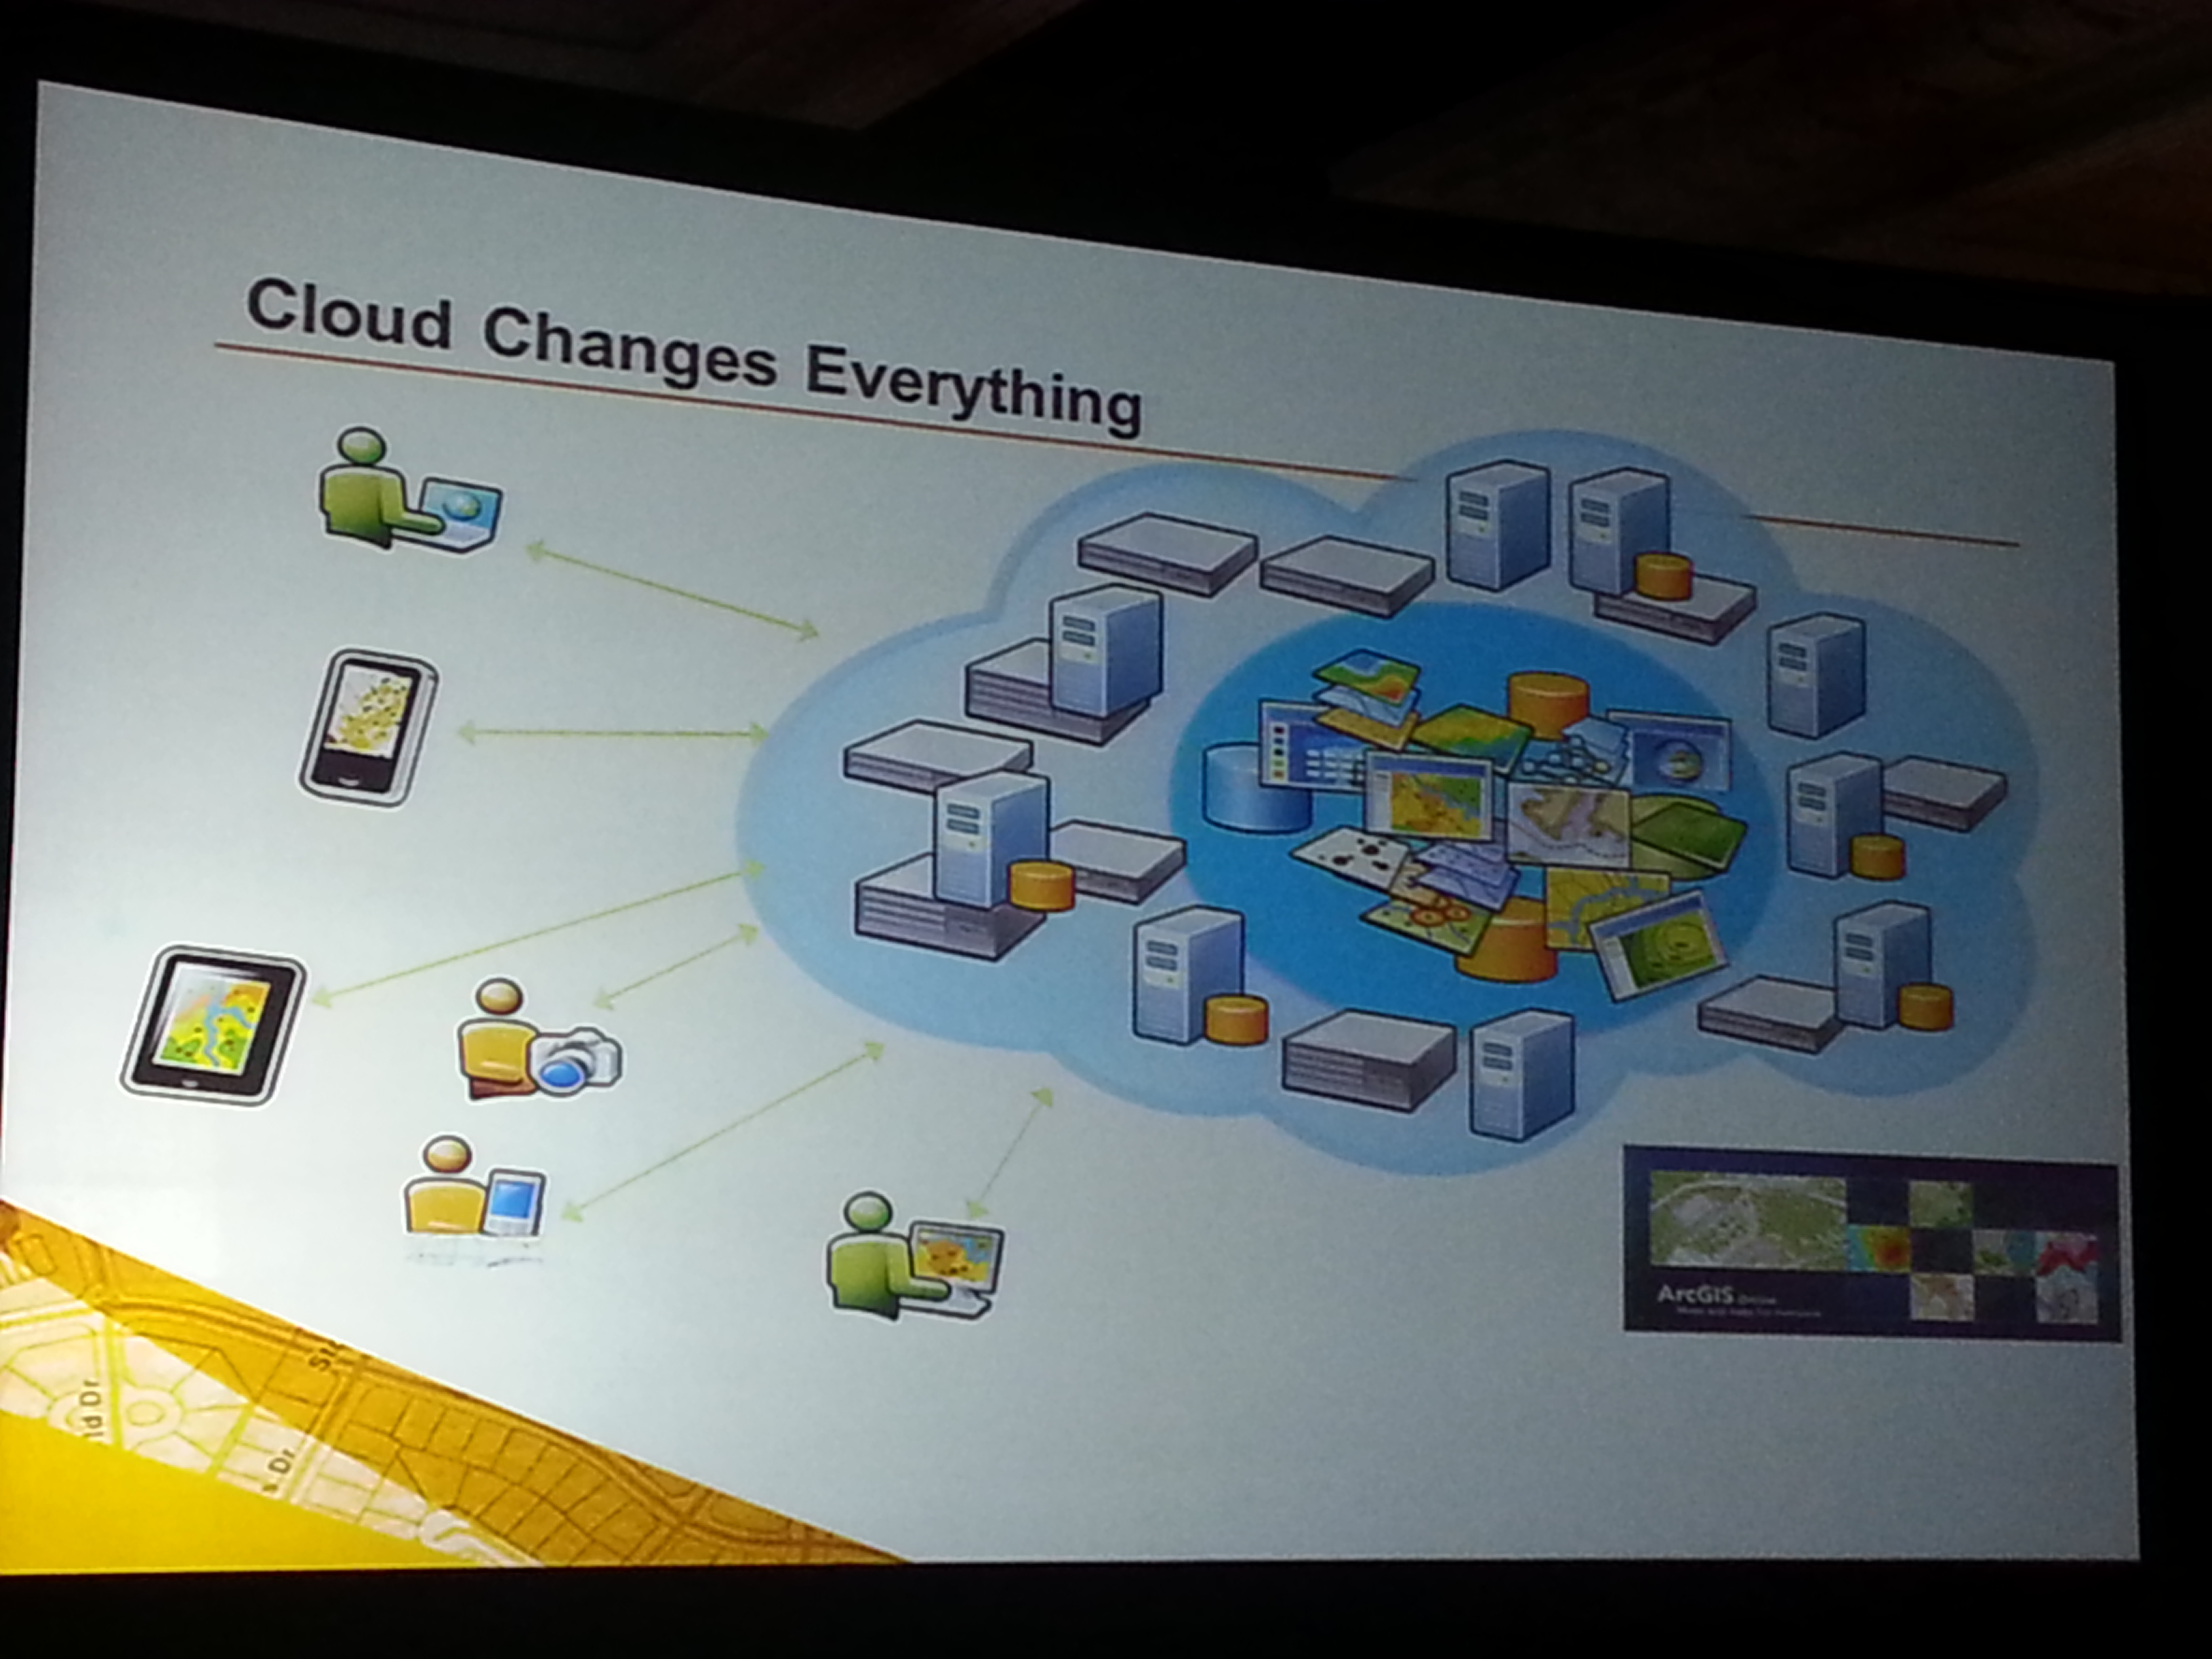
Cloud-based GIS: Esri is pushing cloud-based GIS hard. It’s a significant transformation, and there’s no turning back. During the plenary session, Jack announced that starting with ArcGIS 10.2, each license will also include a subscription to ArcGIS online. The cloud is a natural segue into Big Data.
More Data: If GIS software is the engine, then data is the fuel. More data usually translates into more apps. More granular data usually translates into better decision-making capability.
Esri reported that 100 million square miles of imagery was added or updated to ArcGIS online. DigitalGlobe announced that ArcGIS Online users will now have access to DigitalGlobe’s Global Basemap, FirstLook, and Multispectral Premium Services.
More Apps: Taking a lesson from Apple, Jack reported that “in a couple of months Esri will introduce an itunes-like appstore for GIS apps.” Seeing how GIS apps are largely customized, it will be interesting to see what this offers to the user community. It’s a super-smart idea from an Esri strategy perspective, allowing users to derive greater value from their Esri investments.
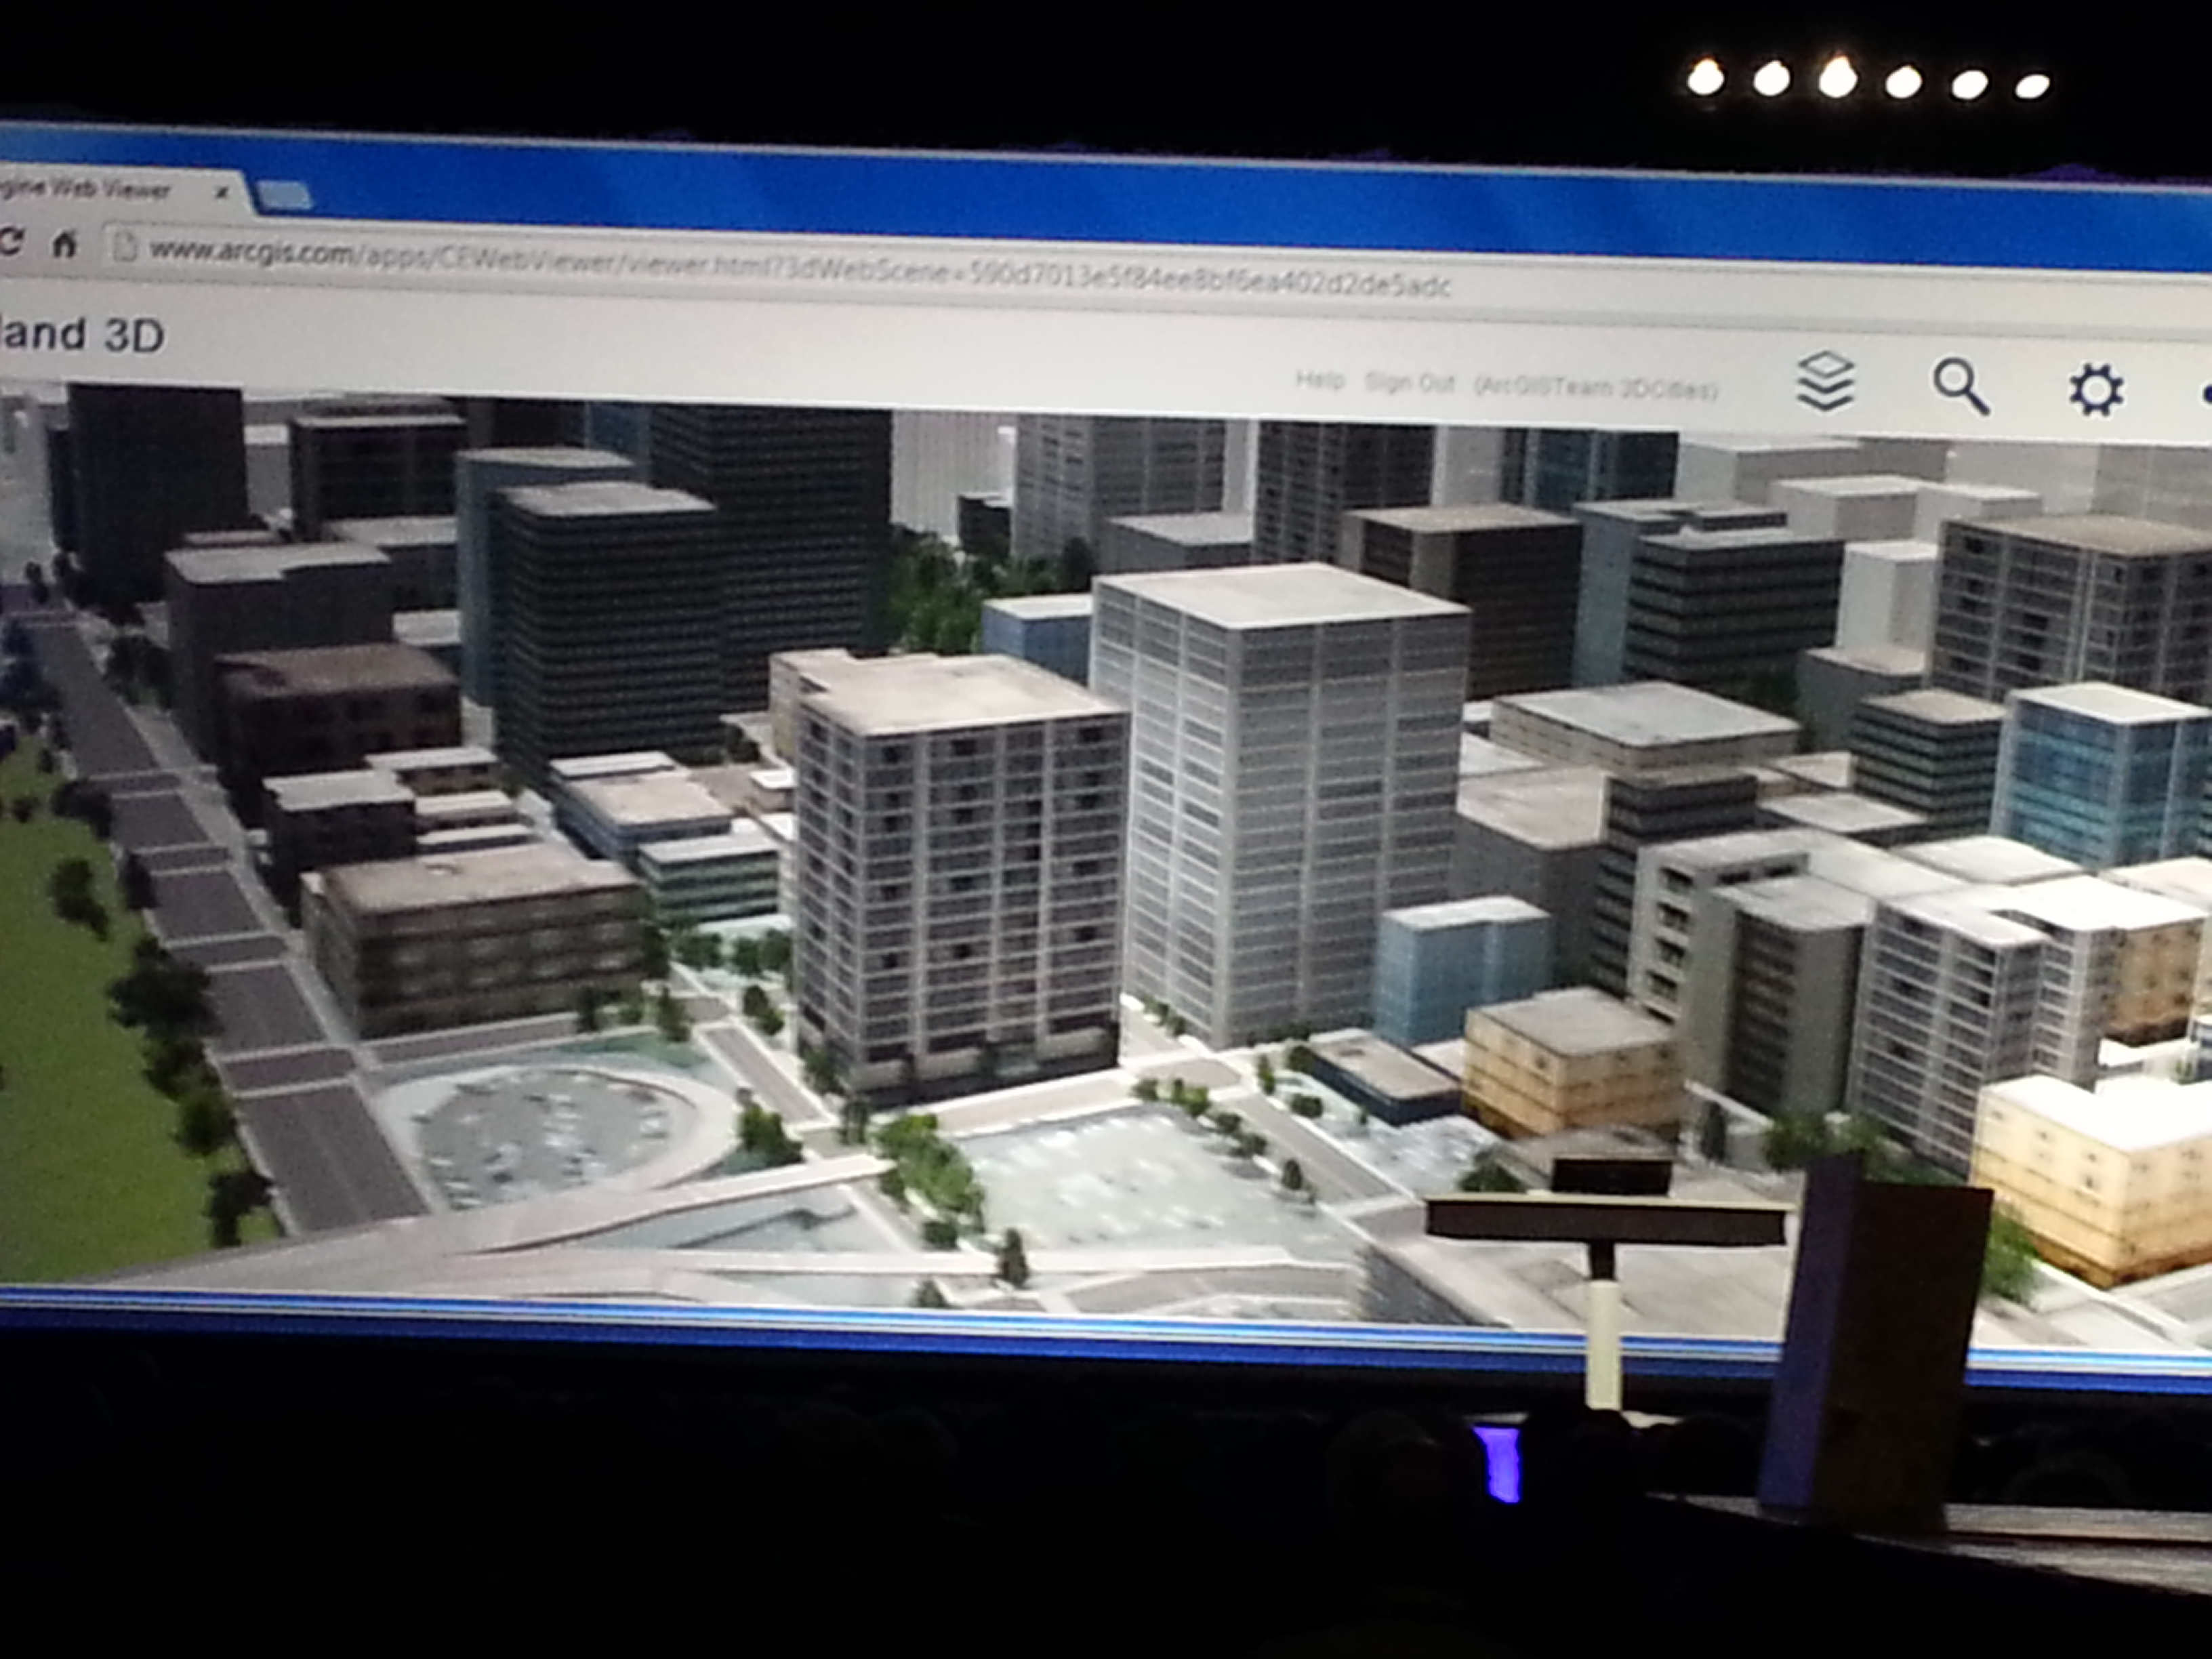
3D: Esri is spending time promoting 3D online. Jack said, “Once you get there, it’s hard to leave. 3D is a major footprint for us.” Ten years ago, I was involved with 3D visualization in landscape architecture and accident reconstruction. Generating 3D models was a painfully slow process. Jack is correct. If you can generate 3D visualizations relatively easily and inexpensively, why would you stay in 2D? This is the future. Check out Autodesks’s free Recap software for easily generating 3D visualizations from scan data and photos (even from your smartphone).
The most interesting take-aways from the Esri International User Conference:
Most interesting quotes from the Esri International User Conference:
• “One quarter of all Esri licenses are used by NGO’s or non-profits at little or no cost.” — Jack Dangermond, Esri
•”The poorest of the poor must obtain the best education possible. Information will be the fourth pillar of democracy in 21st century.” — Dawn Wright, Esri
• “In the past year, ArcGIS online has transformed from a web mapping tool to a true GIS.” — Jack Dangermond, Esri
• “Gangs are a business too, and they recruit (kids) earlier than companies do. To get a job, you have to graduate from college. What do you want these kids to be? If you’re not going to tell (them) what to do, (they’re) just going to go over here (to the gangs). Our system is broke.” — Will.I.Am
If you missed it, I along with Michael Dennis (Geodesist, NGS) were guests on the NSPS Radio Hour <ACSMJuly22_2013>. We talked about geodesy, LightSquared, and a few other subjects. It’s anMP3 file so you can download it onto your smartphone, i device or computer to listen at your convenience.
Trimble announced it has entered into an agreement with DigitalGlobe Inc. to license its satellite imagery for offline use in Trimble Outdoors mobile apps, allowing outdoor enthusiasts to view and store imagery on their smartphones and tablets. In addition, DigitalGlobe imagery will be available for high-resolution, large-format custom prints at MyTopo.com, a Trimble company.
“Our customers use Trimble apps in remote areas where network data coverage doesn’t exist. Armed with smartphones loaded with memory, they�re increasingly asking for map content to be stored locally on the handset for off-the-grid use. We’re excited to enable our customers to cache DigitalGlobe’s high-resolution imagery on their smartphones to address these needs,” said Mark Harrington, vice president of Trimble. “In addition, providing our MyTopo customers with the ability to create large format print maps with DigitalGlobe’s high-resolution imagery allows them to have the convenience of a traditional paper map that matches their handset experience in the field. By partnering with DigitalGlobe, Trimble can significantly enhance the quality of satellite photography available in our products.”
According to the announcement, DigitalGlobe will provide imagery down to a 30-centimeter resolution for the continental U.S. and 50-centimeter resolution globally, effective immediately. The 30-centimeter resolution means one pixel on the image equals 30 centimeters on the ground.
“By partnering with Trimble we can showcase how our imagery can be used in new and unique ways for location-based services companies,” said Bert Turner, senior vice president of sales at DigitalGlobe. “Outdoor enthusiasts will now have access to DigitalGlobe’s vast imagery library—the largest and most up to date of its kind—in order to harness the power of mapping and location intelligence even in the most remote locations.”
Mobile Apps with DigitalGlobe Imagery
According to the announcement, outdoors enthusiasts will be able to use DigitalGlobe’s worldwide imagery in five apps:
Trimble Outdoors Navigator (iPhone, Android), designed for in-the-field navigation for hikers, backpackers, mountain bikers, and general outdoor use
Trimble Outdoors MyTopo Maps (iPad, Kindle Fire, Android tablets), designed for outdoor trip planning
Trimble GPS Hunt (iPhone, Android), smartphone app built for hunters
Trimble GPS Fish (iPhone, Android), smartphone app built for anglers
Trimble GPS Maps (iPad), tablet app designed to plan hunting and fishing trips
To save maps on their mobile device, customers need to select the area and zoom levels of the DigitalGlobe imagery using the Offline Maps tool found in the supported apps. The ability to store offline satellite imagery will require an Elite membership ($29.99 per year) to TrimbleOutdoors.com (trimbleoutdoors.com/elite) or GPSHuntFish.com (www.gpshuntfish.com/elite).
Printed Maps with DigitalGlobe Imagery
Customers can order the new Premium Satellite Image prints in five sizes ranging from 18″ x 24″ to 60″ x 96″ on MyTopo.com, which has a simple five-step process to design custom maps. In addition, users can select the map scale down to 1:1K, plus overlay GPS coordinates, navigation grids and exclusive map layers like public land boundaries, hunt units, forest roads, and lake contours. The imagery can be printed on several paper formats, including waterproof and glossy.
High-resolution prints will be available in the U.S. and Canada to start, and expand to worldwide coverage later in 2013.
The U. S. Geological Survey announced that the Federal Geographic Data Committee (FGDC) is seeking public comments on the draft strategic plan for the National Spatial Data Infrastructure (NSDI). The draft NSDI strategic plan has been developed with inputs from a variety of sources, including FGDC member agencies, the National Geospatial Advisory Committee, and geospatial partner organizations. The plan describes a broad national vision for the NSDI, and includes goals and objectives for the Federal government’s role in continued sustainable development of the NSDI. Following the public comment period, a revised draft of the plan will be prepared for final review and adoption by the FGDC Steering Committee. Following completion of the strategic plan, the FGDC will develop more detailed project plans for the goals and objectives in the strategic plan.
Willens Law Office announced the first self-reported Chicago bicycle accident map will collect data about cyclists’ encounters with careless and reckless driving. This interactive map will allow users to report, not only bicycle accidents and doorings, but close calls or near misses as well, all in real time. Additionally, by reporting the type of collision, weather, lighting and surface conditions during the accident or close-to accident, we will be able to have more data about bicycle accidents, when they occur, where they occur, and how to prevent them. The most important improvement over past maps is that close call or near miss data can also be reported and shared among cyclists, and while technically not an accident, this data may be the most valuable as it occurs in the highest frequency and often can help with future design plans and infrastructure updates. As more accidents and near misses get reported, the heat map will provide visual representation to identify the areas with the largest number of incidents, and maps can be created specifically for a particular type of accident. You can access the map here and conduct your own search, if you’re a cyclist please share your most troublesome intersection or address for near misses.
Reported Chicago bicycle accidents over the last 5 years http://www.willenslaw.com/report-your-accident/ Source: Willens Law Offices
According to the announcement, the cyclists of Chicago will be able to use this interactive map to help identify “hot spots.” These are areas of the city that are particularly dangerous for cyclists. The data will bring attention to problem areas and arm cyclists and community organizations with information to advocate for safer roads, which, in turn, will increase roadway modifications and/or targeted enforcement of the law. Extended use of the map will help keep the streets of Chicago safer for everyone – cyclists, motorists and pedestrians alike, helping to plan safer routes for riding. Knowledge is power when it comes to choosing the safest routes while bicycling in the city of Chicago.
Attorney Matthew Willens of Willens Law Offices in Chicago had this to say “An ounce of prevention is worth a pound of cure. My hope is that, with the use of this map, bicycle accidents will decrease as the popularity of informed cycling increases.” Willens Law Offices was recently featured in the Chicago Tribune for the initiative to provide ghost bike racks in memory of deceased bicyclists. The firm plans to donate a ghost bike rack for each cyclist who falls victim to a fatal bicycle-motorist accident in the City of Chicago and contacts the firm. The racks would NOT replace ghost bikes, but would increase the number of public bike racks and would hopefully help maintain the memory of the past cyclist by its permanent nature and utility allowing cyclists to lock up their bikes, as well as a serve as a reminder to be aware of the cyclists on the road.