The Open Source Geospatial Foundation (OSGeo) announced the release of a new stable version of GRASS GIS. This release fixes bugs discovered in 6.4.2 version of the program and adds a number of new features. This release includes over 830 updates to the source code since 6.4.2. As a stable release series, the 6.4 line will enjoy long-term support and incremental enhancements while preserving backwards-compatibility with the entire GRASS 6 line.
According to the announcement, key improvements of this release include some new functionality (assistance for topologically unclean vector data), major speedup for some vector modules, fixes in the vector network modules, fixes for the wxPython based portable graphical interface (attribute table management, wxNVIZ, and Cartographic Composer). A number of new modules have been added for processing LANDSAT and MODIS satellite data, and a new vector statistics module is also introduced. Many new symbols and north arrows are available, and the user will find an improved and easier to use wizard for creating custom project locations with precise map projection and datum support. Community-contributed add-on modules are now more easily and robustly installed from an online archive. Other major developments include enhancements to the Python scripting library and numerous software-compatibility fixes and translation updates. Important is the enhanced portability for MS-Windows (native support, fixes in case of missing system DLLs). And we welcome Romanian as our twenty-fourth language.
Esri released the new version of ArcGIS, marking a major milestone in the history of the Esri platform. With ArcGIS 10.2, Esri has taken advantage of the significant changes in IT that magnify the power and accessibility of GIS. The new release improves ease of use, real-time data access, and integration with existing infrastructure. It allows people to more easily deploy web GIS—the key component for implementing GIS as a platform. Web GIS helps users organize their work and simplifies geographic information discovery, access, sharing, and collaboration.
More Online Analysis Tools
According to the announcement, ArcGIS 10.2 extends the analytic functionality of GIS to everyone via ArcGIS Online. Advanced analysis tools have been added to ArcGIS Online for investigating geographic relationships, patterns, and trends within data. New tools in ArcGIS Online include overlay layers for combining two or more layers into one single layer; enhanced hot-spot analysis; and data enrichment resources to glean information about the people, places, and businesses in a specific area or drive time.
ArcGIS Online Access
To ensure that ArcGIS for Desktop users have access to ArcGIS Online capabilities, Esri entitles every customer organization that has ArcGIS for Desktop (Basic, Standard, or Advanced) to receive an ArcGIS Online subscription. The number of named users will be equal to the total number of ArcGIS for Desktop licenses current on maintenance. This will enable users to easily get started with ArcGIS Online. It will also give access to all Esri apps—such as Esri Maps for Office, Collector for ArcGIS, and Operations Dashboard for ArcGIS—as well as numerous app templates hosted in ArcGIS Online. Esri will notify ArcGIS for Desktop customers about the details of this new entitlement in the coming weeks.
Portal for ArcGIS
At ArcGIS 10.2, Esri gives people the ability to deploy ArcGIS Online capabilities on-premises for tighter content security and control. Portal for ArcGIS provides a secure front end for ArcGIS for Server, with dozens of easy-to-use apps and full integration with ArcGIS for Desktop. It includes geographic viewers and analysis tools designed for people without any GIS knowledge. Experienced GIS users can connect to Portal for ArcGIS from ArcGIS for Desktop, developer APIs, and other Esri applications. The Portal for ArcGIS extension software is included with ArcGIS for Server Advanced (Enterprise or Workgroup) and is licensed and priced based on the number of named users.
Real-Time Data Access
Esri’s new release of ArcGIS introduces a number of new technologies that enable the real-time collection and sharing of data with GIS. It includes ArcGIS GeoEvent Processor for Server, a new ArcGIS for Server extension that gives users the power to access live data streams. People can analyze and send processed results to other users or into other systems. This capability transforms GIS applications into powerful frontline decision tools, refining data quickly for consumption and enabling fast response in any situation.
Expanded Business Intelligence Support
With business intelligence (BI) being relied on even more in an increasingly competitive marketplace, the new ArcGIS release expands Esri’s support for major BI systems. ArcGIS 10.2 includes new MicroStrategy BI and Microsoft Dynamics Customer Relationship Management tools, allowing users of those platforms to perform location analytics on their business data and focus their marketing. Core BI tools Esri Community Analyst and Esri Business Analyst Online also get productivity-enhancing face-lifts and major customization capability.
For more information on the dozens of other improvements in the latest release of ArcGIS, visit esri.com/whatsnew.
TomTom announced an updated agreement with BlackBerry to provide real-time traffic information for the maps app on BlackBerry 10.
TomTom Traffic provides customers with more precise traffic information, enabling faster journeys, more accurate arrival times, and a smarter navigation experience.
According to the announcement, BlackBerry 10 customers also have the option to anonymously help enhance the coverage and quality of TomTom’s world-class traffic information by sharing traffic data.
“Having accurate and up-to-date traffic information integrated in BlackBerry Maps is an important feature for customers, and TomTom is a recognized leader that provides traffic data to many companies in the market,” said Adrian Gould, VP of Handheld Software Product Management at BlackBerry. “We are pleased to expand our relationship with TomTom in support of BlackBerry 10 customers.”
“By integrating TomTom Traffic, BlackBerry’s smartphone customers will have access to the most accurate traffic information available,” said Charles Cautley, Managing Director of TomTom Automotive & Licensing. “We are proud to be supporting BlackBerry to deliver enhanced location-based services to its subscribers across the globe.”
The U.S. Geological Survey announced that advances in the technology of online map-based data collection platforms have made it possible for citizens of the U.S. to contribute to USGS topographic mapping efforts like never before.
The USGS is currently seeking volunteers to aid in collecting data for The National Map (TNM), which comprises a variety of products and services that provide the Nation with geospatial information to describe the landscape of the United States and its territories. The National Map Corps (TNMCorps) aims to improve this topographic information by updating existing and gathering previously uncollected data via volunteered geographic information (VGI).
Blue dots represent locations where citizen-mapping efforts are currently underway. Green states are currently available for editing with remaining states available around September
The National Map includes hydrographic features such as streams and lakes, elevation contours, geographic names, land cover, and structures. To improve and update The National Map, the USGS is turning to volunteers to map the location of important community buildings – such as police stations, schools, hospitals, post offices, prisons, cemeteries, and fire stations. Adding and verifying the locations of buildings to existing TNM datasets makes significant additions to the USGS’s ability to provide accurate information to the public.
After citizen input is peer-reviewed by fellow volunteers, the valid data are incorporated into The National Map databases. These databases are used to create many products, including US Topo maps – free and downloadable digital topographic maps that are released every three years.
Currently, the USGS is in the process of expanding TNMCorps; 35 new states have been added to the volunteer database and need mapping support from volunteers. These states are: Alabama, Arizona, Arkansas, Alaska, California, Colorado, Connecticut, Delaware, Florida, Georgia, Idaho, Illinois, Louisiana, Maryland, Massachusetts, Michigan, Mississippi, Montana, Nebraska, Nevada, New Hampshire, North Dakota, New Jersey, New Mexico, Ohio, Oregon, Pennsylvania, Rhode Island, South Carolina, South Dakota, Utah, Vermont, Washington, West Virginia and Wyoming.
Web Editor showing downtown Little Rock, AR. Red icons are structures that need to be checked or verified by volunteers. The green icon is an example of a structure that has been verified by a volunteer and which will be added to the National Map after it has gone through peer-review.
Similar to the way Wikipedia or OpenSteetMap allows users to add and edit information on the site, The National Map Corps web editing interface allows users to easily contribute geographic data that will eventually become part of The National Map.
A complete list of the types of buildings the USGS is looking to volunteers to verify throughout the country can be found here.
“Because of a lack of publicly available national authoritative datasets for some municipal buildings and infrastructure throughout the country, we are looking for volunteers who can fill in this information quickly and keep it up to date,” said Volunteer Geographic Information Project Leader Elizabeth McCartney.
In addition to adding previously unmapped community buildings and landmarks to The National Map database, volunteers are encouraged to remove structures that no longer exist, update existing buildings that have changed, and label correctly marked structures as correct.
The current platform used by TNMCorps is a customized version of OpenStreetMap, an online platform that enables users to edit, add, and access geographic data.
“The editor, like OpenStreet Map which has over a billion users worldwide, is meant to be accessible to non-professionals. Users don’t need to be professional scientists in order to contribute. Anyone who wants to volunteer can give it a go. There are a lot of people out there who love maps and are interested in improving information in their communities,” said McCartney.
Volunteer participants are not required to live within the state they review — the mapping technology used for TNMCorps allows anyone to update geographic data from anywhere.
Testing the feasibility of collecting VGI for the The National Map began in a series of pilot projects in January 2011. To test the viability of using volunteers to edit TNM map data, students at Colorado universities were asked to map structures in four topographic quadrangles around the Denver area. The results were impressive, as the structures mapped surpassed the quality standard maintained by the USGS. The success of the pilot projects confirmed that VGI is a viable source of data.
Since its start in Colorado, the program has expanded to 35 states. The National Map Corps hopes to have all 50 states available for mapping by September 2013.
Volunteer Recognition
The USGS has created a social media presence to support this program and reach new volunteers. Using Twitter , with more than 2,080 followers, and the USGS Facebook page, volunteers who contribute to The National Map Corps are awarded badges are recognized based on the number of points edited.
Each badge is represented by a different antique surveying instrument.
Volunteers can earn each successive badge by contributing structures through the editing or peer review process.
OpenGeo announced their plans to support QGIS and the open source community behind it. According to the announcement, QGIS is the most widely available open source GIS tool with a proven track record and an extensive plug-in ecosystem. It is widely regarded to have achieved feature parity with proprietary tools while being more stable, easier to use.
OpenGeo’s flagship product, the OpenGeo Suite, is a complete set of standards-based geospatial software that offers the fastest and easiest way to publish geospatial information on the web. The addition of QGIS incorporates a strong desktop tool into OpenGeo’s solid server offerings. Users of the OpenGeo Suite will now have a complete solution for creating, analyzing, publishing and consuming geospatial data and services without requiring any proprietary software.
Juan Marin, OpenGeo’s CTO, outlined the following areas of development:
Improve integration between QGIS and the OpenGeo Suite
Provide services such as maintenance, technical support, training, etc for QGIS
Enhance existing documentation, tutorials, and examples to make QGIS even easier to learn and use.
Help users collaborate around geospatial data with GeoGit, a scalable distributed versioning system for geospatial information.
Marin noted, “QGIS offers a truly open alternative that lowers barriers to entry and total cost of ownership. It’s also operating system agnostic and has no license fees. We feel it fits perfectly with our mission of extending the availability of geospatial open source software. But we’re not only impressed with the software, we respect the community that has built it and we look forward to supporting them however we can.”
CMTINC.COM announces the release of the Deed Calls Pro software application for the Apple iPad. This app expands on the popular Deed Calls – Area – Perimeter app from the same company. It will let the user easily create a land parcel by entering distances and angles, by importing data in Shapefile or DXF format, or by precise digitization over a background map. It will also create a deed plot from the angle and distance values stored in a text file. For an existing Line or Area Feature on the job map, the app can create a set of deed calls that can be saved into a text file or printed to a PDF file.
According to the announcement, Deed Calls Pro can display the acreage and perimeter of an area as well as label the line segments and corner angles with distance and angle values, respectively. It will let the users easily subdivide a land plot, or combine adjacent land plots into a larger area. Below are a few other highlights of this app:
* Ability to rotate the deed plot to align with the background map.
* Ability to select a coordinate system other than the Lat-Lon-Altitude system.
* Ability to adjust the deed plot using the Compass Rule or the Transit Rule.
* Ability to have multiple Features created on the map.
* Ability to tag the Features with descriptions.
* Ability to attach photos to a Feature to showcase a property.
* Ability to export data in DXF format and send out data files via email.
* Ability to make use of iCloud Storage.
The Deed Calls Pro app is now available at the iTunes App Store.
Supergeotek announced that the SuperGIS Toolkit in the newest version of SuperGIS Desktop 3.1a now supports Biodiversity Analysis functions to assist users in comprehending the relationship between distribution of species and spatial pattern.
According to the announcement, biodiversity Analyst in the newest update of SuperGIS Desktop 3.1a provides Diversity Analysis and Landscape Indices and is capable of assisting users in exploring features of spatial patterns of species distributions, including richness, diversity and evenness. Users who have the licensed SuperGIS Biodiversity analyst are allowed to employ Biodiversity Analysis in SuperGIS Toolkit.
If you were able to attend the webinar “Nightmare on GIS Street: GNSS Accuracy, Datums and Geospatial Data” held on June 20, thanks for attending. If not, you can view the webinar here. We had a world-class panel of experts discussing the nightmare of accurately combining different sources of geospatial data as well as on-the-fly datum transformations in the field when using high-precision GPS/GNSS receivers.
Let me apologize in advance if it seems like I’m “beating a dead horse” in writing about this issue. I intended to address the questions raised during the webinar. After addressing one of the first issues below (WGS-84), I expended my allocated space and energy. Rest assured I will publish answers to the other questions that were raised before and during the webinar.
Very few of the geospatial software vendors (GIS or surveying) are handling horizontal datum transformations correctly or in a manner that is easy for the average GIS operator to understand. The good news is that hopefully we’re raising awareness and some are responding, such as Carlson Software. Carlson recently released version 3.0 of their SurvCE surveying software for GNSS data collection. It includes a 14-parameter transformation from ITRF08/WGS-84 G1674 to NAD83/2011. You might want to watch the four minute video below demonstrating the transformation process in SurvCE 3.0. You’ll see the difference after the transformation is about two tenths of a foot (~6cm). If I were to guess, I would say majority of the difference after the transformation is the tectonic plate movement that is unaccounted for. Reconciling the tectonic plate movement is difficult because you need to have an accurate velocity (movement) model for the software to reference. In some geographic areas, the movement is minor (1mm per year) while other geographic regions move 6cm per year or more. Lastly, what if there’s a major earthquake such as the 2011 earthquake off the coast of Japan or the 2010 earthquake off the coast of Chile. During those events, the ground shifted many meters in some cases.
Source: Michael Dennis – US National Geodetic Survey
I’d like to spend a little time on the subject of the WGS-84 reference frame. It’s a term that’s used and abused a lot, including by myself on occasion.
Taking a Look at the WGS-84 Reference Frame
First, let me begin with the statement that WGS-84 should not be in your geospatial vocabulary. In fact, I’ve been corrected in the past that it is actually a reference frame rather than a datum, but you’ll likely see it listed as a datum in your geospatial software.
WGS-84 is not something you’ll find physical marks on the ground that you can use to verify GNSS equipment performance. WGS-84 is defined by the U.S. National Geospatial-Intelligence Agency (NGA), which serves the U.S. Department of Defense and the U.S. Intelligence Community. In other words, one of its roles doesn’t include serving the civilian community. Originally, the accuracy of data referenced to WGS-84 could not be defined more accurately than a couple of meters. In fact, the definition of WGS-84 has changed several times over the years, usually without your knowledge, and usually not accounted for in the geospatial software you are using.
Originally (1987), the Department of Defense transformation values between WGS-84 and NAD83 (dX, dY, dZ) were set to 0, which led people to believe they were considered the same. A footnote that was largely ignored is that the standard deviation of the WGS-84 to NAD83 transformation values was ~2 meters (Doyle, D., 2013 email). The bottom line is that if someone hands you a GIS dataset and says it’s referenced to WGS-84, an alarm should immediately sound in your brain prompting you to query the presenter of the data. When and how was the data referenced to WGS-84? Likely, they won’t know the answers to the questions you ask. In that case, you have no choice but to tag the data as only accurate to two meters, at the very best. Of course, if it was data collected by a consumer-grade GPS unit, the accuracy is likely much worse.
The history of WGS-84 is as follows:
——————————————————–
WGS-84 (Original) – 1987
Aligned with NAD83/86 (original) but standard deviation of the transformation was +/- 2 meters.
——————————————————–
WGS-84 (G730) – 1994
Aligned with ITRF91 (epoch date 1994.0). A significant shift took place with this adjustment.
As you can see from above, if someone hands you a dataset and states it’s in WGS-84 format, it begs the question of “which one?”, not unlike the same question you should ask if someone states a dataset is “NAD83”
As I mentioned above, while the 14-parameter transformation to move from one datum to another is not commonplace in geospatial software yet, but it’s gaining traction and it’s not difficult to implement. The trickier, and more difficult variable to reconcile is the tectonic plate movement. It may not seem like the earth you stand on is moving very much, but years of movement can add up when you’re using GNSS equipment capable of 1-2cm accuracy.
Example: Let’s say you’re using OmniSTAR’s HP real-time correction service. The accuracy of that service is rated at 10cm horizontal 2DRMS. OmniSTAR informed me that their system is referenced to ITRF08 using the current epoch date (eg. the date you collect the data). Let’s say your GIS basemap is referenced to NAD83/2011 (epoch 2010.0), which is the most current version of NAD83 (I apologize to non-US readers for this example, but you likely have a similar situation). The 14-parameter transformation will transform your data from ITRF08 (current date epoch) to NAD83/2011 (current date epoch), but then you have to account for the tectonic plate movement from current epoch date (assume 2013.5) to 2010.0. That’s 3.5 years of crustal movement. The tectonic plate movement in some parts of the US are only 2mm/year so 3.5 years x 2mm/year = 7mm. Since OmniSTAR’s HP service is 10cm, you could say that 7mm of plate movement is below the noise floor. However, let’s say you’re in California where the tectonic plate movement is 5cm/year in some places. Reconciling the tectonic plate movement in that environment becomes important when you think about 3.5 years x 5cm/year = 17.5cm!
So, when populating your GIS database, especially with “high-accuracy” data, it’s important to understand not only the datum the incoming data is referenced to, but also the epoch date the data is referenced to. An answer of “WGS-84” is not good enough and probably not accurately represented in the geospatial software you’re using. More than likely, ITRFxx is more accurately defined in your software, if it is present.
Regardless, WGS-84 should not be in our geospatial vocabulary, or at least be quickly fading.
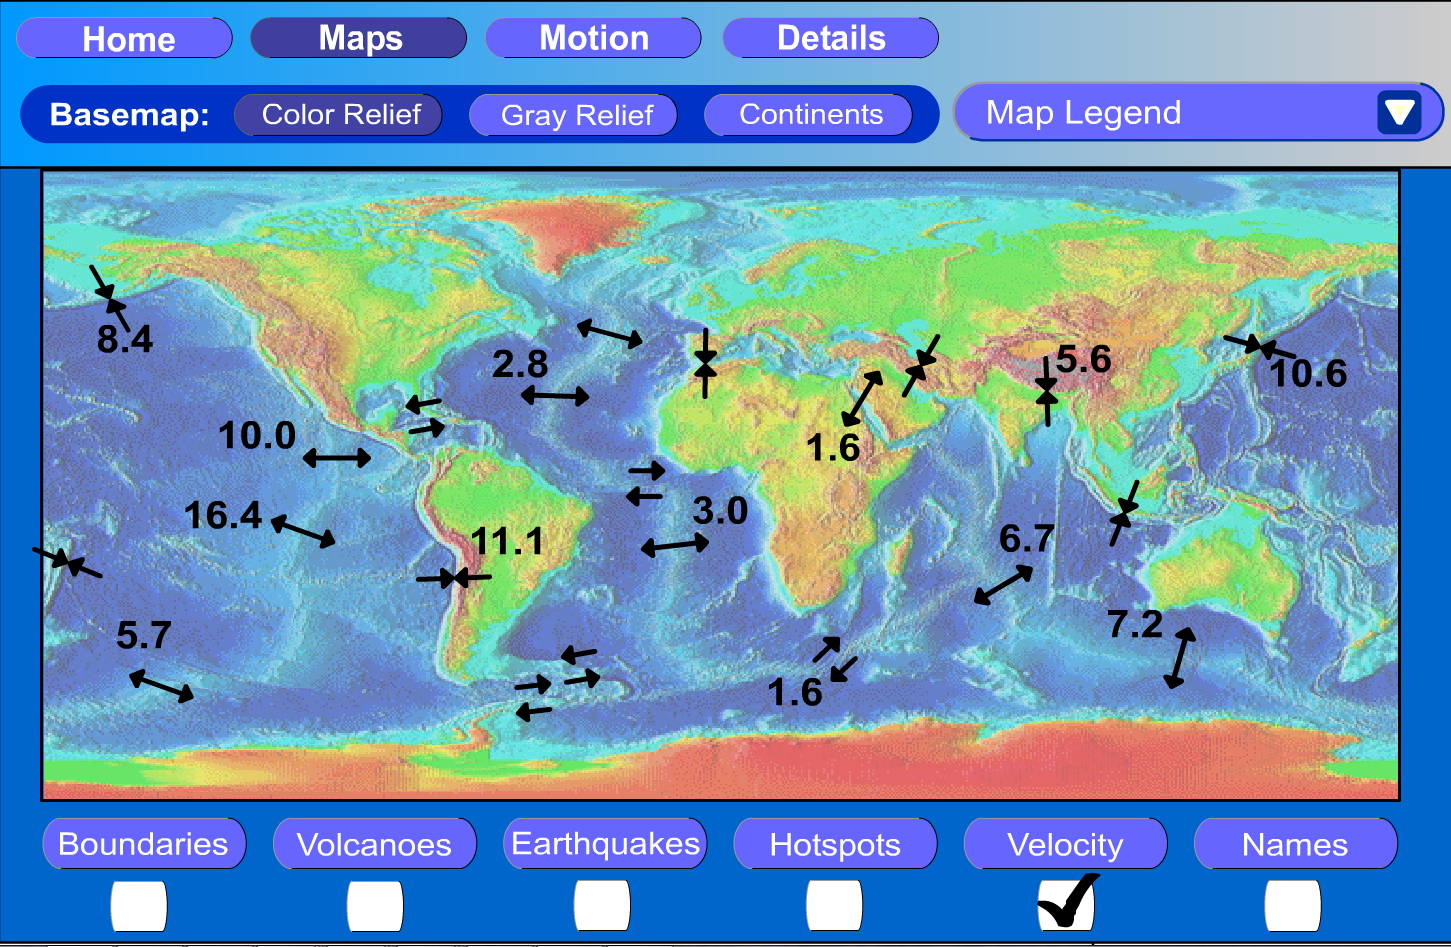
To illustrate the effect of tectonic plate velocities, please view the following two images:
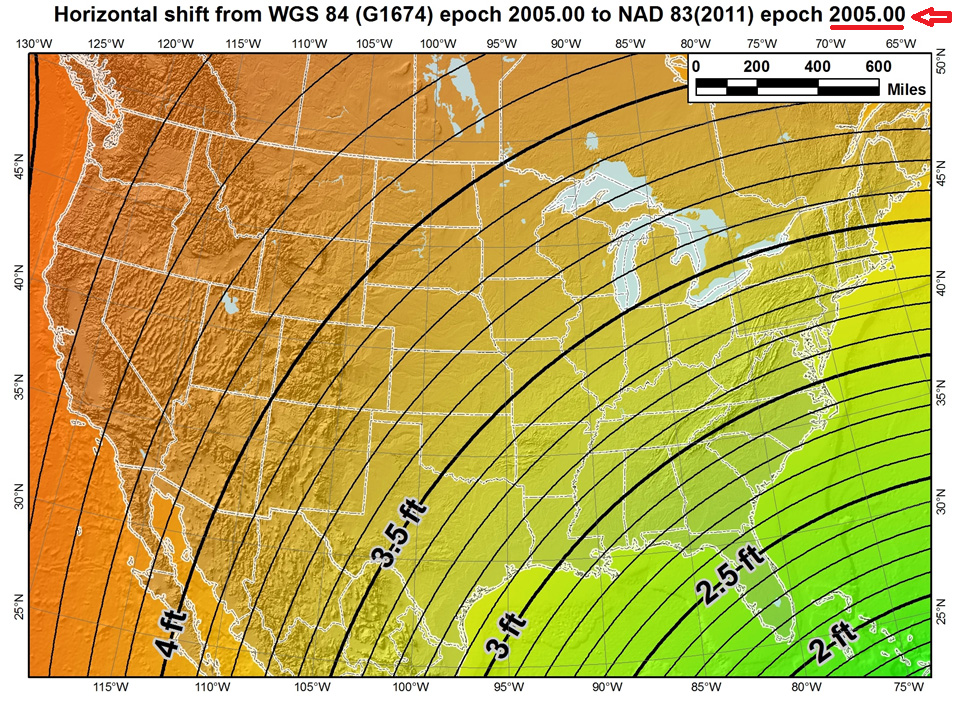
The first image shows the the difference between the latest definitions of WGS-84 (G1674)/ITRF08 epoch 2005.0 and NAD83/2011 epoch 2005.0. Notice the smooth contour lines. This is using the 14-parameter transformation.
Source: Michael Dennis – US National Geodetic Survey
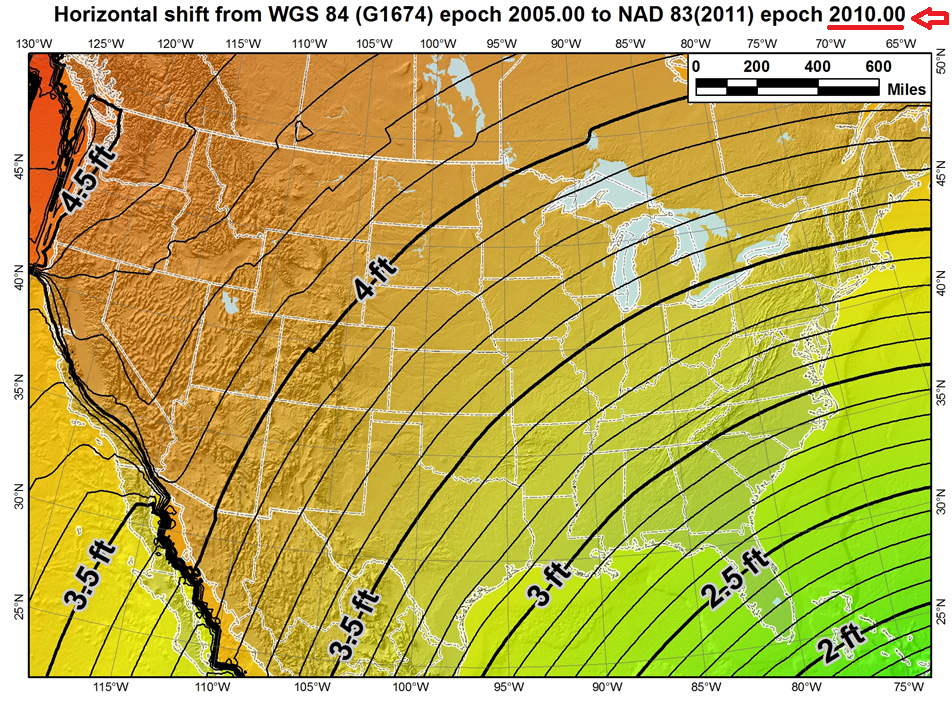
However, the correct US definition of NAD83/2011 is referenced to epoch 2010.0, a full five years later than the first image where it was referenced to 2005.0. Notice the dramatic effect of the tectonic plate movement in the western part of the US. In this case, the 14-parameter transformation was used as well as the velocity model to estimate the tectonic plate movement.
Source: Michael Dennis – US National Geodetic Survey
This illustrates that increasingly, geospatial data consumers will need to consider that “time is of the essence” when combining geospatial datasets.
GLONASS Rocket Crash
On July 2, 2013, a rocket carrying three GLONASS satellites crashed shortly after lifting off from its launch pad in Kazakhstan’s Baikonur cosmodrome. It’s the second launch crash for GLONASS, costing Russia six GLONASS satellites in the past three years. According to several sources, the cause of the July 2 crash was blamed on incorrectly installed angular velocity sensors. Despite the loss, GLONASS still has a full constellation of 24 satellites and, since GLONASS is largely used as an augmentation to GPS, people using GPS/GLONASS receivers should experience no change in performance.
Rumors are circulating that this crash signals the beginning of the end of the GLONASS program, but I don’t believe it. Although this crash is a serious blow to Russia’s space program and will certainly set back the GLONASS program due to the nature of the crash (at the launch pad), I believe that GLONASS is here to stay.
GPS suffered a major setback when, in 1986, the Space Shuttle Challenger exploded 73 seconds after lift-off because the space shuttle was the planned launch vehicle for GPS satellites. Subsequent launches were shifted to the Delta II rocket, causing a two-year delay in GPS satellite deployment. However, GPS never subsequently strayed from its course and for nearly three decades has been the so-called gold standard of satellite-based positioning, navigation, and timing.
с надеждой (here’s hoping) GLONASS can similarly recover its momentum and progress as planned.
Update: On July 9th, Ria Novosti reports that Russia will launch two GLONASS navigation satellites later this year to make up for the loss of three satellites in the recent Proton rocket explosion after launch from the Baikonur space center in Kazakhstan, according to a senior space industry official.
“We are planning to launch two satellites from the Plesetsk space center [in northern Russia] to replenish the GLONASS orbital grouping following the recent Proton-M accident,” said Nikolai Testoyedov, the head of the Information Satellite Systems (ISS) company, which manufactures satellites for the GLONASS project.
The first GLONASS is scheduled for launch in the beginning of September, and the second at the end of October, according to Testoyedov. The official added that both satellites will be launched on board the Soyuz carrier rockets, which has proven to be more reliable than ill-fated Protons.
A group of 29 GLONASS satellites is currently in orbit, with 24 spacecraft in operation, three spares, one in maintenance, and one in test flight phase, according to Russia’s space agency, Roscosmos.
Join me on the NSPS Radio Hour – Monday, July 22, 11:00am US Eastern Time/8:00am Pacific Time
I, along with Michael Dennis of the US National Geodetic Survey, will be guests on the National Society of Professional Surveyors (NSPS) radio hour talking about interesting geospatial data and GNSS subjects. You can tune in live or download the mp3 audio recording onto your smartphone or mp3 player. Feel free to send me an email ahead of time if there’s a particular subject you’d like to hear us discuss.
The Sierra Club announced that the California Supreme Court ruled in a unanimous decision that geographic information systems (GIS) data must be provided to the public for a nominal fee under the Public Records Act. The decision has broad application, confirming that information not exempt from disclosure under the Act must be provided to the public for a nominal charge, regardless of whether it is kept in paper form or as electronic data. The Court also affirmed the public’s civil right under the California Constitution of access to government information, holding that it can be used as a tiebreaker in case such as this, where the public right of access is disputed.
According to the announcement, the case started in 2007, when the Sierra Club requested from Orange County a copy of its GIS parcel database, containing the location and layout of each legal parcel of land in the county. At that time, Orange County licensed copies of the parcel database to private companies and public agencies for $375,000. The county also required licensees to sign non-disclosure agreements preventing further distribution. The county supported its GIS operation in part with licensing revenues from the sale of parcel data and argued that this revenue stream would dry up if the county was required to provide copies of the data to the public for a nominal fee under the Public Records Act.
The Sierra Club sued in 2009. Orange County argued that the parcel database is “computer software,” as that term is used in the Public Records Act, because it is part of a “computer mapping system.” Under the Act, software is not a public record, and software includes “computer mapping systems.” The Orange County Superior Court agreed with Orange County, denying the Sierra Club’s request to compel the county to provide the parcel database under the Act. The Sierra Club appealed and lost on appeal in the Fourth District Court of Appeal, in Santa Ana, Orange County, California.
In September, 2011, the California Supreme Court agreed to review the case. Amici curiae filed briefs on behalf of the Sierra Club, including the Media and Open Government coalition, representing newspapers such as the Los Angeles Times and the Orange County Register, a coalition of companies that provide value-added services based on electronic public records, the Stanford Environmental Law Clinic, the Electronic Frontier Foundation, a group of academic researchers at UCLA, Jack Cohen, and a coalition of GIS professionals.
Attorney Sabrina Venskus, the Sierra Club’s lead counsel, argued the case in the California Supreme Court in early May. Today, the Court ruled that the lower courts got it wrong. The Court’s seven justices decided unanimously in favor of the Sierra Club, ordering that the County be compelled to provide the Sierra Club with a copy of its parcel database for the cost of producing the physical copy. Orange County will now join the other 49 out of 58 California counties that provide their parcel data to the public for a nominal charge.
The Sierra Club reported that the Angeles Chapter’s GIS Committee will use the data to make maps for its conservation campaigns. GIS Parcel data previously obtained from Los Angeles County under the Public Records Act was used to map land parcels in the Verdugo Mountains in the cities of Los Angeles, Glendale and Burbank, color-coding each parcel as to whether it was publicly or privately owned. This allowed a task force including the Sierra Club and agencies from the three cities to prioritize the acquisition of open space in the Verdugos. The club continually produces GIS maps in support of its conservation campaigns, and will put the Orange County data to good use in fighting for the environment.
The Supreme Court decision focused on GIS parcel data, but its holding applies to all types of computer mapping data. GIS data is becoming increasingly important as state and local agencies continue to incorporate it into their operations. Some agencies have requirements that all street addresses in their databases be geocoded, i.e. converted into latitude and longitude, i.e. GIS data. Applications go beyond purely environmental issues. For example, public health agencies use computer mapping technology to track the spread of infectious diseases. Following today’s decision, all this information will be available to the public, who can use it for their own purposes, at a nominal charge.
Attorney Sabrina Venskus stated: “This is great day for California’s citizens: the public will now have appropriate access to important government mapping data – government records which are only used and useful in electronic format – and taxpayers won’t be required to pay for data they already effectively paid for with their tax dollars when the County compiled and organized those records in the first instance.”
Though the information at issue in the case was GIS data, the decision affirms a previous Supreme Court holding that electronic databases are subject to the Public Records Act disclosure requirements when they contain data that’s not exempt under the Act. This is important because agencies increasingly keep their records in databases. “The move from paper to electronic recordkeeping shouldn’t affect the public’s right to the information,” says Dean Wallraff, another lawyer representing the Sierra Club in the case.
Ms. Venskus added: “It is extraordinarily gratifying that the Supreme Court ruled unanimously in favor of my client after having litigated this case for almost five years and suffering through two losses in the lower courts. Yet Mr. Wallraff and I felt so strongly about the public having access to this important information, and that Orange County was in violation of the law, we forged ahead despite the fact we took this case on contingency and ran the risk of working thousands of hours with no compensation. Everyone’s hard work, including amici curiae’s has been vindicated on this day.”
DigitalGlobe announced that ArcGIS Online users will now have access to DigitalGlobe’s Premium Services. Revealed today at the plenary address during the Esri User Conference, the new offering brings expanded geospatial products and solutions to select users of ArcGIS Online on a subscription basis.
According to the announcement, DigitalGlobe’s Global Basemap, FirstLook, and Multispectral Premium Services can now be seamlessly integrated into the workflow of ArcGIS users, allowing them to access the most current imagery and information available directly from the source!
“Accessing high resolution imagery with ArcGIS has taken a giant leap forward,” said Lawrie Jordan, Esri director of imagery. “The new DigitalGlobe Premium Services enable everyone to benefit from quick and easy access to one of the best collections of high resolution imagery through ArcGIS Online.”
“The Premium Services partnership will serve as the next era in the expansion of our relationship with Esri,” said Bert Turner, senior vice president, sales at DigitalGlobe. “We’re excited to work with Esri, the GIS market leader, to bring users of ArcGIS Online some of the most advanced imagery services available today.”
The Global Basemap Premium Service provides some of the best available natural color and panchromatic imagery. This imagery is available as a cached tile service with vast coverage of the U.S. and Canada. This service will be regularly updated to reflect new, high quality imagery from DigitalGlobe.
The FirstLook Premium Service is a disaster and crisis monitoring service populated with imagery when a qualifying event occurs, such as a natural disaster, manmade crisis, political instability, or human interest occurrence. Through this service, users have access to near real-time post-event imagery as well as pre-event imagery for comparison.
The Multispectral Premium Service offers access to rich, full resolution multispectral content through an ArcGIS Online interface running on a highly scalable cloud architecture. The service and the content it hosts can be tailored to the client’s specific project needs. Users who require highly detailed imagery for image analytics, geodatabase updates, and surface change analysis can work with DigitalGlobe experts to maximize the value of the subscription.
HERE, a Nokia business, announced that it is bringing its real-time traffic information to Esri, a market leader in Geographic Information System (GIS) mapping software used by enterprise and government fleet management companies around the world. With HERE Traffic, Esri will enhance its web and cloud location platform with more precise location data for intelligent routing. Fleet operators will be able to better manage problems as they occur in real time, re-routing fleets when traffic unexpectedly hits, and providing alerts when pickup or delivery delays occur.
With congestion in the top 100 highway bottlenecks getting worse, real time traffic information helps fleets avoid traffic hotspots so that they get can get to their destinations faster and more safely.
“For 10 years, Esri and HERE have had the shared goal of enhancing safety and increasing the efficiency of fleet operations by offering the most accurate transportation information on more roads than any other provider across the world,” said Chris Cappelli, Director of Sales at Esri. “Launching real-time traffic from HERE on Esri’s platform for our ArcGIS Online and ArcGIS for Transportation Analytics software products will offer a deeper level of logistic and analytic capabilities for enterprise and government fleet companies.”
According to the announcement, real-time traffic is one of the services that HERE delivers based on the data it gathers from a wealth of sources including, the world’s largest compilation of both commercial and consumer probe data, the world’s largest fixed proprietary sensor network, event-based data collected from government and commercial sources, and billions of historical traffic records.
“Dependable real-time traffic information is crucial to improving fleet operations strategy today and for the long-term,” said Roy Kolstad, Vice President for Mobile, Web and Enterprise in North America at HERE. “Our traffic offering will complement HERE map content, which Esri has been using for a decade. Through this combination of traffic and map content, Esri will be able to offer a richer location-based analytics offering that will help businesses make more informed decisions.”
HERE reports that the freshness of that data enables HERE Traffic to provide a more accurate picture of traffic conditions. HERE currently processes 20 billion real-time GPS probe points a month, with almost half of all the data less than 1 minute old and more than three-quarters less than 5 minutes old.
“Traffic data is the single most important telematics application,” said Roger C. Lanctot, Associate Director in the Global Automotive Practice for Strategy Analytics. “Whether for fleets or consumers, traffic data is essential to determining the fastest or most efficient route and HERE’s expanding relationships on the enterprise side are significant. Traffic information is core to maximizing uptime and essential for alternative fuel vehicles such as EVs.”
Geospatial Solutions Editor Eric Gakstatter, who is also a contributing editor to GPS World magazine, will be attending the 2013 Esri Survey Summit and Esri International User Conference, providing continuous new and analysis for the duration of both conferences. The conferences are being held this week in San Diego, California.
On Tuesday at 1:30 p.m. in Room 24A of the San Diego Convention Center, Gakstatter will deliver a presentation entitled “High-Precision GPS/GNSS on your Smartphone, Handheld and Tablet,” discussing trends and new product innovations for sub-meter and centimeter mapping on smartphone, handheld and tablet devices, including Windows Mobile, Android and iOS (Apple) devices.
Steve Copley, GPS World and Geospatial Solutions associate publisher and account executive, shared images of the event on his Twitter account. Here are a few of them: