CoreLogic announced its patented ParcelPoint technology has expanded to include data coverage for 138.5 million parcels, 97 percent of which are actual parcel boundary polygons.
According to the announcement, it is the most comprehensive parcel database in the U.S., covering 2,605 counties across the country. CoreLogic has maintained the nation’s largest parcel database since 2008, when initial coverage totaled 90 million parcels.
The company reports that the ParcelPoint spatial data provides the parcel boundaries and centroid points defined by actual latitude/longitude coordinates that are vital to identifying the geographic location of an individual property, ownership information, as well as property address and assessor parcel number (APN). Data is sourced from public records in various formats, and are then checked for geometric errors, positional accuracy, and attribution. The parcels are standardized for consistency and then incorporated into a spatial dataset to create uniform information for widespread use.
Esri introduces the public beta version of its cloud-based Geotrigger Service that helps developers easily create location-aware apps for iPhone and Android without compromising battery life. The beta Geotrigger Service is available at no cost and feedback from developers will be used to shape the official release.
The Geotrigger Service allows apps built on the Esri location platform to quickly gather business intelligence such as where people are and when the app is used. Developers can also design apps that send messages to users when they arrive at or leave areas defined by a geofence.
“On the Esri location platform, we already offer a host of services for developers from geocoding and geoenrichment to routing maps. The Geotrigger Service boosts this offering with location-awareness and location-based alerts,” said Johan Herrlin, Esri’s senior business strategist.
Developers can use the Geotrigger Service for apps across all industries including:
·Retail and Loyalty: Engage customers with personalized content and deals the moment they enter a store.
·Real Estate: Send messages to prospective home buyers when their search criterion matches a nearby home.
·Energy Management: Use location to automatically manage power consumption at home or in the office.
·Tourism: Bring public attractions to life by informing tourists of interesting locations as they explore a city.
·Public Alerts: Notify citizens about events such as road closures or civic emergencies based on past locations.
Source: Hansen, Potapov, Moore, Hancher, et al, 2013
A multi-organizational team led by the University of Maryland has created the first high-resolution global map of forest extent, loss and gain. This free resource greatly improves the ability to understand human and naturally-induced forest changes and the local to global implications of these changes on environmental, economic and other natural and societal systems, members of the team say
According to the announcement, the team of 15 university, Google and government researchers reports a global loss of 2.3 million square kilometers (888,000 square miles) of forest between 2000 and 2012 and a gain of 800,000 square kilometers (309,000 square miles) of new forest.
Their study, published online on November 14 in the journal Science, documents the new database, including a number of key findings on global forest change. For example, the tropics were the only climate domain to exhibit a trend, with forest loss increasing by 2,101 square kilometers (811 square miles) per year. Brazil’s well-documented reduction in deforestation during the last decade was more than offset by increasing forest loss in Indonesia, Malaysia, Paraguay, Bolivia, Zambia, Angola and elsewhere.
“This is the first map of forest change that is globally consistent and locally relevant,” says University of Maryland Professor of Geographical Sciences Matthew Hansen, team leader and corresponding author on the Science paper.
“Losses or gains in forest cover shape many important aspects of an ecosystem, including climate regulation, carbon storage, biodiversity and water supplies, but until now there has not been a way to get detailed, accurate, satellite-based and readily available data on forest cover change from local to global scales,” Hansen says.
To build this first of its kind forest mapping resource, Hansen, UMD Research Associate Professor Peter Potapov and five other UMD geographical science researchers drew on the decades-long UMD experience in the use of satellite data to measure changes in forest and other types of land cover. Landsat 7 data from 1999 through 2012 were obtained from a freely available archive at the United States Geological Survey’s center for Earth Resources Observation and Science (EROS). More than 650,000 Landsat images were processed to derive the final characterization of forest extent and change.
Source: Hansen, Potapov, Moore, Hancher, et al, 2013
The analysis was made possible through collaboration with colleagues from Google Earth Engine, who implemented the models developed at UMD for characterizing the Landsat data sets. Google Earth Engine is a massively parallel technology for high-performance processing of geospatial data and houses a copy of the entire Landsat image catalog. What would have taken a single computer 15 years to perform was completed in a matter of days using Google Earth Engine computing.
Hansen and his coauthors say their mapping tool greatly improves upon existing knowledge of global forest cover by providing fine resolution (30 meter) maps that accurately and consistently quantify annual loss or gain of forest over more than a decade. This mapping database, which will be updated annually, quantifies all forest stand-replacement disturbances, whether due to logging, fire, disease or storms. And they say it is based on repeatable definitions and measurements while previous efforts at national and global assessments of forest cover have been largely dependent on countries’ self-reported estimates based on widely varying definitions and measures of forest loss and gain.
Dynamics from local to regional to global scale are quantified. For example, subtropical forests were found to have the highest rates of change, largely due to intensive forestry land uses. The disturbance rate of North American subtropical forests, located in the Southeast United States, was found to be four times that of South American rainforests during the study period; more than 31 percent of U.S. southeastern forest cover was either lost or regrown. At national scales, Paraguay, Malaysia and Cambodia were found to have the highest rates of forest loss. Paraguay was found to have the highest ratio of forest loss to gain, indicating an intensive deforestation dynamic.
The study confirms that well-documented efforts by Brazil – which has long been responsible for a majority of the world’s tropical deforestation – to reduce its rainforest clearing have had a significant effect. Brazil showed the largest decline in annual forest loss of any country, cutting annual forest loss in half, from a high of approximately 40,000 square kilometers (15,444 square miles) in 2003-2004 to 20,000 square kilometers (7,722 square miles) in 2010-2011. Indonesia had the largest increase in forest loss, more than doubling its annual loss during the study period to nearly 20,000 square kilometers (7,722 square miles) in 2011-2012.
Hansen and colleagues say the global data sets of forest change they have created contain information that can provide a “transparent, sound and consistent basis to quantify critical environmental issues,” including the causes of the mapped changes in the amount of forest; the status of world’s remaining intact natural forests; biodiversity threats from changes in forest cover; the carbon stored or emitted as a result of gains or losses in tree cover in both managed and unmanaged forests; and the effects of efforts to halt or reduce forest loss.
For example, Hansen says, that while their study shows the efforts of Brazil’s government to slow loss of rainforest have been effective, it also shows that a 2011 Indonesian government moratorium on new logging licenses was actually followed by significant increases in deforestation in 2011 and 2012.
“Brazil used Landsat data to document its deforestation trends, then used this information in its policy formulation and implementation. They also shared these data, allowing others to assess and confirm their success,” Hansen says. “Such data have not been generically available for other parts of the world. Now, with our global mapping of forest changes every nation has access to this kind of information, for their own country and the rest of the world.”
Support for Landsat data analysis and characterization was provided by the Gordon and Betty Moore Foundation, the United States Geological Survey and Google, Inc. GLAS data analysis was supported by the David and Lucile Packard Foundation. Development of all methods was supported by NASA through its Land Cover and Land Use Change, Terrestrial Ecology, Applied Sciences and Measures programs (grants NNH05ZDA001N, NNH07ZDA001N, NNX12AB43G, NNX12AC78G, NNX08AP33A and NNG06GD95G) and by the United States Agency for International Development through its CARPE program.
High-resolution global maps 21st-century forest cover change, Science, Nov. 15, 2013, Vol 342 #6160, authors M. C. Hansen, P. V. Potapov, S. A. Turubanova, A. Tyukavina, L. Chini, C. O. Justice and J. R. G. Townshend of the University of Maryland; R. Moore, M. Hancher and D. Thau of Google, Inc.; S. V. Stehman of the State University of New York; S. J. Goetz of Woods Hole Research Center; T. R. Loveland of the United States Geological Survey; and A. Kommareddy, and A. Egorov of South Dakota State University.
As some of you may know, I also write a monthly column for Geospatial Solutions, which is all about geospatial technology encompassing GIS, surveying, engineering, and anything regarding geospatial technology. On occasion, I write something that fits very well with both my Survey Scene newletter and Geospatial Solutions Monthly newsletter. This is one of those months.
Drones, UAVs, UAS…whatever you want to call them, are getting a lot of press coverage, both in the mainstream media and the surveying trade media. Rightly so — there are a terrific number of uses for drones in surveying and mapping from forensic mapping to crop monitoring to creating terrain models for volume estimations. A little later below, I’ll give you a link to my more detailed article about applications and my personal experience.
In this article, I’d like to focus on the U.S. law regarding using drones for commercial purposes (eg. mapping, surveying, etc). I’ll start with a blanket statement.
Under the current law, it is illegal for any commercial entity to operate a drone in the U.S. Period.
The only exception is that the Federal Aviation Administration (FAA) is issuing special airworthiness certificates in the experimental category for testing, market survey, and training of drones. However, the FAA specifically states that drone users awarded such an experimental certificate are not licensed to use drones for “hire or compensation.”
The only other possibility is if the commercial entity has an airworthiness certificate for the drone like what’s required for any other aircraft such as an airliner. However, you can bet that no drone within your price range has such a certificate.
What about hobby users?
This is where it gets interesting and where some commercial users think there is wiggle room.
Under the current FAA rules, hobbyists (the FAA calls them modelers) can fly drones up to 400 feet above ground level (AGL) and must notify the airport operator if flying within three miles of the airport. Hobbyists are covered under the AC 91-57 rules, a simple one-page document.
Some (maybe many) companies and/or individuals who are operating drones for mapping in the U.S. think this is a loophole in the FAA rules, and that as long as they do not charge for the drone flight-time, they are not violating the FAA rules (they say they only charge for processing the data). The FAA begs to differ. When I asked the FAA this question, FAA Spokesperson Alison Duquette responded:
“They would be violating FAA rules. Please read this policy link. The FAA recognizes that people and companies other than modelers might be flying UAS with the mistaken understanding that they are legally operating under the authority of AC 91-57. AC 91-57 only applies to modelers, and thus specifically excludes its use by persons or companies for business purposes.”
This begs the question, is the FAA following a “don’t ask, don’t tell” informal policy? The best way to determine this is to look at their enforcement activity. When I asked the FAA if it would send me the list of enforcement activity regarding drones, the agency said I’d have to submit a Freedom of Information Act (FOIA) request, which I did this week. I’m told by my colleagues it may take some time before I get a response.
I know of at least one instance where the FAA told an entity to shut down its use of drones. Take a look at this three-minute CBS news video.
Last month’s article about post-processing alternatives, “Seven Free Alternatives to OPUS GPS Post-Processing During U.S. Federal Government Shutdown,” was one of the all-time, most-read articles ever published on the GPS World website. It’s ironic because I’m not a fan of post-processing in general. Mind you, I coordinated the development of several post-processing (both L1 and L1/L2) software packages back in the 1990s, so it’s not like I’m afraid to post-process or don’t understand the technology. It’s just that it’s so inefficient compared to RTK. However, I do concede that OPUS, AUSPOS, CSRS, Centerpoint RTX, GAPS, Scout, and MagicGNSS online post-processing tools combined with an increasing number of publicly available, worldwide GNSS reference stations make centimeter-level post-processing a lot easier (and less expensive) than ever before. It seems like a lot of you still prefer it!
RTK technology is advancing too, from both a receiver perspective and a satellite system perspective. Which geographic region of the world do you think is the most well-suited for RTK positioning?
It may seem like an odd question, and it would have been to me had I not attended the ION GNSS+ conference in Nashville, Tennessee, in September and the Intergeo 2013 conference in Essen, Germany, in October. How could one geographic region be significantly better for RTK positioning than another? Terrain? Nope. It’s the same country that consumes more L1/L2 receivers than any other country in the world: China.
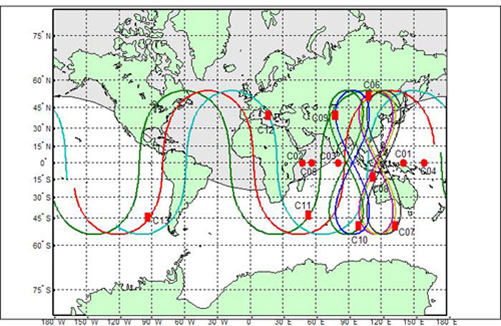
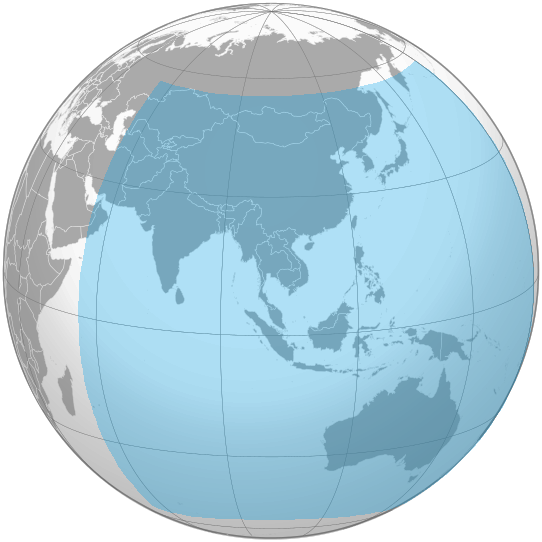
Why China? A picture (well, two pictures) is worth a thousand words:
At this point, China’s BeiDou (now referred to as BDS) navigation system is a regional system. If you look at the above graphic of the BDS satellite orbits, you can see the satellite figure eight orbits above southeast Asia. These satellites, combined with GPS and GLONASS, give the RTK user a tremendous number of usable satellites. Furthermore, since the BDS satellites are in figure-eight orbits, they stay “in view” longer ,which is ideal for RTK.
The result is that GNSS users in the BDS coverage area have more satellites in view than any other region in the world, and we all know that more satellite observations make for better RTK positioning.
China’s plans don’t stop with BDS being a regional system. By 2020, China says it plans for BDS to be a global system similar to GPS and GLONASS. The BDS presenter at ION GNSS+ said, “China always regards BeiDou belonging to both China and the world.”
GPS and Galileo Delays
Meanwhile, as it seems China is pushing forward, both GPS and Galileo suffered delays last month.
The fifth GPS IIF satellite (IIF-5) launch scheduled for last month was postponed. A fuel leak in the Delta 4 launch rocket seems to be the culprit. No new launch date has been scheduled for IIF-5. The United Launch Alliance (ULA) issued the following statement:
“The ongoing Phase II investigation has included extremely detailed characterization and reconstructions of the instrumentation signatures obtained from the October 2012 launch and these have recently resulted in some updated conclusions related to dynamic responses that occurred on the engine system during the first engine start event.
“The GPS IIF-5 Delta IV launch is being delayed to allow the technical team time to further assess these updated conclusions and assess the improvements already implemented and determine whether additional changes are required prior to the next Delta IV launch.
“The Delta IV booster for the GPS IIF-5 mission has completed the standard processing and checkout on the launch pad and will be maintained in a ready state for spacecraft mate and launch pending completion of this assessment. A new launch date will be established when the assessment of the updated dynamic response information is completed in the coming weeks.”
Meanwhile, Europeans have been waiting on pins and needles for the first production launch of dual Galileo satellites. A fall 2013 launch date was expected, but has been postponed until Summer 2014.
According to European officials, the European Space Research and Technology Centre (ESTEC) thermal vacuum chamber for testing satellites under orbit conditions was not ready for the two FOC satellites delivered by OHB in late summer.
The satellites thus cannot ship to the Guiana spaceport in South America in time for a planned 2013 launch on a Soyuz rocket. The Galileo schedule is also running into bottlenecks with scheduled launches by other satellite programs aboard Guiana Soyuzes.
A six-week test of the first Galileo satellite at ESTEC reportedly got under way in October.
The pressure is rising for Galileo to start delivering usable satellite observations, which China is already doing, albeit for themselves and their neighbors.
Esri’s releases new versions of Collector for ArcGIS and Operations Dashboard for ArcGIS include display, configuration, and workflow enhancements that improve field data collection and enterprise oversight. Both apps are available at no cost to Portal for ArcGIS customers and ArcGIS Online subscribers.
According to the announcement, Collector for ArcGIS is a configurable field data collection app for iOS and Android. The new version of Collector includes support for iPad and Android tablets. Templates, selection results, directions, and more, can now be viewed alongside the map on mobile devices with larger screen real estate. The updated Collector app also expands the types of data that can be collected. It now allows the input of GIS features of all primary shape types (e.g., points, lines, and polygons). The app also gives you the ability to view and control GPS accuracy when capturing features so you can stream positions from the GPS as you move.
Data capture often involves recording repetitive information at different locations and/or multiple features of different types at the same location. To reduce that manual repetition, Esri introduced a continuous collect mode that allows you to copy the location or attributes of the last collected feature.
Esri reports that they also updated Operations Dashboard for ArcGIS, that provides a common operational picture for monitoring, tracking, and reporting events to people within your organization. The new version of Operations Dashboard improves the way you work with data. Because you can potentially use Operations Dashboard to view extensive lists of information, Esri added the ability to search within lists to quickly find what you need. You can now see charts, graphs, custom text, and photo attachments within the pop-up windows. You can also filter the map and all widgets using relative time, such as within the last hour or month, or after a specific date. This helps you monitor and analyze data that changes rapidly over time.
Operations Dashboard for ArcGIS now fully supports Portal for ArcGIS as well as ArcGIS Online. A new configuration utility is available to Portal customers, making it easy to sign in and deploy the Operations Dashboard app on-premises.
Collector for ArcGIS can be downloaded from the Apple App Store and Google Play. Operations Dashboard is available through ArcGIS Online. Portal for ArcGIS users can access the Operations Dashboard app from the Customer Care portal.
The U.S. Department of Transportation’s Federal Aviation Administration (FAA) released its first annual Roadmap outlining efforts needed to safely integrate unmanned aircraft systems (UAS) into the nation’s airspace. The Roadmap addresses current and future policies, regulations, technologies and procedures that will be required as demand moves the country from today’s limited accommodation of UAS operations to the extensive integration of UAS into the NextGen aviation system in the future.
“Government and industry face significant challenges as unmanned aircraft move into the aviation mainstream,” said U.S. Transportation Secretary Anthony Foxx. “This Roadmap is an important step forward that will help stakeholders understand the operational goals and safety issues we need to consider when planning for the future of our airspace.”
According to the announcement, the Roadmap outlines the FAA’s approach to ensuring that widespread UAS use is safe, from the perspective of accommodation, integration, and evolution. The FAA’s main goal for integration is to establish requirements that UAS operators will have to meet in order to increase access to airspace over the next five to 10 years. The Roadmap discusses items such as new or revised regulations, policies, procedures, guidance material, training and understanding of systems and operations to support routine UAS operations.
“The FAA is committed to safe, efficient and timely integration of UAS into our airspace,” said FAA Administrator Michael Huerta. “We are dedicated to moving this exciting new technology along as quickly and safely as possible.”
The FAA reports that the Roadmap also addresses the evolution of UAS operations once all requirements and standards are in place and are routinely updated to support UAS operations as the National Airspace System evolves over time. The document stresses that the UAS community must understand the system is not static, and that many improvements are planned for the airspace system over the next 15 years.
The FAA plans to select six UAS test sites to begin work on safely integrating UAS into the airspace. These congressionally-mandated test sites will conduct critical research into how best to safely integrate UAS systems into the national airspace over the next several years and what certification and navigation requirements will need to be established.
The use of UAS, both at the designated test sites and in the national airspace generally, raises the issue of privacy and protection of civil liberties. In February, the FAA asked for public comments specifically on the draft privacy requirements for the six test sites. Today, the agency sent a final privacy policy to the FederalRegister that requires test site operators to comply with federal, state, and other laws on individual privacy protection, to have a publicly available privacy plan and a written plan for data use and retention, and to conduct an annual review of privacy practices that allows for public comment. Information about the test site selection process and final test site privacy policy is available at: http://www.faa.gov/about/initiatives/uas/
For the next several years, the FAA will continue to use special mitigations and procedures to safely accommodate limited UAS access to the nation’s airspace on a case-by-case basis. The Roadmap notes that this case-by-case accommodation will decline significantly as integration begins and expands, but will continue to be a practical way to allow flights by some UAS operators in certain circumstances.
In addition to the FAA’s Roadmap, as required in the 2012 FAA Reauthorization, the Joint Planning and Development Office (JPDO) has developed a comprehensive plan to safely accelerate the integration of civil UAS into the national airspace system.. That plan details a multi-agency approach to safe and timely UAS integration and coordination with the NextGen shift to satellite-based technologies and new procedures.
Esri published an interactive track map of Typhoon Haiyan, likely one of the strongest storms in recorded history.
According to Esri, users can see the real-time effects of the storm via social media posts. To change the search terms, go to the Social menu, click the settings icon, and update the keyword.
There is no doubt about it: drones (also referred to as UAVs and UAS) are a disruptive technology that will significantly impact geospatial professionals not only in the U.S., but around the world. While the mainstream media has mostly pushed the panic button with regards to privacy and drones, you don’t often read a discussion about using drones for mapping.
3D Matterhorn image produced from senseFly’s drone mapping effort.
In Switzerland, where drones weighing less than 30 kg (66 lbs) are legal to operate without a license as long as the operator maintains line of sight, drones mapped the famous Matterhorn Mountain (4,478 meters/14,692 feet) in the Swiss alps, at a resolution of 20 cm. This illustrates the power of drones for 3D mapping, and mapping in general. More efficient and less costly than traditional photogrammetry and airborne lidar, there is no doubt in my mind you will begin working with drones and/or data collected via drones in the near future. Of course, mapping the Matterhorn in 3D at 20-cm resolution is a monumental effort. Even using drones, senseFly reported that it took 11 flights, 5 hours and 40 minutes of flight time, and a total of 2,188 images to process covering 2,800 hectares (~6,920 acres). senseFly didn’t report how many manhours of post-processing the Matterhorn project required, but you know it must be a healthy number. Also, remember that Swiss regulations require that the drone operator must be within “direct eye contact” of the drone at all times, so you can bet the senseFly team had to do some serious mountain climbing.
While generating precise 3D images of a mountain certainly push the limits of drone technology, there are plenty of uses for mapping drones that make a lot of sense and are less complex. The Association for Unmanned Vehicle Systems (AUVSI) reports that in the United States, in the first three years of UAS integration more than 70,000 jobs will be created with an economic impact of $13.6 billion. AUVSI further reports that by 2025, the jobs number will increase to 100,000 jobs, and the economic value to $82 billion. Earlier this year, The Daily Beast reported that agriculture may end up being the largest user of drone technology. Other uses, according to AUVSI, include wildfire mapping, environmental mapping, disaster management, power-line surveys, oil and gas exploration, and general aerial mapping.
So what are we waiting for? Let’s start flying!
Not so fast. In many countries in the world, you can purchase a drone mapping kit and start flying tomorrow. Last month, I witnessed the massive offering of drones at the Intergeo 2013 conference. Copters and fixed-wing aircraft in all shapes and sizes were on display.
However, in the U.S. it’s not so easy. In fact, it’s illegal to operate any drone for mapping unless you have a special permit from the U.S. Federal Aviation Administration (FAA). If you think XYZ Corp. down the road who is using drones for mapping have such a permit, you are wrong. Despite the rumors and gossip you may have heard, and the fact that many companies are using drones for mapping in the U.S., it is not legal, by any stretch of the imagination.
Let’s have a look at what the FAA regulations state.
The FAA divides drone users into two categories: public and civil.
Public Users
Examples of public users by the FAA include the U.S. military and U.S. Customs and Border Protection, as well as other government agencies. Public users must apply for a Certificate of Waiver or Certificate of Authorization (COA) and adhere to the following guidelines:
The operator is required establish the drone’s airworthiness either from FAA certification, a Department of Defense airworthiness statement, or by other means.
The operator must demonstrate that a collision with another aircraft or other airspace user is extremely improbable.
The operator must comply with appropriate cloud and terrain clearance requirements.
The PIC (Pilot in Command), the operator in control of the drone, must maintain minimum qualifications and currency requirements.
An observer must be present to observe the drone and surrounding airspace via line-of-sight on the ground or via chase aircraft.
The PIC and observer must be within, generally speaking, one mile horizontally and 3,000 feet vertically of the drone.
Direct communications between the PIC and Observer must be maintained at all times.
As you imagine, these requirements are not easy to meet and issued to a select few entities. if you want to take a look at the list of Certificates of Authorization issued by the FAA, click here and scroll down to find links to redacted CoA awards that aren’t exempt from the Freedom of Information Act (FOIA).
As of February 15, 2013, the FAA reports there were 347 active COAs.
Civil Users
Civil users include any entity other than Public users, and includes commercial users.
Civil users must obtain an FAA airworthiness certificate just like you would need for any type of aircraft such as an airliner.
The FAA is issuing special airworthiness certificates in the experimental category for testing, market survey, and training of drones. The FAA is very clear that no Certificate of Authorization (CoA) or experimental certificates will be issued to commercial users. In fact, the FAA specifically states that drone users awarded an experimental certificate are not licensed to use drones for “hire or compensation.”
That’s it: short, sweet and to the point.
What about model aircraft users?
Interestingly enough, model aircraft users are allowed to operate drones and have a surprising amount flexibility in doing so. The guidelines for model aircraft users can be found here, but essentially the only concrete rules are that the “hobby” drone cannot exceed 400 feet AGL (above ground level), and that when flying within three miles of an airport, notify the airport operator. That’s it!
Even more interesting is that some hobby-class drones can be very useful for businesses. For example, last month I bought an AR Drone 2.o for US$370. The manufacturer calls it a quadracopter. It operates like a helicopter with four rotor blades. It’s controlled by an app that runs on your smartphone or tablet. I use a Samsung Galaxy III to control it. It’s amazingly easy to control with my smartphone.
AR Drone 2.0
I took the AR Drone 2.0 to the Field Technology Conference to demonstrate it and give conference attendees an idea of what is possible for very little expense. The response from attendees was a little surprising. I didn’t expect geospatial users to appreciate the limited capabilities of the AR Drone 2.0, but attendees spoke of applications like checking birds’ nests for eggs and close-up inspection of structures that aren’t easily accessible. After spending some time flying it, even I began to think about the inspection app and the ability to create video fly-throughs of golf courses, environmental areas, proposed developments, etc. The AR Drone 2.0’s forward-looking, high-definition camera generates stunningly crisp video.
So, that begs the question…
Why can’t a user, following the hobby rules (fly below 400 feet AGL), use the AR Drone 2.0 or any other drone for commercial purposes?
The answer is simple. The FAA rules state that you can use a drone all day long as a hobbyist (following the AC 91-57 rules), but once you start using it for commercial purposes, you are violating the law. Some drone users have said that to skirt the FAA rules, they don’t charge for drone flight time, but just the image processing (data) after the flight. I don’t think this concept has been tested in court yet, but the FAA says this activity is illegal.
“They would be violating FAA rules,” says FAA Spokesperson Alison Duquette. “Please read this policy link. The FAA recognizes that people and companies other than modelers might be flying UAS with the mistaken understanding that they are legally operating under the authority of AC 91-57. AC 91-57 only applies to modelers, and thus specifically excludes its use by persons or companies for business purposes.”
To understand how serious the FAA is about enforcing the no-business-use of hobby rules, I asked the FAA for a list of enforcement citations, cease and desist orders, etc. I was told I had to file a Freedom of Information Act (FOIA) request, which I did, but I’m warned by colleagues not to expect a speedy response.
Check out the following short (three-minute) video news report on a company in Minnesota that was “grounded” by the FAA for flying a drone for commercial use.
The good news is that in January 2012, the U.S. Congress ordered and funded the FAA to figure out how to integrate commercial drone use into the U.S. airspace by the end of 2015. In September 2013, the FAA released a document entitled “UAS Comprehensive Plan” and a document entitled “Integration of Civil Unmanned Aircraft Systems (UAS) in the National Airspace System (NAS) Roadmap“. If you’re really interested in learning more about drone usage in the U.S. and understand the FAA’s perspective, it’s worth a few minutes to scan these documents.
It’s going to be fascinating to see what rules the FAA establishes for commercial drone usage. Don’t be surprised if the PIC (Pilot in Command) must be a licensed pilot, and expect tough restrictions on altitude constraints, flight time, visibility, and control tower communications. I have my private pilot license (although I haven’t flown as PIC in years), and I recall that FAA rules state that you can fly as low as 500 feet AGL over rural areas and 1,000 feet AGL over populated areas. That doesn’t give commercial drone operators a lot of room to work with if they want to map a wide area.
TomTom released the 6th edition of its Traffic Index which reveals that on average, commuters around the world are spending 8 working days a year stuck in traffic.
According to the announcement, the Traffic Index is the world’s most accurate barometer of traffic congestion in 169 cities across six continents. It compares travel times during non-congested hours (free flow) with travel times in peak hours. The Index takes into account local roads and highways. Based on these comparisons, the report has compiled the top ten most congested cities, ranked by overall Congestion Level, in Q2 2013, these were:
1. Moscow
2. Istanbul
3. Rio de Janeiro
4. Warsaw
5. Palermo
6. Marseille
7. São Paulo
8. Rome
9. Paris
10. Stockholm
“We are seeing a clear pattern which shows that congestion levels increase as economies emerge from recession. The traditional responses to tackling congestion, like building new roads or widening existing ones are no longer proving effective. The way traffic is managed needs significant change,” says TomTom’s Chief Executive Officer, Harold Goddijn.
TomTom reports that the Traffic Index is based on detailed knowledge of the global road network and aims to help drivers, businesses and governments manage traffic congestion effectively.
“The findings from the Traffic Index also show that real-time traffic information has the potential to ease congestion in urban areas by routing drivers away from gridlock, and help commuters to make smarter decisions.” added Goddijn.
Trimble introduced the next generation of its Trimble GeoExplorer data collection solution. The new Geo 7X includes an integrated laser rangefinder module, extended GNSS capabilities and improved hardware performance. Together with robust field and office software, the new Trimble Geo 7X handheld can enhance productivity in difficult physical conditions and challenging GNSS environments.
According to the announcement, when faced with either obstructed satellites or inaccessible locations, GIS professionals now have the geospatial data collection tools they need—in a single package. For times when occupying a position is simply not possible, users can take advantage of Trimble’s new Flightwave technology. With Flightwave technology, users can easily capture offset measurements from the Geo 7X’s rangefinder module for direct integration with Trimble data collection software. Users can simply point and shoot to log the position, avoiding dangerous conditions or right-of-way challenges. In addition, Trimble’s field-proven Floodlight technology enhances field productivity when heavy overhead cover obstructs satellite signals.
The Geo 7X is compatible with existing and planned GNSS satellite systems—including GPS, GLONASS, Galileo, QZSS and now BeiDou—to maximize productivity with additional satellites and ranging signals.
Featuring a new 1 GHz processor and 4 GB of memory running Microsoft Windows 6.5 Professional operating system, the Geo 7X offers enhanced computing performance. Other standard features include a 4.2 inch sunlight readable LED touch display and a 5 MP camera for geo-tagging assets. For wireless connectivity, the integrated modem allows users to send and receive data via GSM networks as well as Verizon’s CDMA network in the U.S. And with its IP65 rating, the rugged handheld GNSS receiver is sealed against water and dust.
With the introduction of the Geo 7X, Trimble also delivers updates to its field and office software portfolio to extend Trimble’s end-to-end data collection solutions with new software workflows and compatibility. In addition to the field-proven Trimble TerraSync and Positions software, the Geo 7X now supports the customizable data collection workflows of Trimble TerraFlex software. Consisting of mobile software and Cloud services, TerraFlex offers a fast and efficient way to collect, process and manage data. Field data is automatically synced with a central server to streamline office operations and drive higher productivity.
“We believe that true productivity is being able to map assets—the first time, every time and anywhere. We’ve built upon our productivity-enabling Floodlight technology and pushed it forward several steps,” said Alain Samaha, business area director of GIS and geospatial software solutions for Trimble’s Geospatial Division. “Users now can position themselves in the optimal location and accurately measure assets remotely with a single, integrated device together with simple software workflows. The Trimble Geo 7X allows mobile GIS users to be productive wherever they need to work.”
Cambridge Consultants introduces radar-based technology detection system to help agricultural vehicles avoid collisions. The new radar system helps prevent this by protecting the perimeters of the vehicle from potential hazards – giving audible and visual warnings to the driver.
“We have identified a huge demand for this type of agricultural technology as we see a continued increase in advanced farming techniques in the face of impending population growth and food shortages,” said Gary Kemp, programme director at Cambridge Consultants. “We’ve created practical technology that’s simple to operate and install but is also low cost and incredibly effective.”
According to the announcement, the radar units are designed to be installed on the front and rear of a vehicle as well as on the boom ends, and can detect multiple collision hazards in a wide field of view which maximises coverage. The technology can process many different moving and stationary obstacles – and instantly send an alert to the driver to warn of a potential collision. The low-frequency (5.8GHz) system is based on standard manufacturing principles, making it a cost-effective solution. The patented short-range radar technology provides unbeatable performance from a compact, low-cost sensor. The sensor simultaneously tracks multiple objects in 3D over a wide field of view and up to 30m range. Real-time collision prediction algorithm identifies hazards early, giving the driver ample time to take avoiding action
The company will be showcasing its latest farming technology at the Agritechnica International Exhibition, November 12-15, in Hanover, Germany, hall 17, stand C38.
When looking at geospatial technology, I like to use the analogy that GIS software is the engine and GIS data is the fuel. We have many choices of powerful GIS software engines (Esri, Intergraph, QGIS, GlobalMapper, MapInfo, etc.). That technology remains relatively unchanged. Before the software vendors harp on me, yes, I get that new bells and whistles are added to software every year to enhance software functionality. Yes, maybe there’s a new database technology that indexes massive databases significantly faster. Yes, maybe there’s a new software tool that makes generating 3D visualizations or augmented reality much easier and faster. But just like your automobile, motorcycle, train, airplane, etc., they all need fuel to run. Data is the fuel.
The analogy doesn’t fit perfectly. After fossil fuels are used once, they are not reusable. Obviously, that’s not the same for GIS data. Some GIS data, like street data, is used daily over and over again by millions of people around the world in their Garmin, TomTom, and Magellan auto navigation units. However, in the fossil-fuel world, engines and fuel are matched reasonably well. In the geospatial world, the engines and fuel aren’t matched. The GIS fuel (data) is far behind the engine (software). In other words, GIS software is starving for data. There are so many applications for GIS yet to be realized, and vast majority of the unrealized apps are due to the lack of data.
For example, imagine carrying your iPad (or other tablet) in the street and pointing it down at pavement. Imagine, on the screen of your iPad, being able to “see” all of the infrastructure underneath the pavement such as water lines, sewer lines, and communications lines. What’s keeping those types of apps from being deployed today? The answer: the lack of accurate geospatial data.
The lack of geospatial data is no more apparent than at the 2013 Esri International User Conference in July and the Intergeo conference in Germany earlier this month.
In the exhibition areas, three trends were clearly apparent:
1. Mobile devices
2. UAVs
3. High-precision GNSS receivers
Clearly, all three of these are related to collecting GIS data.
Following are some comments and photos of each trend.
Mobile Devices
A few short years ago, mobile devices suitable for GIS data collection were a specialty item, and we had a few limited choices. Ever since the smartphone explosion and Apple introducing the iPad, it’s been mobile devices galore. A tremendous number of consumer mobile devices have been introduced. Most have failed, but the trend has generated a tremendous amount of R&D effort that manufacturers have leveraged to make industrial mobile devices for the geospatial community, such as the following:
Most, if not all, of these devices are designed and manufactured in China.
Juniper Systems is one of the few remaining U.S.-based rugged handheld manufacturers, introducing the new Archer 2 at Intergeo.
UAVs
There’s no denying that UAVs are going to play a large role in geospatial applications. In some geographic regions of the world, they are already being deployed for mining, agriculture, accident reconstruction and other mapping applications. The low-cost and and quick, convenient deployment make it a very attractive technology for time-sensitive and cost-sensitive applications that require imagery.
In the U.S., it is illegal to use UAVs for commercial applications unless you have a Certificate of Authorization from the Federal Aviation Administration (FAA), which are only granted to some universities and some government agencies. President Obama ordered the FAA to generating guidelines for integrating the use of commercial UAVs into the U.S. airspace by 2015. For the latest FAA progress on matters regarding UAVs, you can visit this FAA web page.
The current FAA rules are a bit odd. In the U.S., you are allowed to fly “hobby” UAVs up to 400 feet above the ground if you’re at least 1/4 mile away from an airport. If you take that same UAV and abide by the same restrictions as hobbyists, but use it for commercial purposes, it’s illegal. Take a look at this article by NBC News.
High-Precision GNSS Receivers
I’ve been writing about this for awhile, but it’s worth mentioning that RTK GNSS receivers are getting cheaper and cheaper. Whereas in the past, there have only been a handful of RTK GNSS receiver vendors, there are now at least twice as many as before, and increasing every year. This is good for the user community because it increases competition. The result is better products at lower prices. This trend will continue.
NSPS (Formerly ACSM) Radio Hour
Last week, I was a guest along with David Doyle (retired NGS Geodesist) on the NSPS Radio Hour discussing a variety of GNSS-related items such as the U.S. federal government shutdown and LightSquared. A recording of the radio show is available in MP3 format. You can listen or download it here.