An independent study conducted by UAV Navigation has defined the operational envelope of the VECTOR-600 autopilot based on the Specific Operations Risk Assessment (SORA) methodology. The operational envelope defines the operational risk profile within which an aircraft can operate safely, taking into consideration all risk mitigations included within the system.
The SORA methodology evaluates the safety risks involved with the operation of an unmanned aerial system (UAS) of any class, size or type of operation. The concept of operation (ConOps) is normally used as the input for this analysis; the output takes the form of the Specific Assurance and Integrity Level (SAIL) for a particular operation, which indicates the level of robustness that must be demonstrated for the operational safety objectives.
In this case, instead of performing a conventional SORA analysis from the ConOps to the SAIL output, this study was performed the other way around because the objective of the study was to identify the operational envelope of the sytem.
EUROCAE ED-280, the guidelines for UAS safety and analysis for specific categories of low and medium levels of robustness, recommends to any operator a detailed definition of different mission and platform points: the ConOps, the entire UAS architecture including functions, systems, and implementation, identification and classification of failure conditions; verification that safety objectives are fulfilled and a complete probable failure analysis using FMEA-like techniques and Fault Tree Analysis (FTA).
UAV Navigation prepared an FMECA and FTA analysis performed by a third-party and independent company on the VECTOR-600 autopilot and its onboard sensor suite, the POLAR-300. The study concluded that within the operational envelope of the VECTOR-600, any failure – however remote the probability – is highly unlikely to result in a catastrophic outcome, such as the loss of the aircraft. The conclusions reached indicate that the system is perfectly suited for VLOS/BVLOS operations – including appropriate restrictions where applicable. The system has proved its robustness and suitability for safe operations over a wide range of missions usually performed by professional UAS.
The analysis is available on request to all clients interested. Contact UAV Navigation for more information.
Precisely, a software company specializing in data integrity, announced that Devon and Cornwall Police leveraged its GIS software to enhance safety measures during the 2021 G7 Summit – an annual gathering of policy leaders from seven of the world’s major democracies.
The police force’s GIS team recognized that mapping software could play an important role to bring together data from a variety of sources and data formats, providing critical context in the assessment of safety protocols leading up to and throughout the Summit. The local force combined MapInfo Pro, a desktop mapping solution that provides location-based context from data, with third-party 3D visualizations to create a digital twin that enabled precise contingency planning. This model had an accuracy of up to five millimeters.
“We had two major hurdles we had to cross during the planning phase for the G7 Summit,” said Robert Goldsmith, GIS and Mapping Manager, Devon and Cornwall Police. “The first challenge was managing the sheer volume of security protocols needed for such a high-profile event, particularly given that the Summit was hosted in two locations. This meant that safety measures were required for different venues, as well as for each of the world leaders, as they traveled back and forth. The second was giving visibility to our security partners around the world, especially as the pandemic limited the ability for teams to travel to the site in the run-up to the event.”
Goldsmith and his team used MapInfo Pro to generate 2D gridded map books of the venues and enriched them with points of interest (POI) data, such as footbridges, cell masts, bus stops, and officer and partner locations. The team used aerial drone footage to build out an initial 3D model using capabilities provided by third-party providers. This was further augmented with 360-degree visualizations, using video footage that was captured by scanning more than 140,000 square meters of the Summit venues.
The resulting digital twin enabled Devon and Cornwall Police and their partners to anticipate security issues and create contingency plans using virtual reality headsets to remotely access locations during the planning phase. This removed the need to have more individuals on the ground than necessary in the run-up to the event, while still enabling highly accurate contingency planning to take place.
The G7 Summit went off without a security hitch, with GIS technology widely credited as being central to its success.
Spirent Communications announced that the Spirent GSS7000 GNSS simulator has been integrated into Microwave Vision Group (MVG) over-the-air (OTA) and passive antenna test systems.
MVG, an antenna measurement solutions company, enables the characterization and evaluation of antennas for testing wireless connectivity, reliability, and standards compliance. MVG near-field test systems perform fast and accurate measurements for OTA tests of antennas designed for satellite communications and other GNSS-enabled products, systems, and networks.
As connectivity in industries such as automotive, aviation and military becomes ever more sophisticated, the need to ensure that all the pieces of technology work together in the way they should increases. The integration of Spirent into MVG test systems enables R&D engineers to incorporate the antenna and the vehicle in a test environment that represents the real-world signal environment as closely as possible while maintaining full control and repeatability.
“Our integration into MVG over-the-air test systems, such as the multi-probe SG24 or StarLab, delivers a cutting-edge testing solution, helping to accelerate the development of next-generation products and systems,” says Adam Price, VP of PNT Simulation at Spirent.
Photo: Bill Oxford / iStock / Getty Images Plus / Getty Images
TCI International, a CommTech company, announced Spectrum Surveyor, a graphical interface solution that enables radio frequency regulators to proactively monitor and manage sensors, mobile, fixed and transportable stations across their networks. The software helps regulators solve today’s spectrum management and scarcity challenges. Spectrum Surveyor is already being used by regulators in Europe.
Spectrum Surveyor helps regulators determine who is transmitting on 5G frequencies before establishing a transmission. It identifies ‘white spaces’ by conducting long-term monitoring campaigns, observation, and investigation into any existing gaps. The software enables those already operating in the 5G space to monitor more efficiently and with fewer resources, increasing the utilization of the existing monitoring network.
The new software addresses the evolving digital landscape, delivering automated and centralized monitoring of the spectrum and collecting real-time data on spectrum intelligence in the form of 3D visualizations. Spectrum Surveyor also allows teams to automate routine tasks among groups of monitoring stations, and subsequently produce reports of the spectrum’s activity, immediately flagging any issues within the network.
“In recent years with 5G adding complexity, regulators have experienced a significant increase in the number of stations needed to monitor the spectrum and the progressive intricacy of the digital landscape,” said Ann Bustamante, vice president of Business Development, Spectrum Monitoring Services (SMS) TCI. “This has led to additional considerations in the monitoring and reporting process, such as the need to centralize and simplify network control and data collection to be able to quickly identify the precise moment and location of a problem and to address it.”
Hexagon’s Safety, Infrastructure & Geospatial division announced the addition of artificial intelligence to HxGN Connect, Hexagon’s real-time incident center as a service solution.
HxGN Connect provides crime and operations centers with real-time views of different data sources, collaboration channels to coordinate across teams and the ability to add new participants and channels as needed. The AI capabilities autonomously analyze diverse data types from incidents, assets, cameras, units, alarms and more, issuing proactive notifications and alerts based on observed trends and deviations.
Having access to diverse information and intelligence in real-time enables police, emergency management, transportation and other organizations to evaluate a situation and deploy resources faster, while continuing to coordinate and dynamically respond as situations change.
“Some organizations operate in silos, without access to data or the ability to act on it,” said Kalyn Sims, Chief Technology Officer, Safety & Security, Hexagon’s Safety, Infrastructure & Geospatial division. “[HxGN Connect] breaks down silos within departments and across jurisdictions, and it mines data in real-time to deliver insights. The result is quicker and better responses to incidents and emergencies.”
Swift Navigation, a San Francisco-based GNSS tech firm, announced that it has completed $100 million in Series D Round financing. The financing round was led by SK Inc. and Potentum Partners with strong support from Swift’s existing investors. Swift’s technology powers several of the largest automotive and commercial vehicle fleets on the road today, supporting enhanced navigation and ADAS.
New investors include FM Capital, OVN Capital, TELUS Ventures, TWM Venture Co., Buckley Ventures, Schox Venture Capital and additional independent investors.
“We are delighted to be the lead investor for this financing transaction as part of our investment strategy in high-tech software companies,” said Subeom Lee of SK Inc. “We believe that Swift will contribute to advancing the new era of driverless technology.”
David Simons, founding partner of Potentum Partners, stated, “Centimeter-level position accuracy on a continent-wide scale is impressive enough, but what really excites us is Swift’s ability to provide it with extraordinary reliability, putting absolute-position data at the core of safety-critical features in automotive, automation and machine control,”
Since its Series C Round of financing, Swift has refined its global, centimeter-accurate precise positioning service and expanded its coverage across continents to meet the needs of an on-demand economy requiring higher levels of autonomy. Swift’s customers span the globe and include automotive OEMs and Tier 1s, last-mile delivery providers, mobile handset and application providers and those building rail, industrial machine control and IoT platforms for mass-market applications.
“We have an amazing group of investors behind us and are honored to see the many customers who are using Swift technology at such incredible scale as they build the future of transportation and automation,” says Swift CEO Timothy Harris. “[We thank] our loyal partners and investors at NEA, Eclipse and EPIQ and […] welcome the support of our new investors to help us deliver precise positioning across the world.”
Mosaic, a geospatial imaging company, announced that its new Mosaic X high-resolution, spherical camera is now compatible with RIEGL’s mobile mapping systems.
The development of the Mosaic X focused on delivering a high-resolution, global-shutter, 360-degree camera with precise GNSS time stamping to achieve extreme visual clarity and accuracy at once. These qualities fit the requirements to be integrated with mobile laser scanning systems such as the RIEGL VMX, VMQ and VMY series.
Mobile mapping has uses across many industries and sectors, including private and public organizations. The two most consistent demands when mapping infrastructures are high-resolution, photo-realistic imagery and highly accurate data. Cameras such as the Mosaic 51 and Mosaic X capture road infrastructure with photo-realistic accuracy, which is more understandable to the human eye than a point cloud from a laser scanner.
“The pairing between 360-degree imaging systems and mobile laser scanning systems results in high precision LiDAR-based point clouds, colorized by photo-realistic images,” says Mosaic co-founder and VP of engineering, Rostislav Lisovy. “This outcome will then have the benefit of both a precise point cloud and panoramic images – for precise measurements and evaluation of textures.”
The push for sensor integration came from the customers, Mosaic CEO and co-founder Jeffrey Martin states. “We have had many requests from our customers who are looking to use RIEGL and Mosaic products in unison. The Mosaic X impresses with high-resolution panorama images and offers precisely time-stamped single-lens imagery for the purpose of point cloud coloring as well as the generation of undistorted, geo-referenced high-resolution imagery with 12 [megapixels] per lens.”
Trimble has announced Project MEP, a construction management solution that provides visibility into mechanical, electrical and plumbing (MEP) workflows including estimating, change management, project management, detailing and fabrication. Project MEP allows for greater efficiency, collaboration and visibility across projects in the electrical, mechanical, HVAC and plumbing contractors fields.
Project MEP manages drawings, documents, budgets and field productivity while extending construction management workflows with a suite of capabilities including estimating, submittal management and fabrication collaboration. The solution also provides project managers with the tools to identify issues faster, reduce rework and deliver more profitable projects. Project MEP is available as part of Trimble’s cloud-based construction management platform, Trimble Construction One.
“MEP project managers are closely involved with every detail of a project from bid to closeout, but in today’s construction environment the data they need isn’t always readily available,” said Lawrence Smith, vice president of Trimble Construction Management Solutions. “With Project MEP, Trimble is breaking down information silos … while also providing the tools project managers need to run a job more efficiently. Now MEP contractors have a construction management solution that gives them the big picture of project health and the ability to track details such as the status of a spool.”
Project MEP addresses MEP workflows including bid turnover, model collaboration, submittal management, design to fabrication, model-based estimating and field-to-office.
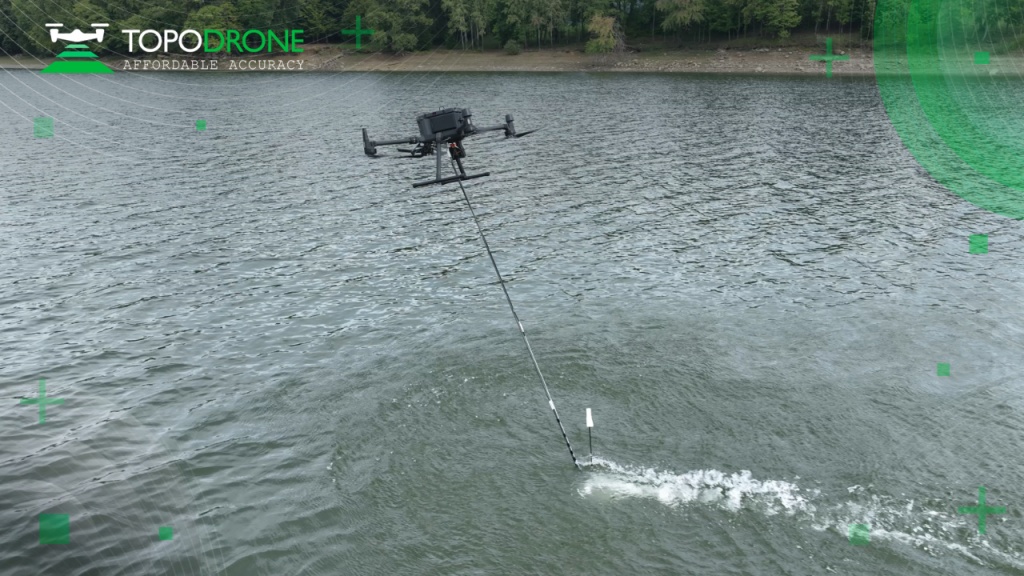
TOPODRONE, a Swiss-based designer and manufacturer of high-precision lidar equipment for installation on drones, vehicles and backpacks, launched AQUAMAPPER, a UAV-based solution for bathymetric surveying and marine construction.
AQUAMAPPER contributes to a complete set of photogrammetry, lidar and bathymetry surveying solutions from TOPODRONE. The product, compatible with the DJI Matrice 300 RTK, provides a combination of high-speed efficiency (up to 14 km/h) and accuracy mounted on a UAV. The application areas include an open sea bathymetric survey up to 100m depth, quantity survey and calculation of sediments and periodic maintenance survey of storage pools.
Photo: TOPODRONE
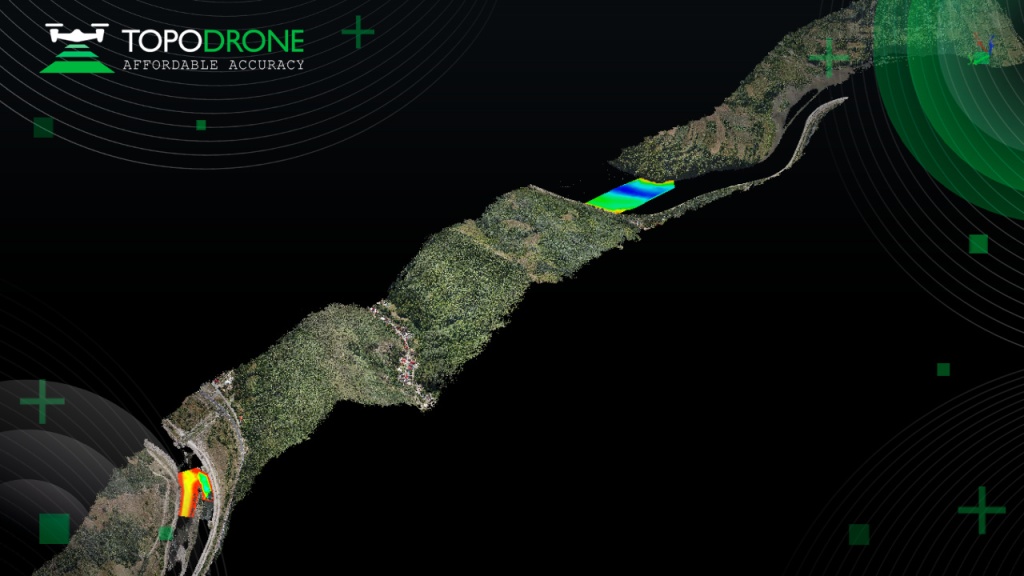
The new data-collecting device has been successfully used alongside TOPODRONE’s LiDAR ULTRA equipment for airborne surveying at a highway construction project in one of the toughest terrains in Romania, EU, including 7 tunnels, 24 bridges and 18 viaducts. The project was performed by the Romanian company GRAPHEIN TOPO SA to deliver a full digital twin of a studied area.
Photo: TOPODRONE
The TOPODRONE LiDAR ULTRA on board a DJI M300 drone was used to capture laser scanning data from an altitude of 100 m to 120 m over rugged terrain forest area to cover a corridor 32 km long and 400 meters wide in 14 flights while AQUAMAPPER connected to the same DJI M300 drone performed a bathymetric survey over six river crossings.
“The key advantage of the new bathymetric equipment from TOPODRONE is the ability to capture a riverbed with centimeter-level accuracy with high speed in fully automatic mode and without using any boat,” said Andrei Sueran of GRAPHIEN TOPO SA. “The combination of an echosounder, GNSS and inertial measurement system helps to get accurate results after data post-processing.”
[SPONSORED CONTENT] GPS jamming has become the #1 threat to defense and commercial drones. Therefore we developed GPSdome: a GPS protection solution tailored for defending drones and vehicles from jamming attacks. GPSdome provides a robust cyber shield, allowing the protected platform to safely and continuously operate and complete missions in a GPS-challenged environment. At its minimal size weight and power, there is no other solution that offers such protection as small, light, affordable or as easily installed as GPSdome.
My previous column highlighted that orthometric heights in NAPGD2022 will be defined through ellipsoid heights and a geoid model, such as GEOID2022. Therefore, changes in the geoid model will be very important to users estimating orthometric heights using GNSS. I briefly described the geophysical reasons for changes in the geoid that affect the orthometric height of a mark.
For the past four years, I have discussed in my columns the tasks associated with the new, modernized 2022 reference frames. It’s now the middle of 2022, so where are the new reference frames? Well, on June 9, Dru Smith, NSRS modernization manager for the National Geodetic Survey (NGS), provided an update on the status of the modernization in a webinar. The Powerpoint slides and video of the presentation can be downloaded from the NGS website under the following title: It’s 2022…Are You Done Yet? I will highlight some of the items from the webinar, but I encourage everyone to download the video and listen to the webinar.
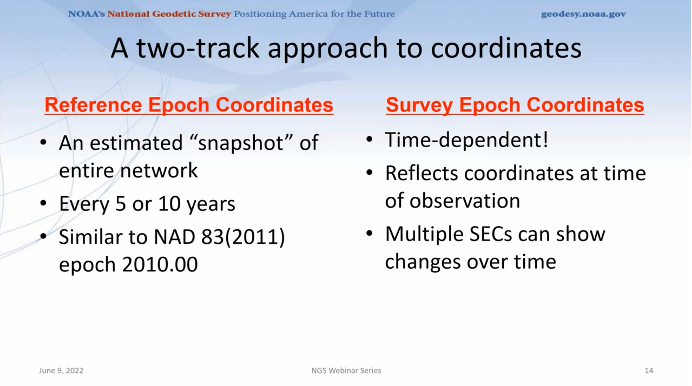
First, Smith mentioned that NGS will be providing new types of coordinates. The NGS denotes this as a two-track approach to coordinates: Reference Epoch Coordinates (REC) and Survey Epoch Coordinates (SEC). See the box below.
New types of coordinates (Image: NGS June 6 webinar)
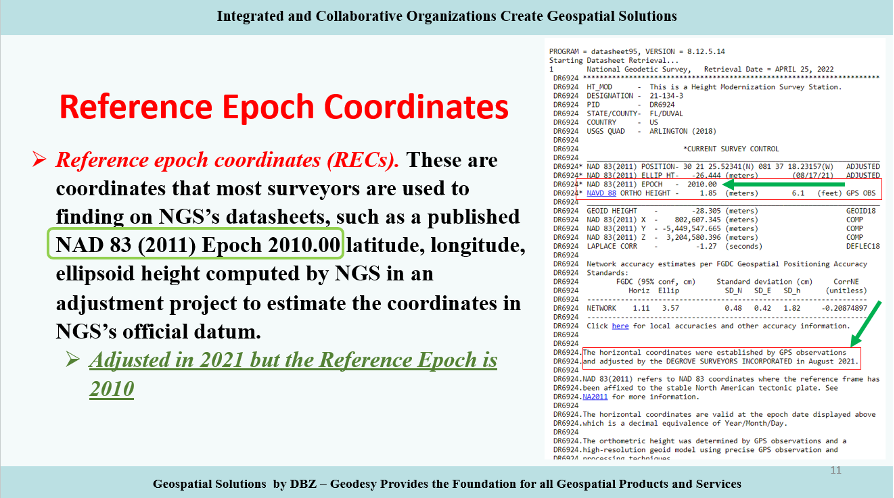
Reference Epochs Coordinates (REC) are defined in NGS Blueprint for the Modernized NSRS, Part 3 as coordinates computed by NGS in an adjustment project to estimate the coordinates at one of the official reference epochs that NGS will define in 2025. RECs are similar to coordinates computed by NGS in a nationwide adjustment project such as the National Adjustment of 2011 (see the box below).
NAD 83 (2011) epoch 2010.00 coordinates (Image: NGS)
NGS has not determined what data will be included in the first iteration of RECs. For the 2020.00 project, the current cutoff date for incorporating data is Dec. 31. Users can submit the data to NGS via OPUS projects and the OPUS-Share tool. To increase the submission of GNSS observations on marks, NGS has developed a beta OPUS-Projects 5.0 webtool that will allow real-time kinematic and real time network (RTK/RTN) observations to be submitted.
As previously mentioned, at this time, the NGS has not determined the cutoff for the earliest data to be included in the determination of the 2020.00 RECs. The agency will be conducting experiments to determine the appropriate cutoff date. These coordinates will require an intra-frame velocity model (IFVM) to generate the RECs at the specific reference epoch.
As of February 2021, based on NGS’ Blueprint for the Modernized NSRS, Part 3, version February 2021, the following is the agency’s policy with regard to RECs:
For a given mark and a given reference epoch, the REC will never be changed–except to correct a blunder.
This does not prevent NGS from adding new RECs
on points with new data that have not yet had an REC computed
for marks that do not have an REC in the most recently passed reference epoch, a new REC can be computed and added to the NSRS.
Survey epoch coordinates (SECs) are defined as coordinates computed by NGS at a specific survey epoch. Users will submit their data and its metadata to NGS, and NGS will then check, adjust and define the coordinates at one “survey epoch.” These coordinates will be “part of the NSRS,” Smith said. NGS is computing coordinates in this manner to provide the best estimate of the coordinates at any mark at a specific moment in time, which is very important in areas influenced by crustal movement.
So, how will NGS process and generate these SECs?
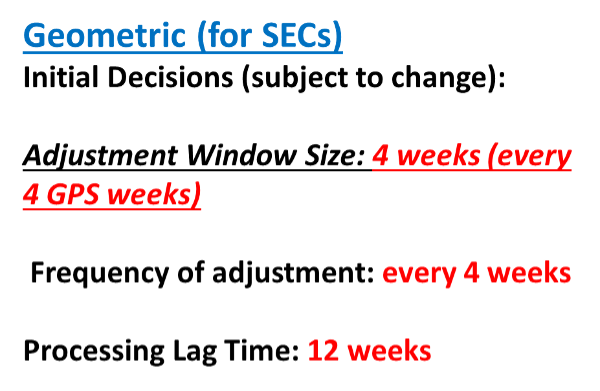
Survey epoch coordinates (SECs) are designed to provide time-dependent geodetic coordinates. Therefore, NGS has to choose some time span in which all observations will be processed together to yield a single SEC of a mark. NGS denotes this time span as a “geometric adjustment window.” NGS wants the adjustment window to be short enough so that movement of a mark did not occur between repeat observations (or was small enough to be ignored) and long enough for users to efficiently and effectively collect redundant observations for submission to NGS (see the box below).
One or more GNSS occupation(s) over a single mark will be processed into one survey epoch coordinate when all occupations take place within one geometric adjustment window.
If a user submits two occupations on one mark, but they happen to fall in two consecutive geometric adjustment windows, NGS will use them to create two distinct survey epoch coordinates. Each SEC will be based on one occupation.
Future columns will provide more explanation about this concept of a geometric adjustment window and how NGS will process the data to generate survey epoch coordinates.
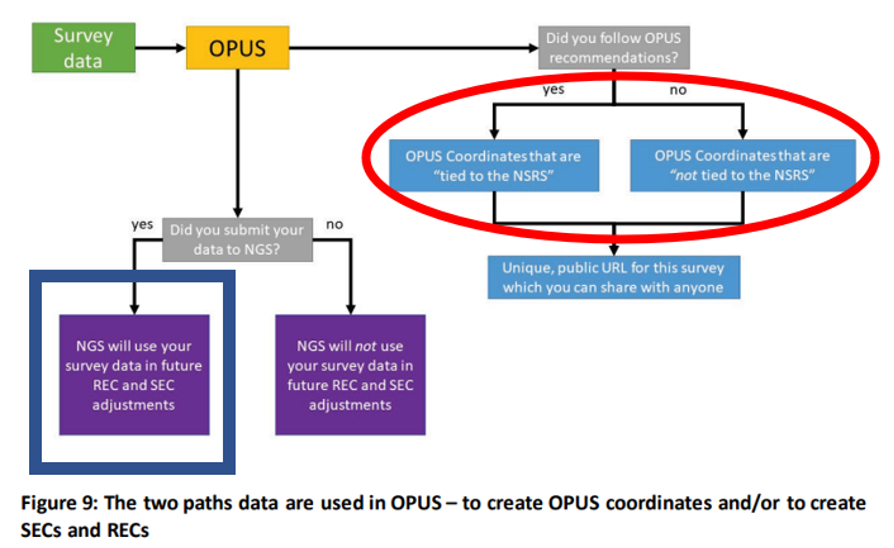
NGS is developing models and tools for users to submit data to NGS to compute coordinates — including OPUS coordinates, reference epoch coordinates and survey epoch coordinates. Figure 9 from Blueprint for the Modernized NSRS, Part 3, version February 2021, is a schematic that shows the flexibility NGS is building into an OPUS-type webtool. Basically, if users follow NGS guidelines and rules, and submit their data to NGS, then NGS will compute and publish REC and SEC coordinates (see the blue outline in the box below). If users only want to compute OPUS coordinates, then they can use NGS’s webtool without submitting the data to NGS (see the red outline in the box below).
Building flexibility into OPUS (Image: NGS)
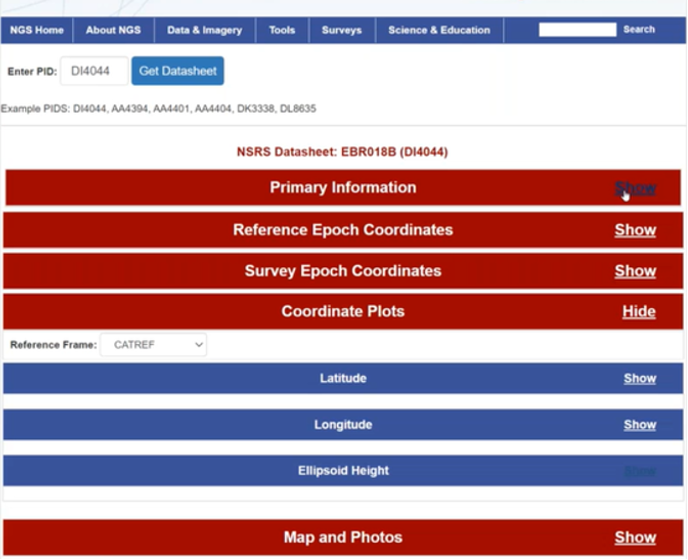
Dru Smith’s June 9 update on the status of the modernization provided a mockup of how users will be able to retrieve data using their web browsers — a prototype is being developed. The data will also be available in downloadable form such as an XML file for users to input the data and metadata into their programs or databases. I recently discussed some of this material at seminars I presented at the Florida Surveyors and Mapping Society’s 67th annual conference held in Palm Beach Gardens. The participants were very interested in the prototype, but really wanted to learn more about the format and process of the downloadable XML files. I’m sure future NGS webinars will address this topic. I emphasized to the group that they should watch the entire presentation and provide feedback to NGS. As mentioned above, Powerpoint slides and video can be downloaded from the NGS webinar website.
The boxes below highlight a few of the options NGS is considering. The box “Data Delivery – Prototype” is an example provided by Smith during his webinar. It should be noted that the images of the prototype are not included in the downable slides, but they are part of the video. The images presented in this column are screen captures from the video.
Data delivery prototype. (Image: NGS)
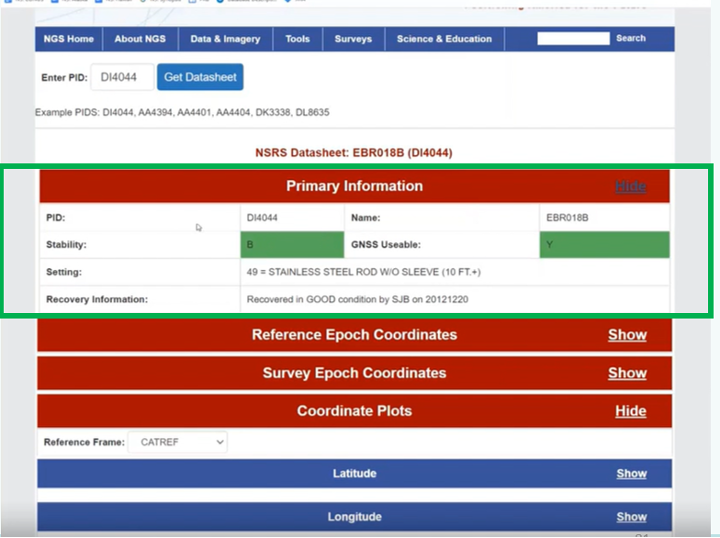
The box below provides some of the basic information of a mark, such as its PID, name, stability, GNSS usable code, setting and the latest recovery information. Again, this is a prototype, so users should feel free to send feedback to NGS. NGS wants to generate a usable product, and is interested in user feedback.
Primary information prototype. (Image: NGS)
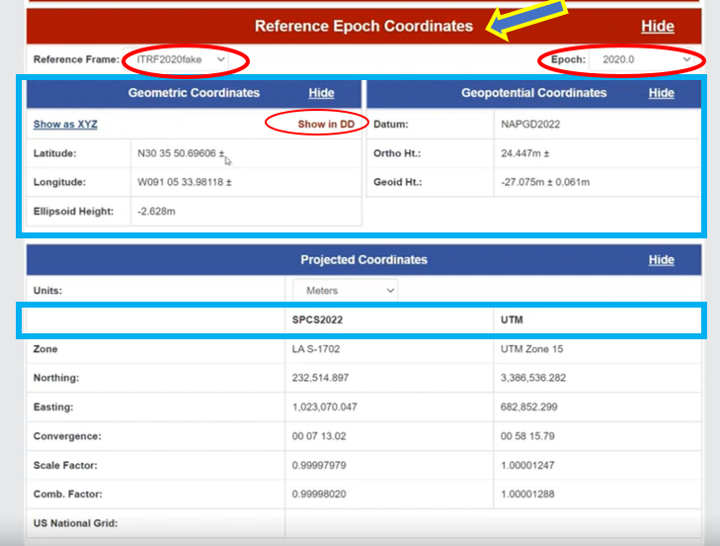
As previously stated, NGS is implementing a two-track approach to coordinates: publishing REC and SEC. The box below provides the REC information of a mark when a user clicks the “Show” button. As shown in the diagram, the reference frame and epoch are provided, as well as the geometric coordinates (latitude, longitude, ellipsoid height) and geopotential coordinate information (NAPGD2022 orthometric height and geoid height).
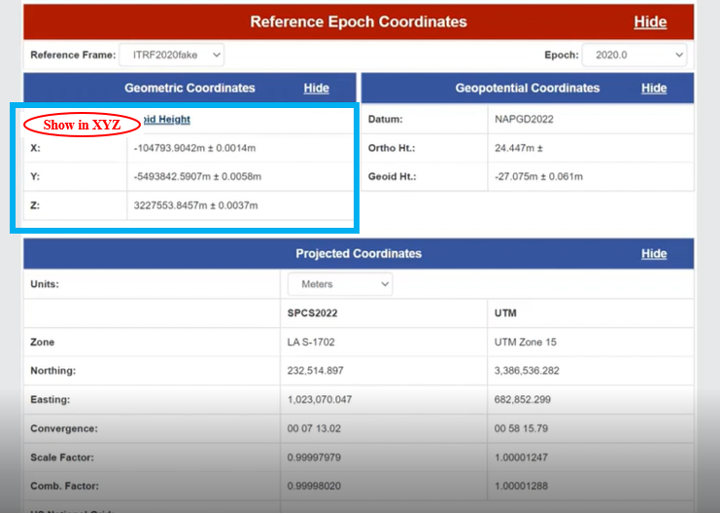
NGS provides an option for individuals who want the geometric coordinates in the X, Y, Z format (see the box below). Remember, this is only a mockup of a prototype, to give us an idea of the direction NGS is going with its data delivery system in the new, modernized 2022 NSRS.
REC Shown in X,Y,Z. (Image: NGS)
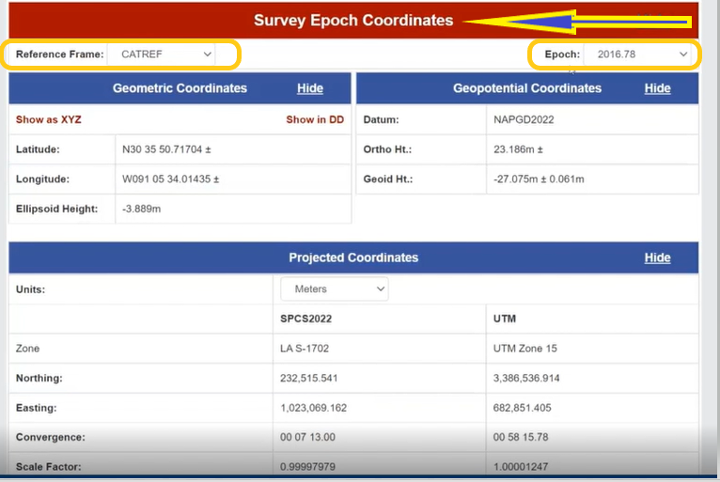
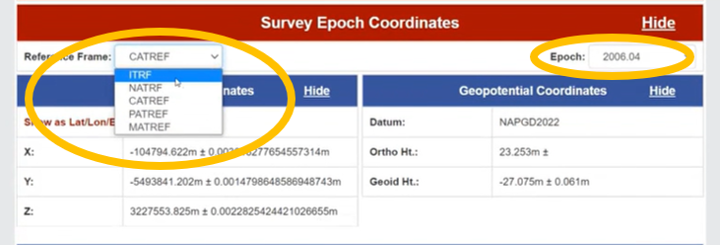
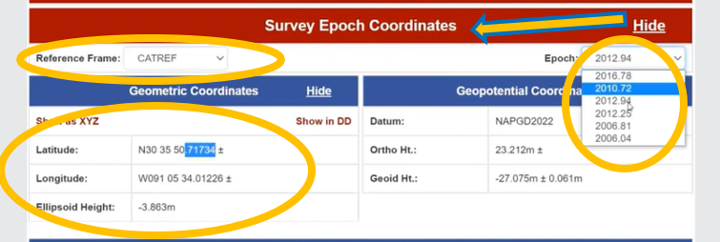
Similar to the REC, the prototype includes SEC. For a mark, the latter are different from the former because SEC are computed at the epoch of the survey observations (see the box below).
The box titled “SEC in CATRF – Prototype” is an example of a mark in the CATRF reference frame and the survey epoch of 2012.94. As indicated in the diagrams, users will be able to select the reference frame (ITRF, NATRF, CATRF, PATRF and MATRF) and the survey epoch.
SEC in CATRF – Prototype
Option to Select Survey EpochOptions to select reference frame (Images: NGS)
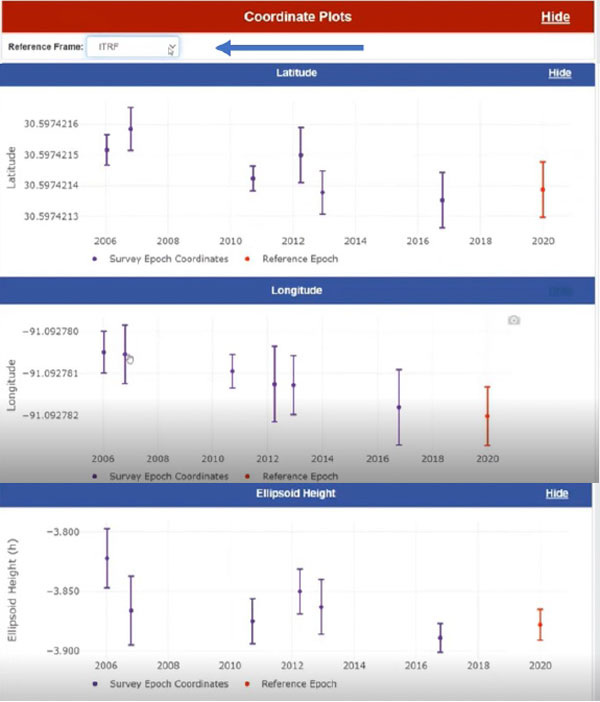
Another feature of the data delivery system is that it provides plots of a mark’s survey epoch coordinate values at different epochs. In the example shown in the box below, the plots provide values of a mark’s latitude, longitude and ellipsoid heights based on each survey epoch data. The user can select various reference frames of the mark to understand the change based on the reference frame.
Coordinate plots in ITRF prototype. (Image: NGS)
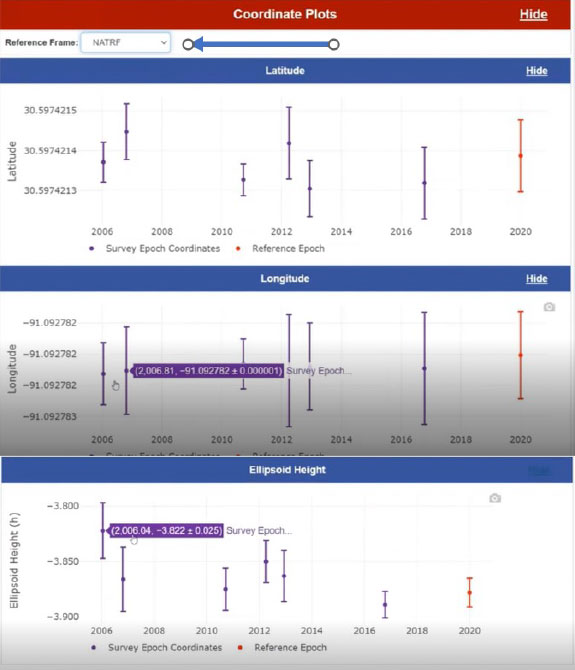
The box below clearly shows a slope in the changes in coordinates based on survey epochs, especially in the longitude. This is the plate rotating in time. You can see the changes in latitude, longitude and ellipsoid height in the NATRF reference frame for the same mark. The latitude and longitude plots do not show a slope because the plate rotation is removed using a model to change from the ITRF reference frame to the NATRF reference frame. That said, the ellipsoid height plots look the same because the rotation model does not change the ellipsoid height.
Coordinate plots in NATRF prototype. (Image: NGS)
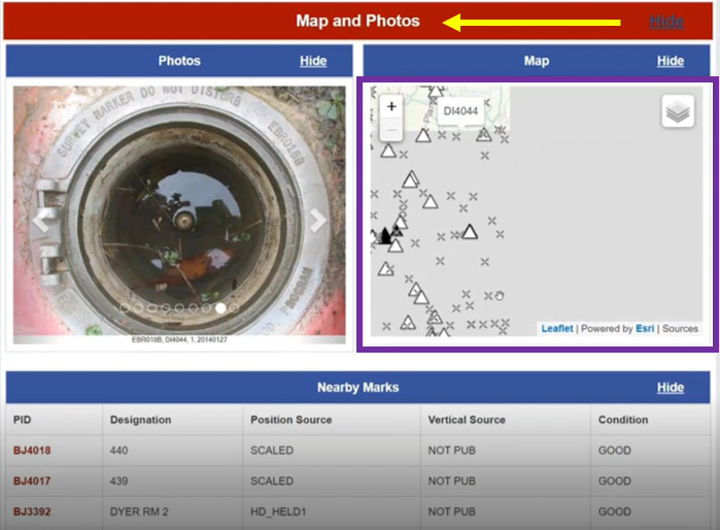
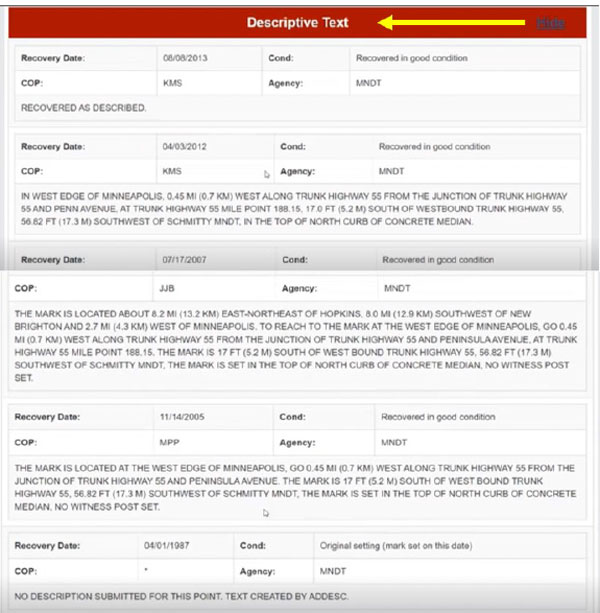
The prototype also provides maps, photos and descriptive text of the mark.
Map and photos of a mark in the prototype. (Image: NGS)Descriptive text prototype (Image: NGS)
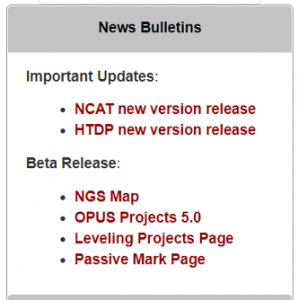
Some of this data delivery output may seem familiar to users who have used the NGS beta routines (see the box below).
Beta Routines
Beta routines (Image: NGS)
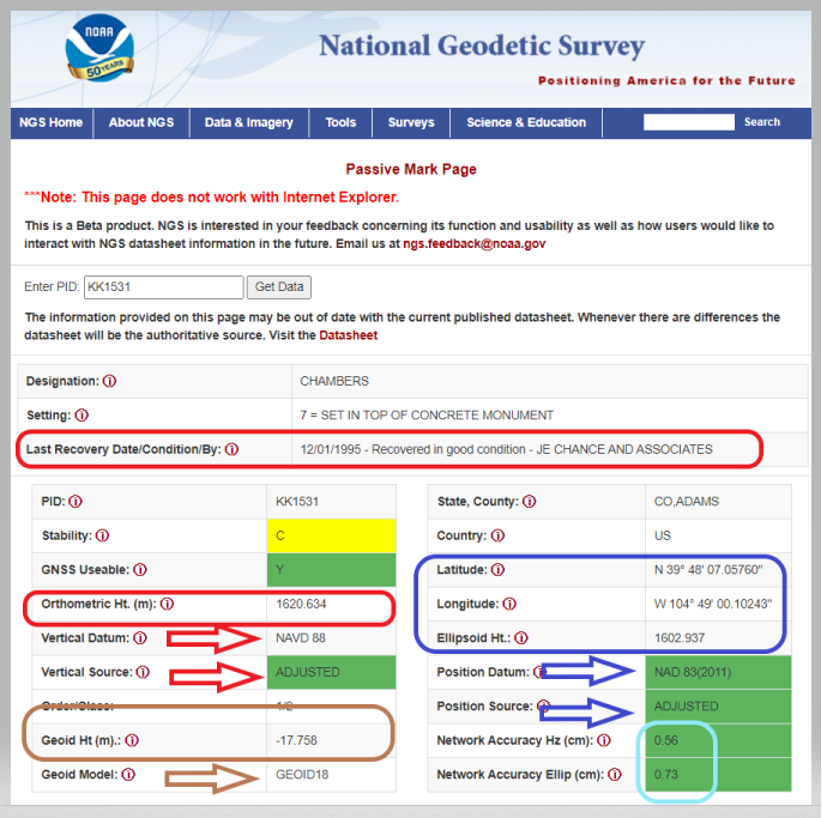
For example, the Passive Mark Page Webtool provides the coordinate information for a mark. My October 2020 column described the tool is detail. See below for an example of the passive mark tool.
Beta Passive Mark of KK1531 (Image: NGS)
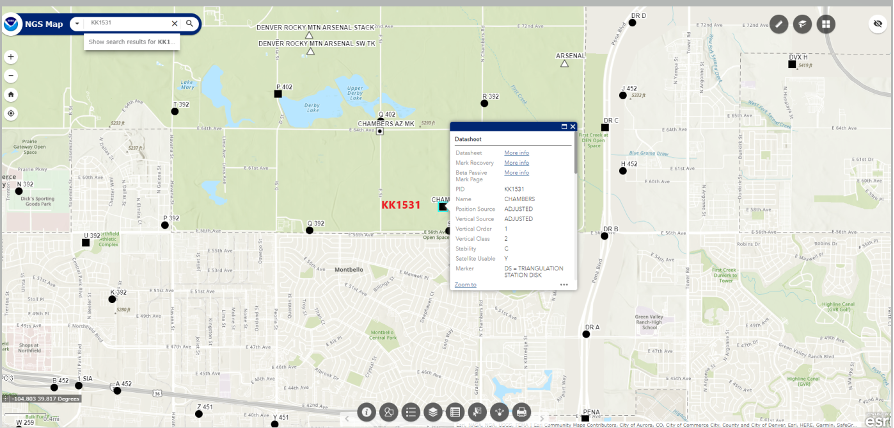
The NGS Beta Map routine enables users to link to NGS datasheets, the passive mark tool and mark recovery, as well as connect to OPUS Shared Solutions and the NOAA CORS Network. See below for an example. It also provides a measuring tool, multiple basemaps and the ability to export data. My December 2021 column described the NGS Beta Map in detail.
Example of NGS Beta Map Routine for KK1531 (Image: National Geodetic Survey)
Only three years remain before the release of the new, modernized NSRS. I encourage everyone to try all of the beta products, and download Dru Smith’s June 6 webinar for a better understanding of the agency’s current thoughts on how it will provide data to users in the new, modernized NSRS. As for all the NGS beta products, the agency would like users to try the tools and provide feedback on what they liked and what they didn’t like, as well as any additional information you need or would like to see. The NGS is trying to develop tools useful to everyone, but that won’t be possible unless they hear from users.
The following statement on NGS beta products explains how to provide feedback and why it is important:
“This is a beta product. NGS is interested in your feedback concerning its function and usability as well as how users would like to interact with NGS datasheet information in the future. Email us at [email protected].”
[SPONSORED CONTENT] It’s time to enable advanced action in any environment.
Our autonomy-ready solutions enable greater safety, productivity and efficiency. With interoperable, cross-industry capabilities built to meet your toughest challenges head-on, we’ll meet you where you are—to take you where you’re going. Leverage our decades of intelligence and experience to reach your autonomous potential.