The IAG International Symposium on Reference Frames for Applications in Geosciences (REFAG 2022), which is organized by the Aristotle University of Thessaloniki under the scientific coordination of Commission 1 of the International Association of Geodesy, will be held in Thessaloniki, Greece on October 17-20.
REFAG 2022 aims to address today’s theoretical concepts of reference systems and their practical implementation by space geodetic techniques and their combinations, underlying limiting factors, systematic errors and novel approaches for future improvements. The symposium welcomes contributions in all aspects of geodetic reference frames and their applications in Earth science studies, satellite navigation, and also other key areas of geomatics and geospatial information systems.
The scientific program of the symposium covers all topics related to the activities of IAG Commission 1 and its subgroups, including also other initiatives and projects which endorse the role of geodetic reference frames towards scientific exploration, sustainable development, land administration, disaster risk reduction and climate monitoring.
The deadline for abstract submissions for the symposium will be until July 20. Accepted abstracts will be notified by e-mail to the corresponding author by July 30. The submission form and submission information can be found at https://www.refag2022.org/abstract-submission/abstract-general-information/.
Early bird registration is available for REFAG 2022 until July 25. Registration information can be found here.
Space Tech Expo Europe has opened its call for speakers for the free-to-attend conference to be held Nov. 15-17 in Bremen, Germany.
The conference will focus on the latest advancements in the European and global space industry, including space exploration, in-space manufacturing, launch, system development, market trends and more.
The conference will take place alongside the leading supplier trade show with hundreds of exhibitors showcasing the latest space technological advancements. The conference provides attendees with the knowledge on the latest developments in European space. Previous speaking companies include: OHB, NASA, ArianeGroup, Airbus Defence and Space, UK Space Agency, ESA and many more.
Proposals for speakers will be accepted through April 11, 2022. To submit a proposal or learn more about the event, please visit the Space Tech Expo Europe website.
ION is now accepting abstracts for the co-located 2023 International Technical Meeting (ITM) and Precise Time and Time Interval (PTTI) Systems and Applications Meeting. The co-located conferences will take place January 23-26, 2023 at the Hyatt Regency Long Beach, in Long Beach, California.
ION strongly encourages authors to present in-person in Long Beach. Authors will be given the option at the point of abstract submission to submit for “in-person presentation with video presentation for remote viewers” or “virtual presentation only.”
The Precise Time and Time Interval Systems and Applications (PTTI) meeting is an annual conference sponsored by ION with a technical program designed to disseminate and coordinate PTTI information at the user level, review present and future PTTI requirements, inform government and industry engineers, technicians, and managers of precise time and frequency technology and its problems, and provide an opportunity for an active exchange of new technology associated with PTTI.
ION’s winter meeting, the International Technical Meeting (ITM), is a more intimate conference with a technical program related to positioning, navigation and timing and includes the ION Fellows and Annual Awards presentations.
The INTERGEO Expo & Conference focuses on innovations for a smarter world. INTERGEO 2022 will take place October 18-20 in Essen, Germany.
Topics including the importance of geoinformation for internal security, monitoring for disaster control and prevention, open data, digital twins alongside their use in construction and housing, mobility, sustainability and climate change, BIM and engineering applications with UAV, laser scanning and monitoring will be discussed during the 2022 event.
Additionally, the outdoor area of Messe Essen will show live demonstrations of the latest UAV applications in surveying, agriculture, construction, security and many more.
According to INTERGEO organizers, 300 international companies are already registered at the Expo, from innovative young start-ups to international key players such as Autodesk, Esri Inc., Hexagon, Trimble, Topcon and many more. The organizers expect around 500 exhibitors by October.
“All the international key players in the industry will be there.There was no doubt about it – they all want to get back to their customers, to visitors, to the live atmosphere and the power of meetings”, says Prof. Dr-Ing. Hansjörg Kutterer, President of the organiser DVW e.V., Association for Geodesy, Geoinformation and Land Management.
For those who are unable to attend the event in Germany, there will be some opportunities to participate in the Expo remotely.
Up close and personal
Digital Twins will receive their big break at the Conference 2022. Their use in building information modeling, smart planning and construction as well as mobility will be the focus of the event. Digital twins will be used to further development of urban data platforms in the context of smart cities and their variety of applications, as well as the use of smart city solutions in terms of innovation and sustainability and a basis for predictions and scenarios in the event of disasters.
The main topics in 2022 are Digital Twins and their value creation, 4D geodata and Geospatial IoT, potentials of remote sensing, BIM 4.0, industrial surveying, measurement systems and robotics, smart cities and mobility in the context of climate change and sustainability, mobile mapping, web services and GeoIT in disaster relief, spatial reference and positioning, earth observation and Galileo.
Hansjörg Kutterer points out the high innovative power of the industry: “We are experiencing high dynamics in segments such as mobility, environment and sustainability, climate protection and urbanization. Geo-IT has positioned itself as a solution provider for these topics. Problem-solving without Geo-IT is unthinkable in these subject areas. Come to Essen on the 18th to 20th of October and visit Intergeo Expo and Conference.”
How to attend
Tickets for INTERGEO are now available. An early-bird registration rate is available until August 31. Tickets can be found at https://www.intergeo.de/en/tickets.
Registration for new exhibitors is open as well. All information, such as application procedures and funding amounts, can be found on the INTERGEO website at www.intergeo.de/en/.
The 6th Unmanned and Autonomous Systems for Utilities & Energy Conference will take place in Atlanta, GA on June 8-9, 2022.
The event aims to provide a platform for UAS professionals to gain insight from industry peers and regulatory bodies on best practices in pilot training, safety in inspections, data management and security, updates on Part 107, new UAS technologies, and other key issues for utilities.
The conference also includes discussions on alternatives to foreign-made drones, BVLOS waivers and use cases, a closer look at LiDAR and AI, and building and refining drone programs to boost efficiency and reliability. Attendees will learn how they can navigate through industry challenges by leveraging emerging technologies and improving existing strategies to boost operational success.
Join the event to learn how you can navigate through industry challenges by leveraging emerging technologies and improving existing strategies to boost operational success.
Those who are unable to attend in person have the option to attend virtually. The Live+ content platform will give you access to all the presentations and is loaded with features to ensure full participation.
AUVSI members are entitled to a discount on full price conference fees (not valid for solution providers).
For registration information, cost and any discounts that may apply please contact:
Ria Kiayia
Digital Media & PR Marketing Executive [email protected]
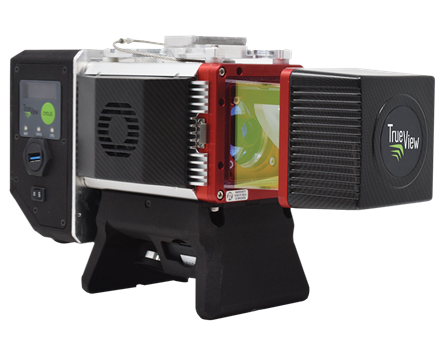
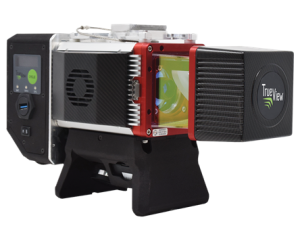
GeoCue, a U.S. LiDAR data technology company, has announced its latest True View 3D Imaging Systems (3DIS) product, the True View 645/650. Combined with GeoCue’s integrated data processing software suite, True View EVO, all GeoCue 3DIS products include the full post-processing software workflow, including direct integration with Applanix POSPac.
The survey-grade True View EVO supports the direct creation of many standard project deliverables including ground classified point clouds, surface models, contours, Digital Elevation Models (DEMs), volumetric analysis, wire extraction and similar products without the need for additional third-party software.
According to GeoCue CEO Frank Darmayan, the newest True View 645/650 includes a Riegl mini VUX3-UAV laser scanner and dual mapping cameras. This system delivers colorized LIDAR deliverables with accuracy better than 3cm RMSE for the True View 645, and better than 2cm for the True View 650.
The mini VUX-3UAV, a 360° rotating mirror scanner, increases the scanner frequency to 300 kHz and offers a unique mode where the 200,000 pulse per second scan rate is focused in a 120° cross-track field of view, providing significantly increased point densities in aerial mapping applications.
Machine control (MC) is widely used in construction to accurately position earthwork machinery based on 3D design models and GNSS receivers. From self-driving trucks to diggers that can automatically grade, MC hardware and software determine a machine’s current position on Earth and compare it with the desired design surface. MC increases productivity on construction job sites, facilitates tracking work performed, and automates field data collection — including real-time cut, fill, volume and compaction data. In the following articles, we showcase the machine control success stories of five companies.
My February column explained why it is important to account for horizontal movement of marks everywhere, and not just in areas influenced by active crustal movement due to earthquakes such as Southern California.
It provided information about the NOAA CORS Network (NCN) rates of movement based on International Reference Frame of 2014 (ITRF2014) coordinates and horizontal velocity information. It highlighted reports from the National Geodetic Survey (NGS) that describe models that will facilitate users transferring coordinates between reference frames and dealing with intra-frame movement between marks based on surveys performed at different epochs.
NAPGD2022 orthometric heights will primarily be accessed through GNSS technology.
As I stated in my February column, this is not just a horizontal positioning issue. In this month’s column, I address estimates of vertical movement that will have to be accounted for in the new, modernized National Spatial Reference System (NSRS).
NAPGD2022 will provide gridded models for North America (that includes CONUS, Alaska, Hawaii, the Caribbean, Canada, Mexico, Central America and Greenland), American Samoa and Guam/Commonwealth of Northern Mariana Islands (CNMI). My previous columns have described the NAPGD2022 in detail. The revised NOS NGS 64 report mentioned that NAPGD2022 will be built upon ITRF2020. It states that NAPGD2022 will operate equally well in any of the four new terrestrial reference frames developed as part of the new, modernized NSRS in 2022.
As I stated in previous columns, orthometric heights in NAPGD2022 will be defined through GNSS ellipsoid heights and GEOID2022. This means NAPGD2022 orthometric heights will primarily be accessed through GNSS technology. GEOID2022 will be defined in a manner that best fits global mean sea level at the epoch of NAPGD2022.
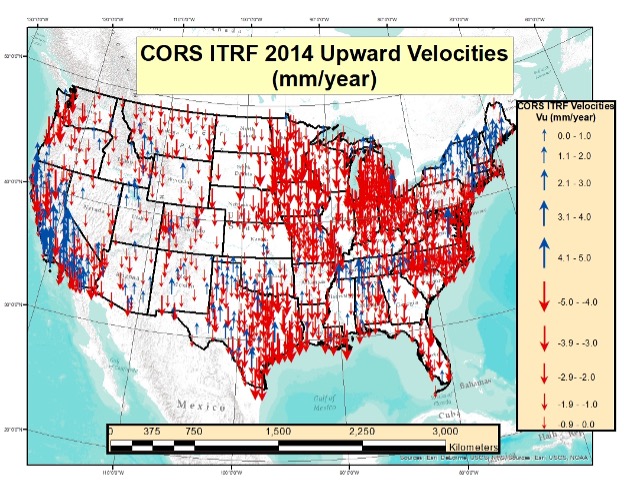
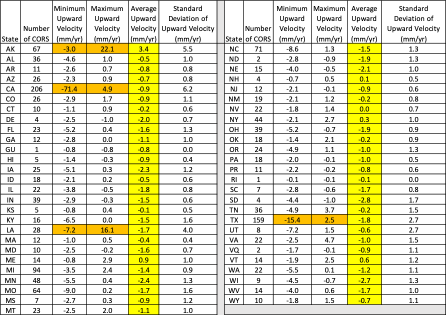
As in my previous column, to better visualize the potential size of the vertical movement, I used the CORS ITRF2014 coordinates and velocities from the NGS website to create plots depicting the upward velocity (Vu) values for CORS that are designated as operational and have computed velocities. [Note: I use the term upward because that is how it is reported on the NGS CORS website under the tab labeled “position and velocity.” The term upward velocity means movement in both directions — negative is downward and positive is upward.] The box below shows maximum, minimum, average and standard deviations of upward velocity values for each state and territory of the United States.
Table of ITRF 2014 Upward Velocities of US CORSs
The upward velocity values are not as systematic as the horizontal velocity values, and they are significantly smaller. I have highlighted the average value velocity column. As indicated in the table, the values vary from state to state, but they are all small relative to the horizontal movement values. (See my previous column for plots depicting the horizontal values.)
What is interesting is the range of values in some states. For example, Alaska and California have a very large range — understandable because of the active earthquakes and other movement that occur in these states. Also, Louisiana and Texas have a very large range due to local subsidence.
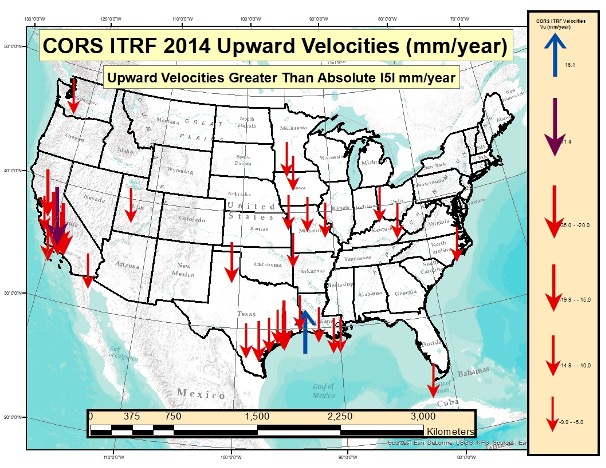
I decided to highlight the values for the conterminous United States (CONUS) in two separate plots. The box “Upward Velocities (Vu) Between +/–5 mm/year in CONUS” depicts upward velocities (Vu) between +/–5 mm/year in CONUS. The box “Upward Velocities Greater than Absolute Values of 5 mm/year in CONUS” depicts upward velocity values greater than +/–5 mm/year.
Upward Velocities (Vu) between +/- 5 mm/year in CONUS
Image: Dave Zilkoski
It’s obvious that most of the vertical movement values are between +/–5 mm/year in CONUS. There are some large values in California, Louisiana and Texas. This is highlighted in both plots.
Upward Velocities (Vu) Greater than Absolute Values of 5 mm/year in CONUS
(Image: Dave Zilkoski)
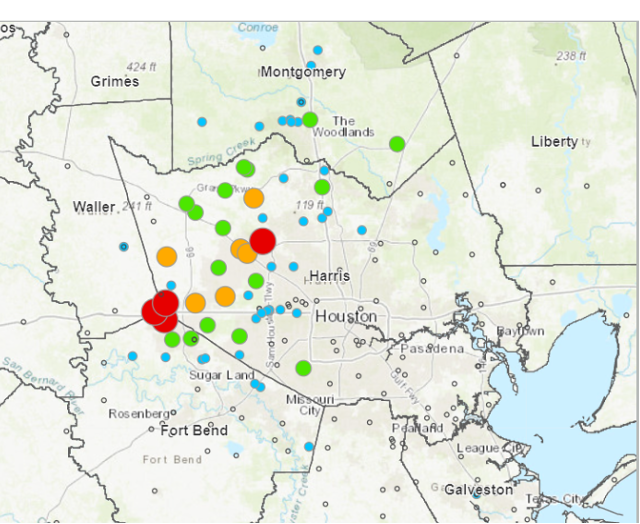
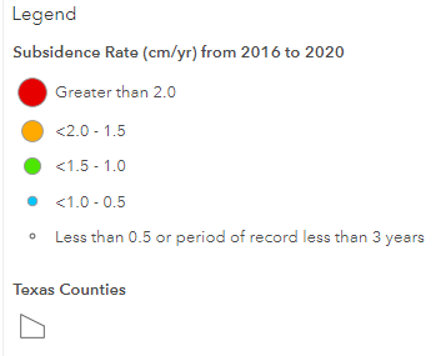
As indicated in the plots, some of the values exceed 10 mm/year. In five years, the heights of marks in these regions could potentially change by 5 cm. An example of the potential subsidence in the Houston-Galveston, Texas, region is depicted in the box below. As indicated in the plot, some marks are subsiding greater than 2 cm/year. That means in five years the marks in that region could have subsided more than 10 centimeters.
Estimate of Subsidence in the Houston-Galveston, Texas, Region
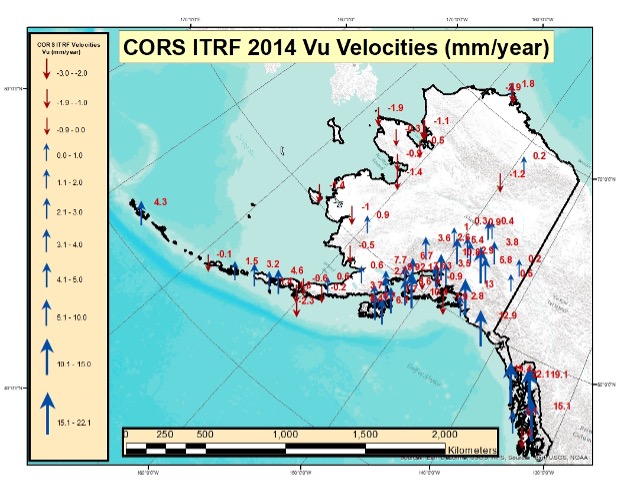
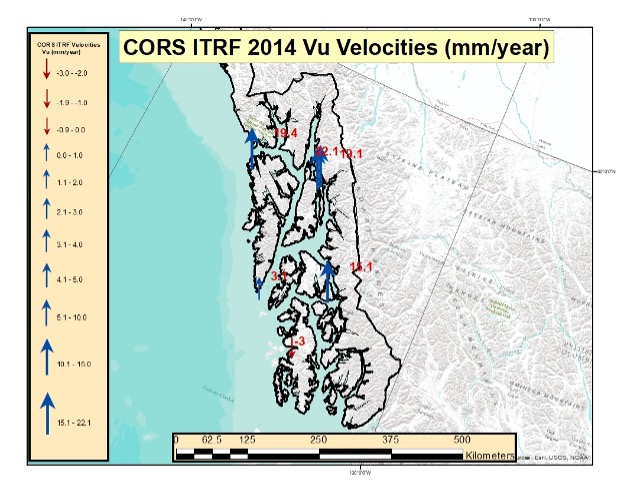
The box below depicts the values in Alaska. Most of these values indicate that the marks are uplifting. Some of these values exceed 10 mm/year. Once again, height coordinates in some regions will potentially change 5 cm in five years. I generated a separate plot for the southeastern region of Alaska. (See the box titled “Upward Velocities (Vu) in Southeastern Alaska.”)
Upward Velocities (Vu) in Alaska [All Values]
Image: Dave Zilkoski
Upward Velocities (Vu) in Southeastern Alaska [All Values]
Image: Dave Zilkoski
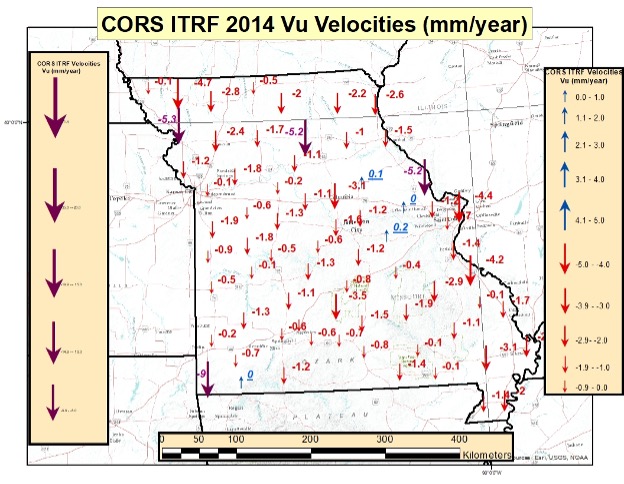
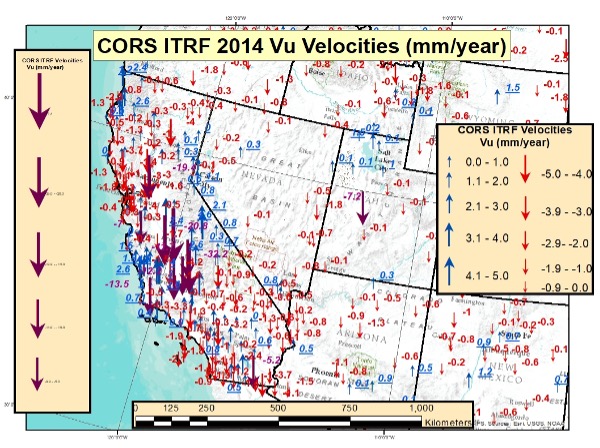
As I did in my previous columns, I prepared several plots that depict the upward velocities in various regions of the United States. See the boxes below for North Carolina, Missouri Southwest U.S. The plots indicate that the magnitude of the vertical movement varies from state to state, as well as within the states.
CORS ITRF 2014 Upward Velocities (Vu) in Missouri [All Values]
Image: Dave Zilkoski
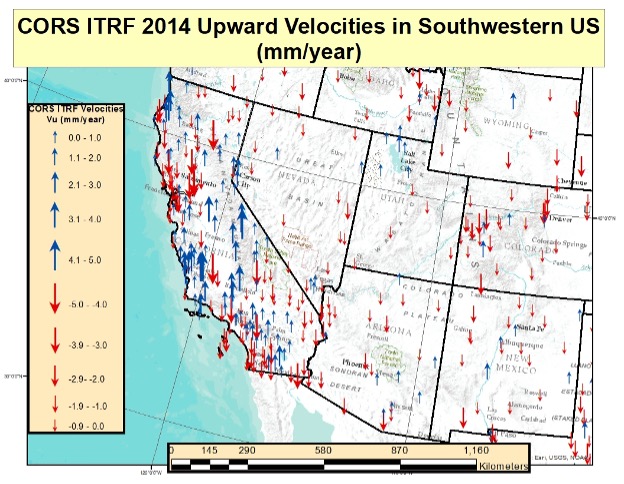
CORS ITRF 2014 Upward Velocities (Vu) in Southwest U.S. [All Values]
Image: Dave Zilkoski
CORS ITRF 2014 Upward Velocities (Vu) in Southwest U.S. [Values Between +/- 5 mm/year]
Image: Dave Zilkoski
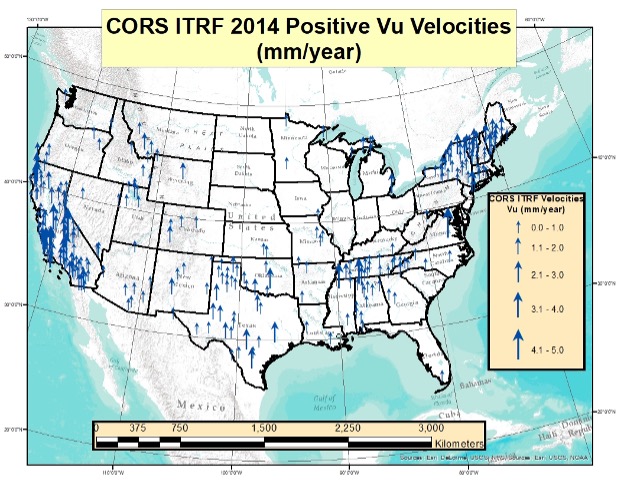
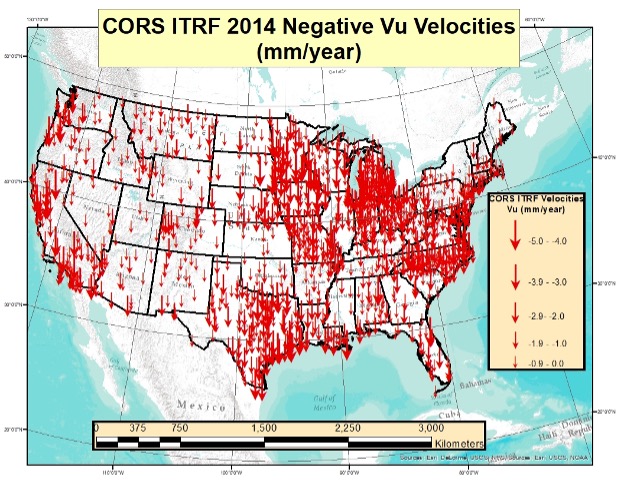
I also generated plots that separately depict the positive and negative upward velocities for the conterminous United States. There are more negative upward velocity values than positive values.
CORS ITRF 14 Positive Upward Velocities (Vu) in Conterminous U.S. (Values between 0 and 5 mm/year)
Image: Dave Zilkoski
CORS ITRF 2014 Negative Upward Velocities (Vu) in Conterminous U.S. (Values between -5 and 0 mm/year)
Image: Dave Zilkoski
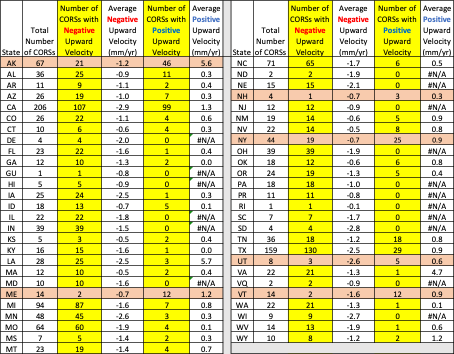
The table below provides the number of CORS with negative upward velocity values and the number of CORS with positive values for every state and territory of the United States. I have highlighted the states and territories that have more positive values than negative values. As you can see, only six states have more positive upward velocities than negative values. Four of the six states are in Northeastern United States.
Table of ITRF 2014 Positive and Negative Upward Velocities for United States
So far, this column has only addressed the vertical movement at the NCN CORS. The values at the sites indicate the potential movement of marks in the area of the CORS. The rates are based on GNSS data and have an estimate of error associated with them.
I’m not sure how NGS will address the vertical movement effects in the new, modernized NSRS. That said, NGS will be monitoring the CORS and looking for trends to help describe the movement at the CORS. These trends will be an indication of what may be happening in the area.
In addition to the movement of individual marks, there are geophysical reasons for changes in the geoid. As I stated in previous columns, orthometric heights in NAPGD2022 will be defined through ellipsoid heights and GEOID2022. Therefore, changes in the geoid model will be very important to users estimating orthometric heights using GNSS.
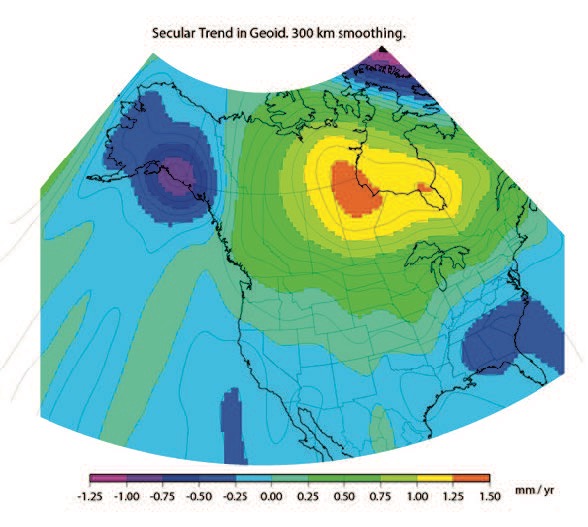
As stated in the NGS 64 report, NGS has set a goal of maintaining geoid accuracy at 1 centimeter (1 standard deviation) in both absolute and differential geoid undulations. Figure 13 from the NGS 62 Report depicts an estimate of the secular change in the geoid. As indicated in the plot, the changes are very small, ranging from –1.25 mm/year to 1.5 mm/year.
What I find interesting is the small negative change in the southeastern United States. There are other drivers for geoid changes. Future columns will address some of these changes and what it means to users.
Figure 13 from NOS NGS 62 Report
Image from NGS website: Blueprint 2 Revised NOAA_TR_NOS_NGS_0064.pdf
Figure 13 – Secular Geoid Change
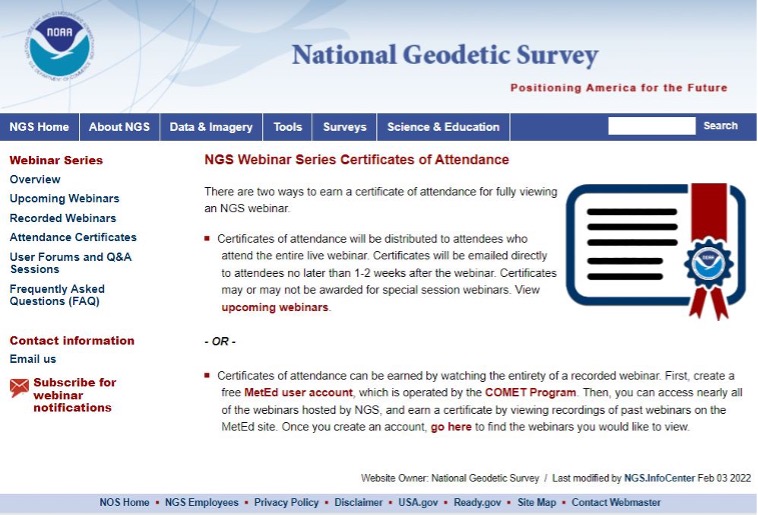
Lastly, I’d like to highlight a new service from NGS: “NGS Webinar Series Certificates of Attendance.” See the box titled “Ways to Earn a Certificate of Attendance.” Basically, users can earn certificates by viewing a webinar after it has been posted by NGS. This is very useful for users who could not attend the original webinar. I encourage all users to check out the site to find out more information about the new service.
Ways to Earn a Certificate of Attendance
Image from NGS website: https://geodesy.noaa.gov/web/science_edu/webinar_series/certificates.shtml
With Congressional approval of $17 billion in infrastructure funding, the largest single allocation ever, the scramble to win contracts is about to get red hot and AEC firms are gearing up. In this very competitive game, top engineering firms are relying on their experience, technology, business acumen and ability to execute.
Advances in aerial mapping play a key role in how AEC firms pursue these contracts. Savvy firms have been using this technology for years. Rather than rely on lower resolution satellite imagery or local drone imagery, they use wide-area-coverage aerial maps to clearly display the detail needed to plan and execute.
Over the past decade, maps made using aerial photogrammetry have played an important role in the AEC space. Using high-performance cameras, fleets of planes capture hundreds of square miles per plane per day, provided that the weather is clear. The imagery is processed and made available to engineering companies within days of capture, allowing them to see very clear imagery.
AEC organizations use different forms of aerial maps to evaluate sites, improve their survey designs, and build and maintain infrastructure (roads, highways, bridges, tunnels, overpasses, rail, airports, housing, commercial building development, water resources, parks, pavement and more). Imagine you’re a state or local government that needs to build a bridge, or a developer who wants to contract with an engineering and construction firm to build affordable housing. Why travel to perform time-consuming site evaluations when you can meet with engineering teams in your office and review hundreds of potential sites instantly using current aerial photos that show change over time?
The engineering teams point out elevation changes, the presence and height of vegetation, neighboring communities, bodies of water, ponding and more. They easily navigate from one location to another as you discuss where the entrance to the community could be, how the road network might be configured, and the proximity to retail, schools and healthcare. Within minutes you measure risk, understand the landscape, make decisions, and begin to estimate the project costs. Your teams collaborate, discuss the pros and cons, measure distances and navigate across the terrain virtually.
Aerial mapping provides a competitive advantage for AEC companies to win their fair share of the infrastructure bill. It also gives governments and developers the confidence they need to make the right decisions. Typically, this involves looking at sites from all angles. The classic form of aerial mapping used by engineers is a top-down perspective. Increasingly, these organizations have used oblique imagery captured at an angled perspective, which shows height.
Artificial Intelligence and Aerial Photography
Starting a few years ago, 3D imagery and digital surface models began to allow engineers to navigate through the imagery and query it based on elevation. More recently, aerial mapping has leveraged artificial intelligence (AI) to classify properties and the landscape. Do you need to see nearby construction sites? AI applied to aerial photography can do that automatically. This rich set of data includes attributes such as tree overhang, roof condition, roof material, building footprints, vegetation height, surface material, swimming pools and even solar panels.
The blend of all these imagery types and AI into a single solution makes everything discoverable. Users can search by address, city, location or point of interest. They can visualize the imagery along with lat/long coordinates and quickly switch from top-down views to obliques to 3D. As they learn more about the landscape, they begin to turn on AI attributes, gaining deeper insights.
Sometimes, the analyses go even further. Engineering organizations export the imagery to tools of their choice from such companies as Autodesk, Esri or Bentley Systems, use field-collected ground control points to ensure that it is survey grade, then use it as a base layer for their designs. They even create marketing presentations and video content to help them win the business. Current high-resolution aerial maps have become a cornerstone of how these organizations operate.
This approach provides unique advantages for engineering firms. For example, they can combine geospatial and construction datasets in a common operating environment to reduce complexity, streamline communication, ensure that all stakeholders are up to date, and check their progress toward meeting contractual obligations.
Planners have current, contextual designs and models to make accurate decisions about planning and development activities. They can view asset locations and conditions to facilitate maintenance and upgrades, leverage aerial maps inside other platforms to improve work orders and reduce field visits, and ensure regulatory compliance.
Whether it’s improving highway safety, constructing ferry terminals, improving transportation systems, developing land or building a network of recreational trails, aerial imagery provides engineering and construction companies with a competitive advantage to win new business, improve client satisfaction and meet growth targets. With $17 billion on the line, sophisticated firms are finding a way to secure their fair share of the pie.
Registration for the Institute of Navigation’s (ION) Joint Navigation Conference (JNC) 2022 is open and the technical conference program is now available online.
The JNC, sponsored by the Military Division of the Institute of Navigation (ION), will be held June 6–9 at the Town and Country Hotel in San Diego, California. JNC 2022 is a Federal Employees and Contractors U.S.-only conference. Advance visit requests and approvals are required for all attendees.
The event focuses on technical advances in PNT with emphasis on joint development, test and support of affordable PNT systems, logistics and integration. From an operational perspective the conference will focus on advances in battlefield applications of GPS; critical strengths and weaknesses of field navigation devices; warfighter PNT requirements and solutions; and navigation warfare.
The theme of the 2022 conference will be Enhancing Dominance and Resilience for Warfighting and Homeland Security PNT. The technical program includes six panel discussions on Rapid Agile Development and PNT Technology Transition; MGUE Integration; National Critical Infrastructure Threat; Future Space-based Sources of PNT; Situational Awareness; and the Warfighter Panel.
To view the JNC 2022 technical program and register for the event, visit ion.org/jnc.
The Federal Aviation Administration (FAA) and Association for Unmanned Vehicle Systems International (AUVSI) will co-host the 2022 FAA Drone Symposium April 28 in Orlando. The event will take place at the Orange County Convention Center.
The 2022 FAA Drone Symposium (formerly the FAA UAS Symposium) will focus on commercial operations, both at home and abroad. According to the show organizers, this collaborative event brings together industry and key FAA personnel to share best practices and lessons learned from operations, discuss challenges, and chart the course for the future of drone integration.
Session topics will include drone supply and demand, Beyond Visual Line of Sight Aviation Rulemaking Committee (BVLOS ARC) insights, drone integration and airspace integration.
Registration for AUVSI XPONENTIAL 2022 is now open. The conference will be held April 25-28 at the Orange County Convention Center in Orlando, Florida.
The XPONENTIAL 2022 theme is “Autonomy Meets Society.” The conference will include keynotes, educational sessions, specialized workshops, and an XPO Hall with 650+ exhibits.
Sessions will feature concentrated presentations, panel discussions, and audience questions to help drive deeper conversations and solutions to some of the industry’s greatest hurdles.
Session themes include:
Convergence Zone: Intersection w/ Businesses
Critical Point: Intersection with Government
DRONERESPONDERS Public Safety Forum
FULL JOIN: Intersection with Data
Interchange: Intersection with Industries
Nexus of Future Mobility: Intersection with Individuals
Proving Grounds: Enterprise + Government Solutions
Technology Crossing: Intersection with Design
Collaborative workshops will provide XPONENTIAL attendees an in-depth look into targeted topics and the solutions needed to harness the full potential of uncrewed technologies now and into the future.
Workshops include:
Orange you Glad Florida is Investing in Autonomy?
Robotics for Conservation
Translating Sustainability
Assured Autonomy Through Safety Performance Monitoring
The Safety Target
Connectedness: How Federal-State-Local Governments are Conquering Implementation Challenges Together
Accelerating Innovation Through Diversity of Thought
DoD Agile Acquisition Workshop – INVITATION ONLY
To view the XPONENTIAL 2022 schedule and exhibitors list and register for the event, visit XPONENTIAL’s website.