Author: Tim Burch

  • The surveyor and the cadastre: Why can’t we be friends?

    The surveyor and the cadastre: Why can’t we be friends?

    Our ongoing battle with COVID-19 has shown we can adapt to radical changes. A big, but worthwhile, change would be to convert our existing land databases to a cadastre system.

    Any place that one may travel around the globe, they will find boundary lines that define properties and regions. For some countries, these parcels may be primarily owned by the government while in more developed nations, a large percent of the land is owned by private citizens.

    These parcels, when looked at together, together create a large jigsaw puzzle that seemingly fits together perfectly. Visually, all the lines should fit snugly to their adjacent neighbor so that the sum of the parts equals the whole. This system, called a cadastre, has many redeeming qualities and makes for an efficient choice of keeping an inventory of a region or country’s parcels and infrastructure.

    Origins of the cadastre system

    The cadastre system of parcel registration is the database of choice for determining land ownership and taxes on property through much of the developed world. Most of the places where this system of parcel registry consists of centralized governments usually have more oversight and legislative power than more “free” countries like the United States.

    Also, these countries in which these systems exist are typically small and/or have a manageable number of parcels so the development of the cadastre is much more controlled and maintained.

    To help us understand the origin of this parcel system, let us explore the background of cadastre and its beginnings:

    cadastre (English version: cadaster) (noun)

    Definition: an official register of the quantity, value, and ownership of real estate used in apportioning taxes
    Origin: Mid-19th century from French, from cadastre ‘register of property’, from Provençal cadastro, from Italian catastro (earlier catastico), from late Greek katastikhon ‘list, register’, from kata stikhon ‘line by line’.
    (Source: Merriam-Webster.com)

    In the years after the fall of the Roman Empire and through the end of many feudal societies, land ownership was transferred to individuals and families with the expectation of paying a tax to the government for this opportunity. Landowners could plant and harvest their own crops, raise farm animals for labor, and provide various goods and services to the community.

    Besides a small fee for conveyance, the government would ask for a “meager” tax to be paid regularly. Land that was sold to these individuals was recorded in a “cadastre” for tracking of ownership and tax payment. These records were primitive in nature and relied heavily on associating a parcel number to the owner versus an actual legal description to describe the property.

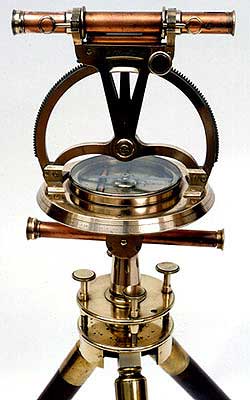
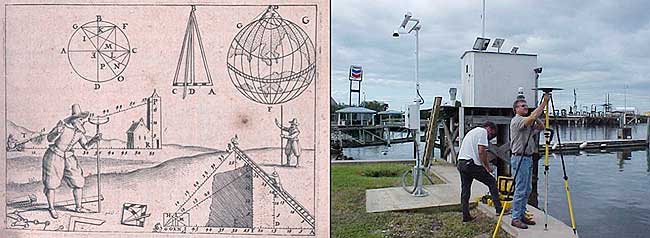
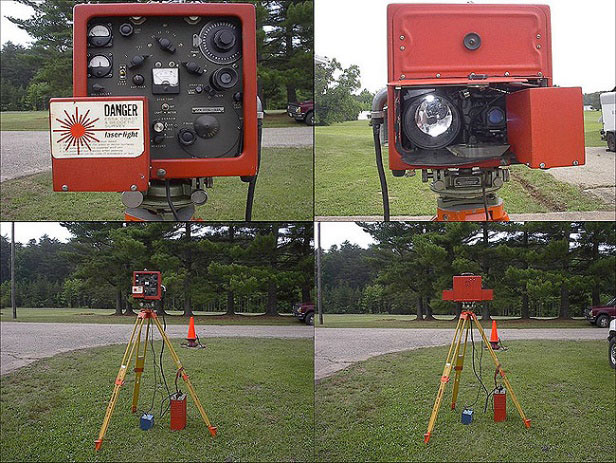
    It was not until more sophisticated and elaborate surveying instruments were developed that physical descriptions of the land were used to determine boundaries.

    Cadastre system gives way to legal descriptions

    This cadastre system of parcel management continues to exist in modern times in many parts of the world with one notable exception: The United States. Some will equate our parcel indexing system as being a traditional cadastre, but this numbering procedure is secondary to the means and methods of parcel conveyance in the U.S.

    For the non-surveyor reader, in the U.S. over the past few centuries a multitude of land systems have been used to establish parcel boundaries , each with their own unique system of describing land and conveyances. These types of land transactions began after the establishment of the colonial states and rapid expansion into previously unmapped territories.

    The push westward across the country introduced the Public Land Survey System (originated by Thomas Jefferson) and established sectional land divisions. As we encountered (and acquired) new territories, including the Louisiana Purchase and Texas, existing land measuring units and description methods were maintained to preserve these systems. No matter how the parcels are described, we rely heavily on the grantor/grantee system of transfer of ownership and rights throughout most of the country, with parcel numbering being applied post-transaction.

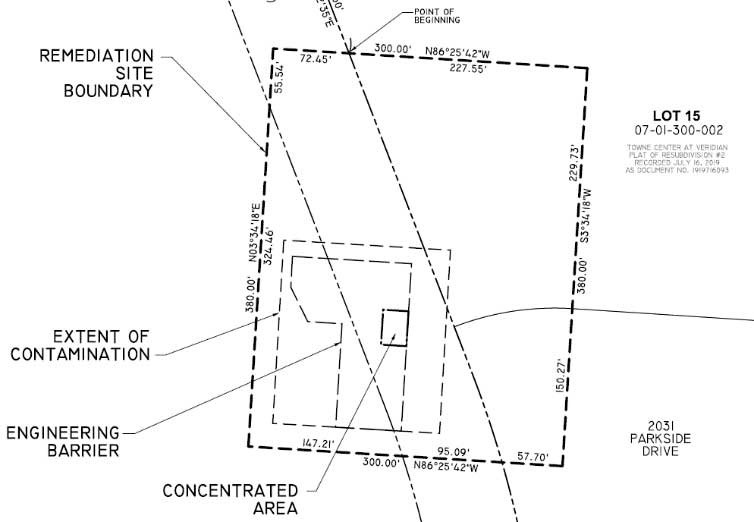
    So why is the grantor/grantee system the weak link in the chain of parcel establishment and conveyance? Many times, it comes down to the legal description and how it was created. Our system allows for the creation of a parcel by varying means by the professional land surveyor. The biggest issues occur when parcels are defined by a metes and bounds description with little to no reference to adjoining property or known monuments.

    When the legal descriptions of these parcels come into play, that is when the trouble starts, with calls made to attorneys and surveyors to help straighten everything out. To the common layperson who owns land or is looking to buy a parcel, it may seem unthinkable that parcels do not naturally fit seamlessly together with no gaps or overlaps. While the quality of survey data has increased in precision, the accuracy of marrying old data with the new suffers in many ways. How did we get to this point? Let us step back in the not-so-distant past to review how things have progressed throughout my short career.

    Set the flux capacitor to the early 1980s…

    Before computers and CAD, most agencies adopted a system of parcel and right-of-way mapping manually drafted on large sheets of durable paper or film. Depending on the municipality or county one was in, each sheet could represent either a quarter section (approximately 160 acres) or one half of a quarter section (approximately 80 acres) within a standard section of the Public Land Survey System (PLSS) established by the General Land Office (GLO) of the U.S. (now known as the Bureau of Land Management).

    These maps were based upon standard measurements within the given quarter section and drawn using 90-degree corners at the edges of the sheet. The linework depicting the parcels within blocks and larger areas was drawn as close to scale as possible but was intended to be a graphic representation of the shape rather than an accurate reproduction. Considering the technology and measuring devices/capabilities of the time, these records were very helpful in performing retracement surveys of existing properties.

    Because these surveys and parcel recordkeeping were performed long before computers, plotters, and CAD software became the norm, surveyors calculated and documented their work using manual computation and drafting from handwritten notes collected in the field. Not every parcel has 90-degree corners and lengths that are integers, so mapping departments for governmental agencies drafted new surveys and parcel boundaries to fit within the existing base sheets. Throw in the varying measurements from different surveyors and we have the real-life jigsaw puzzle that does not fit.

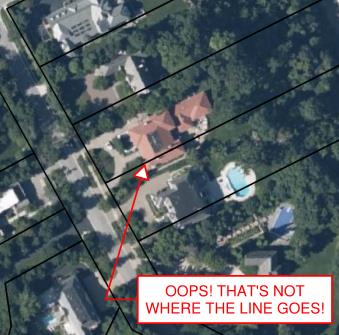
    Because the aforesaid mapping departments produced parcel numbering after the creation and conveyance of the property, the damage is already done in conforming with adjacent properties. This is an important factor in the professional surveyor’s responsibility to protect the public when performing an original survey for a new parcel and/or subdivision and utmost care must be observed.

    We have an army of land surveyors across the country shaping parcels to fit within a large jigsaw puzzle with an instruction sheet that must be strictly followed. One missed measurement or corner monument is in the wrong position, and we now have two or more parcels that will not fit together in the puzzle.

    Many mapping professionals will point, however, to the geographical information system (GIS) and how it improved this convoluted method of parcel databases. But did it?

    The digital spaghetti bowl

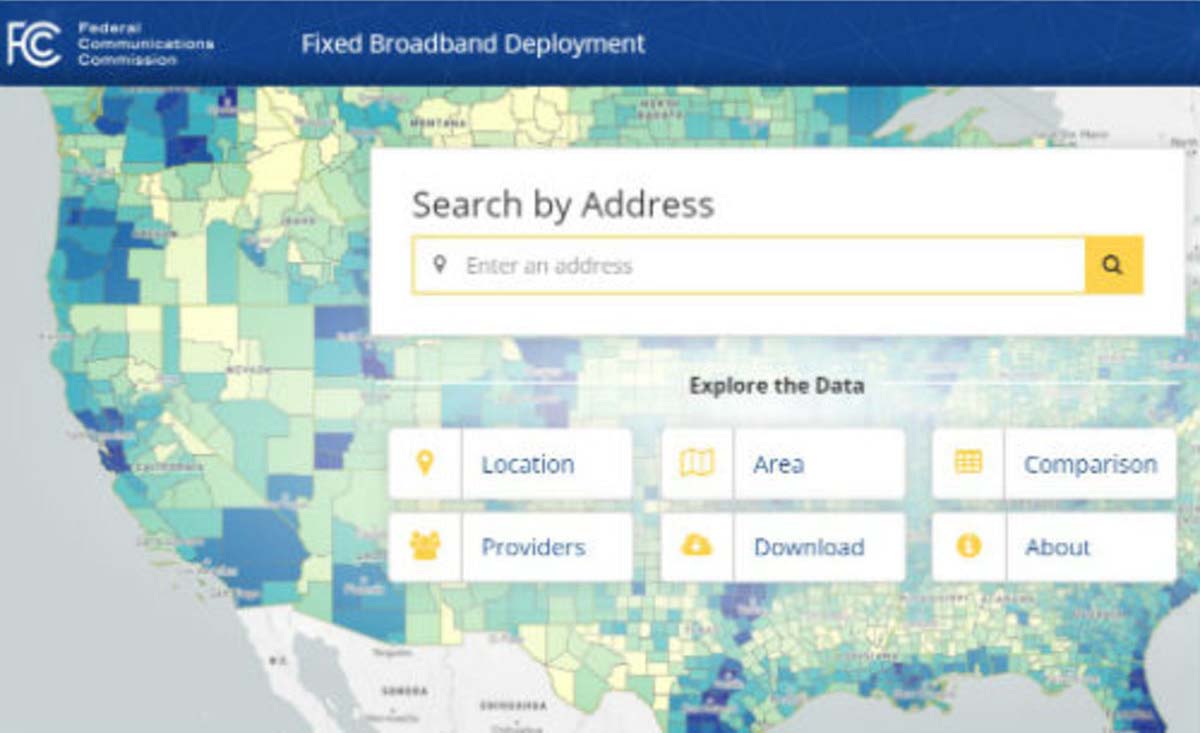
    For a large part of the U.S. where a data-intensive GIS has been created and maintained, it is a step in the right direction, but it still lacks the overall efficiency of a cadastre. Very few GIS databases contain survey-grade parcel establishment on recognized horizontal and vertical datums. Most are parcels and roadways digitized from old mapping and records that are vague graphical representations at best.

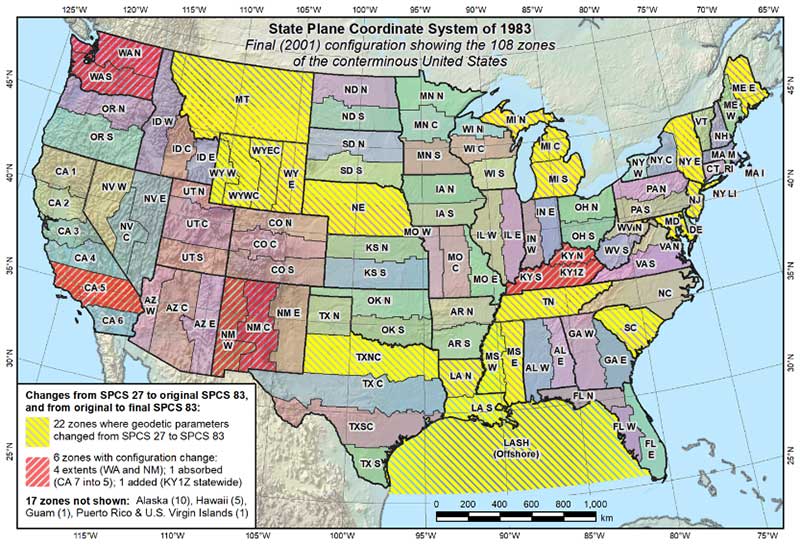
    One of the most important pieces of the GIS database are the base layers that contain control points and parcel/right-of-way lines that coincide with the datums that govern the region or state. Many governmental agencies do not employ a professional surveyor or surveying staff educated and trained to establish these datums within the database.

    Incorrect GIS parcels information. (Image: Tim Burch)
    Incorrect GIS parcels information. (Image: Tim Burch)

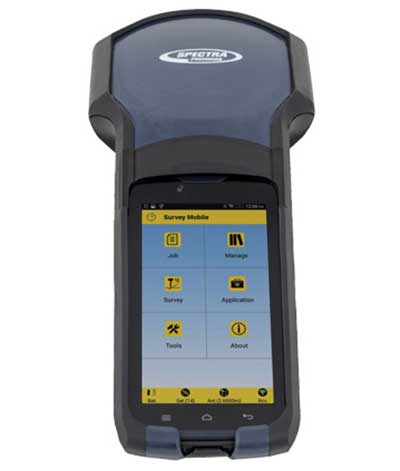
    Most times, the base layers are established “close enough” using aerial mapping and other data, including handheld GNSS receivers to collect infrastructure improvements. This is not a knock on these departments or individuals; they created the best possible database with the information on hand.

    When merged with aerial mapping and/or survey-grade data, the graphical information from the archival records can be confusing and misleading, especially to those who are not educated to understand the data.

    Is the cadastre an upgrade?

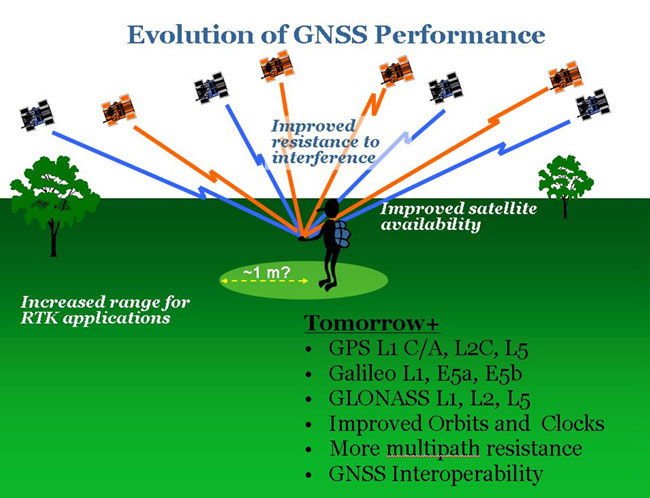
    The reason to consider converting all the existing parcel mapping and subsequent infrastructure/improvement mapping to a cadastre are simple: technology. We have previously discussed cities building digital twins (“Surveying and Geospatial Data,” GPS World, July 2020) utilizing remote sensing and a multitude of GNSS-capable products.

    Besides surveyors, many professions and trades use GNSS technology as a tool within their work environments. Our nation has experienced rapid growth in the last 150 years. The Industrial Revolution and the advancement of machinery, materials and building techniques have greatly impacted the ability to build more infrastructure and improvements. Many of these improvements and utilities have exceeded their useful life but have no timelines for replacement.

    Developing accurate maps of this aging infrastructure will ensure a proper data set from which a replacement design can be made. Couple this ability to work in a geospatial environment with other datasets, including aerial/satellite photography and lidar acquisition, and it gives us a nearly unlimited ability to map our world in appropriate datums with greater accuracy and precision. Governmental agencies could utilize this system to monitor illegal activities (such as dumping, mining, unpermitted construction) and gauge environmental concerns (drainage issues, problematic runoff, deteriorating infrastructure) to better protect the public. This system could also be used to refine our property tax system and work towards a more equitable means of assessing our properties.

    None of these potential changes and upgrades would have been possible 40-50 years ago; the invention and adaptation of GNSS have allowed these technologies to emerge. We continue to find new ways of measuring and mapping, so using these new techniques should be foremost on our minds to make these previous tedious tasks much easier to accomplish.

    The hurdles to change

    The biggest challenge, in my professional surveying opinion, will be adapting millions of parcels and deeds to a new database and applying them to the current datums. For instance, here is an example of potential (and recordable!) legal description:

    “Beginning at the northeast corner of the parcel, said corner being the intersection of the south right-of-way line of Smith Street with the east right-of-way line of Jones Street; thence easterly on the said south line of Smith Street to the northwest corner of the Williams parcel per Deed No. 12345; thence southerly on the west line of said Williams parcel to the north right-of-way line of Main Street; thence westerly on the said north line of Main Street to the intersection with the said east right-of-way line of Jones Street; thence north on the said east right-of-way line of Jones Street to the point of beginning.”

    Example of “bounds” legal description. (Image: Tim Burch)
    Example of “bounds” legal description. (Image: Tim Burch)

    While this is only a made-up example, it does represent a generally accepted legal description for parcel conveyance in most recording agencies. What does a mapping department do with this kind of legal description to place it accurately within a GIS or cadastre? Unless the four adjoining legal entities (Smith Street, Jones Street, Main Street, and the Williams parcel) exist geospatially within the database, the technician will have a tough time inserting this parcel into the records. Unless the entire surveying community is up to the challenge of working solely in an approved geospatial datum for all their work, much of this effort will not accomplish anything.

    The other roadblock to converting our current systems to a cadastre is the rest of the parties who work with legal documents, plats, and infrastructure; they may not be up to the challenge for making a radical change for the better. From the assessor’s, recorder’s, and mapping offices to the title companies and attorneys, many have an attitude that the system is too big to revamp. Because they only work in one part of the overall system, they do not see the benefit of blowing it all up to make it a more robust and useful database.

    Practically speaking…

    Revamping of any system within the varying levels of government is costly, no matter what branch or region is discussed. Governmental agencies are being asked every day to do more with less and provide more value in their services with few numbers of staff.

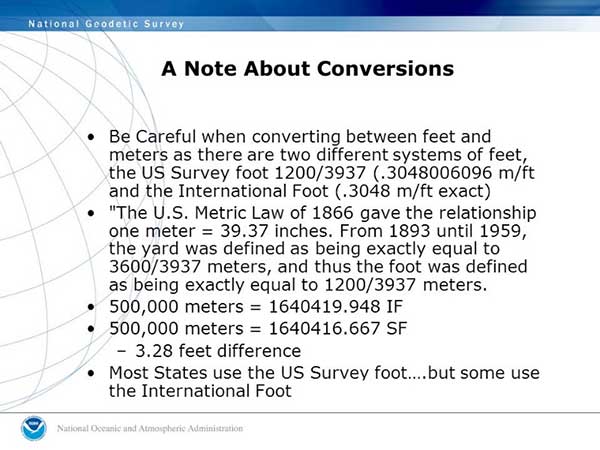
    While there may be a large upside to converting our existing databases to a cadastre, the downside is the effort and cost to do so. Yes, the new system would be scalable and easily adaptable for more infrastructure growth and could be expanded in an infinite number of ways. We can liken this proposed idea to converting all weights and measures to the Metric System: going metric will make lots of tasks and procedures easier, but flies in the face of everything we know as a society.

    However, our ongoing battle with COVID-19 has shown we can adapt to radical changes. The cadastre is a better system, but I do not want another worldwide disaster to convince us to change.

  • Surveying and geospatial data: the perfect couple

    Surveying and geospatial data: the perfect couple

    1800s theodolite. (Photo: ngs.noaa.gov)
    1800s theodolite. (Photo: ngs.noaa.gov)

    Everywhere we look, data is being collected, reviewed, analyzed and stored. It used to be that data was a static piece of information, like a piece of paper in a filing cabinet. Millions of pieces of data being created yet almost all of it never to be used again. The computer and electronic storage began a revolution of how we warehouse this information but that was only the beginning. Technology has turned data into a living, breathing beast few understand yet it controls most of our lives in various ways.

    Mapping of the earth has not always been about establishing boundaries and parcels; many of the early maps and plats were created to depict the topography of our world. While there are some indications that Middle East maps depicted parcels, the first examples of topographic maps were created during the Roman Empire era of 300 A.D. It is common knowledge that the Romans utilized primitive yet cunning engineering for roads, buildings, and waterways but it was the initial topography that was mapped that allowed them to design those forward-thinking infrastructure components. Because of the lack of sophistication in the measuring methods and data collection, these topographic maps covered small areas and often crude because of the materials available. Considering what they were working with, it is still incredible what they were able to map, design and build.

    Measuring devices and methods of data collection expanded over the centuries like most occupations and professions. By the 16th and 17th century, mathematics has been introduced at a wider scale through many educational facilities. Another profession, geographers, also advanced with the evolution of measuring devices and mapping techniques. It was during this period that we began to see a crossover with surveyors with geographers to create topographic maps with greater accuracy and precision through triangulation.

    In the 18th and 19th century, instruments became more sophisticated to assist in the determination of elevations and more accurate angle measurements. The concept of triangulation flourished during this period and significant mapping was made for most of the civilized world. The early 1800s saw the westward push of expansion in the United States and Thomas Jefferson, U.S. president and former surveyor, led the charge to map the existing states and divide the west into sectional land for sale to settlers.

    Besides the establishment of the Public Land Survey System, surveyors also provided topographic information for map of all sizes for future development planning. The late 1800s brought a large amount of topographic mapping information to paper through efforts by the U.S. Geological Society to map the entire United States. This information has been called the first land database; although crude in overall nature compared to today’s standards, it contained an enormous amount of topographic information.

    These surveys continued well into the early 20th century until a revolutionary invention coupled with a current technology merged: the use of a mounted camera taking aerial photographs from an airplane. Geographers and photogrammetrists were able to use surveying data to assist with scaling orthometric photographs to create aerial images of thousands of acres of land. These aerial photos became the base layer for determining topographic features and contouring, covering much more land than ever before. Additional innovations included advancements in stereo plotting and photogrammetric techniques to further create high sophisticated topographic maps for the era. This type of mapping was the gold standard for decades depicting existing condition and topographic features for most of the world until the early 1970s and the computerized data revolution.

    Computers take over the world (literally)

    1960s mainframe computer (Photo: NASA)
    1960s mainframe computer (Photo: NASA)

    While mainframe computers became more universally used in the 1960s, their use was contained to governmental agencies and large corporations. As the physical size of the computer reduced, the computing capacity increased, programming became easier to complete, and more applications were created to perform a variety of tasks. One of the biggest advancements for the era was electronic storage and analyzation of data through programming. Relational databases became a hot ticket for large datasets; geographic data was the perfect fit for this type of application. Modern mapping was on its way forward at warp speed.

    Topographic mapping was not lost in this shuffle. The survey itself is based upon data points located on the face of the earth so each point is just another chunk of information within the database. Programming continued to advance and soon methods previous completed by manual methods over long periods of time were completed in a fraction of previous efforts without fail.

    This effort was also joined with advancements in graphical technology to display this data on a computer video screen instead of lines of green text and numbers. Vector-based graphics, together with enormous point databases, helped create large topographical and geographical maps for many uses. During the same time the US put a man on the moon, mapping and platting of topographic information was also out of this world.

    The turn of the century brings big changes

    For the next decade, there were small advances in technology for topographic surveys and data points, but most were in presentation of data and increases in computing power. Pen plotters and smaller yet more powerful computers were becoming affordable to smaller companies, but it was still a large investment to get into the computerized data game for a surveyor. By the mid-1980s, electronic data collection with a total station was becoming the norm, but only meant collecting more points in a more efficient timeframe. The computing component did get faster but is still producing the same information of static data points.

    Ancient techniques and new technologies (Image: ngs.noaa.gov)
    Ancient techniques and new technologies (Image: ngs.noaa.gov)

    The mid-1980s also brought us a shiny new object: GPS technology. By the end of the 1990s, we were able to get out of our vehicle, start the receiver and collect geolocated points in minutes rather than hours. The big takeaway from this advancement is the geolocation component of the data point. Now everything can be related to one big dataset of topographical points. By creating a database with all our project data collected in the same georeferenced datums (horizontal & vertical), we can create digital models that replicate existing conditions.

    We can also add another big advancement in data collection: remote sensing technology. From laser and lidar scanners, photogrammetry, SLAM technology and ground penetrating radar, the innovations to collect data at locations we can “see” through sensing are now a reality. Another significant improvement with this technology is the amount of data points remote sensing can collect, both in timing and spacing. We are now talking small scanning projects that consist of billions of points within the site point cloud. We are fortunate that our computing power and storage capabilities has increased exponentially along with the remote sensing. (Remember doing a “regen” on your CAD file and having time to get a cup of coffee?)

    Lots of data — now what?

    Data is powerful, especially when it is harnessed in a robust system that can analyze and model for future use. Yes, this condition also applies to the surveying world, even though you may not be thinking about it now. We can use this data to create a virtual world that mimics the one we live in; the difference is that we exist in ours yet model and manipulate the digital version in our computer system. The technology is now available, and we can make a replica of our current world; however, why would we want to do that? There are lots of reasons to use technology and data to make sophisticated topographic maps (because that is what they are) for recording the world around us.

    One of the big differences now is that we have much more information about the data points we collect within our topographic maps. Sure, many surveyors will say that their data has not changed or evolved during their careers, but they would be wrong. Unless they are still manually writing it all down for hand plotting… (Hello! The 1960s called, and they want their field book back!) Every electronically collected point has attributes associated with the data.

    These attributes, while they may be simple, contain important information about the datapoint it represents. Horizontal location? Check. Vertical elevation? Check. Assigned point number? Probably. Field code? Most likely. But it also has one other important component: time. We now know exactly when that point was collected. Why is that important?

    Because, like a lot of instances, things change. Something collected today might not be there tomorrow. Time is just as important as the physical location and the type of point it represents.

    Gather these points together, throw them in one big model and you have yourself a graphical database that can be analyzed, reviewed, and used for planning and design. It may be hard to visualize with just simple survey data using GNSS and/or a total station, but couple it with a scanner or photogrammetry, you have a powerful hunk of data for which to work.

    Why is this workflow and modeling procedure important enough to dedicate an entire column about surveying and GNSS to? Because it used to be far in the future, but the need and availability to use it is now here in front of us. Surveying and GNSS are an important part of this effort to create three dimensional models. By using survey-grade data in conjunction with point clouds collected from remote sensing equipment, we can replicate the world around us in real time.

    Yes, Virginia, there is a name for the modeling process…

    At Intergeo 2019, Bentley Systems will be focusing on digital construction, digital cities, reality modeling and civil design. (Photo: iStock.com/alexsl)
    Photo: iStock.com/alexsl

    The name for the proposed modeling of this dataset is a digital twin. It represents a digital representation of a physical object or system. NASA famously used the concept for their space program to simulate situations and procedures of many different types of events. The concept has grown with the technology to graphically create almost anything through digitalization and computer modeling. Once the model is created, both actual and proposed data points can be included to represent the existing and future opportunities.

    The idea of a digital twin is not new; technology, however, has pumped more life into its existence by leaps and bounds with computing power and data storage capability. I remember, early in my career, going into an architect’s office and seeing the scale model mockup of a new development or building. The streets in the model were perfect, there were no drainage issues, and it was a neat as a pin. Fast forward to the construction of the development and field changes were at every turn. A digital twin will allow for better planning, more thorough design and creating more cost-effective development. Many large cities have started compiling data and building their digital twin, including New York, Singapore, Boston, and Rotterdam. Engineering and planning for new and replacement facilities is very expensive yet analysts predict that having a digital twin to work will save a significant amount of money and time.

    As a surveyor, what’s in it for me?

    Software capability for the surveyor is already here. Companies, such as Hexagon, Trimble, Topcon and Esri to name a few, have been developing their software to accommodate this concept for many years. Still, lots of surveyors do not know about it. And we should. Many of us live in places where the infrastructure is well past its useful life period and should have been replaced long ago. By starting now with survey-grade data to be put into a real-time model, we can help our governmental agencies and their consultants to move towards a digital twin that will ultimately save money and possibly lives.

    What this means for the surveyor is to further embrace technology and include remote sensing into your operation. If you have not started at least looking into UAVs and photogrammetry, you are already behind. Many aerial operations are making the next leap into mounting a LiDAR unit on their UAV to gain even more capability. Early adopters of laser scanners were probably second guessing their decision during the 2008 Depression but if they stayed with it, it will be a big payoff in the long run. The next leap will be into handheld scanning devices, including ones using SLAM (simultaneous localization and mapping) technology for locating interior and close-up improvements. These technologies will cost a significant amount of time and money to implement but municipalities, engineers and architects are going to be clamoring for the data any day now.

    When it comes to surveying and mapping of existing facilities, the surveyor and technology makes a great team. Do not let point clouds, remote sensing, or terabytes of data scare you away from providing badly needed information to help assemble your local digital twin. In the long run, it will pay off for all who take on the challenge of building it.

  • Surveying and COVID-19: A lesson in essential services

    Surveying and COVID-19: A lesson in essential services

    Open space: the final frontier. These are the voyages of the professional surveyor and their crew. Their mission: to explore and survey strange new lands. To retrace old boundaries and to create new parcels and subdivisions. To boldly go where no one has gone before (unless it has been previously surveyed and platted…)!

    With a nod to Star Trek fans (and apologies to Mr. Roddenberry), the surveyor has been the terrestrial version of the Captain Kirk and Science Officer Spock, exploring existing and uncharted territories. While most surveys completed in the modern day are retracements of previous parcels, there are still areas where surveyors are completing various tasks where no one has been before.

    There are very few instances where a survey is performed near others. By this simple fact, one can argue that the surveyor is the original social distancer. The real question, however, lies within the determination of the value of the surveyor and if the work we perform is an “essential service.”

    This article is not attempting to debate the value of the surveyor versus all the first responders, doctors, nurses, healthcare personnel and the hardworking employees doing their best to keep up with our basic needs. We are here to discuss the challenges faced by the surveyor and how technology has provided much-needed tools for crossing this abyss of doom and despair called COVID-19.

    But first, let us talk about how we arrived at this extraordinary time for nearly everyone on the planet.

    Photo: LeoPatrizi/E+/Getty Images
    Photo: LeoPatrizi/E+/Getty Images

    Worldwide upheaval or some close facsimile thereof

    Every generation has a historical event, moment or era for which they remember exactly what they were doing:

    • “Greatest” generation (born before 1924): the Stock Market crash of 1929 and subsequent depression
    • “Silent” generation (born 1925-1945): Pearl Harbor and World War II
    • Baby Boomers (born 1946-1964): Korean War, the Kennedy assassination, the Moon landing and the Vietnam War
    • Generation X (born 1965-1980): Reagan assassination attempt, Challenger explosion, death of Princess Diana
    • Millennials (born 1981-1996): 9/11, Aurora and Sandy Hook shootings

    Unfortunately, the series of events leading up to the nationwide shutdown because of the COVID-19 pandemic will unseat most of those events and eras. While previous pandemics (for instance, the Spanish flu of 1918) struck and killed many more people, the mobility of today’s population coupled with instantaneous media coverage provides a much different environment for this situation.

    Image: CDC.gov
    Image: CDC.gov

    Obviously, we are not alone, and this virus has spared few countries and races. Different cultures across the globe have adapted for the pandemic in a variety of ways, and the U.S. has faced the same challenges across our diverse environments.

    Depending on where one is located, they face a different set of challenges due to the pandemic. Several heavily populated urban areas are subject to a strict lockdown while states with mostly rural areas are less restrictive. One size does not fit all when dealing with limiting public exposure to others, but let us leave the debate of how much restriction is needed to the scientists and public officials. Many today do not agree with the rules we have been dealt with in going about with our lives. That is a discussion for another time and different forum.

    Instead, let us discuss what we face going forward with our “new reality” of some form of social distancing and how the need for surveying and geospatial information remains for a large portion of this world. We must simply adapt to this situation with the adoption of new technologies and a revamped workflow.

    Everything changes, whether we like it or not

    The surveying profession is not unlike many other service-oriented and public-serving occupations, even with most of the field work being performed in solitude. We still deal with clients, governmental agencies, other consultants and the public.

    The COVID-19 pandemic has changed the way we are now interacting with those outside partners with technological advances and modified communication conduits. Many of these methods existed well before this situation, but the rapid advancement of the pandemic forced many companies and employees into adapting very quickly.

    Surveyors are no different, so let us run through the changes we have seen within the industry.

    Project communication

    The biggest challenge facing most surveyors in dealing with the pandemic atmosphere has been communication. Whether it is with employees, clients, government agencies or other consultants, communication has been affected mostly because of the elimination of face-to-face opportunities.

    Technology to allow remote communication has existed for many years, but not many of us have taken advantage of it because of the convenience of in-person interaction. Who does not want to leave the office to meet with a client, shake their hand and close the deal? Or have the client come to your office and go over the intricacies of a complex survey?

    Regardless of whether one is introverted or extroverted, human contact has always helped establish and solidify relationships. For most of us, this is how business has always been done, be it your client or your employees.

    Obviously, the biggest area affected has been daily interaction with employees. Controlling workflow, handling projects and troubleshooting any situation is more difficult when the team is not physically in the same location. If a team member is overwhelmed, another one can immediate meet with them and help. Work is easily passed between teammates with little effort.

    But working remotely? That takes more effort, consideration and technology to accomplish. Yes, video conferencing has been in place for many years, but mostly in large companies and only implemented it in a dedicated conference room. Not many employees were previously afforded a webcam, microphone and speakers along with the necessary software; all of these components are now standard issue. For many, programs like Zoom, Skype and Microsoft Teams are now a critical communication tool for timely and efficient sharing of information.

    What about communication with field crews? Many would say that even a pandemic would not change how we stay in touch with field crews, but even these relationships have been affected. While there are survey companies operating with limited physical contact as a norm (large firms with projects regionally or nationwide), most surveyors still have a substantial amount of direct communication between field and office. This situation has forced many firms to take precautions, with crew members only handling specific pieces of equipment or performing a thorough cleaning if sharing during a project.

    Project documents and files have typically been been handled manually with some electronic data files being transferred via email or internet. Depending on the size of the original document, having a full-size paper copy of a previous survey or subdivision plat has advantages to looking at a PDF image on a tablet or computer screen while in the field. Many companies outfit their field crews with 11 x 17-inch printers to be able to print larger detailed areas of bigger documents. Additional care must be taken if these items will still be used for field operations.

    Image: Tim Burch
    Image: Tim Burch

    The transfer of data between office and field has become faster, more efficient and safer with technology. As data collectors have become more capable, direct connections via the internet to cloud storage is making transfer of project files and photos faster and more secure by providing immediate backup to guard against data loss. What used to take a trip to the office, connecting to a computer and downloading is now done in a matter of minutes without leaving the job site.

    Field personnel are also benefiting from technology within our devices. Apps like FaceTime and programs like Microsoft Teams provide a gateway to video chatting so teammates can discuss projects in real time. Shared pictures, computer screens and face-to-face interaction provides an avenue to more effective communication and enhancing relationships between team members.

    The pandemic has forced many surveyors to adapt and learn several new apps and programs to connect in new ways; however, this pandemic has also affected how we go about our field operations, too.

    Enhanced data collection

    Not many of the surveyor’s field activities are affected because of social distancing requirements, but the pandemic has forced our profession to be compliant with the new rules in case we are in proximity with others. Newer technology, using both terrestrial and aerial platforms, are now being utilized by more surveyors for their data collection needs.

    Train employees now. As many companies have seen a slowdown in work due to pullbacks from projects moving forward, now is the time to get employees trained with the new technology and software to be better prepared for when the market comes back.

    Using photogrammetry tools. Photogrammetry, lidar and laser-scanning systems are being purchased and implemented for everyday use and not just “special” projects with larger budgets. Not only are surveyors finding it keeps them further away from other people, it also allows for more efficient data collection and representation of existing conditions.

    Flying unmanned aerial vehicles. UAVs continue to grow in popularity, and like the other technology discussed above, many firms are investing in becoming remote pilots and implementing aerial photography and lidar into their workflow. Previously, most surveyors (and the general public) would use Google Earth, Bing and other resources for aerial imagery to gain a better perspective on their project sites. Vendors are coming out with aerial products with more recent flights at a higher resolution, but do not offer the ability to extract reliable topographic data easily. In-house UAVs provide more flexibility and control over the information needed, and many are using their downtime to become familiar with aerial products.

    Photo: GPS World
    Photo: GPS World

    Dipping toes into remote sensing. Another sector of surveying equipment seeing increased use during this situation are new total stations with remote-sensing capability. Many surveyors may not have the need for a standalone laser or lidar scanner, so several manufacturers have introduced a total station that provides limited remote sensing for everyday use. While the built-in scanner is not nearly as robust as a traditional remote-sensing unit, it provides enough capability and accuracy for most users. This intermediate step of remote sensing helps a firm decide how much scanning they will produce and if an investment in a full function unit is right for them.

    Upgrading GNSS receivers. We would be amiss if we did not mention that more surveyors are now upgrading their GNSS receivers to take advantage of more constellations, integration with IMUs and increased computing power of the latest data collectors. Some surveyors who are not as economically affected during this pandemic are taking advantage of great deals on new equipment and using this time to increase their capability and efficiency. As more satellite vehicles become available, the ability to gain accurate and precise locations is better than ever, so staying ahead of technology is still important in these times. We will continue to see more gains with L5 and L1C signals from the new GPS Block III satellites within the next few years, so staying current now is very important.

    QA/QC — The electronic method

    One trouble spot seen within the new paradigm is the ability to provide a thorough quality assurance/quality control (QA/QC) process on all surveying operations. Without the ability to print/plot original surveys at full scale, it becomes a more difficult procedure to review and analyze information on a computer screen.

    The monitors used for drafting and calculations are getting bigger, but studies have shown the human eye will focus differently on an electronic screen compared to a survey on paper. There must be many other professions and occupations using similar technology who have yet to solve the QA/QC dilemma. Hopefully, our industry will find a way to help address this issue and provide guidance.

    Image: Tim Burch
    Image: Tim Burch

    More connected than ever, yet still so alone

    The COVID-19 pandemic of 2020 (let us hope that is all it encumbers) will be forever etched in our memories as frightening and unbelievable. More than 100 years has past since the last pandemic of this proportion has overwhelmed our population. We are much more advanced in our education of health, medicines and technology than the previous event, yet we were caught off-guard by the speed in which the virus spread throughout our lands. It taxed most of our health infrastructure beyond its limits and took its toll emotionally and financially to most of the population.

    We were forced to adapt very quickly to a new norm of working remotely and independently of our co-workers and teammates. Did it hurt our productivity and profitability initially? Absolutely. Were our employees forced to learn new ways of doing their work and communicating by other means. Yes, they did. Was there a need for rapid troubleshooting of new procedures and task management? Of course. Has every transition of remote work been a success story? I doubt it, but it was not for lack of trying.

    We are doing the best we can, and the surveying profession is rapidly trying to adapt. Like the rest of the world, the surveying profession will not be the same coming out of the restrictions placed upon us because of the pandemic. We have learned more about ourselves and how capable we are with tools we have. We also learned how we will transition with these skills into new technology not invented yet.

    Surveyors are a tough bunch, so the social distancing and adaptation required to survive the COVID-19 pandemic of 2020 — while not easy by any stretch — has been handled with grace and professionalism. I would say to bring on the next one, but would rather this pandemic be in our rearview mirror quickly and not see anything like it ever again.

  • Product review: Rugged tablet tackles survey tasks

    Product review: Rugged tablet tackles survey tasks

    Photo: DT Research
    Photo: DT Research

    Technology continues to develop and put more capability, data storage and ease of use into many professional’s hands, and surveyors are no different in their needs.

    Spatial data collection has become an important task in the diverse service world of today’s surveyor with a variety of platforms, sensors and techniques being used to provide this operation.

    The movement toward completing a “digital twin” of existing improvements and facilities worldwide has opened the door for new means and methods for data collection. Surveyors are taking a front-line role in producing the spatial data necessary for much of the internal and external infrastructure being used in today’s cutting-edge digital modeling.

    Necessary accuracy and precision

    However, not all data-collection systems offer the accuracy and precision deemed necessary by today’s surveying profession. These systems also need to be tough enough to handle the environmental conditions surveyors face in their everyday work, yet be user-friendly enough to make the data-collection process efficient.

    Surveyors require a system designed for rugged use, yet built with a high-visibility screen, easy-to-use interface and reasonable battery life to allow effective and confident data collection. Many data collectors tout these features, but many of them fail when subjected to the harsh conditions of surveying and construction sites.

    Times, however, are a changing and a new tablet is raising eyebrows.

    DT Research Inc., a Silicon Valley electronics provider, has provided mobile and medical computing devices to many professions for more than 20 years. They have taken one of their most popular models, the DT301, and added integrated significant upgrades that brings it squarely into the surveying and geospatial world.

    This rugged tablet can now include a multi-frequency GNSS module and a second, 3D-capable, stereo-imaging camera for capturing photometric information.

    Specifications

    Here are the overall specifications for the DT301X-TR Rugged Tablet:

    • Intel 8th-generation core i5/i7 processor
    • Microsoft Windows 10 IoT Enterprise operating system
    • 10.1-inch sunlight readable capacitive touch screen
    • High-capacity, hot-swappable battery pack with power-saving modes
    • IP65-rated for water and dust resistance
    • MIL-STD-810G for shock and vibration protection
    • MIL-STD-461F for EMI and EMC tolerance
    • Multi-frequency GNSS (including GPS, GLONASS, Galileo and BeiDou)
    • External GNSS antenna capable
    • Intel RealSense Depth camera, 2D barcode scanner
    • Long-range Bluetooth, 4G LTE, digital pen support
    • Sturdy external keyboard with various mounts for static installation
    • Rugged yet reasonable weight of 3.1 pounds
    • Multiple mounting options for precise measurement

    Rugged, but not too heavy

    The first impression a new user of the DT301X-TR will notice is that while it is heavier than the normal personal tablet, it is very rugged yet not noticeably heavy. The additional weight it does carry, however, gives the user a sense of durability and confidence to take it into fouler environments without fear of infiltration or hazardous climate concerns.

    The external bumpers can take significant abuse, and the rubber rear guard is used for gripping the tablet effectively during data collection tasks. Several mounts are available for this unit, including a pole mount in conjunction with the external GNSS antenna for higher accuracy location determination.

    This unit runs the Microsoft Windows 10 IoT (internet of things) Enterprise operating system, so most users will already have a general feel for the overall interface. All the normal Windows tools are there (email, browser, etc.), so little training is needed for beginners.

    Connectivity is available through dual-band Wi-Fi and/or 4G LTE communications as well as long-range Bluetooth connections where needed. The unit runs on an Intel 8th-generation core processor and SSD storage for fast computing and data access needs.

    In addition to computing performance, this model also exceeds expectations with its robust screen. Where most high-def screens on phones and tablets suffer in daylight conditions, the DT301X-TR allows the user to maintain great visibility and keep working with visual confidence.

    GNSS module and antenna

    The DT301X-TR can be loaded with several data-collection software packages, depending on your application. For traditional surveying, Microsurvey’s Field Genius is used for locating survey points with the GNSS module. Several programs for data collection are available, depending on the accuracy required by the user.

    Photo: DT Research
    Photo: DT Research

    A helical mobile dual-frequency GNSS antenna is mounted directly on the tablet for receiving survey-grade positions with an RTK correction service. The tablet can also be used with an external GNSS antenna mounted on an extendable pole for a more conventional surveyor-style method of data collection while providing stability for the user.

    The data-collection process for mapping is intuitive and allows for uploading existing shapefiles for reference to existing conditions. Exporting information after the data-collection task can be completed in two different formats: shapefiles and KML files.

    Photo: DT Research
    Photo: DT Research

    For the higher accuracies typically required for surveyors, the unit utilizes the pole mount to ensure the accuracy level is not compromised by human interaction, and it connects to an external GNSS antenna. The software allows the user to collect more precise locations through several means: static, real-time kinematic from the user’s base station, or through a real-time network solution from an external source.

    The data collection process in Field Genius is very user friendly and allows for customized point naming and automatic linework between points. Field Genius also contains standard COGO tools and routines that allow the user to perform field calculations right on the job, saving valuable time and money for the practitioner and the client.

    Exporting of field data is robust and allows for creation of DXF/DWG files of linework and LandXML files for surface and point downloads. The user can also export raw data in a GNSS Survey format or the industry standard “field book” format as well. Importing background files is just as simple, so the user can have additional information at their fingertips for reference during their data collection process.

    Also, the DT301X-TR can be utilized for construction staking with an extensive array of staking reports available for user verification. Proposed TIN surface models can be imported for site and roadway staking for placing cut/fill points on the fly.

    Cameras make it shine

    The DT301X-TR, however, is not just a fancy conventional surveying data collector; the Intel RealSense Depth camera and DOT3D Pro software from DOT Product is the latest development to be added to the rugged tablet that makes this platform shine. This latest technology from Intel allows the user to photograph and video spaces that even the newest laser and lidar scanning equipment can’t access.

    Stereo depth modeling is enhancing the data-collection process for surveyors as a new tool to collect important information for engineers, architects and contractors. By collecting close quarters information in real time, a more complete BIM and/or “digital twin” data set can be accomplished faster and more cost efficiently than ever.

    This version of remote sensing is becoming very popular with other vehicles and platforms (such as UAVs), yet being integrated into a single unit with GNSS capability is key to making the DT301X-TR a game changer.

    The divide between the macro (GIS mapping) and micro (traditional surveying) of spatial data collection is closing, but it will take some time before satisfying the surveying community. The DT301X-TR is closing that gap by marrying the accuracy of GNSS measurement with the precision of 3D analyzation technology.

    DT Research began by creating a bulletproof tablet made for durability and dependability, but has raised the bar with a state-of-the-art satellite measurement module and remote-sensing capability through the RealSense camera system.

    Wrapping all this technology into a rugged unit running on an industry-standard software platform, DT Research has provided an insight to what the future of data collection looks like, no matter what profession one is in.

  • On the cusp of 2020: From Y2K to today’s technology

    On the cusp of 2020: From Y2K to today’s technology

    Image: GPS.gov
    Image: GPS.gov

    As we close the book on 2019 and head into the next decade, much has changed during the 2010s and the 21st century. This article will focus on the technological changes that made a significant impact on the surveying world, with the biggest advances being specifically GNSS-based improvements.

    No, we will not debate the true beginning of a century (Jan. 1, 2000, versus Jan. 1, 2001), but instead look at the predicted issues with computers and the Y2K hysteria leading up to the end of 1999 as part of our nostalgic tour.

    For the millennials and Gen-Z readers, bear with us old-timers for a few paragraphs while we take a trip down memory lane.

    The tale of two centuries…

    “It was the best of times, it was the worst of times, it was the age of wisdom, it was the age of foolishness, it was the epoch of belief, it was the epoch of incredulity, it was the season of Light, it was the season of Darkness, it was the spring of hope, it was the winter of despair, we had everything before us, we had nothing before us, we were all going direct to Heaven, we were all going direct the other way — in short, the period was so far like the present period, that some of its noisiest authorities insisted on its being received, for good or for evil, in the superlative degree of comparison only.”

    In 1859, Charles Dickens wrote this opening paragraph for his well-known novel, “Tale of Two Cities,” to describe two environments (in this case being London versus Paris) at a significant transitional time. Such was the case for surveying and technology in the late 1990s with the rapid utilization of GNSS technology, expanded capability of robotic equipment and data collection. Some practitioners were excited about the new century while others yearned for bygone eras of less complicated procedures.

    “Gonna party like it’s 1999…”

    A 1999 Gateway PC refurbished by LRG. (Screenshot: LRG video, click to view)
    A 1999 Gateway PC refurbished by LRG. (Screenshot: LRG video, click to view)

    With apologies to the late singer Prince and his 1982 hit song, the news surrounding the year 2000 was bleak when it came to computers and technology. For many of our readers, the technology available in 1999 might seem like the Stone Age. Most homes still used telephone land lines, “state of the art” cellphones were being produced by Nokia, personal computers (manufactured by Dell, Gateway, HP and IBM) were utilizing Pentium III processors (at a whopping 450 MHz!) with 5-10 GB storage. Internet Explorer was the web browser of choice, and Napster was gaining users exponentially sharing music downloads. Google was only one year old but rapidly replacing AltaVista and WebCrawler for our internet search engines. Life seemed good, but a storm was brewing…

    The Y2K bug was front and center in all media outlets as many computerized systems were not programmed with the year 2000 in mind. This issue was unique in that it was a software and hardware problem to address. Replacement or patching of software, while taking a significant amount of time and money, can be much easier than computers and hardware loaded with chipsets that cannot be reprogrammed.

    The Napster logo
    The Napster logo

    Most system programming utilized a two-digit year designation instead of a four-digit version (99 versus 1999) and thus a date entry for January 1, 2000, normally composed as 1/1/00 in older systems would be recognized as January 1, 1900, instead. Because of this situation, many experts were predicting a global meltdown with government, utility company and banking disruptions that would render most computer systems unusable.

    In the United States alone, over $100 billion was spent on computer upgrades and troubleshooting of the potential crisis. Thankfully, most of these systems had already been taken offline and replaced, but a few still lingered in critical systems. Because of pre-Y2K upgrade planning, many systems were tested and proven to be immune from the potential crash.

    Specific Y2K issues that took place within the U.S. satellite system were isolated mostly to the units dedicated to surveillance, and not the navigation section used by surveyors. There was a small issue with the U.S. Naval Observatory, in which the date was deemed to be “Jan. 1, 19100” but that was rectified quickly.

    The U.S. spy satellites, however, were knocked out by a faulty software patch rather than the original programming. These units were producing unusable information for three days before programmers were able to fix the problem. Imagine if that situation had happened to the navigational satellites and was impacting surveyors; we can only hope the GNSS system would have simply provided obvious bogus information.

    Embracing RTK

    By 1999, surveying had begun to embrace RTK systems for everyday measurement needs. Because of the constant focus of GPS technology moving forward, the operating systems for RTK were ahead of the curve for the Y2K issue. Fortunately, the navigational satellites as mentioned above did not fail with the date and time issues that were being predicted.

    Logo of the now-defunct U.S. government Y2K website.
    Logo of the now-defunct U.S. government Y2K website.

    The Y2K bug did, however, affect a few users of older technology and software. Older data collectors, including ones based upon handheld calculators, were susceptible to date issues. Systems that were designed in the 1970s and ’80s should have been replaced with newer technology before 2000, but old surveyors stick to the adage: “If it isn’t broke, don’t fix it!”

    For many, it wasn’t simply an upgrade in technology, but more of a radical change in known processes and procedures. New instruments and data collectors required new computers, which required new software, which required learning a completely new system.

    Handheld GPS technology, introduced in the mid-1990s, was beginning to grow as the general public was embracing the new ability to determine geographical positions. While their use is quite simplified by today’s standards, nonetheless these devices captured the tech lover’s need for more accurate location determination.

    In the end, Y2K wasn’t nearly the technological apocalypse many educated minds feared. While there were a few isolated incidents worldwide, everyday life went on without much of a blip on the radar. Planes didn’t fall out of the sky; financial systems didn’t come crashing down and life went on. Thankfully, surveyors everywhere went about their business on Monday, Jan. 3, 2000 as if nothing happened.

    Then 20 years go by…

    The new millennium has brought the surveying community many new exciting technologies and vast enhancements to age-old procedures. Field book notes has been mostly replaced with electronic data collectors, cellphone cameras and point clouds. Data is efficiently transferred between field and office with a remote connection and a blink of an eye. These past 20 years has seen a landslide of technological improvements, yet the future looks incredibly bright with more to come.

    With the new year and decade, let’s look at where we are today and what advances we are anticipating:

    GNSS CAPABILITY

    • GPS (Global Positioning System)  began working in the U.S. in 1978 and as a true global system in 1994. This system was originally designed to work strictly for the United State military, but was discovered to have consumer applications shortly after implementation. There are currently 30 operational satellites in the GPS constellation with two (2) Block III versions being evaluated at press time. A total of ten (10) Block III satellites are planned to be operational by late 2023 or early 2024. These Block III versions will have an enhanced signal capability (L5 band) and will provide more accuracy and increased protection from jamming and spoofing.
    • GLONASS (GLObal NAvigation Satellite System) is the navigation system designed and implemented by Russia. This system was deemed operational in 1993 and currently has 28 operational satellites. Most surveying equipment in the United States has GLONASS tracking capability to greatly increase the accuracy and precision of most GNSS receivers.

      China launched two more BeiDou satellites on Aug. 25, 2018. (Photo: CCTV)
      China launched two more BeiDou satellites on Aug. 25, 2018. (Photo: CCTV)
    • Galileo is the satellite constellation system created by the European Union. It reached limited capability in 2016 with full expanded reach targeted for 2020. However, the reliability of the system is now in question as a total system outage occurred for seven days in July 2019. The satellites themselves were operational; it was the main control center that experienced the shutdown during a system maintenance upgrade. The overall integrity of the system has been restored and the planned rollout of full operational capability is still scheduled for 2020.
    • BeiDou, the national navigation system of China, has achieved 35 operational satellites with 13 additional vehicles currently being evaluated for implementation. With the increased number of satellites, many GNSS receiver manufacturers are including BeiDou as standard channel reception to greatly increase accuracy and precision for navigational purposes.
    • Two additional regional systems, QZSS (Quasi-Zenith Satellite System) from Japan and IRNSS (Indian Regional Navigation Satellite System) from India are currently working to install more satellites and provide navigation signals soon. Because these are regional systems, access to these signals for U.S.-based surveyors will not be available.

    In 20 short years, we went from having two good systems to four very robust systems and two regional organizations.

    While it is still unclear how political relationships will affect the ability to use a system from another country, the simple fact is that more vehicles in space will only increase the coverage, reliability and effectiveness of GNSS navigational data. Increased signal type and strength will also provide many benefits, so surveyors should look forward to even better GNSS days ahead.

    ADDITIONAL CELLPHONE CAPABILITY

    Several increases in cellphone technology will greatly enhance not only the consumer’s use of GNSS but the surveyor’s. This involves a two-step increase in value with the rollout of 5G signal technology and dual-frequency GNSS receiver hardware within the cellphone.

    5G is being introduced in various markets around the country, but won’t see full potential until 2021 and beyond. Those who can use it in the short term will see greater bandwidth for data connectivity, but surveyors will start utilizing navigational enhancements because of the signal and transmitter technology.

    Photo: Broadcom
    Broadcom’s latest dual-frequency chip. (Photo: Broadcom)

    Add to this mix the future implementation of dual-frequency GNSS chipsets to provide much more accurate location, and the surveyor will have more data-collection power in their pocket. Dual frequency was a gamechanger for GPS receivers in their infancy, so one can only imagine how much it will enhance the navigation accuracy when included in the cellphone.

    REAL-TIME NETWORKS (GNSS)

    Most urban and suburban surveyors already enjoy the benefit of a real-time network, either from a private or public system. With 5G and expanded use of more satellites and L5 signal, the RTN will become a better tool for surveyors everywhere. A reduction of setting up a base station increased productivity, less theft and less equipment costs. The RTN will become a standard operational tool just like having a total station in your survey rig.

    DATA COLLECTORS

    Photo: Spectra Geospatial
    Photo: Spectra Geospatial

    The technology hasn’t stopped with the unveiling of new data collectors and platforms. Small handheld devices used to rule the field surveyor’s world; now those devices have become bigger and more advanced than ever.

    While most collectors already had touchscreens, the actual screen is increasing in size and functionality. Some are adopting the tablet-style format (8- and 10-inch screens), others are incorporating larger screens (7 inches) within the body of the traditional collector. All of them are including better cameras and enhanced connection capability through Wi-Fi, Bluetooth and cellular methods.

    Also catching on is the use of bring-your-own-device (BYOD) with specialized apps for connecting to newer GNSS receivers. This allows surveyors to keep down costs of equipment by not having to purchase a dedicated data collector. As mentioned previously, once the cellphone becomes equipped with 5G and/or dual-frequency GNSS, it will become an excellent system for surveying that will produce extraordinary value for the surveyor.

    SPATIAL DATA

    The biggest revolution for surveyors in the coming years will be the ability to collect spatial data through a variety of equipment and sensors. Besides the obvious explosion of UAV capability, the small-format laser scanner is becoming user- and drafter-friendly as well as much more affordable. Now a surveyor can perform dozens (if not more) of small area scans with simplified orientation and scan formatting to create a great looking point cloud for data extraction and/or Building Information Modeling (BIM). Surveyors are beginning to understand how to utilize this technology and data to reach inaccessible areas and densified regions quickly. In addition to scanning technology, SLAM (simultaneous localization and mapping) will also become more mainstream as more surveyors are adopting the method for data collection.

    What we’ve learned

    “The days are long, but the years are short.” – Gretchen Rubin, author

    Gretchen hit the nail on the head, as these past two decades have rolled on. When the end of 1999 was upon us, it seemed to be a big deal because of the potential of Y2K issues. There we were, surveyors with exciting technology in our hands, and now the forefathers of computers were going to erase it all due to not looking ahead to the next century.

    We easily got past it, yet the memories of Y2K still linger on for some of us. The jump to 2010 didn’t foreshadow any drama (other than climbing out of a recession) and I personally didn’t think any different while moving the calendar to January 2020. But somehow in the last few months of 2019, there were many stories about the Y2K predicament, and it rekindled old memories of those weeks leading up to January 1, 2000.

    Long story short, we survived and lived to survey many more days. Having time to look back and compare where we were 20 years ago to where we are now, I find it simply amazing. No, Rick Deckard isn’t flying by in his car catching bad guys (Blade Runner was set in 2019!), but surveying continues to amaze me with continued technological changes.

    I wonder what the next 20 years will bring.

  • New developments coming with the NGS 2022 datum change

    New developments coming with the NGS 2022 datum change

    Heraclitus (Photo: NPR.org)
    Heraclitus (Photo: NPR.org)

    A famous quote applies to almost everything in our lives: “There is nothing permanent except change.”

    This well-known saying is generally credited to the Greek philosopher Heraclitus (500 B.C.E.), although many historians and philosophy experts tend to agree the quote is a combination of many topics found in writings by Heraclitus.

    However the quote came to be, it aptly describes the world we live in; especially now with lightspeed advancements in technology. Change is markedly evident in today’s surveying world, and almost no practitioner is exempt from revolutionary enhancements and necessary upgrades to stay current in our profession.

    Change is on the horizon

    Photo: Trimble
    Photo: Trimble

    The upcoming NGS 2022 datum change, triggered by advancements in positional accuracies and measurement techniques, has quietly created a groundswell of questions, concern and curiosity of how and why we are at these crossroads. In my September 2019 Survey Scene article, we discussed the background behind the necessity of the upgrade and moving toward a standardized measurement unit, (the “foot”). (For purposes of this article, let’s put aside any mention of using the meter/metric system; the U.S. went down that road in the late 1970s / early 1980s, yet crashed and burned upon implementation. I agree the meter is a more practical unit of measurement, but we need to leave that talk for another day.)

    This article will be concentrating on the actual coordinate systems and how significant changes are coming for almost everyone performing surveying measurements. Yes, this means all those construction-based users of GNSS receivers and total stations performing pre-, in-progress and post- construction tasks. Our coordinate world will be turning upside down but, in this case, it will be changes for the good.

    Origins of X/Y (otherwise known as Northing/Easting)

    We have another philosopher to credit for the concept of coordinate geometry; he is the French scientist Rene Descartes (1596-1650) who was heavily influenced by Plato.

    While he may be more well known for his famous quote “I think, therefore I am,” Descartes created what is believed to be the first graphical depiction of geometrical expressions and assigning coordinate values to the results; hence the background behind “Cartesian coordinates.” It is this coordinate system that was utilized by late 1800s/early 1900s surveyors who began using this system to create small networks within urban settings, including New York City, Cincinnati and Atlanta.

    As economic expansion continued through the Great Depression and beyond, the need for larger survey networks became more evident. The first state plane coordinate system (SPCS) began in North Carolina in 1933-34 with more states quickly falling in behind them. The main force behind this effort was the U.S. Coastal & Geodetic Survey (now known as National Geodetic Survey), as they utilized many surveyors and engineers that were unemployed due to the Stock Market Crash of 1929 and Great Depression. Technology for the era was limited to theodolites and steel tapes, with most computations being based upon triangulation.

    Enter the Electronic Age of surveying

    "Big Red" Geodimeter 4D (Photo: National Oceanic and Atmospheric Administration)
    “Big Red” Geodimeter 4D (Photo: National Oceanic and Atmospheric Administration)

    Positional and measurement technology remained stagnant until the 1950s and 1960s with the introduction of the electronic distance meter (EDM). Longer measurements could be made with increased accuracy and helped expand our coordinate system capabilities.

    These enhancements also led to faster expansion of a nationwide highway system (championed by President Dwight Eisenhower) by simply surveying more efficiently. It is along these highway corridors that state plane coordinate systems were expanded into remote areas and used to verify fractured SPC systems created through solar and/or astronomical means. While positional values at common monuments were found to have significant differences by today’s standards, most error was distributed throughout the network.

    Because of the work necessary to complete a survey using a SPCS, it was not practical for any non-governmental project to attempt tying into a known system. Fundamental use of coordinate geometry (CoGo) typically utilized a project base point with a low assumed positional value, (i.e. northing of 1,000, easting of 2,000).

    Most surveyors used the same coordinate values for each project and did not have any positional relationship between their projects. While the field portion of the project took a significant amount of time to traverse and collect, the office calculations and manual drafting were also tedious and time-consuming tasks.

    Prior to the introduction of the handheld calculator in the early 1970s, traverse computations were completed manually using sine/cosine/tangent tables, traverse adjustment (i.e. compass, transit and Bowditch rule) and double distance meridian (DMD) methods. Even as the programmable calculator became the computation method of choice, regularly producing survey data in SPCS was still years away.

    Along with the electronic theodolite and the personal computer with computation software, the introduction of the data collector quietly revolutionized the amount of data that could be stored and efficiently plotted for surveys. But even with the increased efficiencies, there was one big drawback to utilizing this electronic data collection with SPCS; most hardware was limited to values and significant figures not acceptable to using large coordinate values. Some tried truncating SPCS values but often found the trouble not worth the effort, not to mention having projects large enough to be affected by grid-to-ground scale factors (another topic for another day).

    Fast forward to the 1980s and the introduction of ultimate surveying black box, the GPS receiver. Positional accuracy through static GPS sessions was now better than ever and allowed surveyors to cover greater distances in shorter time periods. It was the implementation of the GPS receiver (and subsequent reduction in cost of entry for its use) that allowed the surveyor to embrace the state plane coordinate system more than ever. Also addressed with the new technology was the ability for the data collector to handle larger coordinate values with increased significant figures.

    As RTK and subsequent RTN systems have allowed for more efficient use of GNSS technology, the surveying profession has now overwhelmed the existing monument network and exposed the deficiencies of NAD83 and our various SPCS zones nationwide. NGS has done an excellent job for many years refining and adjusting the national datums (both horizontal and vertical) by augmenting the systems with new data and “turning the screws” as deemed necessary to provide a reliable network.

    If it is not broken, why fix it?

    The existing SPCS zones and overall NAD83 system works well but we will need to circle back to the quote in the opening paragraph: “There is nothing permanent except change.”

    Research, not just completed by NGS but many other respected agencies and laboratories worldwide, has shown that our existing datums have significant flaws due to many factors. These factors include, but are not limited to, tectonic plate shifting, previous survey data that doesn’t meet today’s positional and measurement standards, and limitations in terrestrial measurements.

    We are overdue for an upgrade to the national system and design of new policies and procedures has taken time and lots of hard work. NGS has created a new framework that will adapt to the changing needs of a state and/or regional authority.

    But what does this mean for the surveyor, the contractor and anyone else in the geospatial world that uses state plane coordinates for the basis of data?

    Image: National Geodetic Survey (Michael Dennis)
    Image: National Geodetic Survey (Michael Dennis)

    As discussed in the last article, NGS has been busy creating a new framework with a proposed implementation of 2022-2023. While NGS is creating the specifications, policies and procedures for the new system, it will be up to each state to decide if they want to keep their existing SPCS zones, change to a new scheme, and/or request that additional smaller zones be included for consideration. NGS, in keeping with existing policy, will work with each state to update their SPC definitions, but only if the state engages NGS during the setup period. Otherwise, NGS will apply the new datum specification to the existing zone(s).

    What does this mean to the everyday surveyor?

    For an example on how a state can revise their SPCS, let’s use Illinois and its plan to revise current zones. Illinois currently implements a two-zone system (East and West, lengthwise through the state) based upon a transverse Mercator projection.

    For several years, GIS users and other agencies have discussed creating a single-zone system across the entire state for ease of use. Because of the size of the state and availability of RTN coverage to some remote areas, the realization of this new system has been on hold. Also, it is understood the distortion in data accuracy across a system this large would not be suitable for survey-grade applications.

    Forward to 2019 and the NGS datum upgrade along with a substantial effort by several equipment manufacturers to install CORS stations across the state for broader RTN coverage (and the not-too-distant future rollout of 5G cellphone service). RTN coverage for mapping grade data collection is now readily available nearly everywhere in Illinois, so the potential of a single-zone system is now not far-fetched.

    It should be noted that if Illinois decides to convert to a single-zone system, NGS will only recognize that system for future computations and documentation and the two-zone system will be scrapped. It will fall to each practitioner to convert their existing data and projects to the single-zone system if they choose to use it, but it will have some drawbacks due to the distortion of the larger system.

    Image: National Geodetic Survey (Michael Dennis)
    Image: National Geodetic Survey (Michael Dennis)

    Enter the low distortion projection (LDP) system. Like other states, Illinois is discussing a potential LDP system containing 32-34 regions statewide for more accurate coordinate system development. These regions are being studied to concentrate on larger urban centers and areas where growth potential is predicted. Regions such as the Chicago, St. Louis and Peoria metropolitan areas are being highlighted for major LDP system use by not just surveyors but government and GIS analysts.

    Having a coordinate system with less distortion and more accuracy can provide more reliable information for the survey but also provide more value for the residents and businesses. By concentrating the coordinate system on smaller areas through an LDP, surveyors will literally be using a communal network like their old calibrated or localized network systems of days past. The coordinates will still be large but the integrity of the data will be higher due to the reduced distortion of the system projection.

    This system will also virtually eliminate the need to have a grid-to-ground scale factor because of the lack of distortion. So we will now have a large statewide system for mapping and smaller regional systems for accurate survey data going forward; sounds like a good plan, right?

    Making a significant change increases our capabilities

    Not to sound like a broken record, but let’s revisit the quote by Heraclitus one more time: “There is nothing permanent except change.”

    Most people don’t like change, even if it is for the better. Surveyors are notoriously famous for not wanting change. Many surveyors I know would not embrace early GPS not simply due to cost, but more of not understanding how it works. They also didn’t understand how to embrace state plane coordinates and having survey data that will be compatible with their competitors. Most of those surveyors now are using it, but only because the data collectors have become more user friendly.

    But why will this change be harder for most? Depending on where one is and how their state is going to adapt will affect that change. If your state is not changing any zones, they will have a -2 to +4.5-meter coordinate shift depending on where they are located. For states like Illinois and potentially changing from two zones (East and West) to a single zone and dozens of regional LDP systems, it will be a bit harder to translate all your existing survey data to the new systems if necessary.

    There are several potential pitfalls in front of us if we aren’t careful. Here are a couple of scenarios to consider:

    Image: National Geodetic Survey (Michael Dennis)
    Image: National Geodetic Survey (Michael Dennis)
    • Understanding the general change in datum values
    • Converting old data to new system for reuse (additional time consideration)
    • For practitioners working in several LDP regions, emphasize the importance of correct zone
    • Software and equipment firmware updates
    • Older unsupported data collectors
    • Compatibility with current and archived GIS data
    • Conversions of government agency-specific data and benchmark

    Major milestone dates:

    • Establishing a date in which all new survey data will use the new datum
    • Establish a date in which all design projects will utilize the new datum
    • Establish a date when all construction layout will utilize the new datum

    These zone/LDP system changes also will be affected if your state is currently recognizing the U.S. Survey Foot and will be changing to the “foot” per my last article and ongoing NGS discussions. That change will also precipitate additional review and care for compliance of any old data to new systems.

    As creatures of habit, change and adaptation moves us forward

    Here’s the bottom line: We need to make this change in order to efficiently address future mapping needs and positional accuracies. Because of technology and evolution of measuring devices, we now know there are other factors that play into our coordinate systems.

    As the world becomes more reliant on digital data and information, it will be critical that the right geospatial information is tied to it. There is nothing permanent except change, but change can also be for the better.

  • Survey advances on almost daily basis

    Survey advances on almost daily basis

    Real-time network availability grows in appeal, extent

    State of the GNSS Industry respondents who identified themselves as being from the survey sector constituted 28% of the total, roughly corresponding to the percentage of the magazine’s readership.

    Photo:

    In similar results to 2018’s study, the most promising and practical way to gain the increased accuracy that survey and other high-precision applications demands, the choice was “dual-frequency, dual- or multi-constellation GNSS,” followed by “real-time kinematic.” The newest application in the survey, ”real-time network (RTN) availability,” came in a close third. GNSS receivers with inertial correction devices or remote sensing capability, while increasing in product exposure and advertising, continue to remain low on the respondent’s agenda.

    While not surprising that dual-frequency, dual- or multi-constellation GNSS would remain on top of the list with RTK capability coming in second, what is surprising is how RTN availability is a primary choice of many of those answering the poll questions. Coverage of RTN networks is expanding, so many surveyors must be taking advantage of them, seeing the value of not relying on a base station RTK setup.

    With the advancements in 5G cellphone coverage, it would not be startling to see this category increase significantly in the coming years. I also foresee an increase in precise point positioning (PPP) usage with UAV implementation because the cost of entry is quite reasonable.

    What is the most promising and practical way to gain the increased accuracy that survey and other high-precision applications continue to demand?
    What is the most promising and practical way to gain the increased accuracy that survey and other high-precision applications continue to demand? (Chart: GPS World)

    The Role of Drones. This year’s question on what role drones (UAVs) will play in the next three years for the survey sector was expanded to include the broad range of remote-sensing modules being added to the aerial vehicles — and based upon the responses, rightly so.

    More than 32% of the poll-takers replied that UAVs with remote-sensor capability will perform up to 50% of our field survey tasks. Those who feel that drone technology will only perform one-tenth of the survey tasks fell to 35%, down from 42% in 2018.

    However, those who felt UAVs will perform up to half of survey tasks rose significantly, from 9% last year to 23% this year. Bringing up the bottom were those who felt drones will perform 80% of field tasks along with gradually phasing out field surveyors, coming in at 5% each.

    What role will drones (UAVs) play during the next three years in the survey sector? (Chart: GPS World)
    What role will drones (UAVs) play during the next three years in the survey sector? (Chart: GPS World)

    The expansion of remote-sensing methods (photogrammetric, lidar, hyperspectral, etc.) now available on UAVs has increased the viability for more data collection by autonomous and pilot-controlled methods. Increases in software capability, ease-of-use and storage capacity is leading to more surveying and mapping implementation in everyday tasks.

    The overall increase in those who see UAVs becoming more prevalent in a surveying department’s service offerings should not be surprising as more firms adopt the newer technology to maintain a competitive edge. We will continue to watch this trend, noting how the surveying profession both adapts to emerging technology and how that will affect the workforce. The rise from 1.3% to 5% of those who feel traditional tasks by field surveyors will begin to disappear is not troublesome, but may be a sign of changes in our near future.

    The surveying industry continues to embrace GNSS and UAV technology along with the advancements happening on nearly a daily basis. More professionals are upgrading to remain current with the market trends, so staying in tune with the technological advancements is a major key to success.


    TIM BURCH is a professional land surveyor and secretary on the board of directors, National Society of Professional Surveyors.

  • Datums, feet and GNSS vectors: The 2022 NGS upgrade

    Datums, feet and GNSS vectors: The 2022 NGS upgrade

    In what seems like just yesterday, GPS World published my article in the May 2017 issue of Survey Scene on the upcoming datum change by the National Geodetic Survey (NGS) in 2022.

    With the calendar pages turning rapidly and as we get closer to the witching hour of geospatial voodoo, more items have surfaced to discuss and educate ourselves on in relation to “the change.”

    Let’s delve into these topics and break each down into what the common surveying and geospatial practitioner will need to know with the advancements in coordinates, geodesy and our everyday uses.

    NATRF2022: The continental U.S. replacement for NAD83 and NAVD88

    It is no secret that with the advancing use of GNSS technology, flaws in both existing horizontal and vertical datums establishing our National Spatial Reference System (NSRS) have been identified and exposed.

    NGS estimates that NAD83 is non-geocentric by over two meters, while the model establishing NAVD88 contains a tilt of approximately one meter across our continent.

    For most geospatial practitioners, these flaws are minimal to the integrity of their data. It does, however, give us a glimpse of how assumptions of geodetic information can produce incorrect modeling of surveying and mapping data and could lead to more flawed earth models without significant changes to their structure.

    With a great number of surveying and mapping practitioners using GNSS technology with little or no knowledge of the origins of our NSRS, it is a good time to provide the primers below to explain the history of our geodetic datums.

    Besides my previous article, follow these links for much more thorough technical information:

    GPS World Contributing Author David Zilkoski

    NGS 2022 Informational Videos

    NGS Publications and Webinars

    NGS Video Library

    NGS / COMET Program YouTube Channel

    With changes in both horizontal and vertical datums, slight variations in the data we are used to seeing will seem insignificant, but will require the user to pay close attention to potential data traps when converting between the old and new systems. The NGS graphics below depict the severity of datum change in the horizontal and vertical component across the U.S.

    Image: NGS
    Image: NGS

    Depending on where you are working, new state plane coordinates will vary from –2 meters to +4.5 meters from previously published values, with elevations fluctuating up to one meter from previous norms. All these changes are due to the increased knowledge of our world using various forms of emerging technology not thought possible several decades ago.

    These new measuring methods and studies, including GNSS and gravity monitoring, have allowed scientists and geodesy experts to establish more accurate geographic location systems than past terrestrial ways and procedures.

    We have geodetic monuments and marks everywhere; will they still be usable?

    The short answer to this question is an unequivocal yes, but with some caveats. Use of GNSS monitoring has proven we reside on tectonic plates that move slowly over time; thus, the geographic values (latitude and longitude) used to calculate any number of coordinate value systems are changing as well.

    Image: NGS
    Image: NGS

    Relational data between established points are not likely to change, but studies have shown significant shifts in areas that result in movement of our previously considered “unmovable” monuments.

    With additional parameters and characteristics being introduced with the 2022 datum, time and tectonic plate shift are main factors in establishment of a point.

    The concept of a “permanent” point no longer exists in relation to a published and unchangeable coordinate value of horizontal and vertical data. The surveying and geospatial data collector must recognize that the user is establishing a particular X/Y/Z or N/E/Z value for that exact moment in time and it, theoretically, will change from the moment one steps away from the point.

    This may be too “splitting of hairs” for most users, but the new system simply recognizes the reality of the moving data-collection stage, no matter how minute.

    This datum re-establishment has been a monumental undertaking (no pun intended), and NGS deserves many kudos for coming up with a realistic solution for a complex problem.

    However, most of its users still have a problem, and it lies within the standard unit of measurement: the U.S. survey foot. NGS (and its predecessor, U.S. Coastal and Geodetic Survey) have always used the meter for the basis of all units of measurement (as does the rest of the world.) The new 2022 datum is bringing us, the surveyors and mappers, to a new reality — nationwide adoption of the international foot. Let the grumbling and arguments begin!

    The meter vs. international foot vs. US survey foot

    The unit of measurement aptly named the “foot” has existed since early times, with most sources crediting King Henry I of England making a decree that his foot shall become the standard for measurement.

    No matter where the definition of the foot came from, it has varied slightly throughout history. The origin of the meter (or metre, as it’s known worldwide) also has a variety of beginnings. The most established story starts from John Wilkins, an English philosopher, who published in 1668 what he described as a new standard of measurement based upon the length of a pendulum that swings approximately 38 inches across in one second. This length was eventually named the meter by an Italian scientist.

    Another century later, King Louis XVI of France issued a integration law establishing the modern metric system with weights and measures having a base-ten system of units and sub-units. Within this system was the meter with a new length definition of being one ten millionth (1/10,000,000) of the distance from the North Pole to the Equator.

    Upon completion of the calculations, a rectangular bar made of platinum and iridium was created to establish the “standard” meter from which all future measurements would be based.

    The United States first recognized in 1866 the metric system and the meter (set forth as one meter equaling 39.37 inches). During this time, the International Commission of the Meter officially adopted the physical meter bar as the standard.

    Over the next 100+ years, many studies were undertaken to re-establish the length of the meter. Using wavelengths of various elements, including cadmium, mercury, neon, zinc, helium, thallium and krypton, new definitions were created. In 1983, the current definition of the length of the meter was finalized.

    The meter is now based upon the speed of light in a vacuum (299,792,458 m/s) with the meter being the length traveled in 1/299,793,458 of a second. While the length is very close to the original measurements set forth over the centuries, it is better defined for reproduction worldwide without having to possess a standard bar or other device.

    To further muddy the standardization of units, in 1959 an international agreement was made by Australia, Canada, New Zealand, South Africa and the United Kingdom so one yard would equal 0.9144 meters. Meanwhile, the U.S. National Bureau of Standards published a notice that all survey-related measurements will remain based so one one yard equals 3600/3937 meters or 0.91441083 meters.

    Image: NGS
    Image: NGS

    We have two different measurements for the foot. What’s the big deal?

    The difference between the two standards is two parts in one million; while that doesn’t affect everyday physical measurement, it does cause havoc on coordinate systems with values beyond the millions. (See NGS video “Two Right Feet?” for details).

    What makes it even more confusing is that states across our country vary on which “foot” is standard within their legislation and daily practice. Currently (at the date of publication), six states recognize the International Foot as their standard unit of measurement, with four states not defining it. The remaining states have officially adopted the U.S. survey foot as their standard unit of measurement.

    NGS has suggested that starting with the 2022 datum change, the U.S. survey foot will not be supported in applications and software produced by them for geodetic computations. It will be limited to meters and the international foot, so they are recommending that states update their existing definitions to change to the international foot along with recognizing the 2022 datum as the official coordinate-system base.

    How to train our profession, the construction industry and John Q. Public on the new datum

    I would be lying to you if I said I’m not concerned with the rollout of the new datum and with converting all surveying and mapping work to the international foot. My biggest concern is not with those direct relationships I have with my staff and fellow professionals within my company.

    My main concern starts with these two areas: the tens of thousands of surveying practitioners working within projects containing state-plane coordinate systems in addition to contractors and other mapmaking providers using survey-grade equipment for construction and other mapping applications.

    Both groups have little to no technical knowledge of the intricacies of state-plane coordinate systems and the geodesy network “behind the curtain.” To paraphrase a well-known mortgage company with an app-based home loan system, “push button, get data” is the limit of most users’ knowledge when it comes to state-plane coordinates.

    Add to this the double-edged sword of real-time networks, where the user does not have to be concerned with setting up a base station, and the potential problems could get worse.

    While there will be a few early and timely embracers of the new datum, the majority will dig their heels in and refuse to switch. When the conversion to the 2022 datum is upon us, many users will drag their feet on learning about the new system as existing projects continue under the old datums.

    Until there is a mandate by government agencies and others, many newer projects beginning around the adopting time will remain on NAD83 and NAVD88 until directed otherwise.

    Most practitioners I have spoken with on this issue agree that it will be a tricky period for surveying and mapping. Rather than get bogged down with negativity and fight change, the surveying, mapping and geospatial community should do the following:

    • Rally our professions around these significant changes to educate our technicians and future professionals.
    • Coach contractors and other trades who rely on the technology to understand the new system.
    • Work with governmental agencies at all levels to educate them about what these changes entail and why to make the appropriate revisions to codes and statutes now.
    • Capitalize on this opportunity to teach the public about who we are and how spatial data is part of everyone’s life.

    All these points are paramount to the success of the datum upgrade and need to be followed through to the end. Ultimately, the faster we adopt and adapt, the better our geospatial world will be. There is lots of work ahead of us, but as the staff at NGS has shown us, the hard work necessary to make significant change is well worth the effort.


    CALLING ALL SURVEYORS AND GEOSPATIAL PROVIDERS!

    NGS announces GVX data format for GNSS vector processing

    The National Geodetic Survey (NGS) is requesting input and feedback on a new data format for sharing real-time kinematic (RTK) GNSS vector information.

    The new format will be like the static GNSS standard, Receiver Independent Exchange (RINEX), and is utilized by most software packages and the Online Positioning User System (OPUS).

    The new GNSS Vector Exchange format (GVX), will introduce a new industry standard for sharing of RTK vectors across differing platforms and software packages.

    Earlier users of GPS-based data collection remember the number of proprietary files created by each manufacturer, and having their own unique format for data and attribute interpretation. In response, the NGS created RINEX to help standardize data collection as a universal file format that would easily be adopted by receiver and software producers.

    That same goal is being set with the introduction of the GVX format as the next step in data-collection standardization for GNSS RTK vectors. GVX elements include (but are not limited to) the following:

    • Mark-to-mark Earth-Centered, Earth-Fixed (ECEF) vector components
    • Variances and covariances of vector components’
    • Reference frame information
    • Start and stop time of the observation
    • A-priori coordinates for the end points of each vector
    • Receiver and antenna types
    • RTK and real-time network (RTN) settings, if applicable
    • Quality control metadata (e.g., PDOP, number of satellites used, orbit type, etc.)

    The introduction to the new format along with technical specifications and examples are on the NGS website.

    The National Society of Professional Surveyors (NSPS) works directly with NGS to provide input on maintaining and updating the National Spatial Reference System and will include significant assistance with educating geospatial data providers with the upcoming 2022 datum change and implementation of the North American Terrestrial Reference Frame of 2022 (NATRF2022).

    Image: NGS
    Image: NGS

    You can send your feedback here.

    For more information, visit the NGS website.

    Takeaways from this geospatial refresher…

    The surveying, mapping and geospatial professions have exciting times ahead with these cool upgrades from NGS, so we need to take advantage of the calm before the storm to educate ourselves to make the most of the opportunity.

    Geospatial data surrounds all of us, and we are the profession specifically educated for correctly and efficiently keeping a handle on it all. It all starts with growing your knowledge a little bit each day. Please join me in growing the profession as well.

  • What Gen X means for the future of surveying

    What Gen X means for the future of surveying

    Photo: iStock.com/Georgijevic
    Photo: iStock.com/Georgijevic

    The surveying profession has come to a crossroads, and is divided amongst itself to boot. A gap exists within the profession, and yes it is a generation gap, based on how technology has evolved and how the different generations experience it differently. In this column I explore the histories both of the generations and the technology to reach conclusions on how best to move forward — together.

    Surveyors now have more tools than ever before available to them to perform their tasks. But surveyors of different ages regard these tools differently. Not to put too fine a point on it, the younger porfessionals among us feel their creativity and desire to further the profession is being stifled by the group who is supposed to be leading and mentoring them.

    Why is this crucial to consider? Because these are the future users, purchasers and adopters of geospatial equipment and software, and the future setters of industry standards. All involved, from manufacturers to distributors to surveyors themselves, would do well to think deeply upon this.

    As we enter the final stretch of the 21st century’s second decade, many things have changed since the Y2K scare and the proliferation of the Interweb. From deregulation of the surveying profession to changing coordinate systems and datums, the surveying profession faces many challenges in 2019. One of the biggest challenges we face has nothing — yet everything — to do with technology.

    Talented people are necessary to grow our profession. We are falling well short of having enough to keep up with demand. Sounds like a simple problem; just hire more surveyors and technicians. This sounds easy, but several roadblocks confront us.

    A select few still invest in their surveying future by going to college to get a degree and eventually become a licensed surveyor. These individuals find, however, that the road to success has lots of potholes along the way, just as their elder predecessors did.

    Recently, I participated in a group discussion with the National Society of Professional Surveyors (NSPS) Young Surveyors Network to discuss surveying, technology and the young surveyor’s role in promoting future career opportunities. This discussion was part of Network’s series of meetings and seminars held in parallel with the main NSPS Spring Business Meetings.

    It was great to see the higher proportion of women in the young surveyor group than in the typical professional society meeting. Their feedback was consistent with that of the young men in the group. All together, their perspectives led me to write this article.

    While I think of myself as still “young-ish” (in my early 50s), being the oldest participant in that group was intimidating, to say the least. These young technicians and surveyors are driven and focused, yet they seek the same feedback and mentoring that I desired when I was their age.

    In the weeks after that meeting, some of the items discussed continued to resonate with me and forced me to reflect on my own experiences and career path. To be fair to them and truly understand their views on today’s surveying profession, I needed to look beyond the profession, policies and procedures to which I hold fast in my ethical approach to the craft. These younger generations have been exposed to a completely different world than the one I remember fondly, and the world they grew up in has subjected them to challenges to which I cannot relate. To help explain the conundrum of trying to find a way to relate, we need to take a step back and look at not just generational values but how the many industrial revolutions have affected us as well.

    TALKING ‘BOUT MY GENERATION

    The first part of my research to help me find a way to step into the shoes of these young surveyors was to look at past generations and how they relate to each other. Going back to the turn of the 19th century, we get the following breakdown:

    Traditionalists or Silent Generation: Born before 1945

    This timeframe contains sub-groups including the “lost generation of 1914,” the “interbellum” and the “greatest generation.” Alaska and Hawaii were not included in the United States during this period. Most of the country west of the Colonial states was subject to the government Public Land Survey System started in the early 1800s. The Great Depression took its toll on much of the population, and previously rapid expansion slowed to a standstill.

    Baby Boomers: Born 1946 – 1964

    World War II changed the world. Soldiers returning from military duty to start or resume families accelerated population growth and a departure from traditional social attitudes. Two-income families emerged, and prosperity ruled for many years. Surveyors, teaming with civil engineers, helped fuel an unprecedented explosion of real estate expansion through planned developments across the country.

    Generation X: Born 1965 – 1976

    The children of the fast and free-living Baby Boomers grew up to become the Gen Xers. They were the first “latchkey” kids, more likely to be raised by divorced or remarried parents. As young adults, in their effort to enhance their lifestyle more than their parents, they did many things to the extreme with no consideration of cost. This led to massive real estate developments, “McMansions” and increased debt. Surveying continued to flourish but most growth was enjoyed by engineering firms who absorbed surveyors to expand their services.

    Millennials or Gen Y: Born 1977 – 1995

    This group is often labeled as the “Peter Pan” generation for its predisposition to put off typical adulthood norms like marriage, having children and buying real estate. They have a propensity to be more mobile and nomadic, as they take advantage of technology and rapidly changing environmental factors. With this generation we find the slowdown in career choices towards surveying, even though technology and spatial data acquisition have exploded with potential.

    Gen Z, iGen, or Centennials: Born 1996 – Current

    This generation was born into technology, and it affects everything they do. From infancy they were experienced soothing music, dancing screens, interactive toys, and dolls teaching them new skills. This generation doesn’t know of a world without computers, cellphones, GPS-based maps or high-speed internet. Surveying has also benefitted from the technology explosion but it hasn’t captured the imagination of this generation sufficiently to develop future practitioners.

    YOU SAY YOU WANT A REVOLUTION. WELL, YOU KNOW…

    The generational differences only tell part of the story. Each one faced its own challenges when it came to technology (or lack thereof), societal standards, and other facets of their respective eras. A succession of several Industrial Revolutions brought new tools for completing a wide array of tasks and procedures. Here is a summary of each of them in chronological order:

    First Industrial Revolution (1784)

    Mechanical production via water and steam power led the way during the late 1700s and began a trend of radical changes in the ability to create larger items. The Gunter chain and surveyor’s compass, both invented in the 1600s, were the mainstay of measuring tools during this time period.

    Second Industrial Revolution (1870)

    Mass production and increases in labor opportunities coupled with the adaptation of electricity in many areas enabled people to flourish like no other time to date. The optical theodolite with horizontal angle measurement was introduced and then mass produced in the late 1800s to help surveyors make more progress westward.

    Third Industrial Revolution (1969)

    A significant leap forward in technology occurred with the invention of the microprocessor in the late 1950s, followed quickly by rapid development of electronic machines designed to follow manual instructions. Programmable controllers and devices were born from the fast-paced development of sophisticated miniaturized circuitry. These developments were used to create measurement devices for sending infrared and visible light waves across long distances. In the late 1970s, technological advancements led to the development of electronic theodolites or total stations. These instruments were the first to be able to electronically determine the horizontal and vertical angles normally read manually by the operator, and to combine this data with electronic distance measurement. Further development created methods of storing this data electronically for input into computer calculation and drafting programs.

    Fourth Industrial Revolution (Current)

    Industry experts differ as to when the Fourth Revolution began, but all agree we have turned the corner and are now fully entrenched into a new realm. Further miniaturization of computer chips, advanced sensors and storage, and robotic mechanisms have introduced a new reality for everyone, including the surveyor. Today’s practitioner has many sophisticated tools available for work, including GNSS receivers, laser or LiDAR scanners, UAVs with a multitude of sensors, hydrographic vehicles with single and multi-beam fathometers, and many more instruments currently under development.

    Surveyors now have more tools than ever available to perform their tasks. Now we must cross-reference these revolutions with the practitioners from the various generations to help us understand upon which road the profession is headed.

    TECHNOLOGY MEETS GENERATIONAL DIFFERENCES; WHAT COULD GO WRONG?

    One thing that stood out in my aforementioned discussion with the young surveyors’ group was how much they were embracing technology not just in their every day lives and communication, but how they understood the enhanced abilities of the latest tech and instruments for surveying. They see the value in large data, point clouds and BIM (building information modeling) needed for industry use.

    The general consensus from this group was that my generation (Gen X) and earlier (Baby Boomers) are easily dismissive of their enthusiasm for incorporating these new technologies into our workflow simply as ways to shortcut old methods done by more labor-intensive means. While I initially tried, myself, to dismiss this suggestion, further research has only proven their point: their creativity and desire to further the profession is indeed being stifled by the group that should be leading and mentoring them.

    Cross-correlating the generations with their various personalities and quirks with the amalgamations of industrial revolutions turns up some interesting results. Gen Xers and earlier surveyors were strictly taught by their managers and mentors that both historical data and original monuments are sacred and not to be denied. This information was derived from the most basic of survey instruments and measuring equipment, with accuracy that is not acceptable by today’s standards.

    But the tradition remained: if it was good enough for our forefathers to establish the early frontier, then more accurate measuring devices are simply overkill. New sophisticated robotic total stations, GNSS receivers and robust data collectors available as a result of the Third Industrial Revolution are shiny objects that stand in the way of “good surveying,” in the opinion of the elder surveyors.

    Millennial surveyors, meanwhile, look at the world with a different vision and much different solutions. Most of them were not exposed to televisions with just three channels, telephones mounted on walls, or kitchens without microwave ovens, to just to name a few “antiquities.” Their families have always owned a computer and the library is a place where you go to study. Research isn’t looking in an encyclopedia; you Google. They embracw cellphones with a multitude of apps and functions, including location services within a few feet, practically as extensions of themselves.

    The equipment produced for surveyors today is well within their wheelhouse as it maps a multitude of points and features in a blink of an eye. Accuracy and detail are no longer an issue — but adapting that data to legacy deeds and maps is where us old timers can help bridge the gap.

    Another problem that has proven to be a yawning void between the generations is the remnants of the economic slowdown of 2007-2012. Many Baby Boomer and Gen X surveyors learned to do more with less. Times were tough and we couldn’t afford to upgrade to the latest versions of total stations, GNSS, software, or invest in new technologies like laser scanning. There was also an exodus of technicians simply because there was no work in surveying for the time period, and they found employment in other professions. That left a void in who was doing the work (now being completed by upper level surveyors with older skill sets), and having no younger personnel to train and groom for future career growth.

    There were many technological advancements during that time frame but overall the industry suffered because of the economic downturn. The Millennials, most of whom were too young to be employed during this period, now are faced with working for an older profession that couldn’t afford to stay current with technology and who have trouble relating to the motivations of the younger generation.

    CAN’T WE ALL JUST GET ALONG?

    I believe the surveying profession is at a crossroads, one based upon the gap caused by the generation / technology combination described above. Steps must be taken to rectify this. Here are a few of the pathways to closing the gap and becoming a solid profession for the future:

    1. Embrace the mentor/mentee relationship, but be open to reversing the roles. The younger generations have a handle on the latest technology, so us old timers need to be more willing to close our mouths and open our ears and minds.
    2. Create more opportunities for younger surveyors to participate in organizations so they can also be influencers. Keep in mind that they don’t typically like to “belong” to an organization, so adapt our professional groups and keep their interests in mind.
    3. Change the way we communicate. Many Baby Boomers / Gen X members are critical of the younger generations and social media, yet this trend shows no sign, at all, of stopping. Smartphones are here to stay, so let’s learn to adapt, to remain in step with the youngsters.
    4. Be willing to invest in new and emerging technology. Who know where the next radical survey technique will come from if you don’t have an open mind and checkbook? Invest not only in equipment but your young staff’s future.
    5. Encourage younger staff to get involved in something. Anything. Social interaction can lead to better communication skills and expose them to more business situations. Don’t push them in over their head,s but get them to be “uncomfortable” occasionally. They will thank you for it.

    Many professions and occupations will suffer in the next 3–5 years because of attrition through retirement, incapacitation and death. These workforces will lose 20–40% of their workers. Those left will have to pick up the slack and then some. We need to either

    A) hire a lot more surveyors, or

    B) figure out how to make it work with less bodies.

    The conversation that took place in that meeting room with the young surveyors has made a deep impression on me and has changed my focus on the future of surveying. How does this apply to an article in a geospatial publication? Simple: these are the future users, purchasers and adopters of geospatial equipment and software, and the setters of industry standards.

    The younger generation understands how to use today’s technology, and the surveying profession overall needs to embrace that fact. The technology won’t mean a thing if we don’t have the bright minds to use it to its full potential.

    So I ask you again to embrace, encourage and listen to the young surveyors; they will thank you for it.

  • Surveying and BYOD: Yes, you can use your smartphone

    Surveying and BYOD: Yes, you can use your smartphone

    BRING YOUR OWN DEVICE (BYOD) is not just an industry buzzword. It can change the way professional surveyors work every day. The idea of using a smartphone or tablet instead of a dedicated device is appealing. But is it good enough?

    Surveyors and mappers are challenged with the arduous task of data collection that meets accuracy and precision standards and provides adequate attribute information for the project. Before the invention of the electronic data collector, handwritten notes in field books were the norm. Every note keeper’s style varied in content, neatness and thoroughness. Calculations for determining survey data values were completed longhand on paper and were very time consuming.


    Index

    Click on a headline and be automatically directed to it.
    History of Surveyors and Data Collectors
    Trending Away from Proprietary Data Collectors
    How Good Is It?
    Post-Processing (OPUS and DPOS)
    Do You Need a Base Station?
    Adaptation of the Industry
    Receiver, Software Ready for Mobile
    TerraStar Gives Assist to RTK
    Trimble Offers Web-Based Post-Processing
    Atlas Corrections Ready for BYOD


    History of Surveyors and Data Collectors

    Like its personal computer counterpart, the electronic data collector was introduced in the late 1970s with minimal adoption by the average surveyor because of cost and complexity. Storage methods for the era included magnetic modules and tape; both forms of media were expensive and fragile with little storage for the cost.

    Data collection was limited to numeric values only, with horizontal and vertical angles, slope distance, point number and point code being the extent of the information. Couple this process with the limited availability of printers and plotters capable of depicting the data for the surveyor’s use, and one can see why few practitioners invested in these systems.

    iOS aerial viewer. (Screenshot: Tim Burch)Photo:
    iOS aerial viewer. (Screenshot: Tim Burch)

    The 1980s and 1990s brought significant changes to surveying with the advancing technology of electronic computing and measuring. The introduction of robotic total stations, various methods of GNSS, and even leveling took advantage of significant computer power and measuring processes, and the data collector stayed in lockstep with the advancing instrumentation. Almost every equipment manufacturer developed their own proprietary data collector and software system because of the unique design and programming of their systems.

    In the 2000s and later, third-party manufacturers began producing data collectors with advanced computing power and the ability to connect to varying brands of equipment. Most of the programming for these collectors are still proprietary in nature to this day.

    Also during the 2000s, a new wave in mobile communications was taking place. Cellular phone and data signals were now being used to transmit an abundance of information between users.

    The rapid development of handheld communication devices has led to the meteoric rise of two specific mobile operating systems: one by a radical startup that concentrated on dominating the search engine market, and the other by an avant garde computer company looking to expand its unique customer base.

    By the end of the decade, the world had been introduced to the Android operating system by Google, and the iOS operating system by Apple. The combined market share for the two operating systems at press time was just under 98 percent of all mobile devices worldwide.

    Trending Away from Proprietary Data Collectors

    Android Point Info: Confirmation of collected data, including equipment and base station. (Screenshot: Tim Burch)
    Android Point Info: Confirmation of collected data, including equipment and base station. (Screenshot: Tim Burch)

    Because data collection by surveyors and mappers have traditionally been performed on proprietary systems designed and produced by equipment manufacturers for use with only their instruments, these collectors, while very powerful and robust, are costly for the equipment manufacturers to produce because of the limited market of surveyors and mappers.

    Many suppliers, before the introduction of the iPhone and Android operating systems, attempted to adapt their data-collection platforms to wider recognized mobile operating systems (for example, Windows CE/Pocket PC/Mobile) on a bevy of mobile devices (HP/iPAQ, Sony Eriksson, HTC) with little success. Various versions of Windows are still being used today by GNSS equipment manufacturers’ proprietary data collectors, including Trimble, Hemisphere GNSS, Topcon and CHC Navigation.

    However, the field of operating environments has become more crowded as technology continues to advance. The proliferation of Windows-based data collectors are now on the decline.

    Survey Point: Status of survey data collection and GNSS engine signal reception. (Screenshot: Tim Burch)
    Survey Point: Status of survey data collection and GNSS engine signal reception. (Screenshot: Tim Burch)

    Enter Android and iOS. Driving the decline of the previously popular Windows mobile platform is the rapid adoption of the iOS and Android operating systems. These two environments have also led to a substantial number of devices and applications for users.

    Part of the reason for the speedy acceptance of the devices and operating systems has been the ease of programming. It is estimated that each operating system has more than two million applications in their respective online stores, with more being introduced daily.

    Because of the proliferation of smartphones, nearly everyone is familiar with the look, feel and operation of touchscreen devices and their various applications. This familiarity is driving a new trend in data collection: the concept of “bring your own device” (otherwise known in IT security circles as “BYOD”). BYOD is being introduced by several surveying and mapping equipment manufacturers as an alternative to their proprietary data-collection devices.

    Sky Plot: Where the ‘birds’ are in the sky. (Screenshot: Tim Burch)
    Sky Plot: Where the ‘birds’ are in the sky. (Screenshot: Tim Burch)

    These manufacturers are pairing iOS and Android developers with their hardware and firmware specialists to create a user-friendly interface that will function on most of the most popular handheld devices on the market today. From Apple iPhones and iPads to Samsung Galaxy phones and tablets, these applications give the surveyor the best of two worlds — sophisticated data-collection capability on a well-known and reliable mobile operating system platform.

    The Android platform is becoming especially popular in the handheld mapping market segment. Current users of this environment include Hemisphere GNSS, CHC Navigation, Tersus GNSS and Trimble.

    The iOS applications, while not quite as prevalent as Android, are being embraced by several significant GNSS manufacturers, including JAVAD GNSS and Eos Positioning Systems.

    These companies are creating iOS and Android apps that embrace the BYOD market, providing their users with affordability and creating a comfort level simply because of the familiarity of the device and its environment.

    How Good Is It?

    iOS Position. Status of survey data collection and GNSS engine signal reception. (Screenshot: Tim Burch)
    iOS Position. Status of survey data collection and GNSS engine signal reception. (Screenshot: Tim Burch)

    For the surveyor to be satisfied with the operation, the collection process must be efficient, cost-effective and easy to use. For this explanation of key items within a well-rounded data-collection application, we are using the JAVAD Mobile Tools (now J-Mobile) application built specifically for the Android and iOS operating systems.

    The Android system (Version 7.0) was installed on a rugged CAT S41 cellphone made Bullitt Group from the United Kingdom, while the iOS app was used on the author’s iPad Air 2 running Version 12.2. Both apps were utilized in conjunction with the JAVAD Triumph-2 GNSS receiver.

    After putting both versions through trial testing and checking against values on known monuments, here is the results of our findings:

    Receiver Setup. Visual reference for leveling and direction of GNSS receiver. (Screenshot: Tim Burch)
    Receiver Setup. Visual reference for leveling and direction of GNSS receiver. (Screenshot: Tim Burch)

    Data Organization. Easy to comprehend and flexible for most naming conventions.
    Corrections and Sources. Easily connects to base receiver and radio or available NTRIP correction service for real-time network (RTN) capability.

    Sky Plot. Because the Triumph-2 is equipped to receive most of the available satellites in service, the Sky Plot feature is beneficial to the user for assessing potential interference.

    File Management, Import and Export. Covers the typical file management and transfer functions used by the surveyor.

    RTK Survey Operations. Robust telemetry keeps the users informed of specific satellite data and correction status.

    Point Confirmation. Survey point information with metadata and equipment listing. (Screenshot: Tim Burch)
    Point Confirmation. Survey point information with metadata and equipment listing. (Screenshot: Tim Burch)

    Coordinate Systems. All standard coordinate systems are included with features to allow the user to customize their own systems.

    Localization. Creation of a local coordinate system is a simple routine, providing strong quality checks for data integrity.

    Lift and Tilt. This feature provides the user with a useful procedure to end data collection without the need to press a button. This feature significantly increases the user’s productivity.

    Compass and Level Calibration. With the Triumph-2 having an internal compass and level system, status of the receiver is graphically displayed to help the user keep a close watch on the accuracy of the survey point.

    Survey Points and Linework. Most point naming systems and line-coding procedures are easily adapted.
Total Station Point Transfer. The creation of control point files for transfer to total stations is simple and easy to use.

    Stakeout. Graphical status screens provide the user with simple plotting capability of the desired stakeout point to increase efficiency and accuracy.

    These apps are good at providing the surveyor with a solid tool for data collection and staking capability. They are especially good when paired with a real-time kinematic
    (RTK) base station or NTRIP correction service.

    But what happens when cell service is not readily available, or there are no published monument coordinates to establish site control? These apps have the surveyor covered for that situation as well.

    Post-Processing (OPUS and DPOS)

    Today’s surveyor works in an environment where geographic-based data is a key component to the services they render to their clients. While most of the world’s developed nations have access to cellular networks in which most GNSS receivers can communicate with an RTN providing corrective solutions, the places where this is not possible relies on other means of data correction.

    In the U.S. we rely on OPUS (Online Post-Processing User System) to provide that service. But, as good as it is, it has limitations. Currently, it only utilizes GPS satellite data from the U.S. Department of Defense and is subject to sporadic government shutdowns.

    Other services, from both public and private sources, are in place around the world to provide a service similar to OPUS. These include, but are not limited to:

    • AUSPOS. Geoscience Australia (free)
    • APPS. Jet Propulsion Laboratory at California Institute of Technology (free)
    • CSRS-PPP. Natural Resources Canada (free)
    • GAPS. University of New Brunswick (free)
    • magicGNSS. GMV (free)
    • Centerpoint RTX Post Processing. Trimble (free)
    • JAVAD Data Processing Service (DPOS). JAVAD (free, processes any JAVAD GNSS jps file)

    These correction services utilize other satellite constellations (GLONASS, Galileo, BeiDou and QZSS) for their solutions and can provide additional coverage, depending on the location of the user. Because of these services, geographic-based data is at the fingertips of surveyors worldwide.

    JAVAD’s DPOS system is has the ability to collect static survey data and send it to the proprietary service for establishing new coordinate values for base-station use. This process is a function of the app and can be completed in a few short steps.

    Once the base station values are calculated, the surveyor can make use of this information for establishing a base station for correction broadcasting.

    Do You Need a Base Station?

    The establishment of RTNs has greatly enhanced surveying capability as cellular service has increased in coverage and speed. However, there are still instances and locales that do not allow for the reliable use of cell signals to provide those corrections accurately.

    Various manufacturers’ tests have proven the accuracy of using an RTN subscription versus the traditional GNSS base and rover RTK setup. But cell-signal strength can be an Achilles heel, crippling those who choose not to set up a base station.

    The UHF radio, even in its reduced power state from regulatory changes, is still more powerful and reliable than most cell services. 5G technology and coverage is anticipated to revolutionize cellular service, but it has yet to be realized.

    Adaptation of the Industry

    Other GNSS manufacturers (including NovAtel, Navcom, ComNav, Unicore, Emcore, Suzhou, TeleOrbit and Geneq) are producing receivers that can be adapted to a variety of existing data collectors and connect to iOS/Android mobile devices through various software developers.

    The future of communications remains the smartphone or tablet device, with foldable units expected to be the next big thing.

    As processors get more powerful, as chip memory becomes more abundant, and as more satellite constellations orbit in our sky, surveyors and their data collectors will continue to evolve. The future remains bright for technology and the surveyor has a front-row seat.


    TIM BURCH is GPS World’s contributing editor for Survey. A professional land surveyor with more than 30 years of experience, he is director of surveying at SPACECO Inc. in the Chicago area. For several years he has been secretary and was recently named vice-president of the Board of Directors of the National Society of Professional Surveyors. He writes a bi-monthly column in the Survey Scene e-newsletter. Subscribe free at env-gpsworld-integration.kinsta.cloud/subscribe.


    Receiver, Software Ready for Mobile

    Photo: ComNav
    Photo: ComNav

    ComNav receivers offer multiple data-collection device choices via Bluetooth connection, as well as an Android app.

    For instance, the G200 provides centimeter-accuracy positioning to any connected mobile devices for RTK field surveying. It is able to delivery robust survey workflows with the SinoGNSS Android-based Survey Master, so that surveyors can collect quality high-accuracy positions no matter what mobile device they are using.

    The G200 is a rugged, compact, wearable GNSS receiver. Combined with the high-performance SinoGNSS OEM board tracking GPS L1/L2, BeiDou B1/B2, GLONASS L1/L2, Galileo and QZSS, the G200 enables reliable high-precision GNSS performance for land survey tasks anywhere in the world.

    TerraStar Gives Assist to RTK

    Photo: Leica Geosystems
    Photo: Leica Geosystems

    NovAtel offers several levels of corrections via its TerraStar service. For surveying applications, the RTK Assist service provides correction data to bridge surveyors through any real-time kinematic (RTK) correction outages. TerraStar services work on NovAtel’s OEM6 and OEM7 receivers..

    RTK Assist, available on OEM6/OEM7 receivers, provides 20 minutes of RTK assistance, enabling surveyors to maintain centimeter-level accuracy. A higher service level, RTK Assist Pro, is available on OEM7 receivers. It provides unlimited RTK assistance with stand-alone centimeter-level positioning when RTK is not available.

    Trimble Offers Web-Based Post-Processing

    Photo: Trimble
    Photo: Trimble

    Trimble’s CenterPoint RTX Post-Processing Service is a free, web-based solution that provides rigorous processing of GNSS data for users around the globe.

    Powered by advanced algorithms for processing static observations, CenterPoint RTX Post-Processing supports data including GPS, GLONASS, Galileo, BeiDou and QZSS. With the service, users can upload GNSS data using Trimble formats or industry-standard RINEX 2 and RINEX 3. The service supports all dual-frequency GNSS receivers and more than 400 different antennas.

    The post-processing service computes single-station static observation sessions ranging in length from 10 minutes up to 24 hours, with longer observation sessions recommended to produce the highest accuracy. Using data from the global RTX tracking network, the CenterPoint RTX Post-Processing service computes the position of the observed point with centimeter accuracy.

    Results are delivered via email in ITRF coordinates at the current epoch and can be transformed to a fixed epoch by use of a standard tectonic-plate model.

    Atlas Corrections Ready for BYOD

    The Atlas GNSS global correction service, offered by Hemisphere GNSS, provides correction data for GPS, GLONASS, BeiDou and Galileo constellations. Its global L-band corrections allow for accuracies ranging from sub-meter to sub-decimeter levels. The network has more than 200 reference stations worldwide and covers virtually the entire globe.

    Examples of how the AtlasLink webUI looks on a smartphone. (Image: Hemisphere GNSS)
    Examples of how the AtlasLink webUI looks on a smartphone. (Image: Hemisphere GNSS)

    The Atlas platform was conceived to enable as many people as possible to have access to the correction service technology, either as an end-user or as part of their business. Several features are designed to enable customers who use non-Hemisphere positioning systems to have access to Atlas.

    For instance, Hemisphere’s SmartLink technology allows an AtlasLink GNSS smart antenna to be used as an Atlas signal extension for any GNSS system compliant with open communication standards.

    Hemisphere’s GNSS smart antennas including AtlasLink, A326, C321+ and S321+ offer a user-friendly web user interface (WebUI) that can be used to configure, monitor and manage the receiver from virtually any modern computing device, including computers, phones and tablets.

  • Surveyors and smart cities — partners in technology

    Surveyors and smart cities — partners in technology

    Image: Celebrating200years.noaa.gov
    Image: Celebrating200years.noaa.gov

    Everywhere we turn today, the term “smart” is attached to an item or to a process. Smartphones, smart cars, smart electricity grids, smart home appliances; you name it, someone is making it a “smart” item or process. Advancement in technology has increased computing power, expanded data storage capability, and has allowed for miniaturization of circuits and processors. This forward progress has led to the creation of these smart item/processes, and together creates the real possibility of making many of life’s tasks and normal operations more automated. This potential automation also brings new systems monitoring conditions of various entities and operations within our daily lives, such as increased efficiency of HVAC systems, utility metering that adjusts to our patterns of consumption and landscape watering that only provides water when needed.

    In addition to the personal systems now being controlled with these machines, there is now revitalized interest in the creation of “smart cities.” The concept of this type of a civilized urban metropolis once existed only in science fiction, but technology has brought this concept to life in ways not imagined by the best of those writers. Surveyors have a big role in the development, installation and maintenance of these cities, so let us spend some time digging into the element that go into our future environments.

    What is a smart city?

    For those old enough to remember, the concept of a smart city only existed on “The Jetsons” cartoon from the early 1960’s, with cities in the sky, flying cars and some technological advancements that do exist today. While Orbit City may not come to fruition in the next several generations, many of the concepts of a smart city are taking shape today.

    For the definition of a smart city, we go to the Google search engine and find the following entry from Internetofthingsagenda.techtarget.com:
    A smart city is a municipality that uses information and communication technologies to increase operational efficiency, share information with the public and improve both the quality of government services and citizen welfare.

    Establishing a smart city requires forward thinking leadership and substantial funding to be created and maintained; however, the real function lies within the computing infrastructure and collection/manipulation of large quantities of data to create an environment of efficiency and conservation. A true comprehensive system combines available historical data, a collection of sensors and data collectors transmitting real-time information, and a powerful computing system containing analytical programming with extensive database functionality.

    Is smart cities technology and adoption really that important?

    Population trends worldwide continue to show that urban and suburban areas are expanding while rural areas are seeing a large reduction in residence. Several factors are at play, with technology being the central reason for the migration from the farm/small towns to the bigger cities.

    Statistics show that in 1960, two billion people worldwide lived in rural areas while one billion lived in urban sections. As the population has increased drastically, the percentages for each category have reversed; in 2007, the two categories were equal and by 2017, the urban sector has jumped to 4.13 billion versus the rural population of 3.4 billion.

    Chart: Our World in Data
    Chart: Our World in Data

    Population experts estimate by 2050, upwards of 70 percent of the world’s population will be living in urban areas. Whether this population shift goes directly to the city centers or the less dense outskirts, municipal facilities and services will need to be upgraded and expanded with the continuing trend. Add to this surge the challenge to create a more sustainable environmental infrastructure and ecosystem, and it becomes a maintenance challenge and logistical nightmare. By using technology to create smarter infrastructure monitoring and management systems, the creation of smart cities with advancing technology will be key to successful and sustainable growth for municipalities and its citizens.

    One of the biggest challenges faced by most municipalities is aging infrastructure. Utility systems, including water supplies and stormwater drainage, was installed several generations ago without a plan for replacement and/or expansion. Redevelopment in older urban areas are now taxing these aging systems well beyond their initial capacity, all while these facilities begin to fail simply because of continued use well beyond their original designed life span. Municipalities are forced to spend money on repairing and modernizing the existing infrastructure before entertaining the idea of upgrading new installations to “smart city” specifications. However, many municipalities are mandating that new developments and infrastructure improvements meet these specifications so any future upgrades can include computerized systems.

    All these systems, new and future, will require extensive planning and mapping to be effective and efficient to justify their expense. Surveyors, utilizing a variety of tools based around high-accuracy mapping and data collection, can provide the necessary base information for these systems.

    Where does surveying fit in?

    Just as computers and electronic technology has allowed many industries to evolve, the surveying profession has also advanced with new methods and equipment. Our ability to perform advanced measurements and establish positional location information is critical in providing the base data necessary for smart city services. Previous surveying, mapping and record keeping systems were sufficient for the needs of the time period. However, these historical data points were nearly impossible to place into a single database simply because of one factor: georeferencing.

    The surveyor has the unique responsibility of being recognized as expert measurer and locator of physical points on the ground in relation to property and boundary rights. It is because of this distinctive role within the community that the surveyor can provide a significant role in the development of the groundwork of a smart city. The introduction and implementation of newer technology and tools has allowed the surveyor to become a valuable member of the infrastructure mapping team. It always hasn’t been this way and the surveying profession shoulders most of that blame.

    Past promises: digital vs. smart

    Many surveyors will make the argument that our profession has been ahead of the game for years with our data collection processes having been transformed from notes in a field book to electronic devices. Digital data, however, isn’t necessarily smart data as many factors go into establishing the difference. The physical form of the survey information has no direct correlation to the basis of the data; in this case, the records need to be based upon a spatial reference frame rather than an assumed data system.

    Also on the topic of spatial reference systems, we can also address the lack of respect given to geographical information systems (GIS) from surveyors during its initial introduction and implementation. GIS was discounted as a convoluted graphical database not sophisticated enough for the high-accuracy world of surveying. Little did the surveying profession know that GIS would become the spatial basis for many mapping systems and be utilized in millions of locations worldwide. Only now does the surveying community realize that we missed the bandwagon and can help to provide the crucial link between spatial data and actual points on the ground in relation to physical improvements and property ownership.

    Another digital platform not initially embraced by the surveying community is building information modeling or BIM. This software is a three-dimensional modeling program used mostly by architects and mechanical engineers for depicting and designing buildings and plumbing systems. One of the advantages of BIM versus traditional CAD is a database information link containing data regarding the entities within the BIM. Among the attributes contained with BIM are documentation, spatial reference, time, cost, operational applications, and related applications (contracts, purchasing, suppliers, procurement solutions, etc.). The existing spatial data necessary for this system can be supplied by surveyors using a variety of methods but not many have implemented the software.

    Technology, availability, cost of entry and overall usefulness

    Surveying instruments and measuring techniques has turned a significant corner in the past two decades. While conventional measurement methods are still used (including steel tapes, laser-based total stations, and GNSS receivers), more types of sensors are being introduced to enhance the accuracy and expand the volume of data points being collected. Scanners, using phase-based and time-of-flight methodologies, are now more popular than ever as ease of use has increased while the cost of ownership has greatly decreased. Ground-based and mobile LiDAR used to be only available to large firms and the government, but new models are being introduced at price points affordable to many surveyors. Many articles have been written regarding the lightspeed adaptation of surveying, engineering and construction firms with UAV use of photogrammetry methods to quickly map areas that were previously inaccessible and meeting standards not thought possible. We are also seeing more implementation of new scanning methods, including SLAM (simultaneous localization and mapping) using handheld and backpack devices.

    The common thread for all these technologies and methods is one thing: georeferencing. What was once nearly impossible is now a reality; data collection from various methods all being located within a common horizontal coordinate and vertical datum systems. The ability to obtain literally millions of data points with high-accuracy horizontal and vertical values is phenomenal with most of the credit going to the United States Department of Defense and their implementation of the GPS. Yes, the technology of scanners and data collection would have been invented without the overall coordinate tie-in but having the ability to reference that same data to a common system is the key.

    Also key to the smart city data collection methodology is the surveyor as the expert measurer. A trained and experience surveyor can lead the data collection of significant projects, including location of existing improvements and establishment of future installations. From establishment of parcel/right-of-way lines to integration of point clouds from scanners and photogrammetry, the surveyor can assemble this data together to provide the groundwork for successful analyzation and planning. By combining data from various areas of a municipality, including utility atlases, existing improvements, and future expansion plans, a database can be created in which a smart city will rely upon for oversight and monitoring. The surveyor fills a vital role to determining the accuracy and effectiveness of data like no other profession and should not be overlooked when assembling a team for the creation of a smart city.

    Future opportunities

    Like all technological discoveries and enhancements before, the future is bright with many possibilities to increase the effectiveness and efficiency of a smart city. More types of sensors are being introduced on a regular basis and in every way imaginable, including wireless communication, RFID tags, and microelectromechanical systems (MEMS) devices.

    Image: GetKidsintoSurvey.com & www.elaineball.co.uk
    Image: GetKidsintoSurvey.com & www.elaineball.co.uk

    One of the latest buzzwords is the “Internet of Things” (IoT), with many new devices being created to interconnect a network of web-enabled computerized devices using microprocessors, a variety of sensors and wireless communication hardware to gather, transmit and perform actions on information acquired from their environments. IoT presents advantages to users by enabling them to monitor their overall business processes and improve the customer experience. These actions can also precipitate changes to allow the company to save time and money, enhance employee productivity, integrate and adapt business models, make better business decisions, and generate more revenue.

    As discussed in previous articles (GPS World March 2018 and GPS World November 2018), the next big technology to look forward to is the telecommunications upgrade to 5G. Once a full 5G network is running with extended coverage, we can look forward to new opportunities for indoor location services with similar accuracy to our existing GNSS capability.

    What’s next?

    The technology sector will continue to push the limits of computing speed, physical size and data capacity looking for the “next big thing.” The surveying profession has enjoyed many of the fruits of that success so one has to imagine that many more advances will be coming soon. Smart cities will continue to evolve as citizens of Earth keep migrating to the urban areas and forcing the existing infrastructure to expand or face failure. Surveyors will continue to help provide a variety of services to those citizens and municipalities, with an eye on the future for more advancing technology. I can’t wait to see what is next.

  • Surveyors and GNSS in 2018 — A look ahead to 2019

    Surveyors and GNSS in 2018 — A look ahead to 2019

    Calendar pages allows seem to fly by quickly, and 2018 was no different. While many of the items discussed in last year’s review continued to be topics of advancement, there are several new sources of technology, data collection and potential issues for surveyors going into the new year.

    Let’s look back at the stories that affected the surveyor and their use of GNSS technology in 2018.

    FCC broadband accuracy

    The race across America to provide better broadband coverage hit a snag late in 2018 when critics of the Federal Communications Commission (FCC) voiced their displeasure with the accuracy of maps produced to depict the coverage of broadband access.

    These critics are pressuring the FCC to verify internet coverage and speed of data availability in rural areas as reported by the broadband companies.

    The FCC unveiled a new broadband map in February 2018. (Image: FCC)
    The FCC unveiled a new broadband map in February 2018. (Image: FCC)

    These broadband companies are only required to report on the advertised availability and data speeds and not the actual coverage/speed of the installed networks. Critics of the FCC have found that information used from the broadband providers overstates the available speeds and number of internet service providers, thus allowing the FCC to produce mapping of broadband that is not correct.

    Because of this incorrect reporting, it is estimated that almost 40 percent of rural America doesn’t have access to broadband data with no formal plan of rectifying this situation. The FCC has stated that they will investigate these coverage maps in order to determine if monies distributed to broadband providers were not used in accordance with the promised delivery of coverage and data speed.

    Why does this matter to surveyors? As previously discussed in past columns, the reliance on the real-time network capability of GNSS is one of the biggest time and production savers for the surveyor and for those working in rural America is no exception.

    Not just in small towns but out in the open where large parcels are being surveyed for many different reasons, including pipelines, wind and solar installations and title conveyances. By having broadband available use by surveyors, these tasks can be accomplished with shorter timeframes and less steps to keep critical data in compliance with established coordinate systems.

    Geospatial Data Act

    On Oct. 5, 2018, the Geospatial Data Act (GDA) was signed into law as part of the FAA Reauthorization Act (see Geospatial Solutions, “Geospatial Data Act will bring huge changes to America, and the world“).

    While this bill received lots of attention because of the FAA implications, the portion of the bill concentrating on geospatial oversight will have a lasting effect on the governance and development of the national mapping industry.

    For many years, the ever-developing amount and sources of geospatial data has been growing within several different agencies of the United States government. This bill was established to help streamline the efforts and availability of geospatial data by assigning specific agencies to oversee the development and introduction of new technologies.

    The biggest takeaway from this bill will be the reduction of agencies working on concurrent data sets for public and private use and therefore streamlining the opportunities to introduce newly acquired information into critical programs, (such as FEMA floodplain mapping, GAO asset management, etc.).

    Part of the reason I wish to highlight this bill was the efforts of the National Society of Professional Surveyors (NSPS) to keep the state professional licensing laws intact, the use of private sector businesses for providing surveying services, and to keep quality-based selection (QBS) as the primary tool for awarding contracts for procurement services.

    Because of the actions and reasoning by NSPS, the authors of the bill withdrew the language that would allow “low bid” opportunities within these contract awards. This influence by NSPS is a prime example of how a profession can influence legislation through our democratic process.

    Galileo implementation, Beidou installation, GPS Block III launches

    SpaceX’s Falcon 9 rocket orbited the first GPS III satellite on Dec. 23, 2018. (Photo: SpaceX)
    SpaceX’s Falcon 9 rocket orbited the first GPS III satellite on Dec. 23, 2018. (Photo: SpaceX)

    In November 2018, the FCC opened a new chapter in GNSS observation by approving a waiver to allow GNSS receivers to utilize Galileo transmissions for location determination without a specific FCC license. Traditionally, the FCC would require licensing of public, receive-only GNSS equipment used with any foreign-based systems but worked with several US agencies to create a waiver to allow faster implementation to use the Galileo signals.

    It should also be noted that the Chinese government has been rapidly building the latest stage of their own GNSS constellation, the BeiDou system. The United States and China have been promoting cooperation to allow each side to better understand the current workings of GPS and BeiDou, (GPS-BeiDou Statement). China is currently completing its third phase of the navigation system that potentially will surpass the United States GPS constellation in data availability and accuracy, (See GPS World “Directions 2019: BeiDou accelerates global deployment,” December 2018).

    Not to be outdone, the U.S. has begun its implementation of their next wave of satellites, the GPS III containing the latest technology, the L1C civil signal, with improved accuracy and anti-jamming programming. On Dec. 23, the SpaceX Falcon 9 rocket delivered the GPS III SV01 into its intended orbit (SpaceX Launch) with more launches scheduled for additional satellite vehicles in 2019.

    These efforts to increase satellite coverage and accuracy will only improve the use of GNSS receivers by surveyors. While I look forward to software and receiver upgrades to take advantage of the newer birds, we still need a backup plan in case of international conflicts and a reduction/discontinuation of GNSS service.

    GPS and terrestrial backup

    Image: @SENTEDCRUZThe Frank LoBiondo U.S. Coast Guard Authorization Act of 2018, which also included the National Timing Security and Resilience Act, was signed into law on Dec. 4 and directs the Secretary of Transportation to establish a terrestrial back system for the U.S. satellite navigation system within a two-year period (see  “GPS to get terrestrial backup system”).

    The bill lays out specific conditions for the backup plan:

    • terrestrial
    • wireless
    • synchronized to UTC
    • difficult to disrupt
    • able to penetrate underground and inside buildings
    • capable of deployment to remote locations
    • expandable to provide position, navigation and timing (PNT), and
    • able to work in concert with similar systems such as eLoran.

    However, this bill did not provide any funding for the creation of this system but now allows the introduction of appropriations in future bills and acts. As I have written in past columns (see “The day GPS went away,” September 2017), it won’t be a matter of if but when something happens to our current GNSS capabilities and we need to develop this backup plan yesterday.

    Dual-band GNSS cellphones as the new norm

    My last submission featured the latest in chipset for cellphones and utilizing dual-frequency GNSS signal reception. Xiaomi, based in Beijing, China, introduced the Mi 8 phone with a dual-frequency GNSS chip in the Spring of 2018 to rave reviews.

    This chip frequency reception (E1/L1+E5/L5) is targeted to embrace the Galileo and GPS constellations for increased accuracies (within a decimeter) well beyond the current norm for smartphones (typically 1-3 meters +/-).

    Since then, Xiaomi has released the Mi Mix 3 and Huawei has released the Mate 20, Mate 20 Pro and Mate 20 X, all with dual-frequency chipsets. However, all of these phones are not available in the U.S., and the security issues with Huawei has been well documented (CNBC Report, February 2018).

    The reason I still bring these up for the surveyor is because soon we will have dual-frequency capability on the phone in our pockets here in the U.S. Such phones can greatly increase efficiencies, especially when used during reconnaissance efforts. I believe many more phone manufacturers will begin to incorporate dual-frequency chips in their future models to increase location accuracies for the users and take advantage of upcoming network enhancements (see GPS World “Dual-frequency GNSS smartphone hits the market,” June 2018.)

    Surveyors vs. technology disruptors

    The Mi 8 smartphone offers dual-frequency capability. (Image: Xiaomi)
    The Mi 8 smartphone offers dual-frequency capability. (Image: Xiaomi)

    One of the biggest stories in the surveying world made national headlines after a start-up “GEO-spatial” consultant created by retired bankers was sued by the Mississippi Board of Licensure for Professional Engineer and Surveyors for having “engaged, and continues to engage in the practice of surveying while not licensed by the Board.” (Madison County, Mississippi, Chancery Court.) While the initial suit remained under the national radar, the countersuit by the consultant and subsequent articles in national websites brought the situation to the front page.

    The issue at hand is the creation of “plats” combining a legal description for a parcel with a high-resolution photo (captured by various means, including UAV) and depicting said legal description on the photo for use by banks and other financial institutions for risk evaluation. Their argument is that they have “First Amendment rights” to provide public information (the legal description) on a recent aerial photograph in order to provide an exhibit for lenders to review and make loan decisions. Banks are now paying much less in fees to this company for an exhibit instead of a Plat of Survey provided by a licensed surveyor, yet the exhibit provides no assurance (or certification) to its validity and/or any metadata for the represented information.

    The subsequent articles by both Bloomberg and Ars Technica writers liken the situation to Airbnb versus hotels and Uber/Lyft versus taxi drivers as a new “disruption in technology” brings forth change to previously licensed professions. In fact, the author of the Bloomberg article stated, “the clients are sophisticated, and they’re not complaining.”

    Using this mentality, we could apply it to any licensed profession and allow services normally regulated by laws to be administered by non-professionals, as long as the client “is sophisticated and not complaining.” This means anyone can provide accounting, medical, dental or even law services if the client is satisfied. As previously published here, (see GPS World “Accuracy, precision and boundary retracement in surveying” July 2017), a boundary survey is not simply a mathematical figure from a legal description. It takes a trained person to know how to properly relate a legal description to a physical parcel and professional licensing provides that assurance (and protection) to the public.

    This situation falls squarely in the GNSS wheelhouse for surveyors, especially as technology advances and accuracies become smaller with progress, (i.e. GPS Block III, BeiDuo, Galileo, etc.) and the ability to measure with higher positional accuracy, (i.e. Xiaomi Mi 8 and other to follow).

    The surveying profession has joked for years that when these technologies do come forward, many unlicensed “professionals” will come forward with their measuring devices (phones) and locate property lines as part of their service.

    But for now, it isn’t just the physical location by GNSS measurement we should worry about; it is the high-resolution photo software, GIS data sources and those folks enterprising enough to put all this information together. The surveying profession will need to ramp up its message to public to help better define what the licensed surveyor provides versus the “we can do it much cheaper and faster” stories. More often than not, you get what you pay for.

    Data collection advancements

    Emlid Reach RS w/ iPad Photo: Tim Burch (SPACECO Inc
    Emlid Reach RS with iPad. (Photo: Tim Burch)

    While 2018 didn’t see any revolutionary changes to GNSS data collection, several small advances are noteworthy. Besides the previously mentioned dual-frequency cellphones, we are also seeing more integration with the cellphones themselves as data collectors in conjunction with stand-alone GNSS receivers (see GPS World “University research uses smartphones for precision GNSS,” September 2018).

    Several of the major survey equipment manufacturers are joining a group of small GNSS start-ups by introducing single- and dual-frequency receivers to work with both Android- and iOS-based phones and tablets for more cost-effective positional solutions.

    Another trend that is becoming very popular is the use of post-processing kinematic (PPK) solutions with many of the newest models of multi-rotor and fixed wing UAVs. The early (and expensive) trend of aerial vehicles produced by the major surveying equipment manufacturers insisted on installation of a dual-frequency RTK receiver in order to provide a more robust control system for the orthometric photo process. Because there is still a need to combine the still photos from the UAV flight via various “stitching” software, the need (and expense) of RTK within the receiver, while a nice feature, has become overkill for most aerial needs. However, there are times and applications when a fixed-RTK location could be useful, especially during emergency situations when needing to utilize the UAV for live streaming purposes.

    Propeller Aeropoint w/ DJI Inspire 2. Photo: Brian Kravets (SPACECO Inc.)
    Propeller Aeropoint w/ DJI Inspire 2. (Photo: Brian Kravets, SPACECO Inc.)

    The last big trend to gain popularity comes from Propeller, a young tech company from Australia that provides both a control point product and data reduction/reporting service. Their revolutionary ground control point (GCP) target, the Aeropoint, is becoming a very popular item for UAV pilots worldwide. These 24-inch (61-CM) square foam targets contain a single-frequency GNSS receiver that collects RINEX data while performing your UAV flight. Spread these targets around your site, setup and perform your survey, then download the target data to the Propeller app on your phone/tablet. The app automatically uploads the data to the company’s site and processes the geographical location for each target into your chosen coordinate system. It truly is that simple and the Propeller folks have made it easy to use. Their online software, Propeller Platform, is also available for photo/data processing and site analysis/visualization/volume computations. They, too, are now teaming with DJI to offer PPK solutions combining Aeropoint data along with Phantom 4 RTK photo data in a convenient, streamlined process.

    For 2018, our firm (SPACECO Inc) expanded our UAV program in several ways to take advantage of these trends. First, we been using the Emlid Reach RS single-frequency GNSS receiver utilizing a Bluetooth connection to an iOS-based tablet to GCP’s for our UAV program. The receiver’s low cost and ease of use with an RTN network has been a pleasant change from typical surveying equipment. We also use Propeller’s Aeropoints in locations where the RTN coverage is not readily available. For sites that are substantial (typically 300 acres+), we often send our data to the Propeller Platform for photo stitching and data reduction to take advantage of their computing power.

    WingtraOne. Photo: Brian Kravets (SPACECO Inc.)
    WingtraOne. (Photo: Brian Kravets, SPACECO Inc.)

    Lastly, we wanted to expand our fleet of quad-rotor UAV’s to include a fixed wing model for larger sites. A visit with the Wingtra crew at InterGeo 2017 in Berlin convinced me that a vertical take-off and land (VTOL) model would be a great addition, so we took delivery of our WingtraOne this past summer. The ease of use and amount of project space the Wingtra can cover was already great but we’ve added the PPK module to reduce the amount of GCP’s necessary, especially in inaccessible areas. All these additions to our survey department (carefully vetted and purchased; no freebies from any of the manufacturers!) have provided new ways to expand our services to our clients and allows us the opportunity to enjoy what we do along the way. It is my pleasure to report from personal experience that these trends are solid and will continue to increase our abilities and productivity for days to come.

    What’s next for 2019?

    Some of the items I see gaining traction in 2019 will include additional sensors for UAV’s (LiDAR, hyperspectral, infrared), continued improvement in cost effectiveness of laser scanners and LiDAR, increased interest in SLAM (simultaneous localization and mapping) technology and, of course, more geolocation services tied into autonomous vehicles/delivery. Will 2019 be the year Amazon drops my packages by UAV at my front door? As fast as these technologies are developing, I wouldn’t bet against it.