Author: Tim Burch

  • Coordinating surveyors on where we draw the lines

    Coordinating surveyors on where we draw the lines

    Technology changes the rules of the game, and surveying may be more in its crosshairs than the profession will admit

    Maps have existed for centuries. The lines on maps indicating the boundaries of political and administrative units — cities, counties, states, and countries — are graphic representations of the limits of those entities. These lines don’t, however, typically exist in real life. There isn’t a large line between the United States and Canada stretching from the Pacific Ocean, through the Great Lakes, and onto the Atlantic Ocean.

    The same goes for latitude and longitude lines on maps and globes. The public generally accepts the various delineations on maps as being somewhat accurate with an unwritten level of trust in those who have produced these maps.


    Definition

    trust: assured reliance on the character, ability, strength, or truth of someone or something.


    Here are the guidelines surveyors use for determining surveys.

    1. lines physically verified in the field and proven from evidence
    2. monuments and/or boundaries set and called for within legal descriptions
      • natural monuments
      • artificial monuments
    3. adjoiners (to determine junior/senior rights)
    4. courses
      • bearings, then distances (metes and bounds states)
      • distances, then bearings (public land survey states)
    5. recitation of area
      • controlling description
      • evidentiary description
    6. coordinates: local and/or geodetic

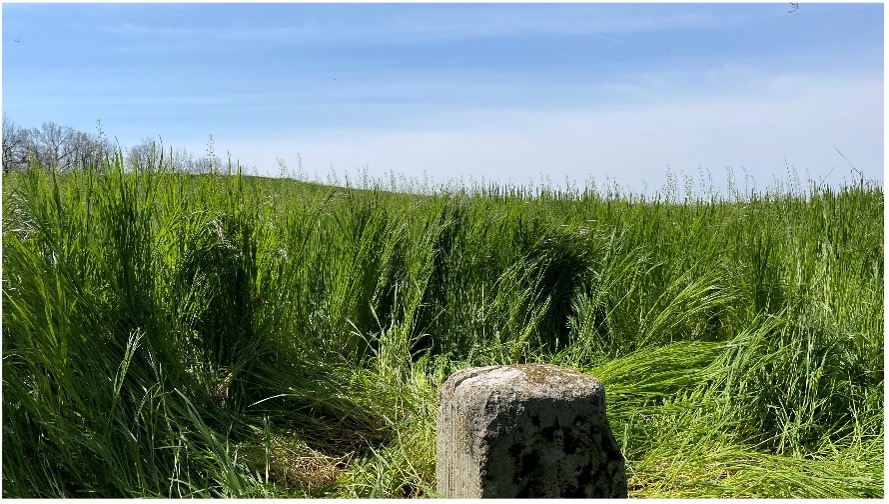
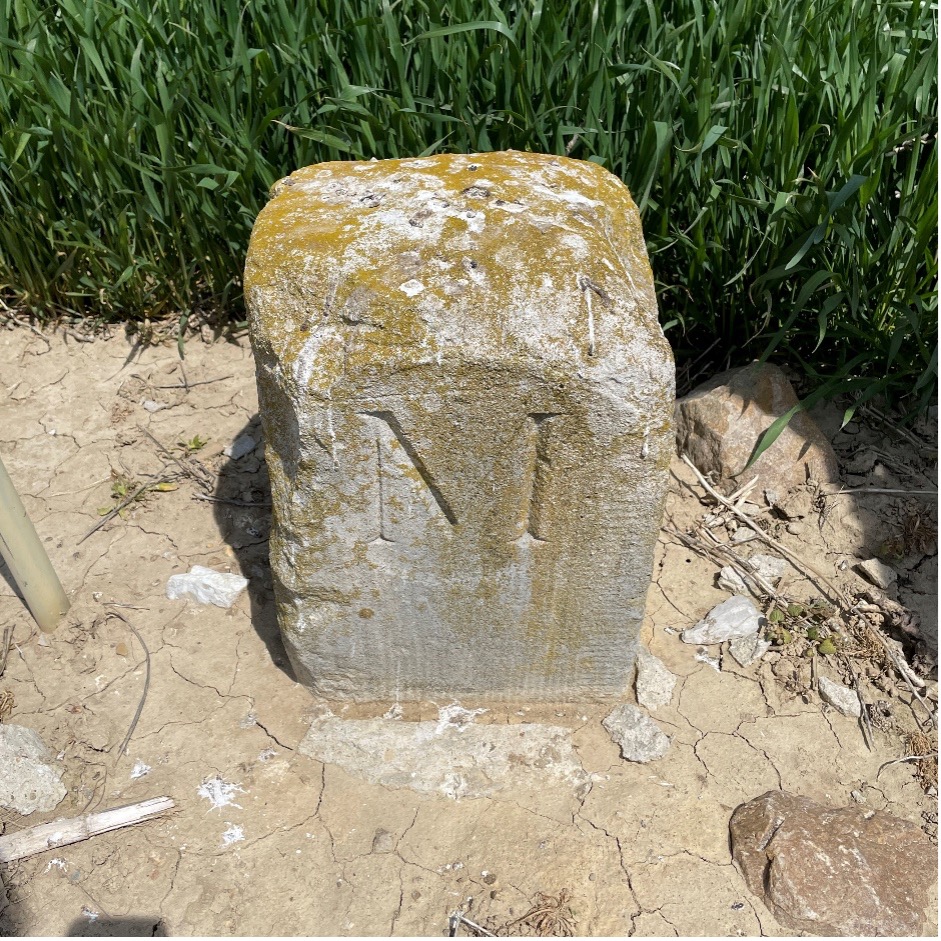
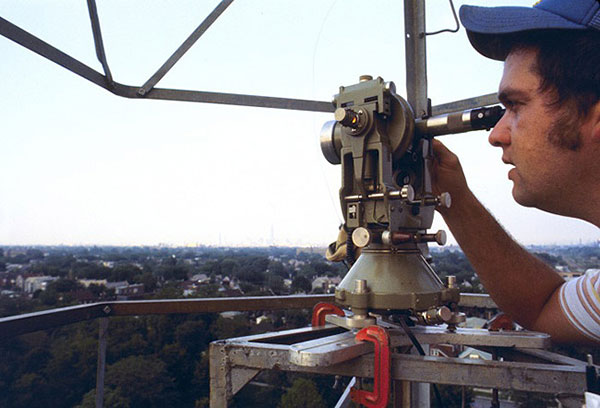
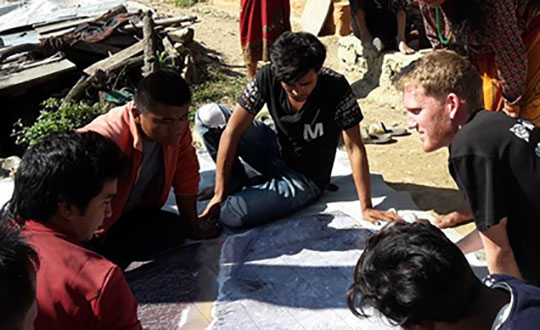
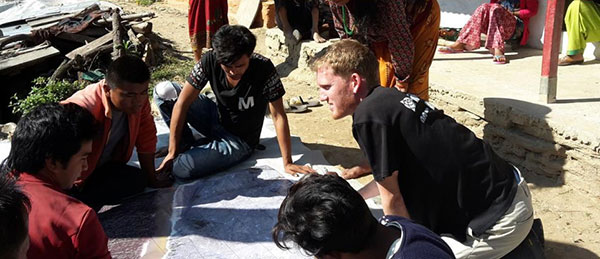
    Surveyors rely on physical monuments, title documents and evidence of occupation to assist with the establishment of not just major dividing lines, but all lines of property, public or private. Finding, setting and honoring physical monuments has been a significant character trait of the surveyor for as long as maps have existed.

    Monuments are placed to determine the endpoints of these lines as depicted on maps or plats, but what happens when technology introduces new ways to re-establish these lines? What will happen to our monuments when technology — more specifically those who utilize them — deems them obsolete?

    The guidelines above are known as “priority of calls” or “rules of construction” by the surveying community. These items have provided the instructions for surveyors to follow in retracement of lines for many years. However, like nearly everything else in our modern world, technology has a hand in modernizing even this time-honored “surveyor’s code of retracement.”

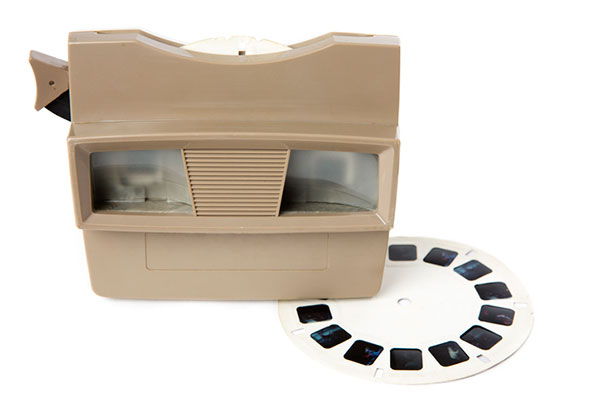
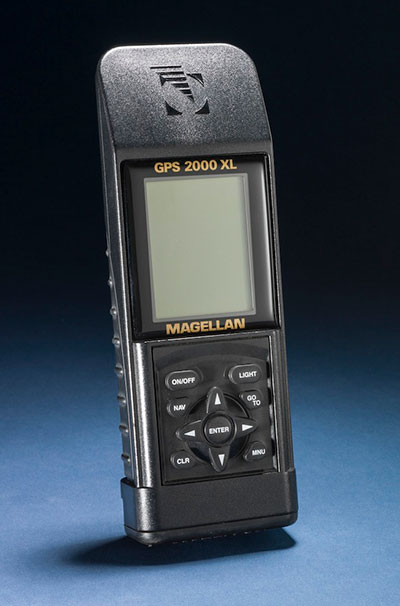
    Who would have guessed that the rotary phone dial would give way to touch-tone buttons, that the system would jump from landlines to cellular and satellite signals to remote handsets, then progress to receivers evolving away from physical buttons to touchscreens?

    Technology changes the rules of the game, and surveying may be more in its crosshairs than the profession will admit.

    Here come the numbers

    Note that the last entry in the above guidelines for survey retracement is “coordinates.” In accordance with most accepted lists, coordinates can be local or geodetic. These coordinate values are generated by surveyors, geodesists and public agencies; they can be found on plats, and in records and websites kept by government agencies.

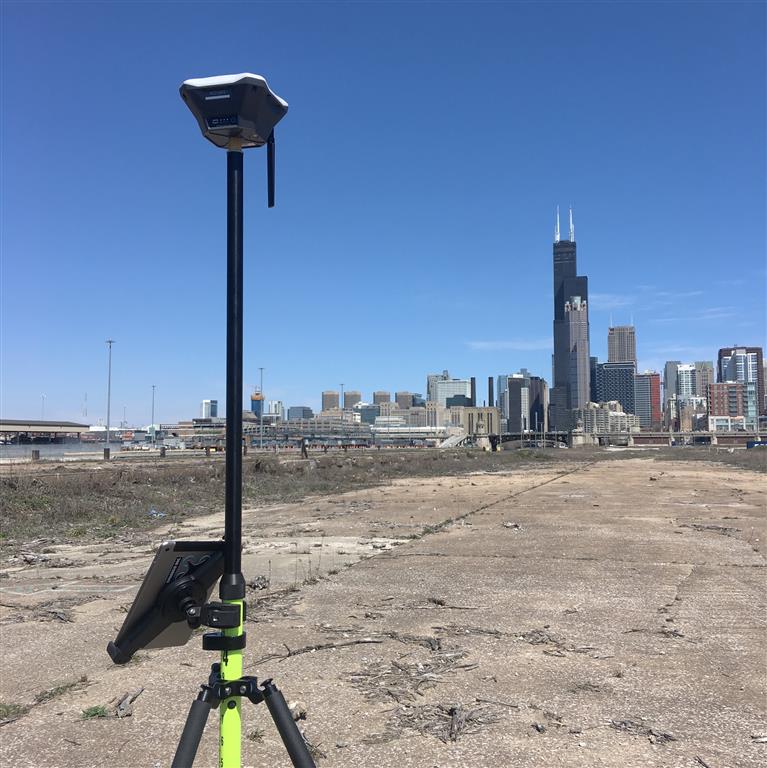
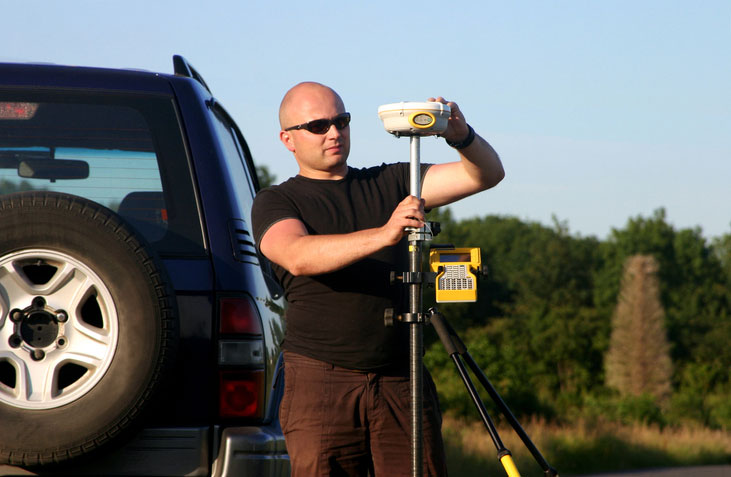
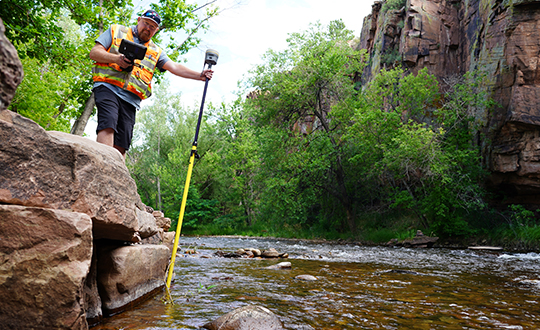
    Now that we are more than two decades into the 21st century, it would be safe to say that most of the surveying profession uses an established geodetic coordinate system. The use of GNSS receivers is widely accepted as normal practice by many surveyors because these systems are much more user friendly than in years past. Additional constellations have added to the availability and accuracy of GNSS positional values, so utilizing state plane coordinates has become the norm.

    We are now surrounded by something that has an incredible impact on our profession and the world around us. We are placing trust in a georeferenced coordinate system that cannot be identified by any of our senses, like we can with a physical monument.

    A coordinate cannot be seen, touched, tasted, heard or smelled.

    We are placing our full trust in a reliable position on Earth as determined by our GNSS receiver working within a published coordinate system. Because of these advancements in technology, a new generation of geospatialists is insisting we should revise the way we survey, because technology provides much higher precision and accuracy.

    Just like lines on a map or plat, coordinates only exist as a calculation of a position on the face of Earth. So why is there animosity in trusting coordinates over the more traditional items on the list of retracement guidelines? It may have to do with the fact that the ground we are surveying is not in the same place it was a short time ago. Depending on where you live, it may have moved more than you think. For more information on the shifting ground we live on, let us dig into some research about our continents.

    Pangea: Description of moving land masses

    (Text from USGS.gov)

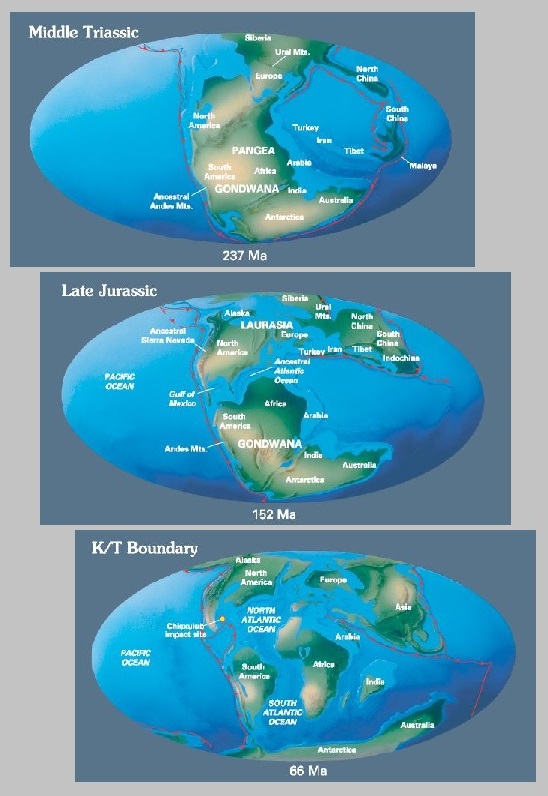
    From about 300-200 million years ago (late Paleozoic Era until the very late Triassic), the continent we now know as North America was continuous with Africa, South America and Europe. They all existed as a single continent called Pangea. Pangea first began to be torn apart when a three-pronged fissure grew between Africa, South America and North America. Rifting began as magma welled up through the weakness in the crust, creating a volcanic rift zone. Volcanic eruptions spewed ash and volcanic debris across the landscape as these severed continent-sized fragments of Pangea diverged. The gash between the spreading continents gradually grew to form a new ocean basin, the Atlantic. The rift zone known as the mid-Atlantic ridge continued to provide the raw volcanic materials for the expanding ocean basin.

    Meanwhile, North America was slowly pushed westward away from the rift zone. The thick continental crust that made up the new east coast collapsed into a series of down-dropped fault blocks that roughly parallel today’s coastline. At first, the hot, faulted edge of the continent was high and buoyant relative to the new ocean basin. As the edge of North America moved away from the hot rift zone, it began to cool and subside beneath the new Atlantic Ocean. This once-active divergent plate boundary became the passive, trailing edge of westward moving North America. In plate tectonic terms, the Atlantic Plain is known as a classic example of a passive continental margin.

    Today, the Mesozoic and Cenozoic sedimentary rock layers that lie beneath much of the coastal plain and fringing continental shelf remain nearly horizontal.

    Image: USGS
    Image: USGS

    In geologic terms, a plate is a large, rigid slab of solid rock. The word tectonics comes from the Greek root “to build.” Putting these two words together, we get the term plate tectonics, which refers to how the Earth’s surface is built of plates.

    The theory of plate tectonics states that the Earth’s outermost layer is fragmented into a dozen or more large and small plates that are moving relative to one another as they ride atop hotter, more mobile material. Before the advent of plate tectonics, however, some people already believed that the present-day continents were the fragmented pieces of pre-existing larger landmasses (“supercontinents”).

    The diagrams below show the break-up of the supercontinent Pangaea (meaning “all lands” in Greek), which figured prominently in the theory of continental drift — the forerunner to the theory of plate tectonics.

    Image: USGS
    Image: USGS

    Continental drift, plate tectonics and prime meridians

    Historians and other scientists have theorized about Pangea for centuries. Common soil types, fossils, and other evidence found on different continents help to solidify the concept of Pangea. Items discovered on the west coast of Africa have many similarities with those found on eastern South America. The physical evidence is quite convincing that an earlier supercontinent existed millions of years ago.

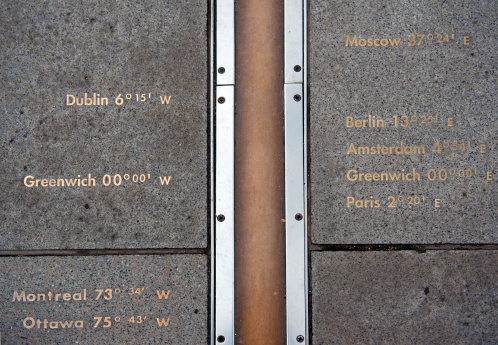
    Now, let’s apply a fixed measurement system with lines upon Earth that defines latitude and longitude. In the past, geodesists, geographers and mathematicians established various “prime meridians” around the world to serve as a basis for maps. Locations and cities used included Amsterdam, Antwerp, the Bering Strait, Bern, Brussels, Copenhagen, Florence, Giza, Jerusalem, Kyoto, Lisbon, Madrid, Naples, Oslo, Paris, Philadelphia, Pisa, Rio de Janeiro, Rome, Stockholm, Warsaw and Washington, D.C. (in four different places!), just to name a few.

    Thankfully, scientists gathered in the 19th century to agree upon a singular “initial meridian” that would pass through Greenwich, England, and was based upon several centuries of astronomical observations at the nearby Royal Observatory.

    For approximately 100 years, mapmakers (and geodesists) used the new Prime Meridian at Greenwich as the beginning baseline for longitude determination around the world. After all, it was based upon years of astronomical observations and solved the age-old problem of where longitude starts. (Latitude was a much easier calculation for astronomers and geodesists, but that story is for another day.)

    Photo: majaiva/iStock/Getty Images Plus/Getty Images
    Photo: majaiva/iStock/Getty Images Plus/Getty Images

    The late 20th century and the fourth industrial revolution

    Technology, once again, provides us with conflicting results. While most technological advancements are game-changing improvements to mankind, they also tend to shake up information and standards that have existed for many generations. Like the previously discussed advancements in telephones, technology makes us change the way we look at things and how we go about our lives.

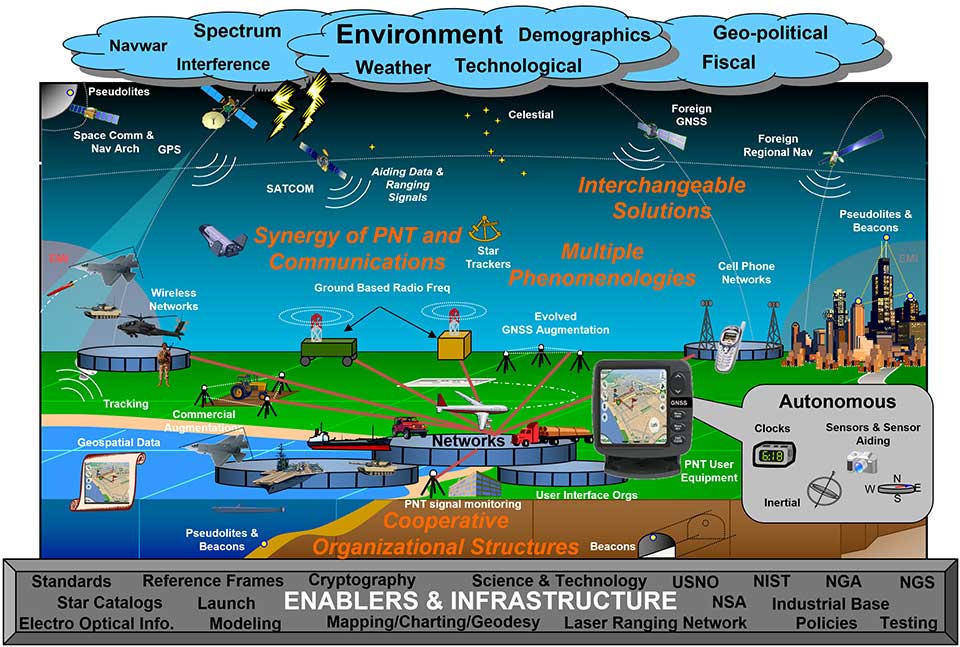
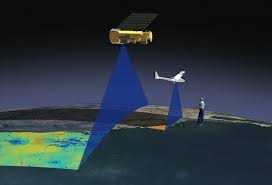
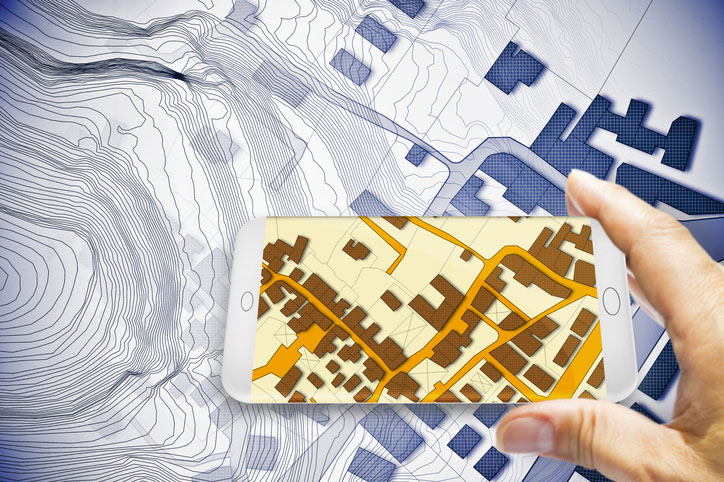
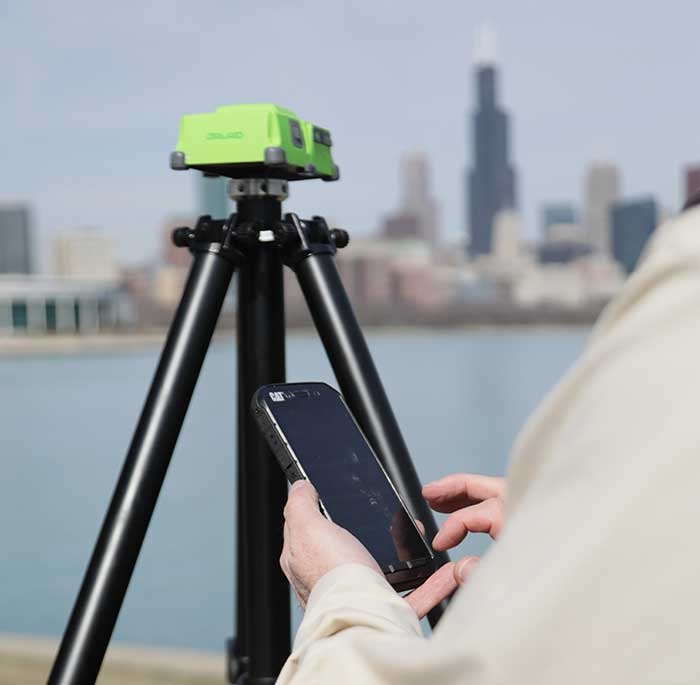
    Mapping has become a central part of our everyday lives. Georeferenced positions for literally everything is now a standard characteristic of many functions within our environment, especially in our surveying world. Most of these improvements are due to GPS, which was originally developed for the U.S. military to guide and assist with positional location of our defense systems in relation to our enemies. We use this same precise technology to establish positional locations for boundary points, infrastructure and topographic information.

    Image: Burch
    Image: Tim Burch

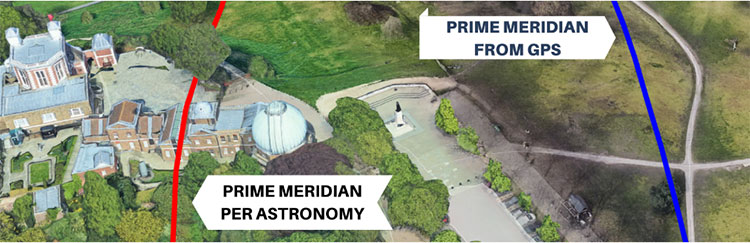
    We have also used GPS to learn much about our tectonic plates and varying movement of the continents.The first thing we learned is that the Prime Meridian established in 1884 does not fall in the same place as our 0° latitude designation as determined by GPS/GNSS calculations.

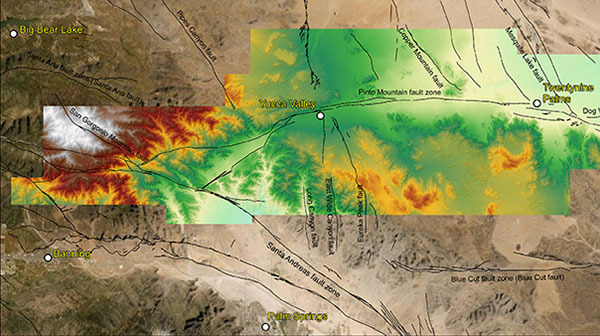
    This finding, however, is not the telling item within our adaptation of GPS data; it came when various agencies established the continuously operating reference system (CORS), composed of static GPS base stations. CORS stations, while used to help establish new survey positions in relation to a known reference location, also measure a continuous drift of latitude and longitude positions over time.

    The National Geodetic Survey (NGS) is in the process of finalizing a new reference framework for establishing coordinate values that utilize time as a core component. Future implementation of the new National Spatial Reference System (NSRS) will require the additional attribute of time within the metadata of any new values.

    Read more in David Zilkoski’s Survey Scene column.

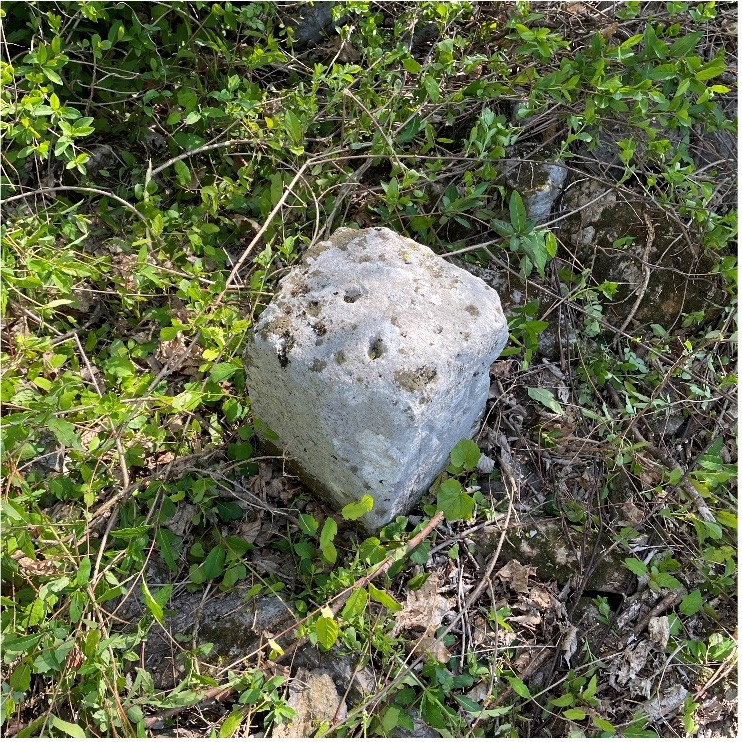
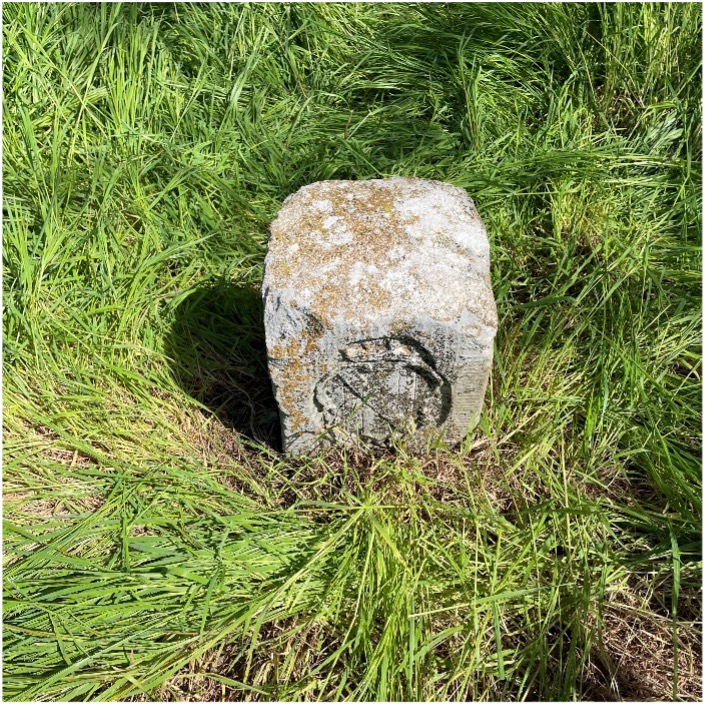
    The reality of ‘moving’ monuments

    So how does this affect surveying and the monuments we surveyors hold on such a high pedestal? The answer varies depending on who one asks. Most surveyors will continue to hold the “priority of calls” as listed above. Several practitioners, however, want to move coordinates higher up the list because of technology, and the ability to retrace a published point because of the increase in technology and the higher accuracy and precision of today’s GNSS.

    This is possible if the user of the technology follows the procedures as established by NGS with metadata and accurate timing, but there are still several variables in the setting and retracing methodologies. When was the last time the equipment was calibrated? Was adequate research performed to minimize environmental errors? Was there any interference due to solar storms or multipath? There are many potential issues a surveyor can face, but few are checking all the boxes when performing highly accurate and precise positional measurements.

    Technology has brought surveying into the 21st century with GPS/GNSS and ever-increasing accuracy and precision. It should also be the profession’s goal that the technology does not override what the general public can see. They can see monuments, fence lines, buildings and other improvements, but they cannot see coordinates, which remain invisible to the naked eye. Technology may change that in the future, too, but until that time, we must rely on what we can see.

  • Mapping the original stones along the Mason-Dixon line

    Mapping the original stones along the Mason-Dixon line

    Mason and Dixon were pioneers in bringing geodetic astronomy to the American colonies. Through the efforts of the Mason and Dixon Line Preservation Partnership, we can promote this scientific contribution along with the placement of the boundary stones.

    Ask surveyors why they became engaged in the profession and why they had continued with it, most will centralize on one aspect: working outside. A career that allowed them to work outside in various environments, solving problems, and being part of a solution is typically the main answer they give.

    Depending on the task at hand, a day in the field surveying can take one to several places, including urban/suburban neighborhoods, construction sites, and agricultural/wooded farmland.

    View from Mason Dixon Stone #95 looking toward Maryland (Image: Tim Burch)
    View from Mason Dixon Stone #95 looking toward Maryland. (Image: Tim Burch)

    My entry into surveying was no different. From residential sites, condominium surveys, boundary and topographic surveys, and construction layout, my early years in surveying covered a lot of territory. While my career eventually took me out of the field and into an office managerial role, and now into leading a professional association, it does not erase the roots of one’s surveying knowledge and experience. Opportunities to be part of the field exercises of a survey, especially a boundary survey, are typically rare and subject to time constraints.

    Having spent all my life in the flat topography of Illinois and surrounded by farm fields and urban sprawl, the ability to see for miles over the various horizons was the norm. Coupling these conditions with the Public Land Survey System (PLSS) and use of GNSS technology, it makes for a great environment for the professional surveyor to go about his or her work.

    However, the United States covers many areas and contains distinct types of terrain, ecosystems and demographic groups that provide challenges to the surveyor. While I assumed moving from Illinois to the mid-Atlantic region would require adaptation, an opportunity to help retrace and inventory a significant part of American history provided me with an eye-opening experience. It also helped me appreciate the legacy of our surveying forefathers.

    A small title dispute

    Even in the 17th and 18th centuries, disagreeing title descriptions to common lands was an issue. Reviewing two conflicting legal descriptions describing adjacent land boundaries is the basis of this survey exercise, and thus began a symbolic establishment of a famous boundary line that would lead to political and demographic ramifications in later years.

    Here is the situation:

    1632: King Charles I grants to Cecilius Calvert (second Lord Baltimore), a royal charter for establishing a new colony north of Virginia to a point “which lieth under the Fortieth degree of north latitude” and westward to the source of the Potomac.

    1681: King Charles II (eldest son of Charles I) grants William Penn a royal charter of land between 43° N and a line extending westward from “a Circle drawn at twelve miles distance from New Castle…” to “the beginning of the fortieth degree….”

    1682: King Charles II grants to William Penn an additional grant in the Delaware peninsula, which Lord Baltimore claimed.

    1685: King Charles II directed his Board of Trade and Plantations to issue an edict ordering that territory to be divide equally, the western half going to Baltimore. This order endorsed Calvert’s claim of a boundary line being 19 miles to the north and providing him claim to Philadelphia. Part of the edict placed a burden on Calvert of providing a survey to authenticate the claim, but the survey was not completed. The boundary would eventually be established 19 miles to the south.

    1731-1732: Charles Calvert, the fifth Lord Baltimore, petitioned King George II for help in demarcating the final boundary. He agreed on the final boundaries; however, a commission created to study the legal claims failed to deliver instructions in which a survey would be based upon. Calvert disputed its interpretation and refused to implement the arrangements.

    1730s: Ongoing conflict over the disputed land claimed by both people from Pennsylvania and Maryland resulted in Cresap’s War, named after the land agent, Thomas Cresap, hired by Calvert to settle new development. In 1736, Cresap was accused of murder, arrested by Pennsylvania officials and his housed burned was burned down.

    1750: After years of bitter controversy, British Lord Chancellor Hardwicke ruled that the southern boundary of Pennsylvania should be a line running westward from the point at which the line dividing the Delaware peninsula was tangential to a circle with a radius of 12 miles from the center of Newcastle.

    After 100+ years of boundary disputes and deadly confrontations, in 1760 Frederick Calvert was directed by the English monarch to accept the terms of the 1732 treaty.

    Penn-Calvert Land Grant Agreement Image: National Archives
    Penn-Calvert Land Grant Agreement. (Image: National Archives)

    The unfilled challenge, however, was to commission a survey to establish the terms of the agreed-upon boundary. Given that the final location of the Pennsylvania/Maryland border was geographically based (approximate latitude of N 39°43’20”), the surveyors chosen to establish this line would have to be knowledgeable in such calculations.

    Finding qualified surveyors in the colonies turned into a bigger challenge than first considered, so the monarchy assigned two surveyors from the Royal Society (full name: Royal Society of London for Improving Natural Knowledge). Enter Jeremiah Dixon (surveyor) and Charles Mason (astronomer) — the field party charged with tackling this monumental deed.

    Charles Mason – Survey Calculations (Image: National Archives)
    The survey calculations of Charles Mason. (Image: National Archives)

    We know them by name for the lines they established in fulfilling the requirements of the boundary agreement, but how they accomplished their task remains a mystery to most. Previous exercises using geographical position determination was used in the sailing and shipping industries with lesser degrees of accuracy. This assignment would require higher levels of accuracy and precision, hence the reason for calling upon Dixon and Mason for the task.

    By using geodetic astronomy, they were able to determine accurate (for the period) geographical positions of latitude. Geodetic astronomy is the art and science for determining, by astronomical observations, the positions of points on the earth and the azimuths of the geodetic lines connecting such points. It relies on spherical astronomy, using calculations and techniques developed by the Greeks in the second century A.D.

    Besides the knowledge of performing the necessary calculations, the duo would also need to possess instruments to gather the accurate astronomical information. The survey of the agreed-upon line was to be established upon a constant line of latitude. The survey procedures would require turning angles (azimuths) from their meridian westwardly with accuracy not yet utilized in the New World.

    Both instruments used for the project were built by John Bird, a well-respected instrument maker in London. The equipment consisted of a zenith sector, capable of measuring to two arc seconds. No field azimuth instrument of this accuracy existed in that era. They also brought a converted telescope/level set up for surveying purposes. This transit has no divided horizontal “plate,” only a tangent screw for slow azimuth motion.

    In addition to the instruments and astronomical tables from Greenwich and Paris, the duo relied on a highly precise clock for marking time by the second, which was quite advanced for the period.

    Dixon and Mason spent the better part of 1766-67 establishing the agreed-upon line using astronomy via the Bird instruments and taking copious notes documenting their calculations and survey conditions.

    Jeremiah Dixon – Field Notes (Image: National Archives)
    Field notes from Jeremiah Dixon. (Image: National Archives)

    The markers set along the way —stone monuments chiseled back in England with demarcations — were quite accurately established despite the primitive nature of equipment and methodology for the survey. Mason and Dixon laid out the 233-mile long “West Line” in short segments, following the latitude arc of approximately N39°43’20” for 233 miles westward.

    Old line versus new technology

    In 2020, the Maryland Geological Survey (MGS) and the Pennsylvania Historical & Museum Commission (PHMC), members of the Mason and Dixon Line Preservation Partnership, began a new initiative to inventory these historic markers and submit them for inclusion into the National Registry. If accepted, the monuments will be part of a program established to help protect and preserve these physical boundary markers that define the boundary between the two states.

    Part of the inventory has been the recovery and position confirmation by volunteer surveyors from the Maryland Society of Surveyors (MSS) and the Pennsylvania Society of Land Surveyors (PSLS). Using a geographic information system (GIS) app designed and implemented by the Maryland Geological Survey (MGS), volunteer retracers capture significant attributes about each monument.

    While reestablishing the latitude/longitude of the recovered monuments with a smartphone or handheld GPS receiver is sufficient, several volunteers have used high-accuracy surveying equipment to determine a monument’s position.

    Incredibly, the variation in the location of a given monument is well within reasonable tolerances from the originally intended installation. Also, because of GNSS technology, we now know more about continental drift. Because of this additional knowledge, 250+ years of tectonic plate movement should be considered when making these positional comparisons.

    It should be noted that these monuments are a critical component of the boundary between states, and therefore must be considered senior to many other survey corners set after them. We cannot get lost in the sentimental aspect of recovering the monuments and not acknowledge the fact these points are the gospel when it comes to defining these state boundaries.

    A Midwesterner in a ‘foreign’ land

    My surveying career, as noted above, was solely in a state that is 200 years old, based upon the PLSS, and does not carry the history of the Mason-Dixon era of line establishment. So, when I was presented with the opportunity to join fellow surveying professionals from Maryland and Pennsylvania in recovering Mason-Dixon monuments for the inventory, I found it an easy event to join.

    The planned meeting spot was a local fast food place at 8 a.m. on a sunny Saturday. Being it was in a small town, there were several groups meeting for their normal Saturday coffee klatches. Hearing a group mention “surveying,” I found my opening to identify myself as a fellow surveyor. After opening pleasantries, we settled into a game plan for recovering the targeted monuments for the day.

    Planning a day of stone monument recovery (Photo: Tim Burch)
    Planning a day of stone monument recovery along the Mason-Dixon line. (Photo: Tim Burch)

    We settled on our assignments and enthusiastically went about our way. My partner for the day was Eric Gladhill, a Pennsylvania professional surveyor and veteran of Mason-Dixon monument retracement. In addition to his volunteer work, he has also authored several articles and a book on his surveying experiences, so it was quickly evident that we were in for a good day.

    The first monument was not difficult to get to, and seeing it nearly brought a tear to my eye. Here before me was my first sighting of a Mason-Dixon monument stone, and it was simply amazing. Standing there admiring this 250+ year old stone, hand cut and carved in England and brought here by ship to be specifically placed on this line, I could not help but realize the importance of this monument.

    This line, and these stones, were the culmination of two land grants that disagreed with each other more than 400 years ago. We were standing in the same location as a large survey party once did, where they observed the stars to determine an accurate position and directed axmen to clear the untamed forest to establish this important line. While it was a warm and sunny day, it gave me a chill to know we were following in the footsteps of our surveying forefathers.

    Mason Dixon Stone #98 – My first recovery! (Photo: Tim Burch)
    Mason Dixon Stone #98 – My first recovery! (Photo: Tim Burch)

    We continued our way and recovered six more monuments, including a crown stone. Crown stones were placed at 5-mile intervals. The detail in the carvings for most of the monuments was noticeably clear, and is a testament to the craftsmanship of the era’s stonecutters.

    Mason Dixon Stone #95 – “Crown Stone” (Photo: Tim Burch)
    Mason Dixon Stone #95, a crown stone. (Photo: Tim Burch)

    While locating these historic monuments, were felt we were standing on hallowed ground. The location of this line was important enough that people, both indigenous and settlers, fought for the right to build their lives there.

    This was also a line that would be the site of many battles during the Civil War. Observing these monuments drove home the fact that surveyors play important roles in establishing land ownership both today as well as almost 300 years ago.

    Mason Dixon Stone #93 – Maryland side marking (Photo: Tim Burch)
    Mason Dixon Stone #93, a Maryland side marking. (Photo: Tim Burch)

    Mason and Dixon were pioneers in bringing geodetic astronomy to the American colonies. Their work has provided inspiration for future generations of geospatial professionals, yet most of the public does not know about that portion of their contribution. Hopefully, through the efforts of the “Mason and Dixon Line Preservation Partnership,” we can promote this scientific contribution of Mason and Dixon along with the placement of the boundary stones.

    My heartfelt thanks go out to Eric along with Wayne Aubertin and Rob Kundrick (Appalachian Chapter of the Maryland Society of Surveyors) for allowing me to join them for this task. They gave me a chance to be a true surveyor again and connect the past with the future.

  • Surveyors: Always in the ‘middle’ of something…

    Surveyors: Always in the ‘middle’ of something…

    Image: U.S. Census Bureau
    Image: U.S. Census Bureau

    The surveying profession is intrinsically involved with many functions of today’s communities and environment. When we take a closer look at the roles we play, the surveyor is usually found in the middle. Here are a few examples.

    • For new developments and infrastructure, surveying takes place after a client decides to begin a project. Site data must be collected, drafted and presented to the client, engineers and architects for design.
    • Upon completion of the engineering design, the surveyor provides layout services for the construction company to build the structure.
    • Once the improvements are completed, the surveyor provides surveys as well as record drawings for confirmation of construction to satisfy government agencies and financial backers.
    • In a property dispute, the surveyor becomes the center of attention — our professional opinion determines the correct location of the subject boundary.

    This responsibility also extends to the geospatial sectors within the surveying profession. Data collection is a critical step to creating and maintaining efficient geographic information system (GIS) databases that correctly depict existing infrastructure and parcel boundary layers. With the surveyor at the center of many of these duties and tasks, no wonder that we sometimes feel we have a bullseye on our backs.


    Knowing how to compute the center is an important aspect of the surveyor’s duty.


    However, the word center takes on a different connotation when it comes to data and objects. Properly identifying the center of specific sets of data or objects is important when working with construction information and geospatial data. Properly measuring and marking the center of an installation has its challenges, so knowing how to compute the center is an important aspect of the surveyor’s duty.

    Why is the center of an object important?

    Every object that is definable in a two-dimensional space has a physical center. Whether the object is a regular or irregular polygon in plane geometry, there are various methods for determining its center.

    Figure: Tim Burch
    Figure: Tim Burch

    These figures are easy to understand and simple to solve. More complex figures require more calculations, including coordinate geometry.

    Figure: Tim Burch
    Figure: Tim Burch

    These examples of regular and irregular polygons have something in common: all are based upon two-dimensional space, which is flat. But what happens if we need to determine the center of a shape that does not fall on a 2D surface? What if the data being reviewed for a center resides on a spherical surface and contains diverging axes?

    As surveyors, we break our work down to smaller coordinate systems to work around the fact that our data resides on a spherical surface, but some datasets require the information to remain as latitude and longitude. One dataset is population counts, otherwise known as the census.

    The U.S. Census and the ‘center of population’

    The U.S. Census Bureau has been at work since early colonial times. This excerpt from the bureau website explains its purpose and foundation.

    The U.S. Constitution requires only that the decennial census be a population count. Since the first census in 1790, however, the need for useful information about the United States’ population and economy became increasingly evident.

    The decennial census steadily expanded throughout the nineteenth century. By the turn of the century, the demographic, agricultural, and economic segments of the decennial census collected information on hundreds of topics. The work of processing these data kept the temporary Census Office open for almost all the decades following the 1880 and 1890 censuses.

    Recognizing the growing complexity of the decennial census, Congress enacted legislation creating a permanent Census Office within the Department of the Interior on March 6, 1902. On July 1, 1902, the U.S. Census Bureau officially “opened its doors” under the leadership of William Rush Merriam.

    Counting the citizens of the United States was one thing, but mapping them was another. Once the final count was completed and mapped, the information was used to determine a unique location: the center of population. Here is more from the Census Bureau on the calculation basis:

    The concept of the center of population as used by the U.S. Census Bureau is that of a balance point. The center of population is the point at which an imaginary, weightless, rigid, and flat (no elevation effects) surface representation of the 50 states (or 48 conterminous states for calculations made prior to 1960) and the District of Columbia would balance if weights of identical size were placed on it so that each weight represented the location of one person.

    More specifically, this calculation is called the mean center of population.

    This sounds like an easy exercise for a room of mathematicians and mappers, right? On the contrary, my fellow geospatialists!

    How do they determine the center of population?

    Computing the center of population for the United States would be much easier if we existed on a two-dimensional plane, as previously discussed. Since we don’t, however, it requires a much more difficult method of calculation to get us closer to a real-world solution:

    To avoid unduly complex factors in the computations, the mathematical formulae used were those that would be precise for a true sphere. On such a sphere, the north-south distances between parallels of latitude are identical and distances in degrees may be used as units of distance. On the other hand, distances between meridians on longitude lines are not constant but decrease from the equator toward the poles. However, if the length of one degree along the equator is used as the unit of measurement, then the length in degrees of an east-west line at any other latitude can be adjusted to the measurement standard by multiplying by the cosine of the latitude.

    The center of population computed by the Census Bureau is the point whose latitude (𝜙) and longitude (λ) satisfy the equations:

    population equation

    where 𝜙𝑖, 𝜆𝑖 and 𝑤𝑖 are the latitude, longitude and population attached to the basic small units of area used in the computation.

    Stated in less mathematical form, the latitude of the center of population was determined by multiplying the population of each unit of area by the latitude of its population center, then adding all these products and dividing this total by the total population of the United States. The result is the latitude of the population center.

    East-west distances were measured, or computed, in substantially the same manner, but with the inclusion of a correction for latitude. For these distances, a degree of longitude at the equator was the unit of measurement. East-west distances along the equator could be measured in degrees, but any east-west degree distance north of the equator — where all the United States is located — had to be adjusted to recognize the convergence of meridians toward the poles. This adjustment required that each east-west distance, stated in degrees of longitude, be multiplied by the cosine of the latitude. This mathematical relationship is precise for a sphere and a very close approximation for the earth.

    The computation required that the longitude of each of the thousands of selected points be multiplied by the cosine of the latitude of the point and by the population associated with the point. These products were added and divided by the sum of the products for the same thousands of points, each of which was obtained by multiplying the cosine of the latitude of a point by the appropriate population figure. The result was the longitude of the center of population.

    (Courtesy of the Geography Division, U.S. Census Bureau, published November 2021)

    Here is a graphic from the U.S. Census identifying significant historical events along with the westward movement of the center of population:

    Image: U.S. Census Bureau
    Image: U.S. Census Bureau

    Here are the locations with corresponding latitude/longitude for the centers from 1790 to 2020:

    Mean Center of Population of the United States, 1790–2020
    Census year North latitude West longitude Approximate location
    United States
    2020 37.415725 92.346525 Wright County, MO, 14.6 miles northeast of Hartville.
    2010 37.517534 92.173096 Texas County, MO, 2.7 miles northeast of Plato.
    2000 37.69699 91.80957 Phelps County, MO, 2.8 miles east of Edgar Springs.
    1990 37.87222 91.21528 Crawford County, MO, 9.7 miles southeast of Steelville.
    1980 38.13694 90.57389 Jefferson County, MO, 1/4 mile west of DeSoto.
    1970 38.46306 89.70611 St. Clair County, IL, 5 miles east-southeast of Mascoutah.
    1960 38.59944 89.20972 Clinton County, IL, 6-1/2 miles northwest of Centralia.
    1950 38.80417 88.36889 Clay County, IL, 3 miles northeast of Louisville.
    Conterminous United States
    1950 38.83917 88.15917 Richland County, IL, 8 miles north-northwest of Olney.
    1940 38.94833 87.37639 Sullivan County, IN, 2 miles southeast by east of Carlisle.
    1930 39.06250 87.13500 Greene County, IN, 3 miles northeast of Linton.
    1920 39.17250 86.72083 Owen County, IN, 8 miles south-southeast of Spencer.
    1910 39.17000 86.53889 Monroe County, IN, in the city of Bloomington.
    1900 39.16000 85.81500 Bartholomew County, IN, 6 miles southeast of Columbus.
    1890 39.19889 85.54806 Decatur County, IN, 20 miles east of Columbus.
    1880 39.06889 84.66111 Boone County, KY, 8 miles west by south of Cincinnati, OH.
    1870 39.20000 83.59500 Highland County, OH, 48 miles east by north of Cincinnati.
    1860 39.00667 82.81333 Pike County, OH, 20 miles south by east of Chillicothe.
    1850 38.98333 81.31667 Wirt County, WV, 23 miles southeast of Parkersburg.
    1840 39.03333 80.30000 Upshur County, WV, 16 miles south of Clarksburg. Upshur County was formed from parts of Barbour, Lewis, and Randolph Counties in 1851.
    1830 38.96500 79.28167 Grant County, WV, 19 miles west-southwest of Morefield. Grant County was formed from part of Hardy County in 1866.
    1820 39.09500 78.55000 Hardy County, WV, 16 miles east of Moorefield.
    1810 39.19167 77.62000 Loudoun County, VA, 40 miles northwest by west of Washington, DC.
    1800 39.26833 76.94167 Howard County, MD, 18 miles west of Baltimore. Howard County was formed from part of Anne Arundel County in 1851.
    1790 39.27500 76.18667 Kent County, MD, 23 miles east of Baltimore.

    Data: U.S. Census Bureau

    Not to be confused with the geographic center…

    The geographic center of area is the point at which the surface of the United States would balance if it were a plane of uniform weight per unit of area. That point, approximately 44.967° north latitude and 103.767° west longitude, is located west of Castle Rock in Butte County, South Dakota, as it has been since Alaska and Hawaii became states.

    The geographic center of the conterminous United States (48 states and the District of Columbia) is located near Lebanon in Smith County, Kansas, at approximately 39.833º north latitude and 98.583º west longitude.

    The center of population as geospatial data

    The plotting of the center of population makes for an interesting study of westward expansion in early U.S. history. Once the contiguous 48 states were founded, plotting the center shifts to regional changes . The truly interesting part of these calculations and plotting for the past several centuries falls into an area of expertise called geospatial data.

    While some liberties were taken early on using large, populated areas as one data point, we now can count literally every person and their geospatial location. However, it needs to be recognized that early efforts to count our population and track its center every 10 years meets the criteria for being called geospatial data. They just didn’t yet know what that meant.

    Speaking of surveyors…

    Here are several events and initiatives happening this month, an important month for surveyors.

    logo-natl surveyors week

    2022 National Surveyors Week

    National Surveyors Week was established by the National Society of Professional Surveyors as an annual event to bring public recognition to the surveying profession and the vital services surveyors provide to the advancement and betterment of human welfare.

    During this week, thousands of professional surveyors throughout the country will take part in local activities designed to introduce a new generation to the profession and highlight the use of technology in their day-to-day work.

    Activities for National Survey Week (or anytime!)

    1. Have a Survey Day at your local mall.
    2. Sponsor a Trig-Star Test: www.trig-star.com.
    3. Conduct a Scouts Merit Badge event.
    4. Obtain a proclamation from your state or local government.
    5. Organize geocaching or benchmark hunting: Geocaching.com.
    6. Try surveying mark recon: SurveyMarkHunting.pdf.
    7. Help with the National Geodetic Survey’s GPS on Benchmarks Campaign: GPS on BMs

    For more ideas on how to get involved, visit National Surveyors Week 2022.

    Photo:


    2022 Global Surveyors’ Day

    Global Surveyors’ Day 2022 will be held Monday, March 21. This annual event is a way to globally recognize groundbreakers, pioneers, individuals and the industry that has shaped our history and continues to be of great value to our communities.

    2022 Global Surveyor of the Year

    Image: NSPS
    Image: NSPS

    As part of the Global Survey Day and National Surveyors Week, every year on March 21 a professional surveying association is tasked with choosing a Global Surveyor of the Year. For 2022, the National Society of Professional Surveyors has been selected to choose a person with a historical surveying background for this prestigious honor. After thorough consideration, NSPS has chosen Benjamin Banneker (1731–1806) for 2022 Global Surveyor of the Year.

    The selection was brought before the NSPS Board of Directors during our Spring 2021 meeting and passed by a majority vote. While Banneker’s career as a surveyor was limited in time and experience, his additional contributions to math, science, astronomy and publication of a groundbreaking almanac have earned him a significant place in American history.

    We also selected Banneker because of his ability to overcome the adversity of being a free Black man in early colonial America. Through much self-teaching, he was able to excel at the contributions previously listed in a period when Blacks were not accepted for their educational abilities.

    The selection committee chose Banneker over the three presidents who are famously chiseled on Mount Rushmore and Henry David Thoreau, an author who also surveyed to fund his writing career. The committee felt that Banneker’s contributions not just to the surveying profession made him deserving of this honor, but considered his total body of work created when Black men were not generally accepted as capable human beings. Our world needs more people like Benjamin Banneker and would be a better place because of them.

    No time like the present to promote our geospatial professions

    Surveying and geospatial careers are more important than ever, so examples like the center of population help depict applications that us these skills. Please consider promoting our wonderful professions during these events and throughout the year. The profession you promote may provide an opportunity to bring new faces and ideas to our ranks very soon.

  • A look back at 2021, a look ahead at 2022

    A look back at 2021, a look ahead at 2022

    Image: oatawa/ iStock/Getty Images Plus/Getty Images
    Image: oatawa/iStock/Getty Images Plus/Getty Images

    Another year has come and gone. The global pandemic of COVID-19 is still upon us, and while we have experienced peaks and valleys of controlling the virus, it has radically changed our lives in many ways.

    The surveying and geospatial professions have not been immune to the effects of the pandemic. It has forced many practitioners to modernize the means and methods to their workflows and products.

    In this edition of Survey Scene, I consider the changes and accomplishments of 2021, and take a look ahead at events and technological advances to come.

    2021: The Road We Traveled

    Despite the pandemic, technology within the geospatial professions grew at a rapid pace, with new equipment and features. From the air to the seas, geospatial data-collection capability increased in varying ways across the differing environments.

    Unmanned Aerial Systems (UAS)

    The technological explosion of unmanned aerial vehicles (UAV) shows no signs of slowing down and manufacturers remain hard at work developing new designs for longer flights and increased capabilities. Lidar has emerged as the “hot” remote-sensing method for many users of UAS as an additional tool for photogrammetric capabilities, yet camera specs continue to grow well beyond the 20-megapixel expectation of recent years. These increased capabilities were not possible simply because of the amount of data generated by the methods, but previous issues and limitations with computing power and data storage have turned a significant corner in software performance and affordability.

    In addition to the implementation of lidar, further developments in multirotor and fixed-wing UAV design continue to improve the performance and capabilities of the data-collection task. Many companies are growing their fleets to include both types of UAVs for varying conditions and applications.

    Unmanned Ground Vehicles (UGV)

    The sector with the most surprising developments has to be the unmanned ground vehicle (UGV) — but not for the reasons most would have predicted. We have been introduced to several products based upon remote-control vehicles utilizing GNSS positioning over the past few years, so it was expected for that trend to continue and grow.

    To say the industry was taken aback when Leica partnered their BLK scanning technology with the Boston Dynamics new robot “Spot” would be an understatement. Trial projects and testing is ongoing, but the concept of autonomous data collection by a robotic “dog” is an intriguing concept, especially in environments where human presence is dangerous.

    Unmanned Surface Vehicles (USV) and Unmanned Underwater Vehicles (UUV)

    The last two autonomous vehicles used by geospatial professionals saw significant advancements as well, and are seeing increased use for many water-based remote-sensing projects. For many bathymetric surveyors, the small-footprint unmanned boat using GNSS positioning and conventional fathometer has been a game changer.

    In addition to not investing large sums in a conventional boat, a USV is able to navigate many places and shallower depths than its larger counterparts. Like its airborne and ground cousins, battery life and advancing designs are creating more capability for data collection and remote sensing. The old saying “the sky is the limit” for emerging technologies does not apply to unmanned vehicles, as their use is being seen in almost every environment.

    Weichao Liu, a member of CHC Navigation’s technical support staff, prepares to launch an Apache6 unmanned surface vessel (USV), also known as a marine drone. (Photo: CHC Navigation)
    Weichao Liu, a member of CHC Navigation’s technical support staff, prepares to launch an Apache 6 USV. (Photo: CHC Navigation)

    Professional Societies/Events/Education

    As the calendar pages turned from 2020 to 2021, our world had begun a slow ride back to normalcy with the introduction of several variations of a vaccine for COVID. Some communities chose to return to face-to-face meetings, while others remained cautious and continued with remote communications. Here is a recap of how various organizations remained active within the professional community:

    • National Society of Professional Surveyors (NSPS) and its state affiliates: In-person resumption for some, while most continued with hybrid and/or remote communication methods.
    • International Federation of Surveyors (FIG). Annual working week was held remotely.
    • Council of European Geodetic Surveyors (CLGE). Various meetings held in-person and remotely.
    • Global Surveyors Week. Hosted by CLGE and held remotely.
    • NGS Seminars. A variety of seminars throughout the year held online.
    • Survey & GIS Summit. Joint conference hosted by NSPS and URISA held online.
    • Intergeo. Return to in-person with hybrid option.

    Educational institutions worldwide struggled with returning to in-person classes, yet technology has allowed for remote communication and continued teaching. While many may still see remote learning as a hindrance, improved technology and communication methods have allowed us to continue to learn, work and simply converse with others. Without these tools, life as we know it would be impossible.

    Legislation and Government

    While much of the attention within legislative arenas was on social and economic issues, the geospatial community continues to monitor several items that potentially have a large impact on the profession.

    The continuing saga of Ligado (formerly known as LightSquared) is still playing out, despite the outcry by many industry users of GPS technology. The Federal Communications Commission (FCC) authorized Ligado to begin construction of its new 5G communications technology and denied any stays to this order. Many groups, including coalitions of geospatial data users, continue to protest the authorization by the FCC.

    In December 2021, the airline industry, along with Boeing and Airbus, expressed its concerns over the implementation of the new communication technology and the potential interruption of GPS and radio guidance for aircraft. Only time will tell if efforts to derail the installation and use of the new 5G communication band will be successful


    Elimination of the professional license requirement for surveyors is quite dangerous and foolish.


    Another large issue on the horizon for surveying and geospatial professionals is licensure deregulation. Currently, each state in the U.S. is responsible for licensing and oversight of professionals as established within their statutes. Several consumer groups have begun to petition a number of states to eliminate licensing as a barrier to entry into a given profession, including surveying. They also cite the cost of regulating the professions as an unnecessary expense to the residents of their states.

    Unfortunately, these groups are shortsighted about the education and training required to become licensed within each profession to protect the public they serve. While the costs associated with purchasing the technology needed for the profession continues to decline, the expertise and training needed is on the rise. Elimination of the professional license requirement for surveyors is quite dangerous and foolish.

    2022: The Road Ahead

    As we look ahead, we are still facing many challenges left over from the past few years. Obviously, the COVID-19 pandemic will continue to twist and turn with new variants, enhanced vaccines and adjustments to many aspects of our lives. Because of technology and much different lifestyles from earlier pandemics, we are continuing to adapt to environmental changes: much of business goes about as close to “normal” as possible.

    One could say that creativity and innovation has increased because of the pandemic and probably not get much of an argument. So where do we see technology and the geospatial profession heading during 2022?

    Technology Evolution

    More people are using technology and computing power than ever before and in ways probably not considered even 10 years ago. Until recently, data — especially personal information —has been considered off-limits for public consumption. Only governments were allowed to obtain scores of data to help keep track of literally everything.

    Once geospatial technology came along, the game changed to include a location or positional component to a dataset. Now data can be saved to include a place and time for a particular piece of information if necessary.

    Databases continue to grow with computing and software enhancements, storage increases and expanded network capability. So where are all of these cutting edge technologies taking the surveying and geospatial professions? Here are ways that continuing technological improvements are advancing our capabilities.

    Open-Source Data

    While in the past data was typically considered proprietary, many of the datasets used by geospatial professionals do not contain personal information. This information is simply physical location data for improvements and infrastructure that can be shared openly with no risk of compromising personal security.

    Examples of open-source data cover many subjects, including shape files of physical objects, lidar and contour data of existing topography, and aerial imagery of the world we live in. It can also include data such as traffic counts, air-quality reporting and general population data.

    Much of this data is secured using public funding, but it is not able to be readily shared because of database size limitations. Increases in technology have allowed this information to be shared more freely, and that has given professionals more information in which to better design infrastructure.

    Artificial Intelligence (AI) and Machine Learning

    Trainable technology is nothing new, but the computing power behind it has rapidly increased to make it a formidable challenge to our future workforce. Besides robotic machinery, sophisticated software is being developed to analyze various datasets and electronic mediums to “learn” about the information it contains.

    For example, AI is being used to analyze photographic imagery and lidar datasets to determine characteristics of various elements within the work product. The software can now establish a painted parking line and draw a vectorized line in all places where it finds the same pixelated areas.

    This same process is used to determine curbs, buildings and other improvements with an efficiency of which the human surveyor on the same site isn’t capable. While not foolproof, the technology has great potential and can shrink production time drastically. As programming continues to become more robust in determining the computer’s abilities, we should not bet against this market sector achieving anything but rapid growth. Couple these advancements with the shrinking workforce, and we will continue to see much more from this technology.

    High-Performance Computing via Cloud Networks and Storage

    Before the personal computer (circa 1980), most data processing was completed on a mainframe using terminals and primitive networks. No true computing brainpower was sitting on the user’s desk; the keyboard and monitor were simply conduits to the main processing computer typically housed in a large room somewhere in the building.

    Fast forward to today’s environment, in which everything can be considered a computer. As many have noted, your current smartphone has more computing power than we used to reach the Moon. (The Apollo guidance computer had 4 KB of RAM and a 32-KB hard disk; it measured 24 x 12 x 6 inches and weighed 30 kg). Computing power at your fingertips has never been greater, but our improving technology is making today’s current data analysis seem like child’s play.

    Enter the world of cloud computing and storage. If you live in a major metropolitan area, you have likely been witness to nondescript buildings being constructed with lots of transformers and electrical grid units surrounding them. These facilities are data centers and are being built at breakneck speed by Google, Microsoft, Facebook, Amazon and others to provide cloud computing and storage for the masses.

    The cloud computers offer unmatched processor speed, nearly unlimited storage and reduced IT management costs. Large datasets being analyzed for specific algorithms can utilize cloud computing at a fraction of the cost of maintaining a personal computing system and network. It also allows the flexibility to work from literally anywhere in the world, yet have a consistent computing presence where you are. The big downside is that one is dependent on a reliable (and fast!) connection, as well as needing a comfort level with someone else having access to your data.

    Other major areas of technology that will see improvement this year include 3D visualization (AR & VR), remote sensing, massively online open courses (MOOC) for higher learning, blockchain utilization, and an increase in the number of devices using internet of things (IOT) programming. The key to staying in front of these technologies is to remain curious and never stop learning!

    A Personal Note for 2022 and Beyond

    Like many jobs in this age of advancing technology and automation, surveying is quickly becoming an endangered profession. There are many facets in our everyday lives that are the responsibility of a surveyor, but the number of practitioners is dwindling. The pandemic may have turned our world upside down for many reasons but for surveyors and geospatial professionals, it increased our visibility and workload. Attrition will claim many within our ranks over the next several years, so we must find a way to prolong our profession through all avenues.

    Headshot: tim-burch
    Tim Burch

    With this in mind, I am proud to announce my appointment as the new executive director of the National Society of Professional Surveyors (NSPS). My years in the private sector have provided me with a broad view of where we face professional challenges, so transferring into an advocacy role will allow me to help solve those challenges.

    It will be my honor to work with our organization to recognize the threats lying ahead, not just for surveyors but for many other geospatial professions and occupations. We also recognize that inclusion is a key component to creating diversity, as technology does not see a difference in nationalities, races and genders. The future of surveying is very bright, and NSPS is continuing to lead the way in creating a positive career path for our future surveying and geospatial professionals.

  • What the mind’s eye sees: The surveyor and spatial intelligence

    What the mind’s eye sees: The surveyor and spatial intelligence

    If we introduce children who have an interest in visualization of puzzles, art and mathematics to the appropriate training methods, we can help train future STEM students that could turn into our next generation of surveyors and geospatial professionals.

    Many of us who were children before computers, the internet, and lots of electronic gadgets used our imagination to create fantasy worlds and environments. Many of these visions were drawn on paper using pencils, crayons and paints to recreate those images so we could share them with others. While the world in which we live, work and play exists in three dimensions, our minds were kept to a two-dimensional level because of how ideas and visions were made possible only on flat surfaces or media.

    Photo: Tim Burch
    Photo: Tim Burch

    Surveying has been no different through the centuries. Surveyors have generally divided their work into two categories: land boundaries and topography. Typically, the surveying process of parcel establishment and retracement has been a two-dimensional task, while topographic surveys utilize elevations to determine relief and drainage patterns. This survey information was drawn as graphic depictions on paper to provide the pertinent data to users. It has been generally impossible to express survey data, including boundaries and topography, in a three-dimensional form as the human eye sees it. Many different professions have tried to present information beyond the second dimension but with little success.

    The beginning of the imagery revolution

    In the 1800s, the invention of photography brought a new medium into our world by capturing images of still life onto a two-dimensional format. Photographs, when taken at a proper angle and lighting, helped establish depth to an image, but only if taken in the right context and for the correct purpose. The 1830s brought us the stereoscope, utilizing two slightly different versions of the same photograph to be viewed through a binocular device and “tricking the brain” into establishing depth within the image. This is one of the first examples of using a visual technique to teach our brain to gather 3D information based upon a 2D image or dataset.

    The 1800s also brought us the “motion picture” or movie as we traditionally know it. Ranging from 16 to 24 frames per second and using varying methods to “flash” through a sequence of progressing images, the movie brought another new medium into our world. While silent films were the predominant movie type, several inventors conceived varying ways to produce movies in three dimensions. The most popular type was the stereoscope movie, but moviegoers found it too cumbersome to sit behind a stationary set of stereoscope glasses for the length of the film.

    Another innovation from the 1890s was the creation of the anaglyph. This viewing style required glasses with a red lens for the left eye and a blue lens for the right eye to view two negative images that form a stereoscopic subject. These images remained popular well into the 20th century, with the concept crossing over into films.

    Image: clavivs/iStock/Getty Images Plus/Getty Images

    Image: clavivs/iStock/Getty Images Plus/Getty Images

    Artistic interpretation and presentation

    It is one thing to see an object in real life and make a mental note of what it looks like from varying angles. It is another thing to accurate depict the same object on a two-dimensional medium that gives the viewer the same perspective of the real object. Artists who can simulate depth on an otherwise flat media with drawings and paintings are rare; one of the most famous is M.C. Escher (1898–1972), a Dutch artist known worldwide for his “impossible” drawings and sketches based upon mathematical figures. He had a gift of seeing his art in three dimensions and translating it to various mediums.

    But not every drawing is an artistic interpretation. Ideas that come to fruition in an inventor’s mind often get drawn to scale on paper for sharing with others. Mechanical engineers often used a system known as isometric drafting, a method of drawing a three-dimensional item to join an isometric view, giving the shape within the drawing a sense of depth.

    Toys and games as training tools

    Little did we realize as children and young adults that many of the inventions for imagery led to many popular toys in our history. For instance, the View Master was invented in 1938 and widely introduced at the 1939 New York World’s Fair. This toy turned the stereoscope concept into a sightseeing treasure. In the 1960s, the photographic reels viewed within the View Master began featuring television, movie and cartoon characters in various storylines. It is estimated that more than 1.5 billion reels have been produced covering sites and subjects from every corner of Earth.

    Photo: DieterMeyrl/iStock/Getty Images Plus/Getty Images
    Photo: DieterMeyrl/iStock/Getty Images Plus/Getty Images

    There have also been many variations on the optical illusions designed to make one see a certain image, then suddenly see something completely different. One significant entry in the illusion category is Magic Eye, a series of images based upon single-image random-dot stereograms, or autostereograms. These images utilize computer graphics to “hide” a 3D image within patterns of other shapes and trick your brain into focusing on the hidden subject. After more than 25 years and hundreds of millions of copies of its books, Magic Eye is still challenging people to “see” objects in three dimensions.

    However, the biggest training device for seeing 3D objects in a 2D medium happened within the same timeframe and has no plans for slowing down any time soon: video games. The video game platform has reinvented itself several times in its short life, but the premise behind the visualization remains the same. Some of the systems allow for virtual reality glasses or goggles to enhance the user’s experience.

    “Yes, in fact, my child is gifted…”

    The scientific term for this visual ability is called spatial intelligence. Spatial intelligence has and attracted attention in recent years for helping determine a person’s strengths and capabilities. Spatial intelligence, also known as spatial reasoning, is one of the nine intelligences in the Theory of Multiple Intelligences proposed by psychologist Howard Gardner. In his theory, Gardner challenged the narrow definition of general intelligence with his proposal of nine types of intelligences:

    • spatial
    • linguistic
    • logical-mathematical
    • musical
    • kinesthetic
    • interpersonal
    • intrapersonal
    • naturalistic
    • emotional

    Often, we know people who display various traits as defined within this list of intelligences. Someone with linguistical intelligence is well-spoken, enjoys reading and writing, and can explain a situation or story well. A person with logical-mathematical intelligence solves difficult computations and is a tremendous problem solver. Musical intelligence is found in one who is a “natural” at playing a musical instrument or singing. The pattern continues with the rest of the list and helps to establish strengths within one’s abilities. Most of the intelligences are born within a person, while a few can be somewhat taught. Finding the people with the strongest abilities in a given trait leads us to the highest performers.

    Spatial intelligence is observed in those who like to draw, design or build things, and are quick to mentally manipulate objects to solve puzzles. David Lohman, a researcher who has spent most of his career studying the subject, defines spatial intelligence as “the ability to generate, retain, retrieve and transform well-structured visual images.” Individuals with highly developed spatial intelligence have a unique ability to view objects and imagine them in rotated positions or different angles, and how a group of items can fit together.

    Photo: fstop123/iStock/Getty Images Plus/Getty Images
    Photo: fstop123/iStock/Getty Images Plus/Getty Images

    How important is spatial intelligence as a teachable subject?

    In the past, having spatial intelligence was a naturally occurring trait. Important figures in history, including Picasso and da Vinci, are a few examples of individuals with high spatial intelligence. Clinical research, however, has determined this ability to be a skill that is actually trainable in many instances. If we introduce children who have an interest in visualization of puzzles, art and mathematics to the appropriate training methods, we can help train future STEM students that could turn into our next generation of surveyors and geospatial professionals. By employing a spatial component into lessons and challenging students through visual tasks, they begin to identify objects and other matter into geometrical patterns and spatial relationships. Students who display these spatial characteristics are better at critical thinking and problem solving, which in turn gives them more self-confidence.

    Another important characteristic of spatial intelligence is that gender does not play a large role. Studies have shown that with training and a challenging curriculum, both boys and girls are prone to excel at gaining more spatial awareness and ability to solve problems. The key to maintaining this equality in spatial intelligence is to provide equal education and training for both genders in the formative years. Often, only boys are steered toward sports, math and science while girls are directed to the arts and humanities. By providing all children with the opportunity to experience spatial learning, they will begin to build skills that will help them for a lifetime.

    What does spatial intelligence have to do with GNSS and surveyors?

    It has everything to do with geospatial data! Literally all survey data collected these days is geospatial in nature and contains three-dimensional coordinate values. Why is the evolution of seeing 3D objects in 2D spaces so important? Not everyone can visualize these shapes immediately in two dimensions. If we are able to identify those with strong spatial intelligence levels, we can steer them into the many variations of geospatial fields and surveying.

    Previously, our surveying profession dealt with data collection in small doses. A good day of topographic surveying might see a crew collect 1,000- to 2,000 points. (Not to mention the days before data collectors!) Because the area covered within the day’s work was significant, the surveyor did not have to look at a “big picture” of terrain and improvements. These smaller chunks, even though they were collected with elevations, were plotted in 2D. The contours drawn using the points were simply grade proportions between points and did not produce a 3D effect.

    Lidar data collected in May 2021 for a study of the San Andreas Fault system. (Image: Stephanie Dudash, USGS)
    Lidar data collected in May 2021 for a study of the San Andreas Fault system. (Image: Stephanie Dudash, USGS)

    Fast forward to the surveying instruments and CAD software in today’s work environment. Remote sensing through UAV-mounted, vehicle-mounted and terrestrial-based instruments collect thousands to millions of points (per second in most cases), and we get the resulting point clouds produced by these instruments. It is equally important to see the spatial relationship of the terrain, improvements and overall site conditions for both the surveyor and the CAD technician. We now have data that literally blankets the surface of the subject site, and it is up to both field staff and office staff to correctly interpret that data for the prospective client. Having surveyors and technicians with a reasonable sense of spatial intelligence gives the data a better chance of correct interpretation and depiction.

    Many STEM industry experts are beginning to work with researchers on creating more educational curriculum based upon the various intelligence categories previously discussed. Spatial intelligence will continue to increase as an influencing factor in helping students decide on their career choices. Having our educational system also increase the amount of spatial relationship curriculum within their core teachings, we can help grow our potential STEM professionals and technicians for generations to come.

    While many professions and occupations continue to struggle in anticipation of their future need for employees, the surveying and geospatial professions can help do something about it now. Encourage your kids to play video games, fly their drones, play sports, and solve complex problems. Playing and learning today may help them with their future profession. If not, they can enjoy themselves while they can. Don’t we all wish we were kids again some days?

  • The surveyor and augmented reality – ready for the future

    The surveyor and augmented reality – ready for the future

    Photo: ipopba/iStock / Getty Images Plus/Getty Images
    Photo: ipopba/iStock / Getty Images Plus/Getty Images

    The surveying profession has experienced a plethora of advancing technology over the past two decades and it does not look like there will be a slowdown any time soon. From robotic total stations to laser scanning to the use of multiple GNSS constellations, the profession is constantly adapting these emerging technologies into a useful tool for daily applications. For most practicing surveyors, it is a challenge to keep up with not just the hardware of these advancements, but also with software, which is being developed in parallel. Have you tried to open and draw a simple figure in any of the industry standard CAD programs lately?

    The complexity of these programs, while advancing the capability of many technical professions, forces even the casual user to maintain a regular habit of software education and training. While it may seem primitive to say that a practitioner is a “practicing” surveyor, on-the-job training never stops. Just when the profession thinks there are no more significant advancements, something comes out of left field that truly blindsides us. (See the adoption of UAVS by the surveying profession compared to the public sector…) What do I think will be one of the next “big things” to revolutionize surveying? The technology is already here, and we need to seriously get on board with adoption before we miss another opportunity to highlight the expertise of the profession.

    VIRTUAL REALITY and AUGMENTED REALITY (VR & AR)

    First, we need to know that virtual reality (VR) and augmented reality (AR) are different, even though many people use these terms interchangeably. The differences are as follows:

    Virtual Reality (VR)

    • VR is a virtual world generated by computers and programming.
    • VR is a closed environment that is fully immersive.
    • VR requires a device (specialized glasses and/or a headset).
    • Users in the VR experience are limited by the programming and their computer’s abilities.
    • The VR experience may be based upon real-world conditions but is a fictional setting.
    • Users of VR can travel and experience conditions in real and fictitious places.
    • VR can allow users to have experiences that are not physically possible in the real world.
    • VR is 75% virtual + 25% real (industry “rule of thumb”)

    Augmented Reality (AR)

    • AR is typically based on actual physical places.
    • AR is an open environment that is partly immersive.
    • In AR, the user controls the environment.
    • AR combines virtual elements and experiences with real world conditions.
    • Experiences in AR can be accessed by computer, tablet, and smartphones.
    • AR is useful for product visualization and evaluation.
    • AR is 75% real + 25% virtual (industry “rule of thumb”)

    It is important to know these difference between the two technologies in order to implement the correct one for the task at hand. However, both will play an important in surveying for generations to come.

    Photo: Georgijevic/iStock / Getty Images Plus/Getty Images
    Photo: Georgijevic/iStock / Getty Images Plus/Getty Images

    USES OF VIRTUAL REALITY TECHNOLOGY FOR SURVEYING

    One of the surveyor’s biggest responsibilities is to complete an accurate site conditions model by topographic methods. Once the topographic survey is completed, site designers will utilize this information to create a unique project that works with the existing site conditions. Advances in CAD software and technology allow engineers and architects to design in 3D and blend the new site with the existing conditions, drainage, and utilities. These designs can be further refined into virtual reality models to give the project’s stakeholders a better indication of what the final product will be when construction is completed.

    The key takeaway here is that the surveyor is responsible for delivering the existing conditions model. A model that accurately represents the subject site but in digital form enables the design of the project to be more efficient and realistic to meet the client’s expectation. Surveyers, however, will not use virtual reality as much as augmented reality, for many good reasons.

    USES OF AUGMENTED REALITY TECHNOLOGY FOR SURVEYING

    AR is still in its infancy. Because surveyors have an interest in the existing and proposed conditions of sites, the use of AR becomes an important tool for the future. Merging proposed information with existing site conditions can become the norm, but like many emerging technologies, the profession will need to learn how to embrace it.

    To get a better idea of how the technology works and why surveyors need to consider using it, let us look at an application that showcases AR: Pokémon Go. Yes, the smartphone game app that took the world by storm in 2016 and captivated many “trainers” to search the streets for Ultra Balls and characters. (There are still more than 100 million active players worldwide.) Players of all ages have continued to search for elusive items and characters in a high-tech scavenger hunt that is constantly changing, and all based upon the real world around us. By merging a real-time view with game entities at random geographic locations, players move about our world using one of the best examples of AR.

    How does this apply to the surveying profession? Surveyors could utilize AR in everyday tasks but that would require having a fully developed 3D design model that could merge with the existing conditions in their visual device. There are a variety of devices for utilizing AR, including smartphones and tablets. Many of the new data collectors running Windows and Android operating systems can also be used for incorporating AR into the field operation. Here are some examples of AR how can be utilized for surveying tasks:

    • While construction staking, AR can be used to assist with structure and improvement location. A quick visual check can help confirm staking calculations are consistent with engineering design.
    • Use AR to visually check installed improvements, including curbs, utility structures, and paving. Any deviation from the proposed design should be quite evident.
    • When establishing property corners, AR will help the field crew quickly determine whether the calculated location is accessible. This can be used for staking out pre-calculated boundary points and/or proposed lot corners in a new subdivision.
    Photo: AnnaFrajtova/iStock / Getty Images Plus/Getty Images
    Photo: AnnaFrajtova/iStock / Getty Images Plus/Getty Images

    Here are a few ideas as to how surveyors could utilize AR in everyday tasks in the future:

    • As public utilities are becoming more available within GIS shape files with geographic locations, they could be utilized with AR to help visually establish locations in the field. Mainline utilities and service lines would become easier to physically verify using AR.
    • Another GIS shapefile entity, the parcel line layer, could be used to help the surveyor understand where the property owner believes the line(s) to be as opposed to the actual monumented location.
    • All reference monuments and benchmarks established by public agencies using geographic location information could enhance the “treasure hunt” of confirming local datum points.

    SURVEYING USING AR TO PROTECT THE PUBLIC

    Geospatial information has revolutionized our world, so using AR to help when trouble strikes can potentially be a lifesaver. Recently, an oceanfront condominium in Florida collapsed due to structural failure. While the age of the structure precluded it from having any digital geographic location data, any new similar development could be measured and recorded to assist with future emergency needs. Almost all new development has digital surveying, engineering, and architecture and must use local horizontal and vertical datums. Using the proposed information and verifying with post-construction record drawings, the digital record can be created.

    It doesn’t take a design flaw to create a public hazard. For instance, a gas leak could render any building, such as the Florida condo, susceptible to catastrophic damage. By having a digital model of the underground structure, emergency crews could use AR to help locate potential open spaces in the building. As is the case with installing fire suppression systems and emergency exits, the cost to create a digital model of a completed building will be well worth it to save lives.

    Underground utility corridors within cities, campuses, or manufacturing facilities could also utilize geospatial locations to establish a digital map for future use with AR. It will take time and significant cost to map existing facilities, yet it should be required for new sites to provide this information for emergencies and for use when designing expansions within the site. Having this utility information to use with AR during the design phase could lead to identifying potential problems before construction starts.

    Photo: 1001nights/E+/Getty Images
    Haiti after an earthquake. (Photo: 1001nights/E+/Getty Images)

    Another reason to plan for future safety is how much uncertainty we face in today’s society. At press time, we are coming up on the 20th anniversary of 9/11. We also just watched Haiti suffer another devastating earthquake. The 2021 hurricane season has also been very active, so that danger looms large, too. Disasters happen all the time with little to no warning. Our world is much more advanced than we were at the turn of the century, so we can use these advancements to map our infrastructure. Let us hope we never need to use the digital information for another disaster akin of 9/11. Instead, let us use it to ensure that we can get to someone in a remote spot if necessary.

    THE ROAD TO FUTURE MAPPING AND AUTOMATION

    As previously discussed, establishing a digital twin of our world could help provide a better map for establishing parcel ownership, reducing construction conflicts, and offering better planning tools for future expansion. Will it be completed within my lifetime? No, and I doubt it will be done within the next couple of generations after me.

    We can, however, get a significant start on capturing the necessary information to begin the process of digitization. Technology has exceeded my expectations just within the past decade, so I can only hope that more advancements will help with building this digital beast. More architects and engineers are utilizing BIM (building information modeling) for 3D design and collaboration. Most municipalities and counties have built some form of GIS that uses one of the standard geographic datums. Surveyors have fully embraced GNSS technology so state plane and national geographic coordinate systems have become the norm. In addition, we are seeing a wide number of consultants use autonomous vehicles (aerial, hydro, and terrestrial) with photogrammetry, LiDAR, and SLAM remote sensing. Another bit of good news is that computing power is higher than ever and that storage space is cheap for all this data. We should also include how 5G has expanded our reach and, with cloud storage, we can work from just about anywhere. We can do so much more than most of us ever dreamed of, so we need to leverage that into creating a digital entity that can be helpful.

    Photo: RyanJLane/E+/Getty Images
    Photo: RyanJLane/E+/Getty Images

    HOW TO IMPLEMENT THE LATEST TECHNOLOGY

    Augmented reality is one of many new technologies surveyors need to introduce into their toolbox. Many of you may be asking where to begin; my answer, depending on your age, may offend you.

    Hire a Gen Zer. Really.

    As a Gen Xer, I have come to realize my limitations on technology and being able to fully implement it. The Z generation, while lacking the experience of us wily old guys, see things much differently. The smartphone/tablet/computer, and even the latest data collectors, are designed with them in mind. They grew up playing computer games based in virtual reality, developed excellent hand-eye coordination, and find efficient ways of getting things done. Our surveying world is almost completely digital (when is the last time a client only wanted paper copies of a plat?), so now is the time to make the leap and ditch the drafting table. We have as much to learn from them as they do from us. Together, we can get the surveying profession ready for the next generations. It has been a great profession for us, so let us hand it off to the Z generation. They will (eventually) be glad we did.

  • Surveying and the future: Where is technology going?

    Surveying and the future: Where is technology going?

    Photo: FDA
    Photo: FDA

    Earlier this year, we looked back at 2020 and reviewed how surveying has dealt with the worldwide pandemic while adapting to the new tools and technology being created. We discovered the need for surveyors did not diminish during this crisis, and in many places the demand has gone up significantly. Instruments, computers and measuring methods continue to increase in capability and complexity to help with the shortage of qualified field crews, yet we still need to expand our efforts to find the next generation of surveyors.

    How do we find those future geospatial experts, data collectors and surveying professionals? The answer is right under our noses, and our current group of practitioners needs to get the word out.

    What is the word, you ask?

    Technology.

    Younger generations understand technology better than most practicing surveyors. New devices, methods and operations are being invented at a fast pace, and our best and brightest should be considering using that technology in a rewarding career. Before we make the big pitch to them, however, we should refresh our understanding of recent surveying history to better understand why technology is a good thing.

    How did we get here? A short historical look at measuring

    The measurement methods, devices and instruments used by surveyors have radically changed in the past 50 years, and we have covered their evolution in past columns (Survey Scene May 2016, May 2017 and Sept. 2019).

    Instruments and devices used by surveyors vary in their function and output of information. Some are used to physically measure the distance from a stationary point to another, determine horizontal and vertical angles at a specific location, or determine grade differentials between various points. Other instruments are used to determine horizontal or vertical positions to establish locations and elevations. All these instruments are being used to gather positional data on any number of items, but the quality of the information may vary depending on the technology and method used. How?

    Devices and methods for measuring distances

    AGA Geodimeter NASM-2A. (Photo: NOAA)
    AGA Geodimeter NASM-2A. (Photo: NOAA)

    Tools for measuring distances have been around for centuries. The Egyptians are famous for their “rope stretchers,” while early surveyors in Europe and the New Colonies were known to use the Gunter’s chain and a measuring wheel. In the early 1800s, steel tapes were invented to replace the chain. These measuring tapes continued to evolve well into the 20th century with varying metals, fiberglass and nylon-coated plastics.

    In the mid-20th century, scientists and physicists began to experiment using light waves as a means of measuring terrestrial distances. These experiments led to the development of the first electronic distance meter (EDM), commercially produced by the Swedish company Svenska Aktiebolaget Gasaccumulator (AGA) in the early 1950s. Other methods of electronic measurement, including microwave and infrared wave technology, were also developed in the years following the introduction of the lightwave EDM.

    For many years, the EDM was used independently from transits or theodolites to measure long distances. For those who needed to consistently measure long distances, the invention of the EDM was not just a time saver, but also provided much higher accuracy than manual measurements.

    Other technologies were developed in the latter part of the 20th century, introducing the surveyor to laser scanning, but we can defer this topic until later in this column.

    Devices for measuring angles

    The T3 theodolite was introduced in 1925. With its 10.5-inch telescope, this theodolite had a range of up to 60 miles. It saw heavy use between 1952 and 1984. (Photo: NOAA)
    The T3 theodolite was introduced in 1925. With its 10.5-inch telescope, this theodolite had a range of up to 60 miles. It saw heavy use between 1952 and 1984. (Photo: NOAA)

    The surveyor, like the astronomer, has consistently been at the forefront of developing optical instruments. The key has been combining high optical quality with a means of measuring horizontal and vertical angles within the instrument. The creation of the theodolite and the transit revolutionized the ability of the surveyor to accurately measure angles and apply trigonometric functions to determine mathematical computations. In addition, the surveyor’s compass was also developed to assist with angle measurement — with less accuracy but greater flexibility.

    By the 1920s, optical theodolite technology was rapidly improving through the work of Switzerland’s Heinrich Wild. Beginning with the T2 and T3, these instruments provided accuracy and precision not previously available to the surveyor. Other manufacturers followed suit with similar instruments for the next several decades and were used in conjunction with the EDM for larger surveys. Anticipation grew with the competition to see which instrument company could marry the theodolite and the EDM into one easy-to-use, yet accurate, optical instrument.

    Introducing the total station

    By the late 1960s, technology had firmly entered the surveying world with a few electronic advancements. In 1968, Zeiss — a German company known for its lenses and optical systems — produced the first known tachymeter, combining a theodolite with an electronic distance meter. The tachymeter became better known as the total station, as it was capable of measuring angles and distances in one instrument. While somewhat crude and hard to use, the Elta 14 total station introduced the world to a future generation of surveying instruments that would revolutionize the field.

    In the course of a few years, several manufacturers developed their own total stations. The biggest hurdle was combining the optics of the scope with the measuring axis of the EDM. By the end of the 1970s, most total stations were coaxial, therefore measuring angles and distances was done with one sighting.

    Robotics were introduced in the early 1990s, with two servo motors to drive the horizontal and vertical movements of the total station. These movements were controlled remotely by the tracking system connected to the prism pole and data collector. Not requiring a human being to remain stationary and manually operate the total station provided cost savings and additional efficiency for the field crew.

    Positions, everyone! Positions!

    U.S. National PNT Architecture from a 2007 Department of Transportation report, updated in 2017. (Graphic: U.S. Department of Transportation)
    U.S. National PNT Architecture. (Graphic: U.S. Department of Transportation)

    Positional measurement has revolutionized not just the surveying profession, but a large portion of everyday tasks as well. From monitoring travel times for your commute to providing your food-delivery driver with your location, position determination is the key element to these services. Satellite navigation is now the primary technology used for positioning, navigation and timing (PNT) and a big part of most aspects of surveying.

    Remote sensing

    Here is where we can discuss laser scanning and other remote sensing technologies. Remote sensing is the science and technology of gathering data from a distance. Traditionally this has been mostly done from aircraft, satellites and vessels. However, technology has expanded so that most practitioners now consider the use of laser scanning, lidar, photogrammetry, hyperspectral cameras, bathymetric sonar and simultaneous localization and mapping (SLAM) to be included in the category. Keep in mind that all these technologies are types of measurements; they are not the vehicle or instruments used for the measurement.

    Image: NASA
    Image: NASA

    These various sensor types can collect millions of data points in a short amount of time. While surveyors are adapting to working with point clouds and gigabytes/terabytes of data, it is a radical departure from our recent past using only total stations and GNSS receivers. Significant advancements in computer processing, data storage and programming have simplified the manipulation of point clouds, but they remain a challenging task for even newer surveyors to tackle.

    Autonomous vehicles

    Hobbyists have been building (and crashing) model airplanes and helicopters for many years. Most of the public does not realize that the big advancement in remote-control aircraft was the introduction of GNSS technology into the flight system. Sure, we all have GNSS receivers  in our phones, but now to be included in our toys? This somewhat simple addition has turned unmanned aerial vehicles (UAV) into a revolutionary tool for several occupations, not just surveyors. More control and stability of the UAV means expanded uses for emergency personnel, utility providers, parcel delivery and much more. Being able to program a specific flight provides the UAV user with higher accuracy and precision, but it takes away the element of human control.

    Image: Department of Transportation
    Image: Department of Transportation

    Another vehicle gaining market share is the unmanned surface vessel (USV), used for performing hydrographic surveys. Like its UAV cousin, the USV is autonomous and is programmed to follow a specific route for greater accuracy and precision. Because of the shallow draft of a USV, it can be used in many areas deemed inaccessible by manned vessels.

    An additional aspect of newer technology working with autonomous vehicles is collision avoidance systems. These systems have been implemented on newer UAVs and continue to improve, allowing their the use in tighter confines and spaces. By having a radar-based avoidance signal surrounding the entire UAV, collisions become less likely.

    Geofencing is another advancement being implemented into more UAVs to help keep them from intruding into unauthorized spaces, by programming into their computer specific geographic areas that are off limits. UAVs are often also programmed to return to its takeoff location under certain circumstances.

    Other technological advances to consider

    Image: State Department
    Image: State Department

    How much technology do you have in your home and office? Probably more than you realize. While one may immediately think about a smart speaker or home automation system (Alexa, Echo, Nest, etc.), other components offer simple yet productive solutions.

    Remote control systems enable you to check whether your doors are locked and your garage door is shut. If not, a touch of a button does the job. Motion sensors enable you to detect intruders around and inside the house, of course. Environmental sensors now monitor for water leaks, moisture and gas/carbon monoxide and provide alerts. How about home automation that utilizes robotic technology? The Roomba vacuum, automatic pool cleaners, and even window washing systems activated when dirt is recognized on your exterior windows are just some of the robotic devices in the modern home.

    Precision agriculture utilizes autonomous vehicle control to increase the precision of planting, spraying and harvesting crops. This increase in efficiency has led to higher yields and lower operating costs for the equipment. Another market starting to see more interest is the robotic lawn mowers that functions like the Roomba vacuum. While significantly more expensive than manual mowers, they offer features that can be considered for trade-offs for your time. Depending on your location and needs, they can be set on timers to run day or night and return to base when their battery runs low.

    Adapting today’s technology to tomorrow’s surveying tasks

    Another relevant technology that does not fit into any of the topics above is the inertial measurement unit (IMU). These sensors are now routinely paired with GNSS receivers in UAVs to help them compensate for pitch and roll. Because of their small form factor, IMUs will increasingly be incorporated into other measurement devices.

    It is also safe to say that more handheld devices and smartphones will include lidar scanning capability, as the iPhone 12 Pro and iPad Pro already do. Application and software developers are writing code to make use of data from these devices, so plan on other hardware makers following Apple’s lead.

    Voice and motion control will continue to be integrated into data collectors and workstations. By minimizing physical entries into an input system, computers will begin to recognize patterns and automate procedures to increase efficiencies. Programmable voice commands during field data collection will activate various procedures (for instance, specific roadway cross sections or curb island locations) and walk the user through a predetermined set of steps. The possibilities are endless, but we should prepare to take advantage of the technology.

    Enticing future generations into a geospatial career

    Image: Digital.gov
    Image: Digital.gov

    A geospatial career is so much more than just being a surveyor. Our profession needs bright minds who see the world differently. What does that mean?

    Most surveying and mapping tasks used to produce 2D deliverables on paper. Today’s geospatial technicians fly UAVs, use point clouds, draft existing conditions in 3D, and analyze data for future applications. By applying what they are learning with new devices, technologies and software platforms, our younger generations can help the surveying and geospatial profession evolve into a data-rich environment that helps facilitate change for our planet. These efforts can help with climate change, provide better data for our communities, and bring societies back together.

    Our profession is much more than gathering data; it is helping to make our world a better place through better data analysis and knowledge. Who would not want that?

  • Surveyors, not the tools, define the profession

    Surveyors, not the tools, define the profession

    Many have debated how the surveying profession has morphed into something less than what our predecessors would have called surveying.

    In earlier times, the surveyor was an honored figure in the community and held in high regard, like the local doctor and clergy. Surveyors had the final word on boundaries and the limits of a family’s land holdings, so they were treated like royalty.

    Measuring devices were simple yet complicated enough for only the trained person to understand how boundary lines were determined. Surveyors during those times depended much on natural monumentation and terrestrial features; these items made for solid and definable boundaries. Measurements along these features were to be completed only by surveyors and their means of determining distances.

    Much has changed since those centuries past, including the reputation of the surveying profession. No longer are we mentioned in the same breath as doctors, clergy and lawyers. Even engineers are seen as “more professional” than surveyors. Many have debated how the surveying profession has been degraded from the noble status it once enjoyed and morphed into something less than what our predecessors would call surveying.

    There are many layers to each of the previously described professions, but they all have several things in common: each one relies on data collection, analysis, and professional opinion. Each of these steps requires a specific skill set that includes education and experience. Nowhere in this process does it allow for advancing technology to completely replace any of these steps.

    The evolution of technology and associated tools may help improve the profession, but it will not replace the knowledge necessary to be considered a true professional. Data collection within most professions is the biggest beneficiary of technology; surveying is a testament to these advancements. The breakdown, however, is the availability of the technology to the public and turning non-practitioners into low budget pseudo-surveyors.

    Photo: lukaszfus/iStock/Getty Images Plus/Getty Images
    Photo: lukaszfus/iStock/Getty Images Plus/Getty Images

    What makes us professionals

    Here is the abridged version of the definition of “professional” according to the Merriam-Webster Dictionary Online:

    professional (adjective)
    : of, relating to, or characteristic of a profession
    : engaged in one of the learned professions
    : characterized by or conforming to the technical or ethical standards of a profession
    professional (noun)
    : one who is professional
    : one who engages in a pursuit or activity professionally

    Similar professions have several examples of how the collection of data is a separate process and experience level from its analysis. Consider the following:

    MRI technicians train for their jobs through education, interning and experience. They know how to place patients within the equipment, shield them, apply the rays, and produce the scans as required by their job description. In simple terms, they are data collectors of patients’ medical conditions. Technicians do not analyze the scans nor offer any opinion on the prognoses of the patients. They are, however, relied upon to obtain the proper scans correctly and efficiently for review by doctors.

    Staff accountants or clerks are typically charged with data entry, maintaining ledgers and journals, and verifying data/entry accuracies. Often, clerks organize invoices, statements, and other receivables for input into clients’ accounts. Much of the work for this position is electronic and relies on the employees to be savvy with spreadsheets and able to import various data formats and spot suspect data. Once this work is completed, it become the responsibility of certified public accountants (CPAs) to review and certify the information. The key role here, however, is the accurate compilation of the accounting data.

    Paralegals play a key role in doing the heavy lifting of data collection for lawyers. Paralegals perform client and case research, interview witnesses, handle discovery of case information, and draft many of the documents needed by lawyers. They are tasked with assembling exhibits, delivering and filing necessary court documents, and helping with trial preparation. While they cannot express legal opinions on any case matter, it is the paralegals’ work that lawyers use to develop case strategies. Once again, the data collection is the key to the success of the lawyers’ work.

    Professional surveyors are no different from doctors, accountants, and lawyers in these examples. They rely on data collection obtained by experienced staff trained to operate sophisticated instruments and data collectors.

    Field technicians often serve as surveyors’ eyes, so specific training is necessary to ensure that they can accurately locate the required information. Technicians, however, cannot offer legal opinions on the location of land and parcel boundaries.

    This function is solely on the shoulders of land surveyors, who are licensed specifically in that jurisdiction to apply legal principles and case law to boundary issues.

    Photo: aerogondo/iStock/Getty Images Plus.Getty Images
    Photo: aerogondo/iStock/Getty Images Plus.Getty Images

    There is one in every crowd — the North Carolina lawsuit

    For those who are not paying attention, we are solidly in the 21st century and fully engulfed in the proliferation of geospatial data. Surveyors remain at the forefront of these technological advances with a plethora of tools and techniques being introduced on a regular basis.

    These tools and associated software are much advanced compared to their earlier surveying instrument counterparts, but through extensive programming and easy-to-use interfaces, this equipment may seem simple to use to the layperson. The elder surveying generation likes to refer to newer technicians as button pushers, because the users perform no true calculations.

    Yes, there are necessary checks and balances even with the new equipment, but the knowledge to operate these instruments is user-friendly and intuitive. So what happens when the technology is used by someone who is not a surveyor?

    Among the hazards of making these newer tools and software widely available is how they are used by the non-professional public. As many surveyors have already read about in the news and social media, a UAV operator in North Carolina has filed suit against the NC Board of Examiners for Engineers and Surveyors.

    The board previously ordered the operator to discontinue his UAV flights that engaged in mapping, surveying and photogrammetry services. The operator had been providing images to realtors and homeowners that depicted graphical lines representing property lines, but also included a disclaimer that the product was not intended for surveying purposes. The board ruled he was surveying without a license. The operator is now suing the board and accusing them of violating his First Amendment rights of free speech.

    This case is a high-tech example of what surveyors have faced in the past with overzealous owners of metal detectors. Many instances of low-budget outfits and even fence installers have been brought before state licensing boards because they misrepresented surveying services.

    It should also be noted that survey field crews who use their equipment during off hours to help family or friends with property location without their licensed supervisor’s knowledge face the same consequences. While the “corner finders” are somewhat harmless and get a slap on the wrist from licensing boards, it is the high-tech offenders who are creating much of the harm to the public.

    These situations with unlicensed surveying practices have greatly increased simply because of the available technology and low cost of entry. While GNSS receivers, robotic total stations, and associated data collectors are still quite expensive, new remote-sensing applications are being produced using consumer-grade equipment and advancing software. As technology continues to increase based upon miniaturization and capability, the costs also continue to decrease based upon volume of sales.

    Can I get that UAV in purple like my phone?

    Illustration: jemastock/iStock/Getty Images Plus/Getty Images
    Illustration: jemastock/iStock/Getty Images Plus/Getty Images

    Leading the charge into non-licensed use of new technology is the UAV and the new standard use of GPS technology within its guidance system of reasonably priced units. Hobby planes and helicopters have been around for years but required lots of skill and space to fly and were quite expensive. The invention of the multi-rotor UAV with integrated GPS has created an easy-to-fly vehicle with lots of capability.

    Couple this new vehicle with a high-resolution camera for photos and video; now it allows amateurs to be aerial cinematographers. Image storage space is not an issue due to increased SD card capacity and speed.

    A well-built UAV with all these capabilities is now very affordable and available everywhere. This revolution has led to larger format platforms with more rotors and heavier payloads for more sophisticated cameras and sensors. Once you have the photos and video, now you must do something with them.

    The advancement of software technology for processing photos, video, and remote sensing modules has become the hottest ticket in site modeling. The combination of the UAV’s capability and the software’s output enables trained pilots and software technicians to provide orthometric-based imagery. This imagery was previously completed by airplanes and cameras costing hundreds of thousands of dollars and processed by technicians on high-end computers using years of skill and experience.

    This entire operation can now be completed by one person with less than a $5,000 initial investment. This is a far cry from the funding needed in years past to outfit a survey vehicle with the necessary equipment and personnel to do this same project.

    Enter the FAA and new rules for flying unmanned aircraft. After much consideration, the FAA instituted guidelines for flying UAVs along with requiring a pilot’s certification to fly for commercial purposes. They also specified limits to UAV sizes and payloads, and limited flights to 400 feet above the ground.

    Many companies have purchased UAVs to provide aerial photos of their own facilities and projects, but fail to realize that publishing their images or videos qualifies them as a commercial user. Unfortunately, these regulations are much like driving a car without a license or insurance — it is only against the law if one is caught.

    The iPhone 12 Pro’s lidar scanner


    Another technology that will be catching on soon is lidar imagery from smartphones. The Apple iPhone 12 Pro and Pro Max contain sensors capable of capturing lidar data that is easily imported into computer drafting software. Several phone apps are also available for integrating this data into survey drawings. Geospatial data is literally at your fingertips.

    50 states, 50 rulebooks

    Rules and policies are put in place to regulate various professions and surveying is no different. The goal of these rules is simply to protect the public. Unlawful practice by non-licensed and/or non-qualified persons is a detriment to public safety.

    The question is often raised about professional surveying licensure and the ability to practice in multiple states. Each state differs in statutory rules regarding boundary surveys. The colonial states (and Texas) follow a metes-and-bounds standard while the remaining states generally adopt a PLSS rule. Local surveying methods, terrain challenges and early settlers often affected the statutes enacted by each state, therefore variations in licensing must be applied to applicants.

    However, the guiding principles for land surveyors remain the same in all states to protect the public. Boundary establishment and retracement is the sole responsibility of licensed land surveyors.

    The tools of the trade are a completely different matter. Controlling the surveying services would be easier if the equipment and supplies necessary to do the work were only available to licensees, but the free market will never let that happen. If a company has $30,000 and wants a robotic total station but has no surveying license, the dealer will not stop the sale. When we drop the price tag to an $800 UAV purchase for performing aerial photography, no one bats an eye. As the cost of equipment continues to fall, the number of unlicensed users will climb.

    Photo: Francesco Scatena/iStock/Getty Images Plus/Getty Images
    Photo: Francesco Scatena/iStock/Getty Images Plus/Getty Images

    ‘Men have become the tools of their tools’ (Henry David Thoreau)

    The point of this topic is that surveying is not about the tools necessary to complete the task. Surveyors carried out their work for thousands of years before electronic instruments and can continue to do so if they choose. The advancement of the equipment and the technology has made it easier for surveyors to do their work, but the true meaning of the task lies within the profession.

    Boundary analysis and determination is the responsibility of land surveyors. Data collection for that analysis can be completed by technicians using a variety of measuring tools. The team works together to complete the surveying process.

    Anyone can buy the tools; that, however, does not make them qualified to use them properly. It is not reasonable for one to buy a scalpel and offer brain surgery with a disclaimer. Ask any surveyor; there are some boundary retracements that are the equivalent of brain surgery. And we do not get to put a disclaimer on it.

  • Surveyors and their global role as humanitarians

    Surveyors and their global role as humanitarians

    Every year, surveying associations worldwide celebrate Global Surveyor’s Day during the third week of March. This year is no different (even during a pandemic) and will be recognized on Tuesday, March 23.

    While this past year has been full of challenges, the role of the surveyor on a global scale has continued to grow. As a professional land surveyor in the midwestern portion of the United States, my surveying experiences have been wide-ranging at times.

    For those who know of me and/or have followed my writings here in GPS World, you probably understand how my perspective for the surveying profession has come to be. For those who have no clue about my background, let me give you a brief refresher:

    • Second-generation surveyor, born and raised in Central Illinois, United States
    • Surveyed in rural, suburban and urban environments
    • Began writing for GPS World in 2015 to share my surveying perspective

    Even though my surveying career has spanned several decades, my experience has been limited to the areas described above. From my early days of spending hours in the county recorder’s office pouring through tract index books, all the way to viewing parcel shapes, scanned documents and high-resolution aerial imagery in today’s world, it seemed at face value that my experience covered most of the duties of the typical land surveyor.

    My career has encountered robotic total stations, all iterations of GPS/GNSS data collection, laser scanning, and now UAV data collection. Throw in the development of the personal computer, COGO and CAD software, the Windows operating system, pen plotters, and countless software breakthroughs, and my perspective of the surveying profession had been front row for all the great things we now take for granted.

    However, these advancements, in tandem with growing up in middle-class America, did not prepare me for a recent experience with a surveying/geospatial group new to me.

    VCSP Wisdom Workshop

    VCSP logoA virtual workshop was recently held to discuss the Volunteer Community Surveyor Program (VCSP) instituted in 2017 by the International Federation of Surveyors (FIG) and the FIG Young Surveyors Network (YSN). More than 125 attendees from worldwide locations logged into the sessions to learn about the program and how to become involved.

    The program, titled “Sustainable Solutions for Land Based Community Problems: Tools and Modern Approaches,” spanned two days and two four-hour sessions. Before we jump into the specifics of the program, first we will offer another brief refresher on FIG and its YSN.

    The Fédération Internationale des Géomètres, now known to English speaking nations as International Federation of Surveyors, was founded in July 1878. It has grown into a worldwide non-governmental organization representing more than 120 countries and their surveying/geomatics professions.

    FIG logoThe National Society of Professional Surveyors (NSPS) is a member organization and participates at various levels throughout FIG.

    The FIG Young Surveyors Network (FIG YSN) was initially established in 2006 as a working group, and upgraded in 2009 to network status due to its rapid growth. This group of young professionals and practitioners worldwide has worked with groups such as the United Nations, World Bank, National Society of Professional Surveyors (NSPS) and Council of European Geodetic Surveyors (CLGE) to promote the profession, increase opportunities for young professionals, and be an agent for social and climate change.

    This YSN workshop set lofty goals, including providing information about the VCSP as well as informing participants of the current means and methods of surveying in underdeveloped countries. For context, here are the program topics covered over the two days:

    DAY 1: Community problems, land tenure and tools for land management

    • Experiences and opportunities of humanitarian surveyors (past volunteer community surveys)
    • Land management, community development and open technologies
    • Identifying the relationship between land management and community development
    • The skills of a humanitarian surveyor
    • Introduction to STDM and Cadasta tools
    • An implementation of the STDM and Cadasta tools for land management

    DAY 2: Building capacity and implementing modern land-management approaches

    • Leveraging land-management tools for problem solving and decision making
    • Designing country-scale solutions for land rights and tenure security issues
    • Gathering resources for land management projects
    • How much have land rights and tenure insecurity impacted your country?
    • Documenting and publishing experiences
    • What’s next? Parallel sessions by FIG region

    Introduction to the humanitarian surveyor

    Like most land surveyors in the United States, our role has been well-defined for generations. We establish and/or reestablish parcel boundaries (that is, original or retracement surveys). While our duties have expanded based upon technology, the central responsibility of the surveyor has been established as an expert measurer and provider of boundary information.

    In the 200+ years since the westward expansion and formal establishment of most of the United States, the role of the surveyor has evolved into more of a commercial purpose. A surveyor’s principal responsibility is to protect the public, but that meaning has much different connotations in lesser developed countries.

    FIG Volunteer Community Surveyor working with locals to discuss parcel possession. (Photo: FIG Young Surveyors)
    FIG Volunteer Community Surveyor working with locals to discuss parcel possession. (Photo: FIG Young Surveyors)

    In the recent past, surveying efforts in many developing countries have been like the early General Land Office surveyors in the 1800s. A surveyor in these regions is out in front of development of unclaimed lands, observing natural and manmade boundaries to guide the decision-making process in establishing parcel rights. The methods and procedures used to date in many lesser developed countries are much like 19th-century surveying — primitive instruments and crude maps sketch property claims with little to no authority.

    Surveying: The Next Generation. Here is where the concept of the community or humanitarian surveyor comes into the picture. A new generation of surveyors is using modern technology not just to map existing boundaries and improvements, but also to collect additional data that will be analyzed to help improve living conditions. With the introduction of GNSS technology, establishment of parcel boundaries now takes an accurate and precise shape in GIS databases created for improving conditions in these areas.

    Additional attributes are collected to determine utility needs, communication availability and access to medical care.

    The easy solution seems to be that, as a larger part of the surveying community, we send teams of surveyors to these countries to locate and establish boundaries as well as perform site studies to determine living conditions and potential improvements. If it were just that easy…

    Local government: Friend or foe?

    Often, these surveyors are going into regions where the local or national governments do not agree with empowering their citizens with property rights and allowing them access to basic utilities. Part of the humanitarian surveyor’s role is to get to know the “lay of the land” when it comes to local order.

    Many remote places are controlled by local gangs, tribes or other factions. These groups forbid the population around them to own their property. Even though it may seem like these physical parcel boundaries exist, most of these people do not have title or land tenure rights. This is partly because of the local control situation, but can also be due to the lack of sophistication within the local or national government.

    Communication hurdles. Another hurdle for the humanitarian surveyor has nothing to do with their professional capability — it relies solely on appearance, body language and ability to bridge a communication gap. For example, most first-world nations rely strictly on communication skills and the competence to effectively work with other people. We often easily trust those who present evidence of competency with no previous interaction.

    In third-world countries, however, locals do not trust outsiders and place competency on those who have built long-term relationships with them. They also rely heavily on body language and facial expressions to convey trust. Local citizens in these areas are less likely to trust visiting older generations who are not able to understand these visual cues.

    Combining the factors of trust of the local citizens with the unsteadiness of government and/or lawlessness, the humanitarian surveyor must also be able to determine common property lines, locate lines of occupation, and remain neutral in providing guidance to adjacent neighbors. These conditions often include areas for crops and livestock, as well as places for food growth and development.

    With little to no money and lack of commerce available, many of these regions are food poor. Locals are forced to harvest their own food, so having a plot of land to grow these crops is critical.

    The surveying procedure for the VCSP. (Image: FIG Young Surveyors)
    The surveying procedure for the VCSP. (Image: FIG Young Surveyors)

    In more established areas, it can be challenging to determine land tenant rights with many shanties and lean-tos being joined structurally. It is equally difficult to determine if any common utilities exist in these areas, such as stormwater channels to help with rainfall.

    Add to these improvement location duties the need for better census data to help with government analyzation of population to apply for aid from other countries.

    The good thing is that technology has progressed in creating tools for geographically locating all these entities, including population, with a multitude of attributes to complete proper analyzation. But there is a catch.

    Technology challenges worldwide

    One of the biggest issue surveyors face when providing services in these areas is the lack of advanced technology and computers. These areas may not have reliable utilities, such as electricity or running water, much less viable internet or Wi-Fi. If computers do exist with local government, they are often years behind in computing power and software. Even operating systems like Windows are a rarity in many of these countries.

    Networking accuracy needed. Most humanitarian surveyors will bring their own equipment and computers, so that problem can be averted. But what about geographical locations? Yes, GNSS constellations are available worldwide, but accuracy using just satellite signals is not sufficient for location of parcels and improvements.

    To get survey-grade accuracy, the surveyor will typically utilize a correction service or base station on a known value. Most of these corrections are based on Continuously Operating Reference Stations (CORS) or similar established reference stations, so creating a georeferenced datum for the surveyed location takes time and knowledge. Once the network is established, lots of work and oversight is necessary to provide quality control on the data being located.

    Tackling parcel management on a global scale. (Image: FIG Young Surveyors)
    Tackling parcel management on a global scale. (Image: FIG Young Surveyors)

    To add to these issues, most of the staff necessary to complete the surveys must be brought in due to the lack of education at the location. The role of the humanitarian surveyor will also be to teach the craft of surveying to locals, who will continue to expand the area cadaster after the volunteer surveyor has left.

    Open-Source Software. However, affording the necessary equipment, computers and software to continue the newly established system is also a hurdle for the community. While the price of computer hardware has greatly reduced over time, the advancement of software and cost of upkeep provides a greater monetary challenge.

    Enter open-source software, based upon Linux and other free computer operating systems. This software has been developed with these situations in mind. It allows for customization to each user’s specific need. There are several GIS and data-collection platforms to fit the needs of these budding communities and countries. Open-source and public-domain software allow even the most basic of cadaster needs to be completed efficiently.

    Young surveyors network to the rescue

    From a technology standpoint, it makes sense that the FIG Young Surveyors Network began this program to help underdeveloped nations begin to create simple cadasters for assessing their property and improvement needs. The younger generation has grown up with technology and can easily teach someone how to embrace it and trust the results.

    This younger generation is also the developer of open-source software and tools and sees the value in providing low- to no-cost applications to those who need it most. While the hard part is collecting the data and working with the locals to establish common boundaries, count the population, and determine the utility needs, they take pride in being part of a solution for a segment of the world that may not have any other chance or choice.

    Participants in the Volunteer Community Surveyor Program (VCSP). (Photo: FIG Young Surveyors)
    Participants in the Volunteer Community Surveyor Program (VCSP). (Photo: FIG Young Surveyors)

    One of the interesting portions of the workshop was the breaks between segments. While it was a time to step away from the computer/tablet/phone, the organizers broadcast videos of musical groups from around the world and encouraged the participants to stand up and dance, with their cameras on. While I did not partake in the dancing (it was 4 a.m. at my home), I applaud the Young Surveyors for providing a welcoming atmosphere where each person could be themselves. Several of the participants were in Africa and Asia on cellphones, so creating a workshop environment that worked for all levels of engagement was fascinating.

    What I learned

    My biggest takeaway was simply learning about the term “humanitarian surveyor.” My earlier reference trying to relate these volunteers to the GLO surveyors, while in the same vein in establishing land boundaries, misses badly in terms of overall contribution to the communities in which the volunteers visit.

    The work they perform is truly humanitarian. While I have tried to comprehend the conditions they are facing, I again fall short in fully experiencing what the role has to offer.

    One of the testimonials was regarding a group that went to Nepal following the 2015 earthquake to help re-establish towns and parcels. The pictures were stunning, and the memories shared were heartfelt. To be one of these volunteers is truly a humanitarian effort.

    Well done, FIG Young Surveyors Network and the Volunteer Community Surveyor Program. I will do my best to not take life here for granted anymore.

  • The year 2020 and the surveyor: What we learned

    The year 2020 and the surveyor: What we learned

    If there were ever a time to sit back and reflect on things that have happened in the last calendar year, the year 2020 will be the poster child for the next few generations (at least I hope so…). Because of several things that have happened worldwide in the profession of surveying, let us take this opportunity to look back on a year that was filled with new equipment, emerging technology and government interaction that will have a lasting effect on our surveying horizon.

    Look at all of these wonderful toys

    There was no shortage of introductions to new equipment for surveyors, especially in the GNSS receiver market. While combining GNSS capability with an inertial measurement unit (IMU) is not a new concept, the Big Three of Leica, Topcon and Trimble introduced new or upgraded versions of their latest receivers taking full advantage of the technology. The benefit of having the IMU integrated within the receiver is the ability to “tilt” the instrument yet having the calculated position remain at the tip of the receiver pole.

    Photo: Trimble
    Photo: Trimble

    Leica, however, takes the tilting feature to another level with an integrated camera that allows for close-range photographs to capture additional information through remote sensing software. The data extracted from the photographs can be simple points (and verified in the data collector while in the field) or point clouds that can be integrated into larger projects through the Leica office software.

    These new receivers, along with upgraded models from smaller providers, have opened the GNSS market to many more users well beyond surveying. The combination of more capability through advancing satellite constellations, more robust processors, and reduced receiver sizes have continued to drive GNSS positioning growth.

    Photo: Hexagon
    Photo: Hexagon

    Manufacturers are using these increased capabilities to promote better coverage to obtain positions under heavier canopies and less likelihood for multi-path errors. While I remain cautious about these claims of increased coverage, I also maintain that with any tool, measurements and positions must have proper and appropriate validation. However, I am impressed that the technology continues to advance with what was once seen as only applicable to the open sky.

    Not all the new technology has emerged through the GNSS receiver product lines; several less visible but valuable features have been introduced within the robotic total station lines. The manufacturers continue to push their equipment to react faster, stay locked on targets better, and provide more reliable solutions to data collection and construction layout. Data collectors continue to evolve with larger screens and more software capability, with some rivaling their desktop counterparts.

    As cellular networks grow in both size and speed, more direct connections between field and office are being made with faster response time to data transfer. Data collection can take place in the field and be analyzed by an office technician as it happens. Go another step further and add an aerial background image to the collector and/or the office computer; now each team member can confirm that the information being collected is sufficient for the project in real-time.

    Another technology that continues to advance is remote sensing, with more devices being introduced and with increased software capabilities. Besides new and upgraded offerings from the surveying-based manufacturers, other device makers are introducing products that offer remote sensing to the masses. The biggest news in this arena was the announcement from Apple that the iPhone 12 Pro and iPad Pro would come equipped with lidar sensing technology along with incredible photographic capabilities.

    While there does not seem to be specific apps developed for surveyors at press time, it is safe to say that there will be in short order. It is also a safe bet that having this capability on a mass-produced device will put pressure on the surveying and mapping equipment manufacturers to be cost-competitive on their own proprietary devices or risk losing out on market share.

    UAVs continue to be the fastest-growing segment of the surveying industry. More vehicle, sensor and software providers are coming to market to offer the surveyor a variety of choices. DJI continues to lead the way in the multi-rotor category with new products and sensors while other manufacturers are embracing the fixed-wing and vertical take-off and landing (VTOL) platform for greater range.

    Just like their automobile brethren, flight time continues to increase with discoveries of new battery compositions and weight considerations. The sensor market is expanding to include more affordable lidar units, as well as new technology in multispectral identification, gas and noxious odor detection, and much more.

    Software developers, too, continue to refine and expand the features found in their geospatial offerings with advancing technology and programming. Google Maps is the default navigation app for many smartphone users, but like anything utilizing GNSS in dense urban areas, the users find themselves bouncing all over the map.

    While surveyors recognize this as multipath, the smartphone user does not have any way to remedy this trouble. Google recognizes this issue and has been working on a programming fix to help minimize these positional errors. This is another example of how precise position determination has become a significant goal for our society, with the more correct position, the better.

    Meanwhile, in Washington D.C….

    2020 did not see any shortage of government action for the surveying and mapping community. As with many topics that come out of the nation’s capital, it should not surprise anyone that several of the items considered by the federal government and its agencies were not without controversy.

    The biggest and most controversial item continues to be the advancement of Ligado (formerly known as LightSquared) and the development of new communication technology that has been shown to interfere with the GPS transmission bands. The Federal Communications Commission (FCC), led by Chairman Ajit V. Pai, has been successful in holding off all challenges to the new technology including ones from current legislators and defense staff.

    The main argument from the FCC is the value of the system as a provider of 5G communication to a substantial portion of the country. They also make statements that safeguards are being taken to protect the GPS spectrum, yet many studies from outside parties show otherwise. The fight over this spectrum will continue into 2021, and it will be interesting to see if the new administration will see things from a different perspective.

    Several items to come out of Washington, D.C., late in the year were the blacklisting of DJI and the announcement of new UAV rules for flying over crowds and at night. With the DJI ruling, it is now illegal for government agencies to use the Chinese-based UAV maker for any activities. Based upon the significant market share of DJI, one can only wait to see how this situation plays out, and if the ban is expanded to private individuals.

    The FAA announcement on the new UAV flight rules was surprising but not unexpected. In addition to establishing flight limitations over crowds and at night, it also established a timeframe for requiring most UAVs to transmit a Remote ID during flight for determining who is flying and where they are located. Compliance with these rules will be required by the manufacturer within 18 months and by UAV pilots within 30 months.

    The National Geodetic Survey (NGS) has also been busy during 2020 preparing new datums and specifications for upcoming changes to the National Spatial Reference System (NSRS). Among those changes are the deprecation of the U.S. Survey Foot, beta testing of the latest geoid model (GEOID20), and new software tools for transforming positional information between datums. It was also announced that the release of the modernized NSRS scheduled for 2022 was being delayed.

    NGS continues to work with each state on the improved state plane coordinate systems and/or low distortion projection systems that will be implemented with the new NSRS rollout. All these efforts have been a monumental task (no pun intended) and kudos go out to NGS for getting everything this far.

    Pandemic 2020 (No, this is not a movie or a drill)

    As we covered in the May 2020 Survey Scene article, COVID-19 was unlike anything we had been exposed before. Initial reports tried to relate the virus to typical influenza and the H1N1 outbreak in 2009, but the rapid transmission and sheer volume of cases (and deaths) mostly eliminated those comparisons.

    From a technical viewpoint, the situation with COVID-19 has no bearing on GNSS operations and positional establishment. An operator of a GNSS receiver, and the business of surveying, is greatly affected by the presence of COVID-19 so it does deserve more than a brief mention in a retrospective look at the past year. This virus upended everything; from data collection and survey-related activities to computations and final drafting, the business of surveying felt the effects.

    Once the initial challenges of keeping everyone safe were addressed, it became a year-long marathon of providing surveying services to clients that did not let the pandemic hinder their progress. Field crews were under significant pressure to maintain social distancing at every turn, while office staff dealt with home Wi-Fi and lack of access to normal business conditions such as large-format printing.

    Video calls and instant messaging quickly became the norm, yet also became the scourge of dealing with the day-to-day operations of a business. The “normal” work/life balance with families, school, and social activities has disappeared and a more challenging approach has replaced that balance. Fingers are crossed that people will adhere to social distancing protocols and can get vaccinated as soon as possible so we can resume a portion of our previous lifestyles.

    However, we do have several positive things to take away from the challenges of the pandemic that will make our lives better going forward. Our reliance on geolocation became quite clear throughout the pandemic. Whether it is using it to help establish contact tracing or as simple as having a delivery service bring necessities straight to your door, almost everyone relies on geolocation for helping guide them through the “new normal.”

    We are using our smartphones to track our family members and help keep them out of harm’s way. It would be hard to imagine how much more difficult this situation would have been before cellphone and GNSS integration.

    Graphic: World Health Organization
    Graphic: World Health Organization (https://www.who.int/emergencies/diseases/novel-coronavirus-2019).

    Another leap forward that most people are not aware of is the publicizing of GIS dashboards and incredible analysis of the geolocation of people worldwide. While GIS dashboards have been in existence for many years, it is only now that the public has paid attention to the vast information available to them.

    From providing numbers of cases to graphically depicting “hotspots” across the world, these dashboards are full of useful information to help people understand the size of this pandemic, the places where mitigation is working, and where additional restrictions are being put in place to help reduce the spread of COVID-19.

    The ability to merge geolocations with physical conditions and situations into a real-time mapping solution can help reduce the spread of the virus. By combining GNSS technology with advanced computing power and data storage, the power of GIS has been brought to the front page of public agencies and news sites.

    While we still enjoy watching movies with superheroes, the true heroes during this pandemic are the frontline health workers, first responders and data analysts/programmers who bring us this timely information quickly. A hearty thank you goes out to all of them for their efforts and dedication to the cause.

    In memoriam

    Photo: GPS World staff
    Photo: GPS World staff

    The year 2020 also brought losses to every corner of the world and the surveying community was not spared. There are very few individuals we call pioneers in the surveying industry, so to include Dr. Javad Ashjaee among that group is no small feat. His contributions to the surveying profession helped turn every practitioner into a geospatial information provider.

    From his early days at Trimble pioneering the commercial-grade receiver to creating his company at Ashtech and embracing GLONASS with GPS, he continued to expand the capability of the GNSS receiver. Many surveyors today only know his name through his latest company, Javad GNSS, and the unique line of receivers and measuring devices and their distinctive green color.

    Cover photo: Ed Koziarski
    Cover photo: Ed Koziarski

    Dr. Ashjaee was a big part of the GNSS revolution, so next time you starts up their receiver to collect survey data, take a moment to thank him. It was my pleasure to meet and interview him at the 2017 Intergeo trade show in Berlin to talk about his product line. I was also able to test-drive his incredible GNSS products for a feature in GPS World magazine on using smartphones for data collectors.

    To say the man will be missed is a big understatement and I wish his family well on continuing his company and tradition of making great leaps in technology.


  • The surveyor and the mapper — sharing the same stage

    The surveyor and the mapper — sharing the same stage

    The world of mathematics has always been a mysterious one. It is universally loved by those who enjoy STEM-related fields and occupations, while being generally loathed by those who prefer the arts and humanities (similar to the argument with cats versus dogs, but let us not go down that rabbit hole). It would be easy to believe that if each side sticks to their side of the road, there would be peace and harmony in the world.

    While I cannot speak for the art and humanities group, I can say with certainty that the STEM-related mathematics professions have been known to disagree with each other on various roles within the surveying and mapping world. While surveying has been around since the beginning of time, various forms of organized mapping systems began in earnest in the 1960s.

    When attempts were made to bring the two professions together, each side bristled at being mentioned in the same breath as the other one. The surveyors were the outdoor cowboys with theodolites and tapes, measuring properties and improvements with low precision and accuracy. The mappers, now beginning to be known by the acronym GIS (geographical information system) technicians, were the office computer nerds with punch cards and slide rules.

    Each side did not care much for the other — mostly because they did not understand each other’s role in creating the modern infrastructure database. This relationship would last for decades with no relief in sight.

    Early (and unresolvable) differences

    Each side brought a good argument to the table regarding why the other side was not as important to the authoritative role of map/plat making. For instance, here are the typical stances of each side in the 1970s, before the introduction of personal computers and electronic data collectors.

    • Surveyors worked on the ground and with actual monuments and improvements. They measured angles and distances to collect the pertinent data and drew by hand said information graphically on paper. Because of the accuracy and precision of the field measurements, adjustments were made to the calculations to resolve the unknown errors within the data collection.
    • GIS technicians used a combination of hand calculations, drafting and primitive computers to depict information obtained by existing maps and plats. Because the information being reviewed was not obtained through field methods, parcel lines were forced to fit, improvements to be shown with 90-degree corners, and ambiguities with most data issues to be dismissed.

    Each side stood their ground (in the field or the office) and maintained the distance and differences until more technological revolutions began to infiltrate their vision. At first blush, one could assume these advancements would bring the two factions together; one would be wrong.

    Would you like to play a game?

    Photo: RyanJLane/E+/Getty Images
    Photo: RyanJLane/E+/Getty Images

    The 1980s are known for many things, but for the surveying and mapping communities, it brought a new way of reviewing and storing spatial data. The introduction of the personal computer and vector-based software in the early part of the decade set the pace for rapid and revolutionary upgrades to each profession.

    It was now possible to see on a computer screen what had only been previously possible through manual computation and drafting. As the decade went on, computing speed and storage continued to increase along with the features of software packages.

    However, these advancements did little to bring the surveying and mapping professions together; in fact, the technology has been blamed for causing even more of a divide between the two.

    Again, each side has their reasons for maintaining their hold on being recognized as the authority on the creation of the cadaster layer.

    • Surveyors continued to insist because they worked on the ground and with actual monuments and improvements, the process of putting the data into a computerized format only solidified their position.
    • GIS technicians continued to insist that the refinement of their previous calculations of drafting and mapping into a computerized version further extended their expertise in the mapping world. Also, because many in GIS were specifically trained on computers in college, the work being produced by these members was superior to surveyors.

    Even with the improvements in technology from computers, the divide between the two grew. The relationship between surveying and mapping was at an all-time low, so there must be nowhere to go but up, right? Not so fast.

    GPS + spatial = data custody battle?

    Photo: Magellan
    Photo: Magellan

    Through the 1990s and beyond, the introduction and subsequent rapid implementation of GPS/GNSS gave new meaning to a previous but rarely used term: geospatial data. Only geodesists and higher-end scientists truly worked with geospatial data because of their professional environment and expertise, but now anyone with a GPS receiver became a geospatial data collector.

    Previously, surveyors would measure on a global scale (latitude/longitude and/or state plane coordinates), but this would typically consist of solar and lunar observations under ideal conditions. GIS technicians could only rely on data provided to fit within the location parameters of their projects, which has usually scaled from quadrangle maps.

    However, this new technology was being used with data collectors programmed for almost anyone to use with little to no geodesy experience. Turn it on, press a button and voila — a geospatial location in a variety of coordinate systems. No more sun shots, lengthy traverses from obscure NGS monuments, or scaling from the quad sheets.

    Finally, the surveying and mapping communities have common ground to work on! It would be easy to assume that walls came down and the two professions mended their fences. The short answer is no; they once again did not. Here is each side’s general take on geospatial abilities:

    • Surveyors (once again!) continued to insist that because they worked on the ground and with actual monuments and improvements (though now with improved positioning), the process of putting the data into a georeferenced format only solidified their position.
    • GIS technicians now contended that they, too, could collect the necessary field data using GPS and bypass the need for surveyors. Also, because many in the GIS field were specifically educated to work with spatial data, the information being produced by these members was superior to surveyors’ data.

    We now find ourselves flipping the calendar pages well into the 2020s, with little movement on resolving this relationship. But we can change that if we introduce a little friendlier dialogue.

    In this corner, the surveyor. In the opposite corner, the GIS technician

    When it comes to high accuracy/high-precision data collection for locating existing properties and improvements, there will be little argument that this role is strictly designated to the surveying profession. Technological improvements have made our work more precise and accurate; all while being collected in a georeferenced system. The relationship between the surveyor and geospatial data was previously discussed to demonstrate the importance of our work and determining existing conditions, (see GPS World July 2020 column). The surveyor’s ability to be able to collect an enormous amount of geospatial data for surveying purposes is not being questioned, but the line to where the work encroaches into GIS territory. Spoiler alert: Practically everything the surveyor collects can be considered GIS information as well.

    Let us look at the relationship from the GIS perspective. The input and oversight of the parcel layer must rely on the licensed land surveyor to provide, while the GIS community is charged to collect necessary information to include into their database. It would make sense to update existing infrastructure information using current technology or historical archives in which the position of the data can be verified. Either way, it is now going to be referenced by its geospatial position rather than a relationship to a parcel line.

    Also, the GIS technicians have the same or better capability to utilize data collectors with GNSS receivers for locating existing improvements for inclusion into their system. Most of these technicians have access to the same sources providing the GNSS equipment and coupled with their education and skills, they can collect the data as well as any survey crew. B

    ut does this data collection by a GIS technician fall under most state statutes for surveying without a license? Spoiler alert: The short answer is yes, it does if any data collection includes parcel monumentation and could depict a relationship to a parcel line.

    The whole is greater than the sum of its parts

    Before both parties of this discussion get their pitchforks and torches to have a “talk” with this author, let us take a step back and reassess where we are today with technology and looking toward a future together. The common element here is the data, but how each party uses the data does vary.

    The surveyor typically uses geospatial data for several applications; boundary determination, existing planimetric and topographical conditions, and physical depiction of proposed improvements. The surveyor’s data should be considered as a snapshot in time of the conditions of a particular site or project area.

    Because of emerging technology, it is not just manually collected survey points using conventional equipment; it can be point clouds and 3D photographs not possible 20 years ago. The surveyor can be considered a high-tech record keeper and can update information as sites change. All because the collected geospatial data is timestamped and memorialized in a digital database.

    GIS professionals, on the other hand, require similar information but for many different purposes. Attributes play a much bigger role in the geospatial data requirements than surveyors because the information found within tells them an important story.

    Photo: aydinmutlu/E+/Getty Images
    Photo: aydinmutlu/E+/Getty Images

    The biggest improvement because of the increasing accuracy of the data is infrastructure. As aging utilities require replacement, locating old facilities can be difficult based upon old mapping. Geospatial data collection provides more reliable locations once old facilities are found, existing conditions are reported, and crucial information about its lifespan is collected for future consideration.

    Newly installed utilities will have the luxury of significant attribute data applied to each structure to help with future monitoring and maintenance. These are some of the factor that apply to effective asset management and can be applicable to both public and private clients.

    While the surveyor and the mapper use geospatial data for similar yet different uses, the product is generally the same. But this discussion is not just about merging data into one big global database; we need to dig a little deeper on how to grow each side of our professions together.

    Growth is never by mere chance; it is the result of forces working together

    The surveying and mapping professions have been at a crossroad for some time and both sides continue to ignore each other. Both believe that geospatial data is theirs to control, and they both are right. However, each have a different stake in this geospatial data discussion and need to learn to respect each other’s role. Each side brings a different perspective how to grow and advance our world through effective and efficient surveying and mapping, but they must start talking to realize how much they can grow together.

    With a little more focus and education of each other’s roles on both sides, an overlap of responsibilities could mean faster approach to modernizing many aspects of our respective professions. For instance:

    • Cross training of surveyors in GIS software, data collection requirements, parcel modules, and layer nomenclature
      • Encourage surveyors to apply for GISCI Certified GIS Professional (GISP) testing
    • Cross training of GIS professionals and technicians with survey technician programs
      • Encourage GIS personnel to apply for NSPS Certified Survey Technician (CST) testing
    • Both surveyors and mappers cross training with data collection systems capable of collecting geospatial data containing specific positional information and attributes
      • Identifying limitations of various equipment and techniques (i.e. using the right “tool” for the job)
      • Understanding of positional tolerance (precision versus accuracy) and metadata
      • Comprehension of coordinate systems and zones, including low distortion projections (LDP)
      • Distinguishing between surveying and mapping data collection (i.e. boundary/right-of-way determination versus infrastructure collection for inventory)

    Light at the end of the tunnel

    Technology has introduced our world to many advances not thought possible for our entire existence. The Fourth Industrial Revolution (see GPS World July 2019 column) is now taking aim at industries like surveying and mapping through automation and artificial intelligence capability.

    Data is crucial to everything and our respective professions are in the center of the revolution. 2020 and our worldwide pandemic of COVID-19 has been (unfortunately) perfect example of how data affects our world in real time. The more critical and accurate data that is collected, the better we can make assessments of situations.

    Surveyors and mappers are doing the same thing with data; survey data helps design our world through establishing accurate conditions, while GIS data helps to evaluate our current conditions and plan for future situations. Both professions rely heavily on data, collected in similar methods, but for separate but similar uses. Each has their strengths to bring to the collective table and can increase the effectiveness of digital modeling going forward.

    Photo: PeopleImages/E+/Getty Images
    Photo: PeopleImages/E+/Getty Images

    Let’s make a plan

    The world is moving toward digital twins, augmented and virtual reality along with autonomous travel; it would be in our best interest that the data used to identify the surroundings for those advancements be correct and seamless from all sources. Let us begin by dropping all the delusions of grandeur for our respective professions and formulate a plan to move forward together. The clock is ticking, and time continues to march on.

    Technology continues, and soon Generation Z will be trying to do our work with their laptops and smartphones from the coffee shops without our help. Because they can. See, it is important, isn’t it?

  • 30 years of GNSS and the surveyor

    30 years of GNSS and the surveyor

    Photo: Ed Koziarski for GPS World
    Photo: Ed Koziarski for GPS World

    Depending on your age, 30 years represents a varying opinion of time. For some, it may seem like forever; for others, it may be a blink of an eye. In respect to technology, it can represent a complete change in the way we do things.

    When we turned the calendar page to January 1990, our world had yet to experience the internet, the Hubble telescope had not been deployed to share its fantastic views, and The Simpsons television series was preparing to become the cartoon juggernaut it remains today.

    Yes, lots has changed since 1990, and surveying is no exception.

    Most professions look back through their history and see various periods where discoveries and inventions revolutionized how the work was completed.

    For surveyors, the past 30 years have contained more advancements than all other years combined, with the greatest achievement being the global navigation satellite system (GNSS). With the United States leading the way with its Global Positioning System and the civilian ability to use this measuring system, modern surveying was forever changed.

    Solar and lunar observations replaced

    Before the implementation of a satellite navigation system, true global navigation was only computed using solar and lunar readings under specific conditions. GPS provided a new frontier for surveyors to establish positions without having to perform traversing from known points or collecting solar/lunar observations.

    As the constellation grew, it became easier to use GPS to gain initialization for accurate and redundant position determination. As processor speeds and data storage capability increased, real-time kinematic (RTK) observations became the norm for surveyors everywhere.

    The Russian satellite constellation, GLONASS, began operating fully in the late 1990s, and is now included to create today’s GNSS. More satellites provide more coverage, which in turn means more data collection potential.

    Many nations and regions are building their own constellations to augment the current GNSS lineup, and also to safeguard the ability to obtain geographic locations when other systems are not available.

    Bathymetric surveys made easy

    GNSS capability and integration revolutionized several aspects of surveying, including a new and more reliable way of performing bathymetric surveys over large bodies of water. Computerized depth sounders were programmed to coincide readings with GNSS data collection to provide a more accurate and precise method of hydrographic surveying.

    The past decade has continued the reliance on GNSS technology with many more devices and applications — not just for the surveyor, but for the public as well. While surveyors are using GNSS receivers on unmanned vehicles such as UAVs and boats, satellite navigation has infiltrated into many of our everyday routines. Cellphones, fitness trackers and our automobiles use this technology to guide us to our destinations.

    Surveyors have used the GNSS revolution to create a digital world for better data collection, asset management and increased efficiency. Much has changed in 30 years for the surveyor and the world around us, so we should not be surprised about what technology will bring us next.