Author: GPS World Staff

  • NavVis IndoorViewer converts static scans into 360-degree imagery

    NavVis IndoorViewer converts static scans into 360-degree imagery

    NavVis, a provider of indoor spatial intelligence technology, can now automatically convert E57 point cloud files into interactive, realistic 360-degree walkthroughs, following the latest software upgrade to IndoorViewer.

    Visitors to Intergeo 2018 can demo the new NavVis IndoorViewer release as well as the NavVis M6 indoor mobile mapping system by visiting NavVis in Hall 12.1 at booth 12.1D.086.

    Image: NavVis
    Image: NavVis

    NavVis IndoorViewer is a web-based application that displays realistic digital twins using 360-degree panoramic images, point clouds and maps generated by 3D scanning devices. Users can move around digital twins of scanned spaces as if they are on site and use the interactive functionality to add, search for and route to geotagged information and take accurate measurements.

    The intuitive user interface and functionality has made NavVis IndoorViewer a valuable deliverable for laser scanning professionals who want to extend the use of point clouds beyond BIM models and building plans to a wider range of building stakeholders who would also benefit from 3D scan data.

    This is particularly relevant for stakeholders working on complex projects or properties, such as manufacturing facilities and construction sites, where IndoorViewer enables remote access to the site and is used as a platform for collaboration and exchanging information, the company said.

    “IndoorViewer was originally developed to display the data captured by our indoor mobile mapping system in a way that is accessible to every user,” said Felix Reinshagen, NavVis CEO. “In recent years, we have seen that making scan data available to every building stakeholder is fulfilling an unmet need. Many of our partners using a NavVis indoor mobile mapping system for conventional scanning projects are offering IndoorViewer as an additional deliverable to increase the number of stakeholders who can make use of this data.”

    “To meet the growing demand for extending the use of valuable 3D scan data, we developed a feature that automatically renders 360-degree immersive images from structured E57 point cloud files. The latest software release brings the full functionality of IndoorViewer to E57 point cloud files and therefore marks an important step towards our goal of making scan data meaningful for every building stakeholder.”

    NavVis IndoorViewer currently supports third party point cloud files in most standard formats. However, a key component of the immersive experience that NavVis IndoorViewer provides is the 360-degree panoramic images.

    The new IndoorViewer feature bridges this gap for structured E57 files by automatically rendering 360-degree immersive imagery from E57 point cloud files. This means data collected by terrestrial laser scanners can now also be used to create realistic, immersive 360-degree walkthroughs that can be published and shared online without the need to download or install software.

    The E57 panorama extractor is available as part of a free software upgrade to IndoorViewer subscribers.

  • Orolia introduces SecureFind wearable combat search-and-rescue beacon

    Orolia introduces SecureFind wearable combat search-and-rescue beacon

    U.S. Army photo by Spc. Javon Spence
    U.S. Army photo by Spc. Javon Spence

    Orolia has introduced its latest military technology innovation, the SecureFind Combat Rescue Beacon, at the 2018 AUSA Annual Meeting in Washington, D.C.

    In addition to protecting the most critical assets and leaving no one behind, combat search and rescue (CSAR) technology can significantly enhance military operations by avoiding the loss of sensitive information and technology, avoiding hostage situations and helping to prevent conflict escalation.

    SecureFind is based on Orolia’s search-and-rescue technology suite, selected by military forces for CSAR missions. The wearable base unit includes an open channel search-and-rescue solution, for military use in training or test mode. It can also be configured with a customer-defined, secure channel solution for covert operations.

    The versatile CSAR solution operates with a silent, push-button functionality that does not require voice activation. SecureFind enables military forces to precisely and safely execute CSAR missions, with optional Assured PNT (positioning, navigation and timing) technology that prevents GPS signal interference, spoofing and jamming, the company said.

    “There is no greater need for urgency, stealth and precision than when military personnel are isolated in rugged environments or behind enemy lines,” said Paul Zweers, Orolia’s vice president of defense programs.

    “Software-defined, wearable communications technology is now more important than ever on today’s air, land, sea and cyber battlefields,” added Orolia CEO Jean-Yves Courtois. “CSAR missions are just the beginning of potential uses for this resilient military technology, which can ensure reliable positioning, navigation and timing data in any operating environment. Orolia’s solutions are tailored to support today’s soldiers and engineered with a view toward the future of global military networks.”

    According to Orolia, the standard SecureFind solution is available at a price point that could enable thousands of warfighters to benefit from the new battlefield technology. More advanced functionality is also available, such as the ability to change signals on-the-go for additional security, to detect and mitigate GPS jamming and spoofing, and to generate important strategic information such as virtual battlefield maps of jamming and spoofing activity.

    Orolia offers a cost-effective, modular approach to assured PNT, with a flexible, open architecture that integrates easily with legacy systems. This layered platform meets critical technology requirements without over-engineering a solution that is complex, expensive and difficult to maintain.

    Additional SecureFind product information is available at the AUSA Annual Meeting, Orolia booth #8051.

  • Esri to monitor illegal activities in Argentine waterways

    Argentina’s coast guard Prefectura Naval and Aeroterra S.A. have partnered to implement Esri’s ArcGIS platform for a real-time tracking system.

    The new system, called Guardacostas Pro, uses a combination of satellite imaging and signal processing to monitor vessels for illegal activities such as drug smuggling and fish poaching in the coastal waters of Argentina’s exclusive economic zone (EEZ).

    As Argentina’s coast guard, Prefectura Naval deploys patrol vessels, helicopters and airplane spotters to protect its economic interests and to guard against the decline of its fishery.

    This year, the Guardacostas Pro system allowed Prefectura Naval to track a Spanish vessel that entered the EEZ and attempted to return to international waters. The coast guard was able to catch the ship, which had poached roughly $380,000 worth of fish; escort it back to port; impound it; and fine the crew.

    The captain had little ground to refute the charges because the coast guard had the data to prove the illegal activity.

    “As of five years ago, we had very little information about the use of our seas,” said Ernesto Miguel Klocker, Prefectura Naval director of informatics and communications. “Now we have a good picture, which gives us electronic control of the sea, allowing us to send our air and naval units directly to the places where ships operate.”

    Until recently, its primary enforcement tool was constant patrolling and investigation of all ships. Now Guardacostas Pro monitors signals that every vessel transmits to avoid collision and to provide data on vessel type, speed, and location. It combines this with satellite imaging and Esri’s spatial analytics capabilities to give coast guard personnel real-time alerts when a vessel is entering their waters.

    “Prefectura Naval is setting a truly cutting-edge example of a forward-thinking organization,” said Dean Angelides, Esri head of international alliances and partners. “The best way to effectively enforce laws over such a large scale as the EEZ is to know exactly where things are happening and when, and Argentina is now leading the way in data-driven public safety.”

    After being successfully proven at sea, the Guardacostas Pro system has been moved ashore and is now a multiagency tool to aid Argentina’s Ministry of Security’s homeland security mission. The Ministry of Security will use the system to track and locate its operative units through mobile phones, radio equipment, vehicles with location sensors, and search and rescue aircraft.

  • Hurricane Florence impact revealed in Nearmap aerial imagery

    Newly captured aerial maps show before and after images to support cleanup efforts by public safety organizations, utility companies and insurance agencies.

    Aerial mapping company Nearmap has flown and captured aerial imagery in the areas in North and South Carolina impacted by Hurricane Florence.

    The imagery is already supporting the extensive cleanup and reconstruction efforts for public safety, utility companies, insurance agencies and numerous contractors in many industries.

    High-resolution captures from the Wilmington and Myrtle Beach areas are now online and available for immediate use with more areas scheduled to come online over the next several days.

    The post-hurricane coverage includes about 4,530 square kilometers around the coastline from Newport, N.C., to Myrtle Beach, S.C., covering a population of about 752,000 people.

    High-resolution imagery shows the impact of Hurricane Florence at Southport, North Carolina, comparing September 2017 to September 2018. (Image: Nearmap)
    High-resolution imagery shows the impact of Hurricane Florence at Southport, North Carolina, comparing September 2017 to September 2018. (Image: Nearmap)

    Before the hurricane, Nearmap had already covered more than 30,000 square kilometers in North and South Carolina with ortho imagery and more than 12,000 square kilometers with oblique imagery. With previous aerial maps taken at least once a year totaling over 140,000 square kilometers online, some of them dating back to 2014, users are able to compare current imagery with historical photos.

    “A key element to the recovery efforts is having access not only to high-resolution imagery from after the storm, but also to historical aerial captures from before the storm hit,” said Rob Newman, CEO and managing director of Nearmap. “Historical captures provide consistency and contrast, enabling crews to look at the current truth on the ground and compare it to previous time periods to help assess the damage along the coastlines.”

    All pre- and post-hurricane imagery can be accessed through a standard web browser using Nearmap’s MapBrowser, through Nearmap partners or via APIs to integrate with common GIS, CAD and other applications.

    All the Nearmap pre- and post-hurricane imagery is published at sub-3-inch ground sampling distance, which allows users to see great detail on the ground. At this resolution, they can clearly identify important ground conditions such as roof blow-off, property damage and flooding. The same is true for streets and all other ground features, providing details for users to complete analysis both pre and post storms.

    “Our thoughts are with the residents of North and South Carolina recently impacted by the hurricane,” Newman said. “We are pleased that Nearmap customers are using our imagery to help restore these neighborhoods, and help residents fix and rebuild after rooftop, flooding and other damage.”

    Nearmap customers use aerial imagery to assist in the following aspects of post-disaster cleanup:

    • Public Safety: Access to immediate, crystal-clear aerial imagery of areas affected by storm damage for emergency response routing and safety.
    • Utilities: View all areas where above-ground utilities have been affected and also see where infrastructure is down or damaged and causing hazards.
    • Reconstruction Efforts: Compare historical image captures with post-event imagery to see structure elements and provide proper measurements to rebuild.
    • Insurance: View impacted properties to see first-hand damage and potential structural damage.
  • Caliper supplies US traffic count data for Mapitude

    Image: Caliper
    Image: Caliper

    Caliper has released a free average annual daily traffic (AADT) map layer for Maptitude 2018 users.

    The latest version includes fields with total AADT traffic count, semi-trailer truck count, single-unit truck and bus count, number of through lanes and road classification.

    AADT is the total volume of vehicle traffic on a highway or road for a year divided by 365 days. It is a useful and simple measurement of how busy a road is, and is useful for:

    • selecting a new site or facility location, evaluating a site, or designing a territory
    • determining funding for highway maintenance and improvement
    • forecasting road maintenance needs and expenditure
    • identifying the best location for your business based on traffic patterns
    • analyzing how traffic may impact store construction
    • analyzing the environmental hazards of sound and pollution related to road transport

    The downloaded layer can be added to any Maptitude 2018 map.

  • Caliper supplies US traffic count data for Maptitude

    Caliper supplies US traffic count data for Maptitude

    Caliper has released a free average annual daily traffic (AADT) map layer for Maptitude 2018 users.

    The latest version includes fields with total AADT traffic count, semi-trailer truck count, single-unit truck and bus count, number of through lanes and road classification.

    AADT is the total volume of vehicle traffic on a highway or road for a year divided by 365 days. It is a useful and simple measurement of how busy a road is, and is useful for:

    • selecting a new site or facility location, evaluating a site, or designing a territory
    • determining funding for highway maintenance and improvement
    • forecasting road maintenance needs and expenditure
    • identifying the best location for your business based on traffic patterns
    • analyzing how traffic may impact store construction
    • analyzing the environmental hazards of sound and pollution related to road transport

    The downloaded layer can be added to any Maptitude 2018 map.

  • Extensis and LizardTech unite as one company

    logos

    Extensis and LizardTech are uniting as one global company to help organizations increase their return on investment and the value of their digital assets, fonts and large imagery.

    In 2017, Extensis and LizardTech collaborated on the development of new portfolio asset geo-referencing capabilities for applications in the geospatial, infrastructure, architecture/engineering/construction and building information modeling segments.

    With Extensis’ market leadership in digital asset and font management combined with LizardTech’s expertise in image management and image compression technology, the united company is situated to provide a suite of solutions and support for digital asset challenges.

    “Organizations today are investing in imagery of all kinds, including photography, aerial, and spatial, to name a few,” said Osamu Ikeda, CEO of Extensis. “Fully leveraging these digital files means having an easy and efficient way to organize, store, access and distribute them.”

    Ikeda continued, “Uniting Extensis and LizardTech strengthens our ability to support our customers’ success and give them effective and time-tested solutions for maximizing the value of digital assets of all kinds.”

    The combined company will operate under the Extensis brand, headquartered in Portland, Oregon, with an office presence in Seattle.

    Starting now, LizardTech products (GeoExpress, Express Server, GeoViewer) will become part of the Extensis suite of solutions, which spans digital asset management, font asset management, brand asset management, image management and image compression.

  • Mobile mapping market size worth over $40B by 2024

    The mobile mapping market size is expected to be worth more than $40 billion by 2024, according to a new research report by Global Market Insights.

    The mobile mapping market is propelled by the increasing adoption of mobile devices such as smartphones and tablets across the globe. Smartphone users are extensively using mapping applications on their devices for navigation and driving assistance, the report said.

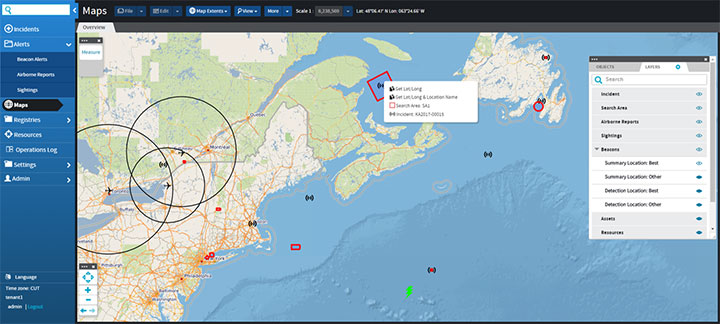
    Furthermore, they are also leveraging on the GIS and GPS applications to access geo-referenced data for searching nearby restaurants, cinema halls and other landmarks. This is encouraging the technology companies to commence mapping across the globe to acquire accurate GIS data and provide an enhanced customer experience.

    High initial investment is a major factor limiting the growth of the mobile mapping market. Currently, the market comprises a few major players with a long-standing expertise in location-based technologies. High initial investments in developing mobile mapping systems and assembling major components have restricted the entry of new players in the market.

    According to the report, the software market is anticipated to grow at a CAGR of 15 percent over the projected timespan. The growing demand for geo-referenced data acquisition and data analysis software among the organizations is driving the mobile mapping market growth. The software assists organizations in simplifying the data extraction process by combining the vital details. It retrieves geographic and spatial data captured by the positioning devices to develop maps and other graphic displays. This data is also used by enterprises to build effective decision support systems, which will drive the market demand.

    The report includes key industry insights in 250 pages with 341 market data tables and 38 figures and charts from the report, “Mobile Mapping Market Size, By Component (Hardware [Imaging Device, Laser Ranging Device & Scanning Device, Positioning Device], Software [Mapping Data Extraction, Data Processing], Service [Consulting, Integration & Maintenance, Managed Service]), By Application (Road & Railway Survey, GIS Data Collection, Vehicle Control & Guidance, Asset Management), By End-User (Agriculture, BFSI, Government & Public Sector, Real Estate, Retail, Mining, Telecommunication, Transport & Logistics), Industry Analysis Report, Regional Outlook (U.S., Canada, the United Kingdom, Germany, France, Italy, Spain, Australia & NZ, China, India, Japan, South Korea, Brazil, Mexico, Argentina, GCC, Israel, South Africa), Growth Potential, Competitive Market Share & Forecast, 2018 – 2024.”

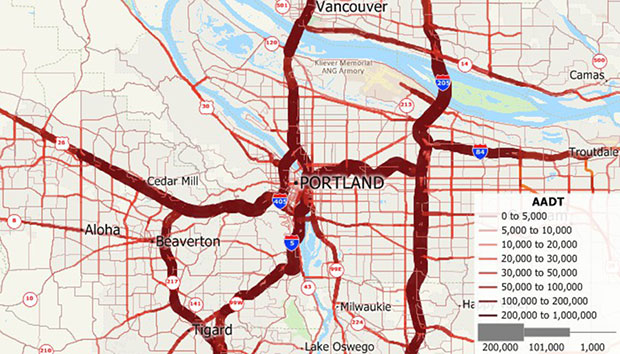
    The mobile mapping technology is used for conducting road and rail surveys, collecting GIS data, and developing vehicle control and guidance systems and asset management systems. The road and rail survey market is expected to register a growth rate of over 17 percent during the forecast period. It is used to analyze the road and rail infrastructure and plan the engineering operations with minimum disruptions. The surveying authorities across the globe are using mobile mapping technology to create maps for the transportation department for road assessment purposes.

    The agriculture sector is estimated to grow at a CAGR of 22 percent during the forecast timeline. The integration of the GPS and GNSS devices into the farming process to acquire geospatial data is the primary factor driving the mobile mapping market share. Furthermore, the ability of the mobile mapping technology to monitor the crop yield and land variability also augments the demand for the technology among the farmers.

    The European region accounted for over 25 percent global mobile mapping market in 2017. The increasing investments by the government agencies have accelerated the adoption of mobile mapping technology in the region. For instance, in 2017, the U.K. government established the Geospatial Data Commission to frame a strategy for using the public sector location data to support the country’s growth.

    The Asia Pacific region will grow at a rapid pace over the forecast timespan. The rapid urbanization of the region and the growing number of infrastructural projects have fostered the growth of the mobile mapping market in the region. Moreover, the widespread adoption of smartphones has also driven the market size.

    Prominent players operating in the mobile mapping market are Phoenix LiDAR, Sharp Corporation, Teledyne Optech, TomTom International, Topcon Positioning Systems, MapJack, Mapquest, Navteq, NCTech, Microsoft, Mitsubishi, NovAtel, Phaseone industrial, Hexagon, EveryScape, Foursquare Labs and XIMEA.

    The major companies in the market are collaborating with other expert companies in the market to develop new product offerings and conduct strategic acquisitions to gain a competitive advantage over its competitors.

    For instance, in 2017, Garmin acquired Navionics, a provider of electronic navigational charts to the marine industry. This acquisition is aimed at combining the data from Navionics charts and Garmin’s blue charts to develop improved navigational services to its customers. Similarly, in 2017, Hexagon entered into an OEM partnership with Smart Guided Systems to develop new precision technologies for commercial applications.

    The global mobile mapping market research report includes an in-depth coverage of the industry with estimates and forecast revenue in USD respectively from 2013 to 2024, for the following segments.

    Mobile Mapping Market, By Component

    Hardware
    Imaging device
    Laser ranging and scanner device
    Positioning device
    Software
    Mapping data extraction
    Data processing
    Service
    Consulting
    Integration & maintenance
    Managed

    Mobile Mapping Market, By Application

    Road & railway survey
    GIS data collection
    Vehicle control & guidance
    Asset management

    Mobile Mapping Market, By End-User

    Agriculture
    BFSI
    Government & public sector
    Real estate & infrastructure
    Retail
    Mining
    Telecommunication

    Regions and Countries

    North America
    U.S.
    Canada
    Europe
    UK
    Germany
    France
    Spain
    Italy
    Asia Pacific
    ANZ
    China
    India
    Japan
    South Korea
    Latin America
    Brazil
    Mexico
    Argentina
    MEA
    GCC
    South Africa
    Israel

  • Honeywell SAR technology to improve emergency response in Greece

    Honeywell has signed an agreement with the Greek Ministry of Maritime Affairs and Insular Policy to upgrade Greece’s search-and-rescue operations using next-generation, satellite-based tracking technology.

    Under the agreement, Honeywell will provide the Hellenic Center of Mission Control with eight satellite antennas, three rescue control systems and computer equipment, as well as installation, customization, training and technical support services for seven years.

    Using satellite signals, Honeywell’s technology can precisely locate emergency distress beacons and coordinate the deployment of rapid response teams, the company said.

    The technology incorporates the COSPAS-SARSAT system, an international satellite-based program for distress alert detection and information distribution.

    “By leveraging a network of ground-based antennas and medium earth orbit satellites, we can more precisely locate distress signals from emergency beacons,” said Mehrez Hached, director of business development for Honeywell’s Global Tracking and Search and Rescue business. “This Honeywell solution will help the Greek National Search and Rescue Coordination Center and the Hellenic Coast Guard save lives by quickly identifying aircraft, ships and people in distress regardless of how remote their location.”

    Honeywell will install the satellite antennas on sites operated by the Hellenic Air Force and deploy management and surveillance equipment to the Hellenic Coast Guard Headquarters in Piraeus, Greece.

    Honeywell’s search and rescue solutions are part of the company’s Safety and Productivity Solutions business. Honeywell provides fixed antennas, terminals, consoles and software applications to quickly locate missing assets on land or at sea and minimize emergency response times.

    The company’s software offerings include SARMaster Search, a full-featured incident management application used by frontline operators to coordinate rescue operations, which has helped save tens of thousands of lives.

    Honeywell’s tracking technology was incorporated into the European Space Agency’s Galileo search-and-rescue program, a pan-European program designed to dramatically reduce emergency response times using geo-positioning satellites.

  • China sends twin BeiDou navigation satellites into space

    China successfully sent twin BeiDou navigation satellites into space on Aug. 25, aboard a single carrier rocket, according to news reports. The satellites are numbers 35 and 36 in the BeiDou navigation constellation.

    Read more about the launch here.

  • Boundless launches learning platform for its GIS products

    Logo: BoundlessOpen and scalable GIS company Boundless has launched Boundless Learning, an intuitive platform where users can browse and search a wide array of both e-learning and private instructor-led training courses on Boundless products, including Boundless Server, Boundless Exchange and Boundless Desktop, as well as open source tools such as PostGIS and OpenLayers.

    According to the company, Boundless Learning is the one-stop shop for all open GIS learning needs. With more than 60 e-learning courses on Boundless products and open source tools, the Boundless Learning platform delivers the next generation of open GIS content directly to the Boundless community, in an intuitive and fluid experience.

    Advantages of e-learning courses:

    • Designed to be the right length for “just-in-time” learning needs
    • Sample free e-learning courses, shop a la carte and buy a course at a time or subscribe and take as many as you like on demand, as well as have access to the newest additions
    • Track progress and save certificates of completion
    • All e-learning courses include lesson instructions with screenshots, data and videos

    Additionally, Boundless Learning delivers three new private instructor-led trainings on Boundless products and open source tools: Introduction to PostGIS, Boundless Server Essentials and Introduction to Boundless Desktop Powered by QGIS. Expert-level instructors will deliver two or four days of training through a mix of short lectures, demonstrations, exercises and challenges.

    Advantages of instructor-led trainings:

    • Personalized learning brings the experts to the users
    • Real-time interaction and instructor feedback for a hands-on experience in the customers’ native environment
    • Low fixed costs include course workbook, data, and system setup
    • Flexible training open to anyone interested in learning more about Boundless and open source in general

    “Boundless is dedicated to developing the best, most accessible tools for the GIS community and the enterprise,” said Christina Hupy, director of education and training at Boundless. “With the introduction of Boundless Learning, we are continuing to empower users with the resources to ensure long term success in a low cost manner so customers can focus on scaling their business.”

  • Free highway exits, interchanges data provided for Maptitude 2018

    Image: Caliper
    Image: Caliper

    GIS software company Caliper has released new highway exit data for the United States and Canada.

    Users of Maptitude 2018 with the Canada or United States country packages can download a free point layer containing all signed and numbered highway exits within their respective country.

    The highway exits layer allows users to find the nearest highway interchange to a particular location or determine proximity to a desired interchange. Applications include site location assessment, commercial real estate, franchise development and accessibility studies.

    The data can also be used in conjunction with the free U.S. traffic count data to determine traffic volumes around a chosen exit.

    The Highway Exits and Interchanges layer can be added to any Maptitude 2018 map.

    Image: Caliper
    Image: Caliper