After two decades of providing the U.S. government with Geiger-mode lidar data, Harris Corporation offers high-resolution lidar data and its derived products to commercial organizations.
The data can be used for land-use planning and management, transmission-line monitoring, pipeline design and maintenance, transportation engineering and planning, urban modeling, asset management and forestry analytics.
Geiger-mode lidar offers the most accurate elevation data available, according to Harris Corporation, the only provider of Geiger-mode lidar data.
According to the company, the sensor allows for collections on a large scale, while also collecting data up to 10 times faster and at 10 times the resolution of existing linear lidar sensors.
Geiger-mode lidar provides multi-angle illumination that penetrates foliage, removes shadows and and eliminates voids.
A pair of companies is using unmanned aircraft systems (UAS) for powerline construction.
Sharper Shape, a drone-based automated inspection provider, and SkySkopes, a professional UAS flight operator, took on a project in cooperation with an investor-owned utility.
Photo: Sharper Shape
The mission used the Sharper A6 UAS to string sock lines for a 675-kilovolt line construction project.
Sock pulling, the act of flying a strong and lightweight rope and attaching it to the towers, is typically performed via helicopters or by workers climbing the towers.
Both these methods involve risk to both helicopter pilots and ground crews. The use of UAS is eliminating the previously complex process — consisting of several steps of reattaching the rope — and decreasing the risk of injury for people involved.
The mission highlighted how UAS are a safe and effective option for many applications in the utility industry beyond basic inspections, according to Matt Dunlevy, CEO and president of SkySkopes.
“This is a great proof of concept for unmanned aircraft because we proved that they can string both the outboard lines and the center line through the middle of the center phase of a tower,” Dunlevy said. “There are risks associated with both helicopter and tower climbing methods. Now there is another option as proven by Sharper Shape and SkySkopes.”
Photo: SkySkopes
“When the utility first reached out there were lots of unknowns,” said Paul Frey, director, electric utilities for Sharper Shape. “Working as a team, we pulled together, developing a test plan and executing the flights.”
The team modified a heavy-lift small UAS to carry line, and then ran five test flights to test objectives related to pulling the line through each of the tower phases and setting the line on the center pulley.
SkySkopes’ pilots are trained for difficult missions, often flying advanced heavy-lift multi-rotor aircraft with precision where autonomy is impractical.
When a platform’s mission requires maneuvering among different environments, transitions between these environments may mean that a single method cannot solve the full positioning, navigation and mapping problem.
This article describes an integrated navigation and mapping design using a GPS receiver, an inertial measurement unit, a monocular digital camera and three short-to-medium range laser scanners.
By Evan T. Dill and Steven D. Young, NASA Langley Research Center, and Maarten Uijt de Haag, Ohio University
An unmanned aircraft system (UAS) traffic management system (UTM) is an ecosystem for coordinating UAS operations in uncontrolled airspace, particularly operations under 400 feet altitude involving small- to mid-sized vehicles. In this domain, information services regarding the state of the airspace will be provided to UAS operators.
In addition, UTM would coordinate and authorize access to airspace for particular time periods based on requests from the operators. The Federal Aviation Administration would maintain regulatory and operational authority, and may for example, issue changes to constraints or airspace configurations to operators via this information service. However, there is no direct control from air traffic control personnel (such as “climb and maintain 300 feet” or “turn left, heading 150”).
As with visual flight rules operations of manned aircraft in uncontrolled airspace, under UTM the onus is on the vehicle operator to assure the flight system provides adequate performance with regard to communication, navigation and surveillance during flight. The vehicle/operator is responsible for avoiding other aircraft, terrain, obstacles and incompatible weather. UTM information services do not yet include, for example, information from an alternative positioning, navigation and timing system that may be needed for operations conducted in GPS-degraded environments (such as near buildings or other structures). This is the challenge being addressed by the integrated navigation concept described in this article. Other concepts are also being considered and developed for alternate, and unique, UAS missions and flight environments.
The method presented here employs a monocular camera as part of a multi-sensor solution that continuously operates throughout and between outdoor and structured indoor environments. For this work, an indoor environment is considered “structured” if its walls are vertical and remain approximately parallel, while the floor is either roughly flat or slanted.
In this type of environment, GPS is typically only sparsely available or not available at all. Hence, in our proposed navigation architecture, additional information from a camera and multiple laser range scanners (not the focus of this article) are used to increase the system’s positioning, navigation and mapping availability and accuracy in a GPS-challenged indoor environment. Figure 1 shows the target operational scenario, and Figure 2 the equipped multi-copter used in this research.
Figure 1. Operational scenario: open-sky environment, transition to indoor and indoor environment.Figure 2. Hexacopter sensors and sensor locations.
Figure 3 shows a block diagram for the methodology implemented in this research, with the elements related to monocular camera methods highlighted. When assessing the capabilities of each of the sensors used in the work, only the inertial sensor produces data that is solely dependent on the motion of the platform and local gravity and is more or less unaffected by its surroundings. Therefore, the inertial is chosen to be the primary sensor for this method.
The mechanization integrates the measurements from GPS, the laser scanners and the monocular camera through a complementary Kalman Filter (CKF) that estimates the errors in the inertial measurements and feeds them back to the inertial strapdown calculations. For this inertial error estimation method to function properly, pre-processing methods must be implemented that relate the sensors’ observables to the inertial measurements.
Here we describe the processing techniques necessary to relate measurements from a monocular camera to measurements from the inertial measurement unit (IMU). Then we show how these techniques are used in the broader GPS/optical/inertial mechanization and present testing results.
Figure 3. Monocular camera components of a broader mechanization.
2D Monocular Camera Methods
To process data from the camera, we first perform feature detection and tracking of both point features and line features. Specifically, elements from Lowe’s Scale Invariant Feature Transforms (SIFT) are used to track point features, which are in turn used to obtain estimates of the camera’s rotational and un-scaled translational motion using structure from motion (SFM) based methods. To resolve the ambiguous scale factor, a novel scale estimation technique is employed that uses data from the platform’s horizontally scanning laser. This technique as well as algorithms that produce a 3D visual odometry solution are presented below.
SIFT Point Feature Extraction. To aid in determining camera motion, SIFT has been used as a way of identifying local features that are invariant to translation, rotation, and image scaling. This technique yields 2D point features that are unique to their surroundings and readily identified and associated across a set of sequential camera images. Each key location and its surroundings are analyzed, resulting in a descriptive 128-element feature vector, known as a SIFT key. Example results of the SIFT key identification process are shown in Figure 4.
Figure 4. SIFT feature identification.
Based on the results of the SIFT feature extraction process from two image frames, a feature association function is performed using the feature vectors. For this work, a two-step procedure is implemented.
First, SIFT keys are associated using a matching procedure. Example results of this process are shown in Figure 5, where it can be observed that incorrectly associated features may result from this process. To remove these artifacts, inertial measurements are utilized to ensure the correctness of the associations.
Figure 5. SIFT matching results between consecutive image frames.
Using a triangulation method, prospective associations are used to crudely estimate each feature’s 3D position with respect to the previous frame. While this triangulation method yields 3D data, it is of poor quality, and is therefore only used to obtain rough approximations that are sufficient for association purposes, but insufficient for navigation purposes.
Once transformed to a 3D reference frame, the projected distances of each feature are compared with one another, and prospective associations that produce significantly different depths than surrounding points are eliminated. Example results of this filtering process can be seen in Figure 6.
Figure 6. Point feature association after inertial based miss-association rejection.
In future implementations, the ORB feature will be evaluated, as its performance is expected to be more than two orders of magnitude faster than SIFT.
Wavelet Line Feature Extraction. To implement the scale factor estimation technique described in a later section, it is necessary to first extract and track vertical line features. To accomplish this, a method using wavelet transforms (WTs) was developed. When applied to a 2D image, WTs can be viewed as filters operating in the x and y directions of an image. By applying either a high- or low-pass filter to both of an image’s channels (that is, x and y directions), four sub-images are formed to represent an image approximation. For this work, a level-one bi-orthogonal 1.3 wavelet was used to decompose each image. An example of the four sub-images produced by this wavelet is shown in Figure 7 along with the original image.
Figure 7. Example results of wavelet decomposition.
Through further processing of the vertical decomposition results, strong line features are identified by first inspecting the illuminated elements along the vertical channels of the decomposed image and identifying clusters of adjacent pixels. Next, a 2D line fit is applied to the groups to estimate residual noise. Pixel collections with low residuals (<3 here) are considered valid line features. Example results of this process are shown in Figure 8.
Figure 8. Example vertical line extraction results.
For association purposes, lines cannot be compared over a sequence of image frames solely based on location as similar line features may not necessarily possess the same endpoint, and, therefore, can be of varying lengths. However, corresponding lines will possess many common points and similar orientations if they are projected into the same frame. Using the inertial reference frame, each line’s orientation, , can be transformed across image frames as given by:
In this manner, lines between frames that contain multiple similar points and have comparable orientations are considered associated.
For a discussion of the projective visual odometry and epipolar geometry methodology as well as the resolution of true metric scale used in this work, download the supplemental PDF.
Metric Scale. As the unscaled translation estimate calculated through the aforementioned visual odometry method is a unit vector, it only indicates the most likely direction of motion of the camera. To obtain the sensor’s actual translational motion, an estimate of the scale factor, m, is required to determine the absolute translation ∆r. This can be accomplished through techniques using a priori knowledge of the operational environment or measurements from other sensors. In this research effort, a new method is employed that makes use of data provided by a horizontally scanning laser.
The proposed method estimates the scale in an image by identifying points in the environment that are simultaneously observed by the camera and the forward-looking laser range scanner.
To enable this estimation method we must identify the correspondences between the pixels in the camera images (each defined by a direction unit vector corresponding to the row x and column y) and the laser scanner measurements (each defined by direction unit vector). A calibration procedure establishes these correspondences. Given the laser range measurements, 2D features located on the scan/pixel intersections can be scaled up to 3D points.
Unfortunately, extracted 2D point features are rarely illuminated by a laser scan in two consecutive frames. This can be resolved by considering the intersection of a laser scan with 2D line features rather than point features. As the laser intersects the camera frame at the same location regardless of platform motion, and the platform does not make excessive roll and pitch maneuvers, vertical line features in the image frame are preferred as they will be relatively orthogonal to the laser scan plane.
Using the previously described vertical line extraction procedure, Figure 9 shows an example image frame overlaid with the points in the image frame illuminated by the laser (indicated by a blue line) and the extracted vertical line features (indicated as green lines). Multiple intersections of 2D vertical lines with laser scan data are calculated (indicated as red points). Inversely, Figure 10 depicts the location of all laser scan points in green, all laser points observable with the camera field-of-view (FoV) in blue, and intersection points in red.
Figure 9. Image frame overlaid with points; Laser (blue), vertical line features (green), multiple intersections (red).Figure 10. 2D vertical line and laser intersections in laser scan data.
For scale factor calculation purposes, it is necessary to track the motion of these 3D laser/vision intersection points, across sequences of camera image frames. As each intersection point uniquely belongs to a line feature in the 2D image frame, it can be stated that if two lines are associated, their corresponding intersection points are also associated. Using the rotation computed from the visual odometry process, the line association method described by (1) is implemented, and provides associations between laser/vision intersection points across frames.
To calculate the desired scale factor based on these associated laser/vision points, geometric relationships are established: unit vectors from the camera center to points located on a 2D line. From these, the line’s normal vector can be derived.
Monocular Camera Results
To assess the performance of the visual odometry processes, multiple experiments were conducted. The results of one such test are discussed here. During each test, the visual odometry results for rotation, shown in blue, were easily evaluated through comparison with the platform’s inertially-measured rotation, displayed in red.
The rotational results for each sensor were decomposed into the Euler angles: pitch, roll and yaw with respect to an established navigation frame. Unfortunately, the inertial sensor itself cannot be used to evaluate the visual odometry translation results due to relatively large inertial drift in the sensor measurements. As no independent measurements were available to evaluate translation with high precision, the truth reference was established by accurately measuring the actual paths taken during each flight.
A test flight was conducted traversing a rectangular indoor hallway loop. This test contained translation in multiple dimensions, large heading changes and a flight duration of four minutes. Moreover, this test allowed for evaluation of the eight-point algorithm and scale estimation method in the presence of rapid scene changes.
The attitude estimation results for this test are shown in Figure 11. Throughout data collection, the maximum separation between the inertial and vision-based attitude estimators for pitch, roll and yaw was 9°,19° and 14°, respectively. Upon comparison to many of the other conducted tests, the maximum attitude errors were larger. There are multiple reasons for this increase. First, the duration of this experiment was greater than that of previous experiments. Errors accumulate as a function as time due to integration of residual bias errors, so increasing flight duration will increase cumulative error.
Next, the looping path observed throughout this test caused the eight-point algorithm and scale estimation procedures to quickly adapt to differing scenery. Drastic scene changes (turning a corner) increase the difficulty of feature association between frames. This directly affects the procedures used for visual odometry in an adverse manner. Finally, there are situations in this flight where features are sparse. In general, a decrease in features will cause a decrease in the estimation capabilities of visual odometry.
Figure 12 shows the visual odometry path calculated for experiment 2. Here, the estimated length of each of the four straight legs of the rectangular loop matches to within 2 meters of the measured hallway lengths. This implies that the scale estimation technique is working reasonably well.
Figure 12. Visual odometry path determination while traveling around an indoor loop.
As for the estimated translational directionality produced by the eight-point algorithm, the first two legs of the loop never divert from the measured path by more than 2 meters; the third leg diverts by 5 meters. This is most likely due to a lack of well dispersed features in that specific hallway.
The cumulative error contained in the third linear leg of the loop also makes evaluation of the final leg difficult. However, if previous errors are removed, the final leg appears to match the measured path well. In total, the landing position calculated through visual odometry is 6.5 meters away from the measured end of the trial.
Integration Methodology
In cases where GPS measurements are available along with the visual odometry solution, the proposed method can extend the GPS/IMU integration mechanization. The structure of the referenced GPS/inertial integration consists of two filters: a dynamics filter that uses GPS carrier-phase measurements to estimate velocity and other IMU errors, and a position filter that uses the velocity output of the dynamics filter and GPS pseudoranges. The dynamics filter can be adapted and extended to include camera data within its mechanization.
The dynamics filter is a CKF designed to estimate the inertial error states: velocity error in the north-east-down (NED) coordinate reference frame, misorientation (including tilt error), gyro bias error, and specific force or accelerometer bias error. This yields a state vector. For a discussion of the state vector, download the supplemental PDF.
Results
To evaluate the proposed algorithms, data was collected through multiple flights of the hexacopter platform shown in Figure 2 through a structured indoor and outdoor environment including transitions between these two environments. The availability of GPS measurements in these environments ranged from fully denied, to substantially degraded, to enough observables for a full solution.
The results of one test flight are discussed in this section. Apart from the data collections with the hexacopter, truth reference maps were created for the indoor operational environment and used for evaluation of the described processes. The results of the full GPS/inertial/laser/camera integrated solution described in Figure 3 are shown in an NED frame in Figure 13.
Figure 13. Path compared to 2D reference map.
The truth reference of the environment, depicted in red (derived from a terrestrial laser scanner), is compared to the flight path obtained from the extended Kalman filter (EKF), displayed in blue. The estimated flight trajectory constantly remains within the hallway truth model, indicating sub-meter level performance. Furthermore, based on an extension of this work for environmental laser mapping produced from the EKF, combined with the accuracy of the map, it is further reinforced that sub-meter-level navigation performance is obtained.
During portions of the described data collection, there was enough visibility (>3 satellites) to calculate a GPS position. The availability of GPS measurements to the position estimation portion of the filter allowed for geo-referencing of the produced flight path and 3D map.
Figure 14 displays the geo-referenced continued flight path based on the integration filter superimposed on Google Earth on the left, while the standalone GPS solution based on pseudoranges only is plotted on the right. The geo-referenced path correctly displays the platform passing through Stocker Center, the Ohio University engineering building.
To demonstrate the contributions of the monocular camera to the above results, laser measurements were removed from the solution for a 20-second period where GPS was unavailable. During the 20-second removal of laser data, the system is forced to operate on integration between visual odometry measurements and the IMU. The cumulative effect caused by this situation can be observed in Figure 15. After coasting on an IMU/camera solution for 20 seconds, the path is subsequently altered by 3 meters, as opposed to the solution with all sensors.
Figure 15. Effect of losing GPS and lasers for 20 seconds.
To further emphasize the contribution of the visual odometry component, both the laser and camera were removed from the integration for the same 20-second period. During this time frame the EKF is forced to coast on calibrated inertial measurements. The effect of losing all secondary sensors for a 20-second period can be observed in Figure 16.
Figure 16. Effect of coasting on the IMU for 20 seconds.
During the forced sensor outage, a 45-meter cumulative difference is introduced between the path using all sensors and the path with denied sensors. Through comparison of the results shown in Figure 15 and Figure 16, the contribution of monocular camera data can be isolated.
When the EKF was forced to operate for 20 seconds using an IMU/camera solution, 3 meters of error were introduced. This is significantly smaller than the 45 meters of error observed when using only the inertial for the same period. Thus, the camera is shown to provide stability to the EKF when neither the laser nor GPS are available.
Conclusions
The visual odometry techniques produced reasonably good attitude estimation and are effective at constraining inertial drift when other sensors are not available. The inclusion of camera measurements to the discussed integrated solution resulted in increases in the accuracy, availability, continuity and reliability of the system.
Acknowledgment
The material in this article was first presented at the ION Pacific PNT conference in Hawaii, May 2017.
Manufacturers
The camera used aboard the UAV in these tests is a Point Grey Firefly MV and the IMU is an XSENS MTi. The GPS receiver is a NovAtel OEMStar with a corresponding NovAtel L1 patch antenna.
EVAN T. DILL is a research scientist in the Safety Critical Avionics Systems Branch at NASA Langley Research Center. He received his Ph.D. in electrical engineering from Ohio University.
STEVEN D. YOUNG is a senior research scientist at NASA with more than 30 years of experience in the related fields of safety assurance, avionics systems engineering and human-machine interaction.
MAARTEN UJIT DE HAAG is the Edmund K. Cheng Professor of Electrical Engineering and Computer Science and a Principal Investigator (PI) with the Avionics Engineering Center at Ohio University, where he earlier earned his Ph.D. in electrical engineering.
We’ve heard a lot in the news recently about GPS spoofing, mostly centred on the story of ship spoofing in the Black Sea. Between June 22-24, a number of ships in the Black Sea reported anomalies with their GPS-derived position, and found themselves apparently located at an airport.
What happened is open to educated conjecture. In this column, I’ll briefly cover the history of spoofing, its basic techniques, some spoofing tests that we conducted, and then return to the infamous Black Sea incident.
As part of my day-to-day work in navigation warfare, I do a fair amount of work in defensive anti-spoofing. Naturally, in order to test anti-spoof technology, it is necessary to also perform spoofing. It’s a delicate subject and, as with any topic involving defense or national security or critical infrastructure, there’s a balance to strike between responsible disclosure, how much information is released into the public domain, and so on.
In this article, I will stick firmly to information available in the public domain, lest I be accused of proliferating the threat, but this still gives us enough material to tiptoe around the subject for the benefit of our readers. I could have included more details about the spoofing attacks, but was advised to hold some back — it makes governments nervous. You can read some of the background in an excellent article by Norwegian broadcaster NRK and a Resilient Navigation and Timing Foundation press release. Similar GPS anomalies still continue to occur at various locations.
Let’s start with basic spoofing background, and we’ll return to the Black Sea incident at the end of the article.
A brief history of spoofing
Spoofing isn’t a new threat — it’s been around for decades. But only in recent years has it received so much public attention. As with jamming and anti-jamming technology, and most other topics in the GPS domain, spoofing finds its roots back in the days of Cold War radar. In those times, it was often known as “deception jamming,” where you would transmit fake radar returns to paint an incorrect picture on your adversary’s radar screen.
When GPS came along, it was understood at the time that the C/A code would be vulnerable to spoofing. It’s an open code, so anyone is free to reproduce it. That is, after all, what a GPS simulator is: a GPS spoofer. We legitimately test our GPS receivers by fooling them with fake signals from a GPS simulator.
Of course, this is precisely why legacy GPS satellites also transmit the military P(Y)-code, and continue to do so. The P-code offers improved accuracy, and some other benefits, but more importantly, it is modulated with the W encryption sequence to give us the encrypted P(Y)-code. Ever since the anti-spoofing module was set to the “on” state, unless you have the key, you are unable to directly spoof the P(Y)-code. (You can still perform a meaconing attack, though, where you simply record the transmitted satellite signals and retransmit them again. Although this kind of attack can’t be used to impose a particular scenario on a GPS receiver, it might still cause havoc in unwary receivers).
So. in the early days it can be argued that the spoofing threat was solved. It wasn’t until GPS became ubiquitous in the commercial and civilian domain that spoofing really raised its head again. The fact that the vast majority of GPS receivers in the world relied solely on the unencrypted C/A code became a cause for concern — especially where those GPS receivers were essential to critical infrastructure.
The threat of GPS spoofing was discussed at many conferences and behind many closed doors and, although most people agreed that spoofing was a theoretical threat, some people argued that in reality it was “simply too hard” to conduct a realistic spoofing attack. And therefore we should not worry ourselves about it.
It wasn’t until a couple of high-profile demonstrations were carried out by the University of Texas Radionavigation Laboratory that spoofing became front-page news once again. In 2012, the lab staff carried out an exercise at White Sands Missile Range where a GPS-guided drone was spoofed from a distance. The drone was fooled into thinking its altitude was increasing, causing it to compensate by dropping straight down. Then in 2013, the same team demonstrated how an $80 million yacht could be steered off course by means of a spoofing attack.
These exercises publicly demonstrated that spoofing was indeed a real threat, and could be done. But many people still believed that it was very hard to build the complex equipment necessary to perform the attack, and thus spoofing was out of reach for most potential criminals or terrorists.
Fast forward another two or three years, to when a new mobile phone game appeared. Pokemon GO became the game craze of the moment, where players would travel around the country with their phones, getting points by collecting creatures in an augmented reality world. It didn’t take long for people to dream up new ways of earning points in the game, without having to go to the effort of traveling around the world.
What if you could make your phone think it was somewhere else, without ever having to leave your bedroom? And thus, bizarrely, it was a mobile phone game that brought GPS spoofing into the mainstream.
The rise of the low-cost software-defined radio (SDR) has enabled “spoofing for everyone.” Today, the tool of choice for the casual user is often the HackRF or bladeRF. Couple small SDRs that cost around $200 with open-source GPS simulation software, and you have a basic spoofer. Plenty of websites detail how to perform basic spoofing, and at hacker gatherings, people can present how they spoofed a drone. These may not be the most sophisticated setups, but it’s good enough to do the job in many cases. With a better setup, which I won’t describe here, it’s possible to achieve a much more realistic attack, which will fool even the most shrewd and wary GPS receivers.
Spoofing basics
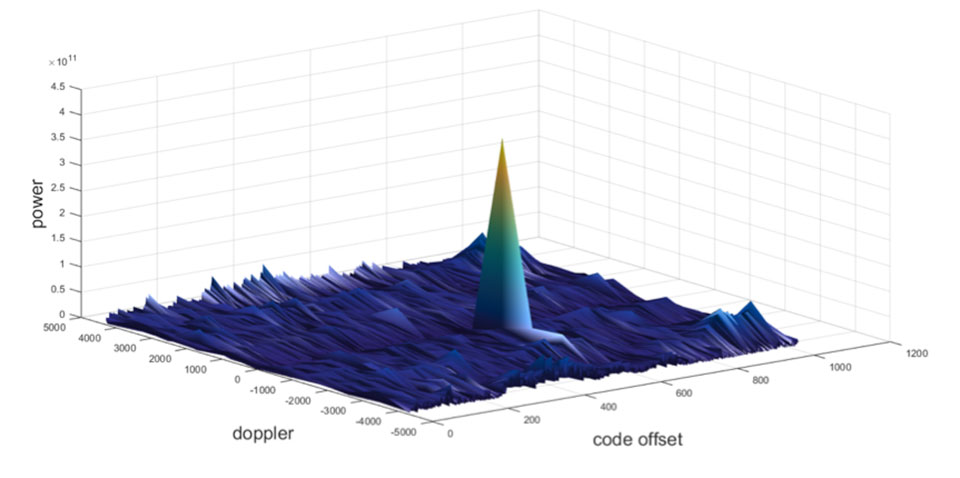
Let’s take a quick look at what it means to spoof GPS. A receiver searches for a satellite over a two-dimensional surface to find a correlation peak, and it must examine a range of Doppler frequencies and code offsets. An example is shown in Figure 1. Once the receiver finds the peak, the satellite is acquired, and it will then track the satellite as it moves and can demodulate the navigation data message.
When a spoofer comes along, it tries to recreate this peak. By doing so, and usually with little more power than the real satellites, the receiver will begin to track the spoofed signal. Once the spoofed signal is being tracked, the spoofer can begin to manipulate reality by slowly modifying the properties of the signal.
Figure 1. GPS correlation surface. (Image: Michael Jones)
A poor spoofer doesn’t always align itself very well with reality, which essentially creates a second peak on the correlation surface. But a gullible receiver can still be fooled by this, and may lock on to false peaks.
The reality of spoofing and anti-spoofing
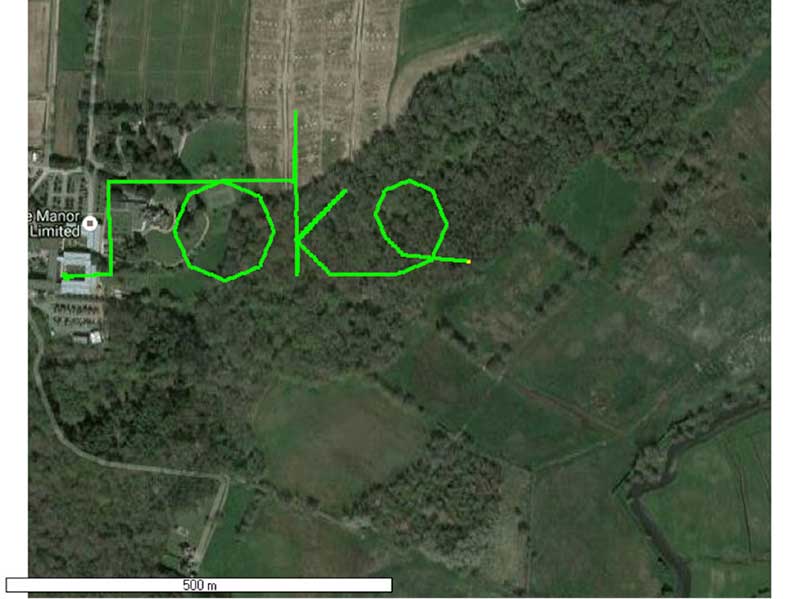
To understand the reality of spoofing and anti-spoofing, we carried out outdoor experiments at one of the Roke Manor trials areas (thanks go to my colleague Mike Wells for letting me use some of his results here).
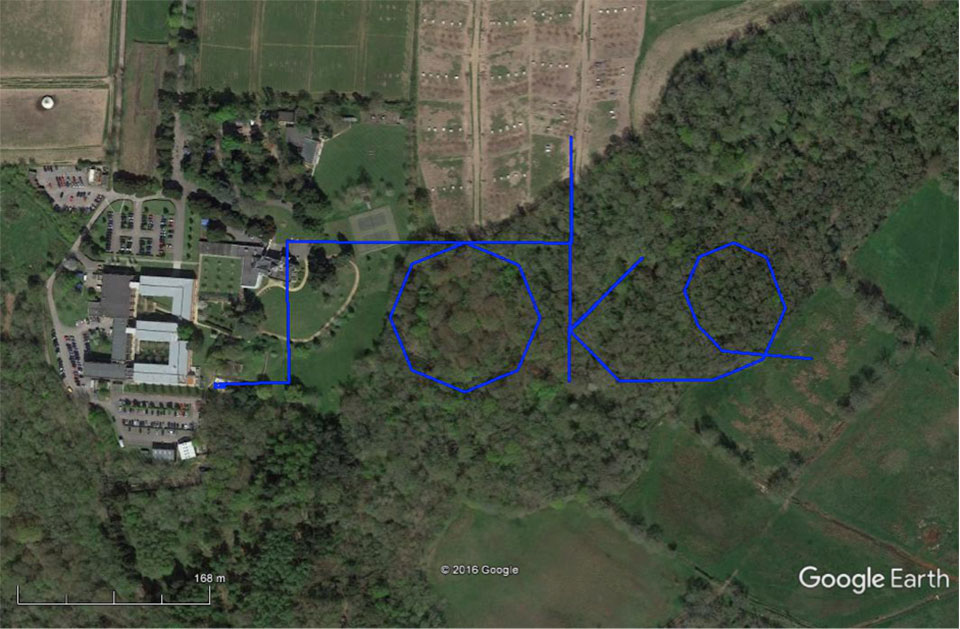
In the first experiment (Figure 2), we spoof a commercially available mass-market receiver. The receiver is outside, reporting its correct location at Roke Manor. When we commence the spoofing attack, we are able to take control of the receiver. Once captured, we can then make the receiver appear to follow an arbitrary course. Here we make it wander off into the forest, spelling the word “roke” as it goes.
Figure 2. Spoofed GPS receiver appears to follow a course, whilst in reality being stationary. (Image: Michael Jones)
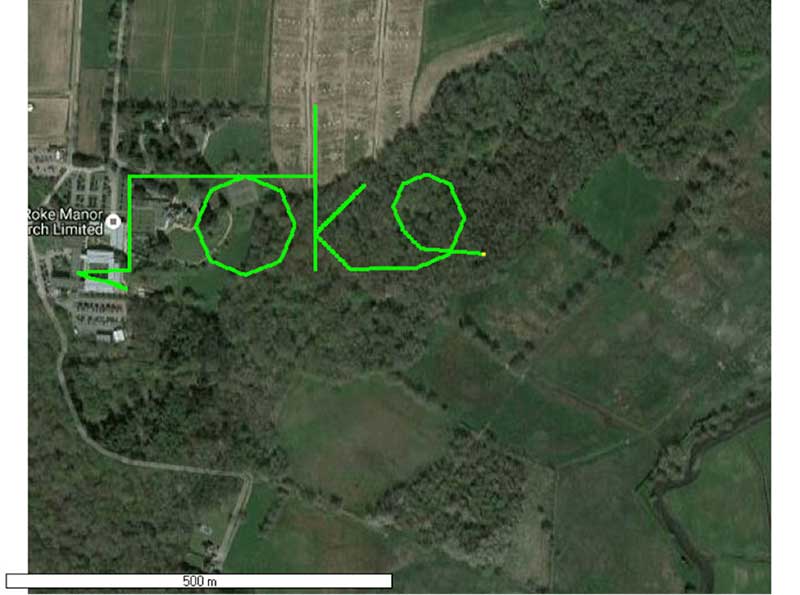
In the next experiment (Figure 3), we place a conventional anti-jam antenna (a CRPA) on the receiver. What we observe, as you might expect, is that the basic CRPA offers no protection against the spoofing attack.
Figure 3. A GPS receiver is still successfully spoofed when protected by a conventional CRPA. (Image: Michael Jones)
Now let’s make the experiment more interesting. We’ll move away from the basic commercial receiver, and replace it with a unit that contains not only a GPS receiver, but also a 3-axis accelerometer, 3-axis gyro, 3-axis magnetometer and a barometric sensor. An Extended Kalman Filter (EKF) performs an optimal fusion of the various sensors to yield the position solution.
The result, when we again try our spoofing attack, is shown in Figure 4. In short, the receiver is still successfully spoofed, despite the additional sensor inputs it offers.
Figure 4. A GPS receiver with integrated inertial sensors is still spoofed. (Image: Michael Jones)
Before everyone gets too depressed by the ease at which GNSS, and even GNSS fused with other sensors, can be spoofed, there are answers to this problem. Some decent, modern GNSS receivers contain a whole host of algorithms for detecting and ignoring spoof signals. The issue is that many legacy receivers are still in the field, and these can be extremely vulnerable indeed.
Another option is to use a more advanced CRPA, which offers anti-spoof capabilities. These adaptive antennas are able to correlate on the spoof signals, and then remove them based on direction of arrival. So, in our final experiment here, we use our commercial mass-market receiver again, and protect it with an anti-spoofing CRPA.
The result is shown in Figure 5. You can see that the receiver is briefly spoofed, and starts to wander off course. When the anti-spoof is enabled and kicks in, the position quickly drifts back to the true location and stays there. Good job.
Figure 5. With an anti-spoof CRPA, the GPS receiver detects the spoofer and quickly returns to its true location. (Image: Michael Jones)
Back to the Black Sea
Let’s finish by returning to the hot topic of the day. Did spoofing occur in the Black Sea back in June? Or was it a different form of interference? Could it have been a low-level jamming incident, causing the GPS receivers to report misleading information?
Without resorting to SIGINT (signals intelligence) data, and basing this discussion solely on public domain information and anecdotal evidence, I would say this was almost certainly a spoofing incident. A number of factors lead to this conclusion, and I’ll share some of them.
Firstly, it didn’t happen to one ship – it happened to over 20 separate vessels. So it wasn’t a malfunctioning GPS unit; it was an external incident of some kind.
Secondly, a large number of ships in the area reported identical or very close locations. This is a symptom of a large-scale spoofing attack. If it was a low-level jamming attack, then any misleading positions reported by vessels would typically have some randomness to them.
Thirdly, ships reported that their positions would periodically “jump” from the true location to the incorrect location. Again, this is very typical behavior in some spoofing experiments: For various reasons, GPS receivers may temporarily lose lock on a spoof set of satellites, and then reacquire the real ones, and vice versa. This causes the characteristic random flipping between two well-defined locations.
If we accept that a GPS spoofing attack did occur, it brings us to the million-dollar question.
Who did the spoofing, and why?
What I’ll do here is a bit of a lightweight analysis exercise using public information and basic physics, and you can formulate your own conclusions.
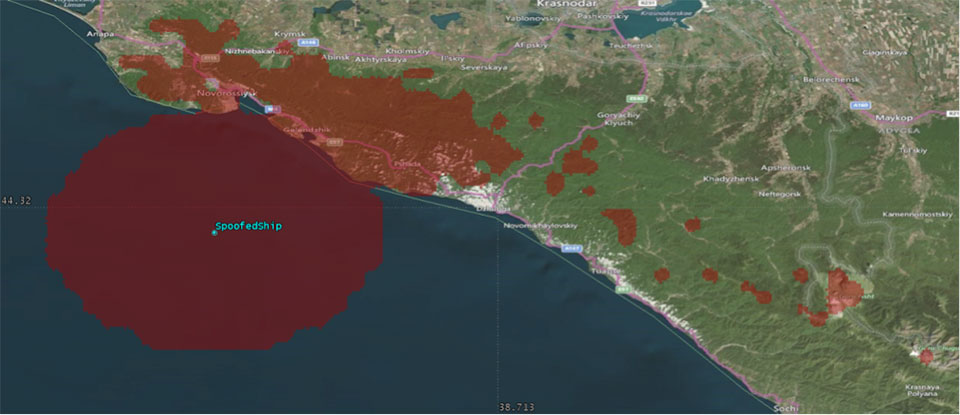
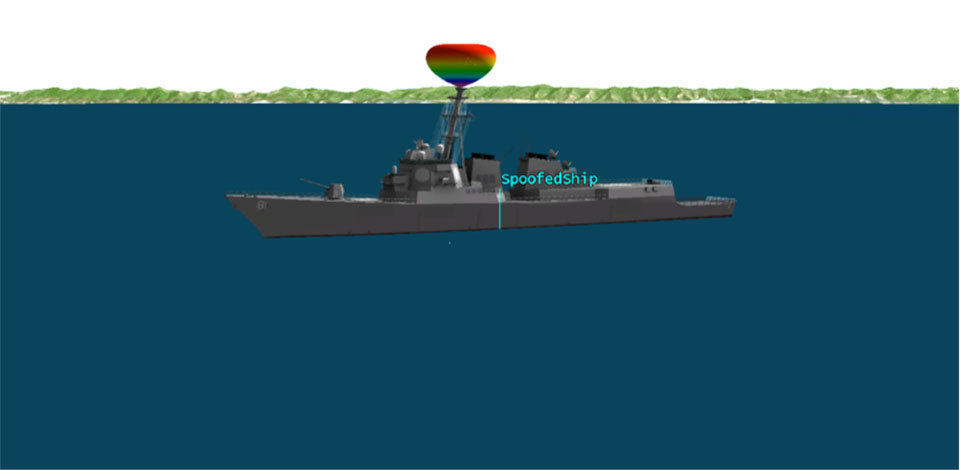
Let’s start by placing a ship, located in the Black Sea at 44°14.0’N 037°43.1E, which is the actual position of one of the reported spoofed vessels. For this example, I have placed a representative GPS antenna on the ship’s mast, with its antenna pattern shown.
Figure 6. Victim ship in the Black Sea, with GPS antenna pattern shown. (Image: Michael Jones)
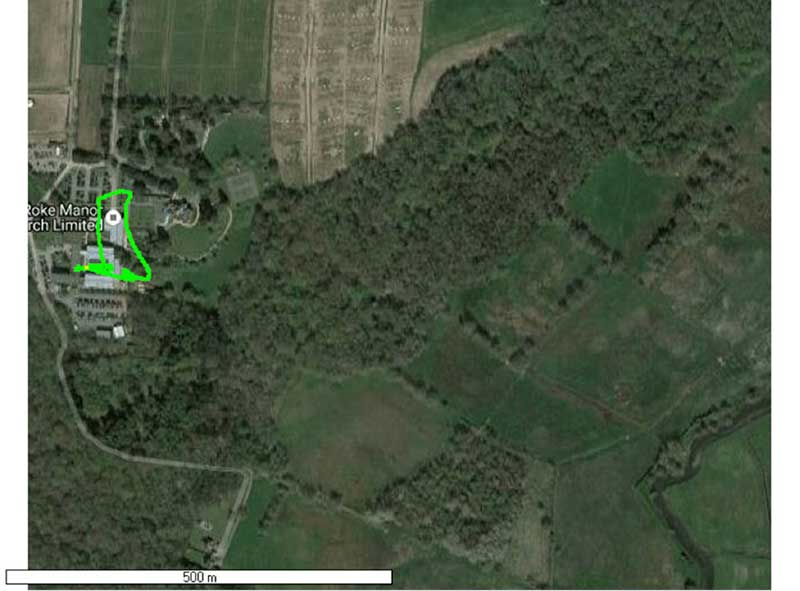
To get a rough handle on the scenario, consider the possible propagation of the spoofing signal. As a first-order approximation, let’s assume a standard 4/3 Earth refraction model, with obstruction by terrain. That’s a reasonable assumption at this frequency: Any obscuration by terrain will block the spoof signal. Let’s also initially assume that our GPS antenna on the ship is mounted 38 meters above sea level, and our spoofing equipment is mounted on a mast 20 meters aboveground. From this information, we can plot a map of possible spoofer locations for this particular incident (Figure 7).
Figure 7. Possible spoofing source locations. (Image: Michael Jones)
The first thing we might conclude from this is that the spoofing indeed originates from Russian territory, close to the Black Sea coast. To spoof the ship from further afield would require a much higher antenna, or even an airborne antenna. Which, of course, is possible, but then we would also expect vessels over a much wider area to report interference.
To me, it’s fairly conclusive that spoof GPS signals are being transmitted from this area, to make GPS receivers in the area think they are at an airport. The final question is: “Why would someone do this?” To answer this question, we must resort to educated speculation. Why would you want to spoof GPS receivers into thinking they are at an airport?
There’s one explanation that fits very nicely: drone defense. Many drones, especially those operated by casual users, have geofencing rules that prevent flights over airports and other restricted areas. So, if you were trying to perform aerial surveillance of the Russian border, your drone may suddenly think it was over an airport, and take action accordingly. The action taken depends, of course, on how the drone is programmed, but often includes “land immediately” or “return to launch point.” Certainly some of the drones we operate will immediately attempt to land if they find themselves in restricted airspace.
So if your drones are falling into the sea, you now have one idea why.
Topcon Positioning Group announces advances in its direct communication between the Bentley Systems design applications and the Topcon suite of software solutions with the release of MAGNET 4.3.1.
The MAGNET Enterprise Data Manager is designed to allow operators to directly access Bentley ProjectWise data with MAGNET Field, MAGNET Office or MAGNET Enterprise applications.
“The updates are part of our commitment to working with third-party software applications, such as the Bentley offering, to provide efficient data exchange and a seamless workflow environment,” said Jason Hallett, Topcon vice president of global product management. “When connected to MAGNET Enterprise from MAGNET Field, you can directly upload and download data from ProjectWise, allowing surveyors or machine control model-builders upload or download iModels or other project file types.”
The integration is designed to simplify data transfer from design to field, with the unique ability to read and import only the data users need for their projects.
“It builds upon our industry-first ability to offer ‘round trip’ iModels — sending them directly to field operators who can use and update them directly on the jobs site, and then send the updated iModels from the field back to Bentley ProjectWise,” Hallett said.
Solution doubles DigitalGlobe’s capacity to collect 30-centimeter commercial satellite imagery.
Raytheon Company has been selected by DigitalGlobe as the next-generation WorldView Legion satellite imaging constellation payload provider.
Under the contract, Raytheon will deliver the telescopes, detectors and combined electronics to Space Systems Loral, the WorldView Legion space vehicle integrator.
Raytheon’s new payload doubles DigitalGlobe’s capacity to capture multispectral and 30 cm imagery, while tripling to quadrupling the company’s capacity to image high-demand areas.
Once the WorldView Legion constellation is on orbit, DigitalGlobe’s combined constellation will be able to image the most rapidly changing areas on Earth every 20 to 30 minutes, from sunup to sundown. WorldView Legion will begin launching in 2020.
“We’re leveraging 45 years of extensive global experience in space imaging to provide DigitalGlobe with an unmatched view of the world from space,” said Rick Yuse, Raytheon Space and Airborne Systems president.
Raytheon’s payload solution maximizes efficiencies while maintaining quality, extending mission life, delivering a larger field of view and increasing coverage area.
“DigitalGlobe is proud to select Raytheon to develop the imaging payloads for our next-generation WorldView Legion satellite constellation,” said Walter Scott, DigitalGlobe founder, EVP and CTO. “We have exceptional confidence in the quality, performance and value of Raytheon’s instrument design, which will give our customers even greater insights into global events of significance and allow them to make critical decisions with confidence for many years to come.”
Just over three weeks remain to apply to the Mobile Monitoring Challenge (MMC), led by Stanford and the Environmental Defense Fund (EDF) with technical advice from ExxonMobil.
There’s a big push to develop mobile technologies to monitor and quantify methane leaks at oil and natural gas sites. Mobile monitoring offers the promise of surveying highly dispersed industrial facilities — including smaller and older ones — quickly and effectively.
Stanford and EDF, aided by industry and other expert advisors like those from ExxonMobil, will rigorously field test and compare the most promising new mobile technologies and approaches submitted via the MMC – with extra interest in commercially scalable options. Results will be published in peer-reviewed journals.
Details on the competition, what is required, and the benefits of applying can all be found here.
The Military Code (M-Code) Early Use (MCEU) contract will accelerate deployment of command and control of M-code capability to GPS IIR-M and GPS IIF satellites currently on orbit, as well as future GPS III satellites (like GPS III SV02 above). (Photo: Lockheed Martin)
The U.S. Air Force has awarded Lockheed Martin a $45.5 million contract to provide military code (M-code) early use (MCEU) capability to GPS.
MCEU will provide command and control of M-code capability to eight GPS IIR-M and 12 GPS IIF satellites on orbit, as well as future GPS III satellites, which the Air Force expects will begin launching in 2018.
MCEU is envisioned as a way to accelerate M-code’s deployment to support testing and fielding of modernized user equipment in support of the warfighter.
The U.S. Air Force’s MCEU contract directs Lockheed Martin to upgrade the existing Architecture Evolution Plan (AEP) Operational Control System (OCS), allowing it to task, upload and monitor M-code within the GPS constellation. The contract includes new software and hardware development that will be deployed in 2019 to worldwide ground facilities that support the Air Force’s GPS.
The AEP OCS — maintained by Lockheed Martin under the GPS Control Segment (GCS) Sustainment Contract — controls the 12 GPS IIR, 8 IIR-M and 12 IIF satellites in orbit today. The company has successfully implemented several recent projects to modernize and sustain the system for the Air Force.
U.S. Department of Defense units and university researchers gathered at Edwards Air Force Base, in California, to evaluate various aerial platforms in a degraded GPS environment. The week-long test event called Developmental Test Navigation Festival (DT NAVFEST) was the first large-scale program of its kind, according to James Cook, KC-46A project manager with the 418th Flight Test Squadron.
“DT NAVFEST was established to provide a locally more realistic GPS jamming environment in which aircraft platforms and unmanned aerial vehicles could evaluate their performance under a degraded GPS signal,” Cook said. “Other locations around the U.S. provide such environments, but having it locally allowed for direct program input and cost savings to customers by not having to deal with the logistics costs of deploying to those locations.”
Units that tested assets at Edwards included the Emerging Technologies Combined Test Force, the 411th, 416th, 419th and 461st Flight Test Squadrons, Stanford University, the University of Illinois, and the U.S. Army’s Special Operations Command. The GPS jammers and support came from the 746th Test Squadron at Holloman Air Force Base, New Mexico.
“Live GPS jamming data is extremely difficult for academic labs to obtain due to the complexity of working with the Federal Aviation Administration and regional first responders,” said Wei Lee, test safety engineer with the 412th Test Wing. “It is crucial that the Department of Defense support basic research and development that is ongoing in our nation’s top academic institutions. Many of the low-technology readiness-level projects will eventually migrate from academic labs to defense industry and military applications. Allowing the labs to participate on a non-interference basis is a win-win situation.”
The GPS jammers employed had a vertical reach of upwards of 30,000 feet.
The 746th Test Squadron from Holloman Air Force Base, New Mexico, provided an array of GPS jamming equipment and support for DT NAVFEST at Edwards Air Force Base. The jammers provided a degraded GPS environment for testing multiple aerial platforms throughout the week. Testing was done from 1 to 6 a.m. each day to minimize impact on the community and civilian air traffic. (Photo: U.S. Air Force/Cole Johnson)
IRNSS launch unsuccessful
A launch of a new Indian Regional Navigation Satellite System (IRNSS) satellite failed when the protective fairing did not separate. The 1425-kg satellite was expected to expand the existing seven satellites of the NavIC constellation. The launch vehicle PSLV-C39 lifted the satellite on Aug. 31.
The three phases of the launch went smoothly, but the heat shield that was supposed to be separated in the fourth stage could not be detached. IRNSS-1H was planned as a replacement satellite for IRNSS-1A.
Following successful test flights, Insitu’s ScanEagle helps combat Oregon wildfire.
UAV company Insitu and Esri have successfully completed test flights on a new way to support firefighting efforts using software for firefighters and first responders.
The flights were held at the Warm Springs Federal Aviation Administration (FAA) Unmanned Aerial System (UAS) Test Range in Oregon. The test site is a Pan Pacific FAA UAS Test Site for commercial UAS testing. The national FAA test site program facilitates the UAS industry in meeting strict customer needs and qualifications.
Insitu is a wholly-owned subsidiary of The Boeing Company.
A week after successfully completing customer acceptance test flights, Insitu, which has more than one million operational UAS flight hours, deployed its INEXA Solutions professional aerial remote sensing teams to aid firefighters in suppressing the Eagle Creek fire in Oregon.
Onlookers watch the fire burn in the Columbia Gorge on Sept. 4. The fire is now contained. (Photo: U.S. Forest Service)
Collaborating with customers to identify business challenges, INEXA Solutions professionals use a continually expanding suite of capabilities such as INEXA Control (ground-based command and control), INEXA Cloud, INEXA manned and unmanned air vehicles including ScanEagle, and INEXA sensors and analytics to provide custom solutions and answers to mitigate business challenges from seabed to space.
Coordinating with the Oregon Department of Forestry and other governing entities, Insitu’s ScanEagle system provided optimal, near real-time data for firefighters and first responders, resulting in heightened emergency response efforts, increased situational awareness and safety, and supported planning and resource allocation.
Equipped with electro-optical (EO) for daylight and infrared (IR) video for nighttime flights, along with mid-wave sensors, the ScanEagle surveyed fire lines at night over the Eagle Creek wildfire, which had spread to nearly 49,000 acres throughout the Columbia River Gorge region.
The ScanEagle can supplement manned firefighting fleets by operating during dense smoke and at night, when manned aircraft typically cannot fly. Infrared camera technology can penetrate smoke and gather and disseminate georeferenced still images of points of interest. These images allow geographic information system (GIS) specialists to perform analysis using Esri’s ArcGIS software.
“Throughout the difficult Eagle Creek wildfire, our thoughts have been with our friends and neighbors impacted by this unfortunate event,” said Mark Bauman, vice president and co-general manager, Insitu Commercial. “We stand prepared to assist local authorities with ongoing operations in any way we can, and we extend our gratitude to all of those working hard to contain the fire.”
ScanEagle poised for launch at Eagle Creek, Oregon, fire.
As the sole aviation overwatch within the temporary flight restriction, the ScanEagle provided persistent nighttime oversight and monitored the progression of the fire. Insitu coordinated manned and unmanned aviation assets and through data collection, analysis and integration capabilities, produced near real-time georeferenced spatial data (maps tied to specific known locations).
In this way, incident commanders, firefighters, and first responders had data that delivered updated incident perimeter maps, identified spot fires, located fire lines and hotspots, and provided near real-time video feed and still images of critical infrastructure, historical structures and more.
“Prior to pursuing any new effort, we consider the reasons we exist as a company — we call it our ‘why,’ explains Jon Damush, Insitu’s chief growth officer. “Insitu’s ‘why’ is to pioneer and innovate in all that we do to positively impact people’s lives and change the course of history,” he continues. “This statement guides our actions and investments, and is precisely why we are doing the things we are doing to help those in need with our unique technologies and professional approach to aviation.”
Hexagon AB has acquired Luciad, a Belgian-based software company specializing in the visualization and analysis of real-time geospatial information.
Luciad’s visualization technologies support live connections to dynamic sensor feeds in a 3D environment. The result is a 5D digital reality — real-time, rapid fusion of multi-source content and the ability to perform analytics on-the-fly.
These intuitive command and control systems benefit all kinds of applications, from public safety to smart cities to defense and intelligence, enabling users to make critical decisions based on changing information in real time.
“This acquisition strengthens Hexagon’s ability to deliver smart digital realities, enhancing our Smart M.App platform with 3D, 4D (real-time sensor feed integration) and 5D (dynamic analytics) capabilities,” said Hexagon president and CEO Ola Rollén. “The ability to rapidly integrate sensor data in a visually compelling environment provides the geospatial location intelligence and situational awareness necessary for mission critical operations.”
Luciad has more than 100 highly-skilled professionals in eight countries, with 100,000 users of its technology globally.
Luciad will be fully consolidated as of today, operating within Hexagon’s Geospatial division. The company’s turnover for 2016 amounted to 16 MEUR.
The Riegl VQ-780i waveform processing airborne laser scanner is a high-performance, rugged, lightweight and compact airborne mapping sensor designed for ultra-wide-area mapping and high productivity.
The versatile system is designed for highly efficient data acquisition at low, mid and high altitudes, covering a variety of different airborne laser scanning applications from high-density to ultra-wide-area mapping.
The system provides clutter-free point clouds with high accuracy, excellent vertical target resolution, calibrated reflectance readings and pulse shape deviation for unsurpassed information content on each single measurement.
The Riegl VQ-1560i-DW dual wavelength waveform processing airborne lidar scanning system is for high-point-density mapping applications. The new airborne lidar scanning system offers two lidar channels of different wavelengths: green and infrared (IR).
The two wavelengths allow the acquisition of scan data of complementary information content, delivering two independent reflectance distribution maps and enhanced target characterization, one per laser wavelength.
The VQ-880-GH topo-hydrographic airborne laser scanning system has online waveform processing and full waveform recording. It is a fully integrated airborne laser scanning system for combined hydrographic and topographic surveying with an form factor with reduced height optimized for helicopter integrations.
The system is offered with an integrated and factory-calibrated high-end GNSS/IMU system and up to two cameras. The design allows flexible application of these components to meet specific requirements.
DJI has launched a new Local Data Mode that stops internet traffic to and from its DJI Pilot app, providing enhanced data privacy assurances for sensitive government and enterprise customers.
Local Data Mode will be available in the next update on the DJI Pilot app on CrystalSky and for select Android tablets.
When an operator activates Local Data Mode, the app will stop sending or receiving any data over the internet. This adds an additional layer of security for operators of flights involving critical infrastructure, governmental projects or other sensitive missions.
“We are creating Local Data Mode to address the needs of our enterprise customers, including public and private organizations that are using DJI technology to perform sensitive operations around the world,” said Brendan Schulman, DJI’s vice p resident of policy and legal affairs. “DJI is committed to protecting the privacy of its customers’ photos, videos and flight logs. Local Data Mode will provide added assurances for customers with heightened data security needs.”
Since Local Data Mode blocks all internet data, the DJI Pilot app will not be able to detect the location of the user or show map and geofencing information such as No Fly Zones and temporary flight restrictions, nor will it notify drone operators of firmware updates.
Telemetry data on flight logs such as altitude, distance or speed will remain stored on the aircraft even if the user deactivates Local Data Mode.
Whether Local Data Mode is activated or not, photos and videos captured by the user are always stored on the drone’s SD card and are only shared if the user chooses to upload them online to the SkyPixel community, social media or other websites.
When using Local Data Mode, drone operators are reminded that they are solely responsible for the safety of their flight operation and that they understand that features that may enhance and support the safety of their operations, but that rely on internet connectivity, are no longer available.
Drone operators can enable Local Data Mode by opening the DJI Pilot app, clicking on “Activate LDM Mode” and entering a password which will be required to deactivate Local Data Mode when they decide to go online again.
New drones will still have to be activated first by logging into the user’s DJI account with an email and a password. To ensure the drone has the latest firmware, users can download and update it while they have internet connectivity before re-activating Local Data Mode.
The Local Data Mode feature may not be available in locations where an internet connection is required or highly advisable due to local regulations.
 After two decades of providing the U.S. government with Geiger-mode lidar data, Harris Corporation offers high-resolution lidar data and its derived products to commercial organizations.