Author: Tracy Cozzens

  • On the Edge: History Underfoot

    Camps-W . Credit: Tracy Cozzens
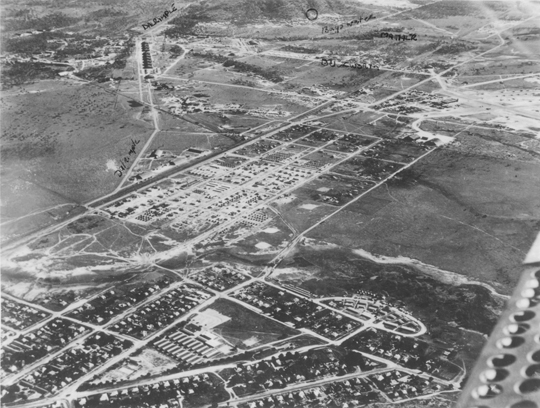
    A U.S. Army camp near Townsville’s suburban areas, circa 1944.

    By Tracy Cozzens

    Beneath the surface of a tropical paradise in the city of Townsville on Australia’s Sunshine Coast lies a hidden maze of tunnels and underground bunkers, once said to be used by General Douglas MacArthur. Learning the secrets of this labyrinth that was a major World War II staging point for battles in the Southwest Pacific is the passion of Kevin Parkes of Geo Positioning Services, Townsville.

    Parkes’ main tool is historic aerial photography, coupled with hours of research in the National Australian Archives and the National Library of Australia. To that he adds geophysical surveys of the infrastructure. Parkes is undertaking the geophysical surveying and mapping using an Ashtech ProMark 100 GNSS receiver and a Willy Bayot PPM Mk 3 magnetometer. He used the magnetometer and GPS receiver in parallel, later processing both data sets.

    After the attack on Pearl Harbor and the Japanese advance through Asia, Townsville’s population bloomed from 30,000 to 120,000 by mid-1943. The rapid military influx stretched resources to the breaking point.

    The U.S. Army 5th Air Force established the largest aircraft repair and maintenance facility ever built in the southern hemisphere at Townsville, and the site became the technical hub of U.S. military aviation. Air Force Service Command Depot #2 at Townsville was capable of overhauling 300 aircraft engines per month and performed aircraft assemblies, modifications, overhauls, and maintenance. Major resources and facilities serviced the Royal Australian Air Force, Australian and U.S. Armies, Royal Netherlands Air Force, Royal Air Force, Canadian forces, Royal Navy, and other allied forces.

    “A visitor to Townsville today would be forgiven in asking where the artifacts of this massive military facility are today,” Parkes said. “There is very little remaining in any built structures that give any idea of what happened in this city 70 years ago.”

    Parkes realized that underground cave shelters were most likely used for warehousing and storage, to keep stores out of the weather and protected from enemy action.

    He describes one area he investigated, a park in Townsville used as an officer’s accommodation camp. Preliminary magnetic anomaly surveys indicated linear anomalies were beneath the park surface. A high-resolution survey gave samples of about 1.5-meter resolution.

    “The difficulty was reducing all noise levels down to a minimum, including the X/Y positioning, so the GPS requirements came down to survey quality,” Parkes said. “It is absolutely critical that the GNSS receiver and magnetometer keep in synchronization during data collecting runs including under the frequently encountered tree canopies.”

    To improve accuracy, Parkes avoids using real-time kinematic survey equipment. “That would involve having another electronic device operating and emitting more noise in the signal spectrum,” he said. The need to position the GPS antenna in close proximity to the magnetometer sensor was a major issue with all on-pole RTK systems.

    Air-raid-shelter-W . Credit: Tracy Cozzens
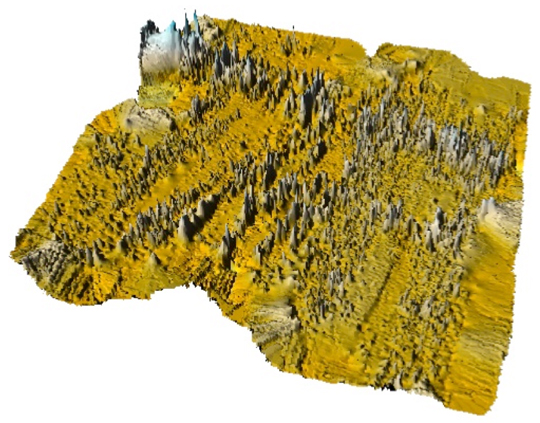
    A U.S. Army air raid shelter under the officer’s accommodation camp, mapped with GPS and magnetometer data and using Surfer 3D surface mapping software.

    With an Ashtech Promark 3, post-processed results were better than 100-millimeter X/Y coordinates. “The unit is lightweight and self-contained,” Parkes said. “The noise from the Ashtech survey-grade external antenna’s effect on the magnetometer data was insignificant.”

    Still, this park had a grove of trees that defied every attempt to maintain GPS reception and consequently synchronize the magnetometer. Along came the Ashtech ProMark 100, a lightweight and self-contained receiver with external geodetic antenna with GPS and GLONASS. “My first attempt at surveying under the trees was spectacular to say the least,” Parkes said. “Synchronization with the magnetometer data was near perfect.”

    The dual-constellation reception of the ProMark 100 became essential to the success of Parkes’ work. After more than a hundred data-collection passes with the magnetometer and ProMark 100 through the groves of trees, at no time did the Position Dilution of Precision (PDOP) rise to more than three, and at all times more than eight satellites were available. The ProMark 100 data is post-processed to improve accuracy. Parkes noted that ironically many of the most interesting finds have been collected under heavy tree canopy. Without the quality of the geographic positions enabled by the ProMark100 under tree canopy, Parkes said that much of his work would have been impossible to achieve.

    Equipment-W .  Credit: Tracy Cozzens
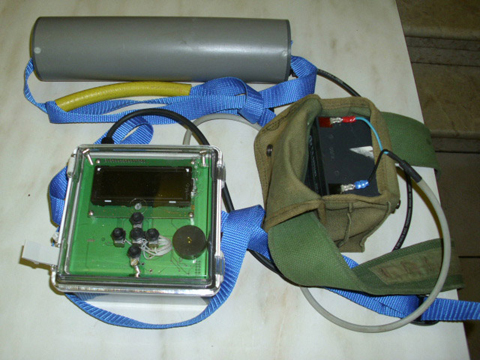
    Parkes’ surveying equipment includes a magnetometer and a ProMark 100 GNSS receiver.

    In fact, when Parkes first began his mapping project in 2005, he used a single-constellation GPS system and post processed the results against the local International GNSS Service (IGS) reference station. The GPS-only system worked very well until a grove of trees would interfere with the sky. Now with the ProMark 100 GNSS receiver, Parkes surveys using GPS L1 and GLONASS in continuous kinematic mode at a one-second collection rate. He then post processes the data against another ProMark 100 used as a local reference station.

    To date, Parkes has mapped an underground railway, artillery observation posts, several shelters, fuel terminals and other yet-to-be-identified pieces of the vast infrastructure.


    Rowes-Bay-W .  Credit: Tracy Cozzens

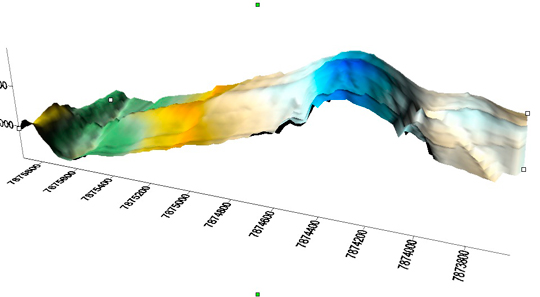
    During his Research, Parkes mapped a major magnetic anomaly in Cleveland Bay. In 1770 Captain James Cook in the HMS Endeavour mapped the east Australian coast. Venturing into Cleveland bay, Cook noticed his compass behaving erratically, and named one island Magnetic Island. Today, a 3D surface model reveals a large magnetic anomaly heading across Cleveland Bay and straight towards Magnetic Island, 7 kilometers from Townsville. Experts who have examined the data believe that it is a naturally occurring magnetic anomaly about 800 meters wide. “It would appear that Captain James Cook was indeed a very capable navigator and cartographer,” Parkes said.

  • On the Edge: Go Big Green

    By Tracy Cozzens

    Nav On Time, a French Company located in Toulouse, has successfully completed a trial campaign of its Mow-By-Sat precision guidance on a commercial lawnmower. In August, the prototype of a GPS-guided robot lawnmower was installed on a golf driving range near Toulouse and tested in real conditions of use, day and night, maintaining a 25,000 square meter lawn since then. In a previous campaign, the mower covered more than 2.2 million yards — equal to1,250 miles or 2,000 kilometers — in 2,100 hours. (See videos of the mower in action at www.youtube.com/DSnavontime.)

    With such a success under its belt, Nav On Time is negotiating with different lawnmower manufacturers to bring a product to market. The autonomous lawnmowers already on the market, including machines commercialized by research partner BelRobotics, use underground wired perimeters for delimiting the lawn by an electromagnetic signal, the strength of which is measured by a mower-embedded sensor to determine its distance to the lawn’s limit. But that wire, and its required installation, are technical barriers for a lot of potential customers. Nav On Time is one of the companies developing solutions to get rid of the perimetric wire yet still be able to guide the mower autonomously with accuracy and efficiency.

    Between January 2009 and June 2010, Nav On Time coordinated the Mow-by-Sat project, a research and development effort that received funding from the European Union’s Seventh Framework Programme (FP7/2007–2013). Partners included Belrobotics of Belgium, a large lawn-maintenance robot manufacturer, and the University of Catania in Sicily, Italy, through its robotics research department.

    The Mow-by-Sat project (www.mow-by-sat.eu) was also undertaken to support development of a GNSS-based navigation and guidance system integrated into an autonomous lawnmower, paving the way for industrialization and commercialization of GNSS applications for a domestic service robot operating outdoors. Beyond this concrete application, the project aimed to increase the adoption of GNSS technologies in robotics applications, studying the benefits of European GNSS (especially EGNOS and Galileo).

    Mow-By-Sat uses a virtual fence to replace the wired boundary traditionally used in robot lawnmowers, which provides better flexibility for defining and modifying a mowing area. Mow-By-Sat enhances the machine’s efficiency by a factor of three, as full steering substitutes for the random operation mode, the company said.

    Built around a European GNSS L1 automotive receiver, the u-blox T, Mow-By-Sat uses L1 fixed / floating real-time kinematic (RTK) techniques. A tight coupling between the RTK positioning firmware and the guidance application software aids the mower’s precision. Nav On Time compared it to the challenges of aviation, where the required navigation performance depends on the flight phase.

    In its patented architecture, the module embedded in the rover is dumb, and the ground-based station acts as a remote control, ensures traffic management between several machines, and serves as a gateway for remote services such as installation, supervision, and surveillance, all accessible from the Internet. Nav On Time developed both the positioning firmware and guidance application software.

    According to Nav On Time CEO Michèle Poncelet, Mow-By-Sat offers significant competitive advantages to the machine manufacturer compared to expensive RTK solutions now on the market. She cited:

    • easy customization because of its open architecture,
    • an affordable solution for small and inexpensive mobile machines,
    • a technology enabler for replacing human-controlled and energy-consuming machines with smaller and cheaper machines that have a smaller carbon footprint.

    With six Engineers, Nav On Time, founded in 2007, is offering a product line dedicated to precision control solutions for small and inexpensive mobile machines, under a business-to-business model through industrial partnerships. According to Poncelet, its market stretches from human controlled machines (precision agriculture or crane collision avoidance) as driver’s assistance, to unmanned machines (autonomous lawnmowers, other unmanned ground vehicles, intelligent vehicles, and more generally service robots) with full steering.

    Other applications envisioned by Nav On Time include a golfball retrieval robot for driving ranges, a beach cleaner robot, and a surveillance robot — any application that requires passing through a pre-determined area in a methodical and systematic way.

    Breaking Ground

    It would seem mowing lawns isn’t a beloved pastime, as autonomous lawn mowers have been the subject of numerous research projects. For the past eight years, the Institute of Navigation has sponsored a Robotic Lawnmower Competition as a way to encourage college students to develop autonomous steering techniques. During the second ION Autonomous Lawnmower competition, Frank Van Graas, who accompanied the winning Ohio University team, told GPS World, “The centimeter-level positioning accuracy required for lawnmowers in the contest is actually more difficult than automatically landing an airplane.”

    One research project, carried out by Navcom Technology in 2005, resulted in an autonomous mower taking on the precise mowing techniques of baseball stadiums, with its checkered patterns. The Navcom project, documented by Michael Zeitzew in his paper “Autonomous Utility Mower,” used a series of beacons to augment GPS. Two off-the-shelf John Deere utility mowers were modified for X-by-wire control, and fixed navigation beacons were mounted around the stadium. Next, the field boundaries were surveyed and input into a map file, used to create the mower’s mission plan.

    “The use of GPS requires good sky visibility,” explained Zeitzew. “In this application, due to the stringent navigation accuracy requirements, an RTK-GPS solution is required, which requires the use of a base station. Because many of the baseball stadiums have high walls and other obstructions around the field, RTK-GPS is inadequate, even with augmentation by (affordable) inertial sensors or odometry sensors. This necessitated the use of alternative technology.”

    Navcom fielded two mower systems into professional baseball stadiums, one major league and one minor league. Both systems were used over the course of several weeks during the spring 2005 baseball season, and received positive reviews from the professional groundskeepers, who quickly grew comfortable using the machines. The project proved not only that autonomous mowers are possible even for large-scale sites such as a stadium, but that there is indeed a market for them.


  • Faster? Shorter? Try Cheaper, Greener: Program Gives Drivers the Most Fuel-Efficient Route

    By Tracy Cozzens

    Most GPS devices in cars today give the driver two choices: shortest route or fastest route. GreenGPS provides a third option: most fuel-efficient route.

    With gas prices skyrocketing, many drivers would be happy to spend a few more minutes on the road, or take a different route, if it meant burning less gas.

    The answer could be the GreenGPS navigation service, now being developed by researchers at the University of Illinois at Urbana Champaign (UIUC), which finds the most fuel-efficient route for your vehicle.

    “The most fuel-efficient route may be different from the shortest route because the latter may pass through downtown stop-and-go traffic,” explained Tarek Abdelzaher, project lead and computer science professor. “It may also be different from the fastest route because vehicles are not as fuel efficient at higher speeds.”

    All cars manufactured in the U.S. since 1996 come with a standard interface to their internal gauges and engine measurements called the On-Board Diagnostics Interface, or OBD-II. GreenGPS runs on the driver’s GPS-enabled cell phone and uses an off-the-shelf wireless adaptor plugged into the vehicle’s OBD-II port to receive engine readings via Bluetooth.

    The cell phone collects the readings and connects to a server that models the engine’s fuel efficiency and customizes navigation advice to the particular vehicle, Abdelzaher explained.

    The best route computed by GreenGPS to the same destination may differ from one vehicle to another. “For example, my vehicle uses about 20-25 percent more gas in stop-and-go traffic compared to free-flowing traffic, whereas my wife’s car uses closer to 40 percent more,” Abdelzaher said. “GreenGPS may recommend to her a path that is longer but has no traffic, whereas it might recommend to me a path that incurs some traffic but is shorter.”

    To users, GreenGPS looks like a regular navigation service. The driver specifies a destination, then ask the service to find a route. “It runs on your cell phone, except that in addition to the fastest and shortest route options, it offers the ‘least-fuel route’ option,” Abdelzaher said. “If the driver chooses that option, they receive the GreenGPS-recommended fuel-efficient route.”

    The program works best with a small hardware addition to collect readings specific to the vehicle. “In order for the advice to be customized to the performance of your specific vehicle, the driver should invest in buying the OBD-II adaptor. It costs about $50 and is a one-time investment,” Abdelzaher said.

    “If the driver does not wish to buy the adaptor, they can still use GreenGPS and supply the make, model, and year of their vehicle. In this case, GreenGPS will use data from other vehicles of the same make, model, and year, or vehicles as close to them as possible to compute the navigation advice,” Abdelzaher said. This social networking component is also being developed as part of the project.

    The system pulls the GPS data from the driver’s cellphone. “If you use a GPS phone (and most smartphones have GPS), the system simply finds out your current location from your phone. Otherwise, you would need to supply both source and destination addresses (like you would when you get directions from Google Maps) and the system will show you the route on a map.”

    Gas-Saving Pilots. In the first stage of testing, the team solicited volunteers to drive in the area of their university, in Urbana-Champaign, a city of 170,000. In all, 1,000 miles were driven by 16 different cars. Results demonstrated that following the fuel-efficient route saves on average 6 percent over the shortest route, and 13 percent over the fastest. “This was done on flat terrain and in the absence of significant congestion,” Abdelzaher said. “We expect that testing in higher traffic and richer topology will increase the variability in fuel consumption among different routes, resulting in even more potential savings when following the most fuel-efficient route. Verifying this conjecture is currently a topic of investigation for our ongoing research project.”

    Abdelzaher said his team has just started the second stage. “In the second stage of testing, we will deploy GreenGPS on the UIUC Facilities and Services fleet (about 100 cars) and monitor performance over a longer period of time. Preparations for this deployment are currently under way. We also expect to offer GreenGPS publicly to any other volunteers who wish to help with testing.”

    Impressed by early findings of gas savings, the second phase is being funded in part by a $300,000 grant from the National Science Foundation. Abdelzaher and Robin Kravets, another UIUC computer science faculty member, were awarded the grant this spring. It will help deploy GreenGPS among the campus fleet cars, and track and analyze the results.

    “By sharing data on speed, fuel efficiency, and location of vehicles, better real-time navigation services can be developed that guide drivers to routes that are maximally fuel-efficient for their cars, hence reducing transportation carbon footprint,” the grant reads. “This project helps usher in a new era of sensing applications with more integration of humans, networks, and the physical world, which may have a significant impact on the economy, energy, and the environment by reducing transportation energy cost and carbon footprint.”

    Other grant providers are the Office of Naval Research, which is funding research on the technology’s networking component, and IBM through its Smarter Planet initiative. As a part of this project, 200 or more cars in the Urbana-Champaign area of various makes and models will be fitted with GreenGPS. Through a social network of drivers, data and routes collected can be shared and used by those who don’t have the OBM-II adaptor installed.

    GreenGPS-Table-W  Source: Tracy Cozzens
    Fuel consumptions for the various roundtrips between different landmarks.
    GreenGPS-maps-B  Source: Tracy Cozzens
    The landmarks and corresponding shortest and fastest routes.
  • Detecting Nuclear Testing: Software Under Development by OSU Could Pinpoint Treaty Violations

    By Tracy Cozzens

    infobox_chart_2009-W Source: Tracy Cozzens
    Figure 1. Worldwide nuclear testing 1945–2009 (CTBTO website).

    Can GPS be used to detect underground nuclear explosions?

    A research team is developing a software program that uses GPS to analyze the ionospheric effect of nuclear explosions. Results would show when and where a country has conducted a secret underground nuclear test. Team members are Jihye Park, Ralph. R. B. von Frese, and Dorota A. Grejner-Brzezinska from The Ohio State University and Jade Yu Morton from Miami University.

    The Comprehensive Nuclear-Test-Ban Treaty was adopted by the United Nations General Assembly in 1996, but not all nuclear countries have ratified it, including the United States, China, Egypt, Indonesia, Iran, and Israel. Also, India, North Korea, and Pakistan have not signed the treaty.

    Park, a doctoral student in geodetic science at Ohio State, created the computer program to detect changes in the ionosphere from nuclear weapons testing.

    A previous study showed that the ionosphere was disturbed by underground nuclear testing conducted by Russia in 1990. GPS is capable of precisely measuring the total electron content (TEC) of the ionosphere along the path between satellite and receiver at a GPS station, so Park and her team decided to begin researching the use of GPS in detecting nuclear explosions.

    “Many studies have been done to monitor and model the atmosphere using GPS technology,” Park said. “Research has proven that GPS can detect natural disasters such as earthquakes or tsunamis. This study broadens those areas of study with its capability to detect underground explosions.”

    Detonation of a nuclear weapon results in a shockwave that travels through the atmosphere, changing the density of charged particles in the ionosphere. “The explosions can’t hide from the ionosphere,” said von Frese, geophysicist and project leader. “Our technology would be another nail in the structure to detect explosions.”

    “One of the arguments is ‘Well, how do you prove that a clandestine explosion occurred?’” said Grejner-Brzezinska, Park’s adviser and GPS World’s Tech Talk blog editor. “Now we can say, ‘Here, we have the data from GPS to show when and where.’”

    According to the Comprehensive Nuclear-Test-Ban Treaty Organization (CTBTO) nuclear testing has been carried out in the past by the United States, Russia, the United Kingdom, France, China, India, Pakistan, and North Korea (see Figure 1).

    Fig2_W Source: Tracy Cozzens

    Researchers, and those monitoring treaty violations, are able to target specific geographic areas that are equipped for tests, since development of a nuclear test site requires a lot of technical effort and budget. For example, the North Korean tests carried out in 2006 and 2009 were very close geographically.

    “They tend to stick to the same site and reuse their facilities for nuclear testing,” von Frese said. “So a country that has previously conducted underground nuclear testing probably will reuse the site if new testing is needed.”

    “They could be monitored using GPS as long as there are GPS stations nearby,” Park said.

    The new GPS nuclear-detection technology was presented at the Comprehensive Nuclear-Test-Ban Treaty Organization meeting held June 8–10 in Vienna, Austria, and received press coverage that drew additional interest.

    GPS Detection. The team zeroed in on a specific event to test the software, selecting a nuclear test conducted by North Korea in 2009 and using data pulled from nearby South Korean GPS stations.

    Traditional detection methods for underground nuclear tests include seismic and other sensors. The CTBTO operates an international monitoring system to detect explosions with a yield of at least one kiloton. Besides seismic sensors, monitoring includes hydroacoustic sensors to monitor for shockwaves on land and in water, infrasound to detect pressure waves, and radionuclide detectors for any gas that may have been generated, though the levels aren’t always detectable.

    “Even though there are four different systems available, they sometimes are unable to detect the underground nuclear explosions,” Park said. “GPS technology will make the detection validation stronger since each of them is based on a different theory. In the case of the nuclear test conducted by North Korea in 2009, only seismic and a few infrasound sensors detected the event because of their improved containment technique. Our study tracked down the 2009 event using GPS, and found it coincided with the seismic results.”

    Park was able to take advantage of the well-established worldwide infrastructure already in place for GPS for her software test. The team used GPS data recorded by South Korean GPS receivers of the 2009 North Korea test. “There are a few IGS (International GNSS Service) stations in South Korea, China, and Japan. Since South Korea runs their own GPS network, I requested the data so that we could obtain data from more stations located in South Korea,” Park said.

    “Since the stations we chose were permanent reference stations controlled by an international organization (IGS) and a specific country (Republic of Korea or South Korea) respectively, most of them have been running continuously except for unexpected data gaps from time to time,” Park said. Figure 2 shows the GPS stations processed for the project.

    With data in hand, Park was able to test her software. The results showed definite peaks from different stations at different times after the 2009 explosion. “We realized that the time of the detected peak was dependent on the distance between underground nuclear explosion and each GPS station,” Park said. Figure 3 shows four different stations’ TIDs (traveling ionospheric disturbances) that the team initially recognized.

    TIDs_obvious-W Source: Tracy Cozzens
    Figure 3. Traveling ionospheric disturbances (TIDs) detected at stations INJE (top left), DOND (top right), DAEJ (bottom left), and CHAN (bottom right). Click to enlarge.

    Ruling Out Quakes. One big challenge using GPS for ionospheric monitoring is determining the origin of an event. “Since earthquakes also disturb the ionosphere, distinguishing earthquakes from underground nuclear explosions are problematic even with GPS,” Park said. “Indeed, we only focused on examining and isolating TIDs from the nuclear explosions. We are now working to analyze the TIDs from earthquakes and compare them with nuclear TIDs.”

    Besides helping to distinguish between earthquakes and nuclear-test explosions, the software may eventually distinguish between nuclear plant fallout and nuclear test fallout.

    With this goal in mind, the team is analyzing the ionospheric data gathered from recent nuclear plant accidents such as the one in Japan following the earthquake and tsunami in March. “Since there were data gaps and other data issues, we have as yet nothing more to report. Hopefully, we find the earthquakes’ signature soon.”

  • Zoning in on Assets: Cubic Global Tracking Gets Iridium Certification

    By Tracy Cozzens

    A system that tracks and monitors valuable high-risk assets for defense and commercial customers has received certification from Iridium Communications, increasing the system’s accuracy and effectiveness. The Iridium constellation of low-Earth satellites provides voice and data services for areas not served by terrestrial communication networks.

    The Global Sentinel System, by Cubic Global Tracking Solutions, tracks and monitors assets with two-way, redundant encrypted communications. The system provides up to 2,000 unique geozones for each Global Sentinel device to control precise reporting rules along the supply chain. It can monitor asset conditions including temperature, humidity, light sensing, motion, and container door status.

    The latest generation of Cubic’s Global Sentinel System provides continuous global coverage by incorporating the Iridium 9602 short-burst-data transceiver. “As an Iridium partner for the past seven years, we’ve worked closely to integrate the Iridium 9602 transceiver into Cubic’s fifth generation of products,” said Mary Ann Wagner, president of CGTS.

    Wagner said Cubic relies on Iridium to provide real-time low latency reporting on customers’ assets in areas where other modes of communication are unavailable. This capability allows for continuous global coverage for reliable secure reporting of asset position, status, and event alerts. “This is essential because of the critical nature of the assets we are tracking and monitoring for our Department of Defense and commercial customers,” Wagner said.

    Power-Saving GPS. GPS also plays an important role. With the flexibility derived from geozone attributes for GPS, Cubic can provide an optimum balance between position accuracy and power management.

    Cubic’s devices take full advantage of GPS receiver circular error probable (CEP) estimates to set accuracy limits for reporting, explained Randy Shepard, vice president of technology innovations for CGTS. While higher position accuracy may be a challenge for battery-powered units operating for years between servicing, it is often necessary to avoid false alarming for events like route deviation where position accuracy is important.

    “One of the unique features of Cubic’s devices is the aggressive manner in which we manage power for all device functions including GPS,” Shepard said. “Using the geozones that are remotely reconfigurable on the device, GPS accuracy and response time can be controlled as a function of geozone.

    “As an example, for our current GS-5B receiver used for global tracking and monitoring of shipping containers, the initial default dwell time to capture GPS position is 60 seconds. Our experience is that from a cold start we get a normal lock in less than 45 seconds. The maximum acceptable CEP is 100 meters. If a CEP of less than 100 meters is not received, we do not update position. If a CEP of less than 100 meters is received, we wait up to an additional 60 seconds to improve the CEP. Once a CEP of 10 meters or less is received, the position is captured and the GPS receiver turned off. Again, all four of these parameters are remotely reconfigurable for each of the 2,000 user-defined geozones.”

    The other GPS receiver parameter that is configurable as a geozone attribute is whether power is maintained on the receiver to retain satellite ephemeris data. If the position update interval for a geozone is more often than every 15 minutes, data back-up power is usually maintained on the GPS receiver and the satellite ephemeris data is retained. This provides and effective warm start for the GPS and usually results in a much quicker initial position lock, which saves overall power.

    To provide real-time asset tracking worldwide, Cubic’s Global Sentinel System relies on a variety of transmission links to communicate the positioning and status of an asset. Based on the location of the asset, the system selects whichever link is the most cost-effective for data transmission. This includes wireless mesh networking, cellular, or the ubiquitous global two-way coverage of the 66-satellite Iridium constellation. The Global Sentinel System relies on the Iridium network’s ability to eliminate blind spots when the asset is out of range of other routing methods.

  • On the Edge: Tracking Slips and Creeps: Earthquake Monitoring Gets Substantial Boost from GPS

    By Tracy Cozzens

    The Earth’s surface is constantly shifting, being deformed as earthquake faults accumulate strain, and slip or slowly creep over time. Not long ago, scientists relied solely on seismometers to monitor the earth’s movements. Today, GPS has taken prominence as an indispensible tool.

    PANGA, the monitoring network covering the Pacific Northwest, uses GPS to monitor this movement by measuring the precise position (within 5 millimeters or less) of stations near active faults relative to each other. By determining how the stations have moved, ground deformation can be determined.

    If the plates near the coast or the Cascade Mountains move even a few centimeters, the scientists at PANGA know within seconds. The network is still being built, but eventually it’s expected that PANGA will be able to sense earthquakes faster and more accurately than traditional seismometers, and issue alerts to warn citizens of impending activity.

    “GPS is helpful in distinguishing magnitude 8 from M9 earthquakes quickly,” explained Rex Flake, PANGA. “By design, seismometers only record high-frequency energy that becomes saturated during strong ground motion. Moreover, seismic data ‘clip’ at high magnitudes whereas GPS become more accurate. Seismographs are mainly intended to detect very small to moderately large earthquakes. GPS gives actual ground motions that in theory could be incorporated very quickly into tsunami models and warning systems. That is one of the things we are working on now.”

    Volcano Watch. “A more speculative application is that some (not all by any measure) large earthquakes are preceded by slow creep events,” said Andrew Miner, PANGA. “While not really good enough to predict an earthquake, I think if we saw a very large transient creep event it would at least ring alarm bells. Unfortunately though, earthquakes are by their nature just not very predictable, at least to the level of a day or week that people could reasonably act on. On the bright side, volcanoes are reasonably predictable, and GPS is also an important tool in monitoring them. We work with the Cascade Volcano Observatory on several monitoring projects.”

    PANGA is one of a series of earthquake monitoring networks stretching along the West Coast. The Pacific Northwest Geodetic Array is run by the PANGA Geodesy Laboratory at Central Washington University (CWU) in Ellensburg, and  includes 300 continuously operating, high-precision GPS receivers located throughout the Pacific Northwest. Sixty more stations are expected to be installed this year. Trimble, Leica, Topcon, and Javad are the main receivers used in the region.

    Data from these receivers is continuously downloaded, analyzed, archived, and disseminated. About one third of PANGA’s GPS stations are telemetered in real-time back to CWU, where the data are processed using NASA’s Jet Propulsion Laboratory’s GIPSY/OASIS II software for high-precision data analysis, and Trimble’s RTKNet Integrity Manager software for real-time analysis. The data provide relative positioning of several millimeters across the Cascadia subduction zone and its metropolitan regions. These real-time data are used to monitor and mitigate natural hazards arising from earthquakes, volcanic eruptions, landslides, and coastal sea-level hazards.

    Sagging Bridges. The data are also used to monitor man-made structures such as Seattle’s sagging Alaska Way Viaduct, the State Route 520 and Interstate 90 floating bridges, and dams throughout the Cascadia subduction zone, including those along the Columbia River. For instance, for the S.R. 520 bridge, PANGA teamed up with Washington State Department of Transportation (WSDOT) to monitor movement of the 520 bridges during wind storms and seismic events.

    The receivers continuously monitor and record structural deformation with about a millimeter precision. Raw GNSS satellite phase and pseudorange estimates are acquired and processed continuously into receiver positions estimated every 5 seconds and delivered with 10 and 30-second latencies. Daily-averaged receiver positions computed with predicted and post-processed satellite orbit and clock corrections are provided with 1-6 day latencies.

    GPS_Monument-W
    Seattle’s aging Alaska Way viaduct is one of several major man-made structures being monitored by PANGA’s GPS Network. (photos courtesty of CWU Geodesy Lab.)

    Tremor Slips. The Northwest is at the forefront of earthquake-related GPS research, in large part because the area provides a lot to learn from GPS monitoring, Flake said. “For example, when we started it was strongly suspected but not definitely known that the Cascadia subduction zone was locked over parts of its surface and a major earthquake threat. Thanks to GPS monitoring we now have a pretty good idea not only exactly where it is locked, but also when parts of it do slip or creep.

    “One important discovery made with GPS data, along this line, was that of the Episodic Tremor Slip (ETS) events that occur here in the Northwest U.S.,” Flake said. “Since the time duration of ETS motion takes place on the scale of days to weeks, these earthquake events were unrealized by traditional seismic detection methods.”

    GPS data shed light on this peculiarly predictable earthquake phenomenon. “With these GPS data we can measure strain accumulation within the continental crust (where people live) and calculate the residual that can be expected to rebound in a large subduction zone earthquake,” Flake said.

    “Even more detailed than that, we can use GPS data from past ETS events to constrain the locked zone of the subducting crustal plate by inferring the amount of slip at depth that best reproduces the observed GPS recordings — important in determining possible magnitude and location of the megathrust earthquakes (Mw = 8 to 9) that will someday occur. This is of obvious concern to society and is a major reason that we lead the geodetic applications of GPS research.”

    Data Online. PANGA maintains a website that integrates daily GPS measurements from about 1,500 stations along the Pacific/North American plate boundary, ranging from Alaska to the U.S-Mexico border. Cleaned, network solutions from several arrays are merged and grouped into regional clusters.

    Arrow on a Velocity Field Map of Oregon and Washington represent ground motion as measured by GPS at each particular location. The grey circles are 2 sigma error ellipses (click to enlarge.)
    Arrow on a Velocity Field Map of Oregon and Washington represent ground motion as measured by GPS at each particular location. The grey circles are 2 sigma error ellipses (click to enlarge.) (photos courtesty of CWU Geodesy Lab.)
     The panga team constructs a bedrock drill-brace geodetic monument at Howard Hanson Dam east of Auburn, Washington.
    The PANGA team constructs a bedrock drill-brace geodetic monument at Howard Hanson Dam east of Auburn, Washington. (photos courtesty of CWU Geodesy Lab.)
  • On the Edge: Driving Reality Home

    By Tracy Cozzens

    A new navigation system looks to make driving safer by removing the need for drivers to look away from the road at their navigation device. With Wikitude Drive, as a driver moves down the road, the route is “drawn” onto the live video screen of an Android smartphone.

    How is this possible? Augmented reality.

    Augmented reality (AR) is a term for a live direct or indirect view of a physical real-world environment whose elements are augmented by virtual computer-generated imagery. The idea to blend augmented reality with navigation struck Philipp Breuss-Schneeweis, founder of Mobilizy, in 2008 when he was developing the Wikitude World Browser for the first Android Developer Challenge. Considering the awards Wikiude Drive has received so far, including being named Global Champion in the 2010 Navteq Challenge, it could be considered the next big advance in consumer navigation.

    Wikitude Drive, which launched at the end of 2010, works by attaching a mobile phone on top of a dashboard looking at the road. The application then overlays video captured through the camera with driving instructions. This allows users to drive through their phone, watching the road even while they are looking at directions.

    “With Wikitude Drive I don’t find myself looking for directions; the device itself guides me along the way,” said Nicola Radacher, product manager at Mobilizy.

    According to Breuss-Schneeweis, Wikitude Drive distinguishes itself from other navigation systems in two ways: First, due to the overlaying of the route onto the live video stream of the surroundings, the driver can easily recognize and follow the suggested route. Instead of looking at an abstract map, the driver is looking at the real world. The navigation system leads the driver through unfamiliar territory in a natural, real, and easy way.

    Second, Wikitude Drive solves a key problem that all other navigation systems have. These systems require the driver to take his eyes off the road to look at the abstract navigation map. Just by looking at the map screen for one second when driving at 100 km/h (62 mph), the driver is actually “blind” for 28 meters (92 feet).

    “Think about how much can happen in those precious meters. Since Wikitude Drive provides you with driving directions on top of the live video stream, you still see what is happening in front of you when looking at the display of your mobile AR navigation system,” Breuss-Schneeweis said.

    The AR system uses data from a smartphone’s GPS, compass, and movement sensors, retrieves information from its database, then displays the information over the camera feed. The company says millions of points of interest will also be displayed when a future version is integrated with Wikitude World Browser, the company’s AR browser for smartphone users.

    Wikitude Drive still can be used the traditional way. In some driving conditions — for example when driving in the dark — a drawn map is advantageous, and a driver can switch to the 3D map view by tapping the screen. Voice commands are also provided.

  • LizardTech Publishes GeoExpress Best Practices Guide

    LizardTech announced the release of the GeoExpress Best Practices Guide at the Autodesk University Conference 2009 in Las Vegas, where the company is exhibiting in booth #345 this week.

    The GeoExpress Best Practices Guide is a printable key designed to help navigate the many workflows available using LizardTech GeoExpress software, and provide users with the best settings and options to use for optimal image quality and performance. Many of the decisions that are made and the options that are selected in compressing, manipulating and publishing imagery have impacts for downstream users.

    “LizardTech’s goal is to provide our users with information to understand and use best practices so that they and their end users can get the most out of their imagery,” said Jon Skiffington, director of marketing.

    The complete GeoExpress Best Practices Guide is available as a free download here: http://www.lizardtech.com/products/geo/datasheets.php. Hard copies will also be distributed at the Autodesk University conference in LizardTech’s booth #345.

  • LizardTech MrSID Generation 4 Files Now Supported in Global Mapper

    LizardTech announced the integration of its MrSID Generation 4 (MG4) SDK into Global Mapper version 11.01. Until recently, Global Mapper’s customers were not able to load point cloud datasets that were compressed to MrSID Generation 4 using LiDAR Compressor into Global Mapper. However, with the addition of support for MG4 in Global Mapper version 11.01 users can load point cloud datasets compressed to MrSID Generation 4 for use in volumetric analysis, contour generation, and visualization.

    “Adding MG4 integration to the latest version of Global Mapper is just another step to ensure that our customers have as many mapping tools possible at their fingertips,” said Mike Childs, Global Mapper Software LLC. “Based on user feedback, we believe this integration with LizardTech will bring added value to our customers.”

    “LizardTech’s goal is to give customers tools for using their point cloud data compressed with LiDAR Compressor in the applications they use every day,” said Jon Skiffington, LizardTech’s director of marketing. “Many of our customers use Global Mapper, but were not able to use it with MrSID files created in LiDAR Compressor. Now our customers can easily load point cloud datasets compressed to MrSID Generation 4
    into Global Mapper.”

  • ESRI Con: LizardTech Unveils MrSID Compression for Raw LiDAR Data

    LizardTech’s LiDAR Compressor can convert cloud data into MrSID files that retain 100 percent of the original raw data at just 25 percent of the file size, according to the company.

    Derivatives can be extracted repeatedly from LiDAR files compressed to MrSID, LizardTech said. It can also reportedly reduce LiDAR file sizes by up 90 percent with no perceptible loss. The company introduced the LiDAR Compressor at the 2009 ESRI International User Conference in San Diego this week.

    LizardTech also unveiled an improved version of the MrSID format called MrSID Generation 4 (MG4). MG4 MrSID files support the compression of LiDAR data, which will allow users to view and access their LiDAR data faster, LizardTech said.

    LizardTech LiDAR Compressor is available for purchase now directly from LizardTech’s website or by contacting one of LizardTech’s sales representatives.

  • LizardTech Hosting Application Video Series

    Celartem Inc.’s LizardTech has launched a series of videos that focus on different LizardTech applications and will appear regularly on its corporate Web site.

    The series begins with a video showing Express Server in action with applications such as AutoCAD Map 3D and other programs to access imagery via WMS, according to the company. Additional videos will reportedly be posted in the weeks to come.

    “We’ve had many customers ask us which applications can integrate with Express Server, and now, by watching a video, they can see many of the different ways imagery can be efficiently served,” said Jon Skiffington, LizardTech senior product manager.” In this video, in addition to seeing our other integrations, we showcase our compatibly with AutoCAD Map 3D, which is exciting since the Autodesk University 2008 conference is taking place this week in Las Vegas. This way users can get a sneak peak of the applications working together on our website then come visit us in booth 417 for more information.”

    The LizardTech videos can be viewed here.

  • More Data Formats, LizardTech Support Among EarthWhere 4.3 Updates

    SPADAC has launched version 4.3 of EarthWhere, its spatial data management product that provides streamlined, enterprise-wide access to geospatial data, according to the company.

    Since SPADAC’s acquisition of EarthWhere in 2007 from SANZ, a former provider of data storage and data management solutions, SPADAC’s product development group has worked to enhance the product and provide technical support to its EarthWhere customers, reportedly resulting in a 79 percent growth in customer product implementations.

    “We work closely with customers to identify product enhancements and new functions that will improve their organization’s ability to more quickly and effectively ingest, catalog, explore, and provision data,” said Peter Borissow, SPADAC product manager for EarthWhere. “The added benefits now available to customers through EarthWhere 4.3 are a great example of this, and we’re already planning to make several more optional modules available over the next six months.”

    Updates in EarthWhere 4.3 include:

    • additional data formats, including Landsat TM/ETM+ in NLAPS format, FORMOSAT-2, and WorldView-1. Version 4.3 also adds more than 200 HARN projections to support customers using aerial-based imagery, according to the company.
    • ActiveIngest, a task-based ingestion engine, received a Java-based graphical user interface that provides enhanced reporting statistics, cross-platform support, and progress status.
    • an administrative option that facilitates the movement and relocation of source data files and a new tool that helps users find and delete duplicate data source entries.
    • a new one-click installer for free installations and upgrades through two packages that wrap all third party dependencies and the core base install.
    • an optional LizardTech module that provides the capability to output data products in MrSID (MG2/MG3) or JPEG 2000 format for an additional cost. The EarthWhere base product currently supports only reading and cataloging of MrSID (MG2/MG3) or JPEG 2000 format.