The American Society for Photogrammetry and Remote Sensing (ASPRS): The Imaging and Geospatial Information Society has withdrawn its ASPRS 2020 Annual Conference Virtual Technical Program from the Geo Week 2020 face-to-face event and will be going virtual because of COVID-19.
Geo Week 2020 is currently scheduled to take place July 27-29 at the McCormick Center in Chicago.
According to ASPRS, all presenters originally accepted for the March event in Washington, D.C., will have the opportunity to share their work in the ASPRS 2020 Annual Conference Virtual Technical Program, a series of online technical sessions taking place June 22-26.
Because the ASPRS 2020 Annual Conference Virtual Technical Program is being hosted, organized and managed by ASPRS alone, there will be a new, separate registration process and fee for all presenters and attendees. Existing Geo Week 2020 conference registrations are not transferable to this new ASPRS event, ASPRS said. Registrants may contact [email protected] if they wish to request a refund for all or part of their Geo Week 2020 registration or transfer their 2020 registration to Geo Week 2021.
Those who register for the ASPRS 2020 Annual Conference Virtual Technical Program will be given access to all of the online technical sessions, as well as live webinars and on-demand recordings, ASPRS said. The full program will e published on the conference website on June 8.
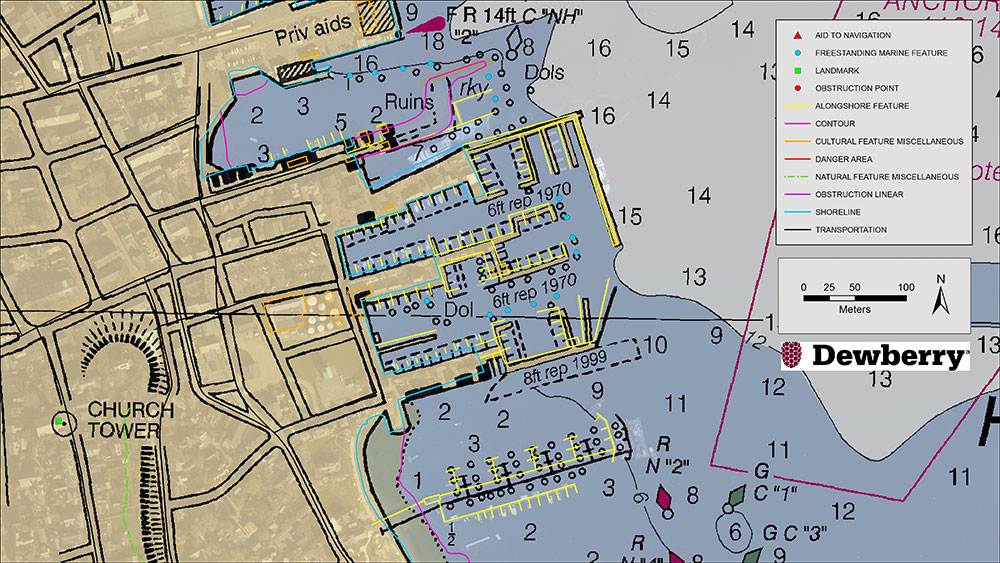
Existing NOAA nautical chart of Nantucket Harbor, Mass., overlaid with revised shoreline features collected by Dewberry. Image courtesy of Dewberry. (Image: Dewberry/NOAA)
Dewberry has been selected by the National Oceanic and Atmospheric Administration (NOAA) for the agency’s Shoreline Mapping Services contract. The five-year, indefinite delivery/indefinite quantity (IDIQ) contract has a ceiling of $40 million and will enable Dewberry and its partners to work with NOAA’s National Geodetic Survey to develop new technologies and initiatives to protect the nation’s coasts.
This is Dewberry’s second consecutive shoreline mapping services contract for NOAA. Over the past five years, the firm completed 30 task orders across the nation, including research studies to analyze bathymetric point tracing, derive bathymetry from satellite data, and apply INSAR data to analyze subsidence.
Task orders also included shoreline mapping in Alaska; creating topobathymetric lidar and shoreline products from NOAA-acquired data in Connecticut, Puerto Rico, the Chesapeake Bay, Florida and Maryland; acquiring and processing topobathymetric lidar data in Puerto Rico, the U.S. Virgin Islands, Texas and Massachusetts; and developing topobathymetric elevation and shoreline mapping datasets along the Atlantic seaboard from Myrtle Beach, South Carolina, to Long Island, New York.
“We are excited to continue to support and partner with NOAA to update the national shoreline, nautical charts, and provide high-resolution topography and bathymetric data to enhance the National Coastal Mapping Program,” said Amar Nayegandhi, CP, CMS, GISP, Dewberry’s senior vice president and senior project manager for the contract. “We always strive to find the most appropriate technology and solutions for NOAA and its numerous stakeholders. The task orders we received under the previous contract are a testament to the breadth of geospatial, scientific, and technology services we offer to NOAA.”
Dewberry also conducted special initiatives such as supporting the GRAV-D program to assist in developing the new gravimetric geoid model for 2022 and the 3D Nation Requirements and Benefits Study in collaboration with NOAA and the U.S. Geological Survey (USGS).
The 3D Nation Study documents topographic, coastal, and bathymetric 3D elevation data requirements and benefits across a multitude of geographies, helping to establish a baseline understanding of national business uses, needs and associated benefits for 3D elevation data.
Pointfuse and Leica Geosystems, a Hexagon company, have established a global cooperation and entered into a development agreement. According to the companies, the agreement aims to streamline the use of reality capture in established digital construction, space management and visualization workflows.
This strategic cooperation demonstrates the shared focus of Pointfuse and Leica Geosystems to democratize technology and create intuitive and accessible reality capture tools that bring advanced project efficiencies to their users, the companies added.
To launch the new cooperation, Pointfuse developed a new version of its Pointfuse software, powered by Jetstream, that provides Leica Geosystems users with a Scan-2-BIM workflow within the Leica Jetstream ecosystem. Pointfuse is configured with tailored profiles specifically for Leica Geosystems 3D laser scanners, including the Leica Geosystems LGS file format. The adoption of the LGS file format enables Pointfuse to extract data contained within the LGS file to assist in the classification of building information and substantially automate the workflow process. This centralized solution ensures a simple Scan-2-BIM workflow for space and facilities management as a companion solution to the new Leica BLK2GO handheld imaging laser scanner, the companies said.
“With functionality and developments implemented specifically for Leica Geosystems users, Pointfuse, powered by Jetstream, harnesses the unique benefits of the Jetstream ecosystem with the power of Pointfuse to deliver a seamless capture-consume-collaborate workflow,” said Steve Salmon, general manager at Pointfuse. “This integrated solution overcomes many of the barriers associated with laser scanning and photogrammetry, through providing an optimised storage solution, instant data loading and production of intelligent outputs. This platform enables Leica Geosystems users to exploit the intelligence captured in the point cloud, easily share outputs, and produce deliverables that drive the advancement of workflows in the digital age.”
The all-in-one reality capture capabilities of NavVis VLX include both survey-grade point clouds and high-resolution panoramas. (Photo: NavVis)
NavVis has launched NavVis VLX, a wearable mapping system that captures high-quality data in built environments such as construction sites, staircases and small technical rooms.
The all-in-one reality capture capabilities of NavVis VLX include both survey-grade point clouds and high-resolution panoramas. The combination of high-quality data capture and a compact, economical design will transform the way architecture, engineering and construction (AEC) projects are captured with fast, efficient scanning for BIM and CAD applications, while also extending the scope of projects to new deliverables such as web-based digital twins, the company said.
NavVis VLX is equipped with two lidar sensors and captures survey-grade point clouds using the company’s SLAM technology, which was originally developed for the the NavVis M6 indoor mobile mapping system. NavVis VLX also captures high-resolution panorama images in a complete 360-degree field of view.
According to the company, this wearable device gives the operator more control over where the sensors are scanning. It also allows the user to view and interact with the built-in screen that provides live feedback of what has been scanned and the quality of the data being captured.
“We designed NavVis VLX to provide the AEC industry with a compact, versatile device that efficiently captures buildings and still delivers survey-grade point clouds,” said Georg Schroth, NavVis CTO. “Knowing that there is still an unmet need for high-quality mobile data capture in a wider range of building documentation applications, we set out to develop a more versatile device that can achieve what NavVis M6 does at a smaller scale and on a lower budget.”
According to NavVis, the data captured by the VLX can be applied to a wide range of applications, including conventional building documentation such as CAD drawings and BIM models, as well as to innovative digital twin solutions, such as NavVis IndoorViewer.
NavVis, headquartered in Munich, Germany, is a global provider of indoor spatial intelligence technology and solutions for enterprises. The company also has offices in New York and Shanghai.
SPH Engineering has launched a new product to make bathymetric surveys of inland and coastal water.
The system — an unmanned aerial vehicle (UAV) integrated with an echo sounder — is time- and cost-efficient. It is suitable for mapping, measuring and inspecting tasks as well as environmental monitoring.
The system allows field workers to collect data with high accuracy quickly. It is easily transported, quickly deployed and twice as cost-efficient as traditional methods.
The UAV/echo sounder system can be operated in hard to reach locations, and unsafe or hazardous environments. Locations not reachable by foot or that are dangerous for a human (steep coasts, mining pits, contaminated waters, terrain obstacles, etc.) as well as waters of ponds, lakes, and canals can be reached by the drone.
“Since autumn 2018 we have been getting bathymetry-related requests,” said Lexey Dobrovolskiy, CTO of SPH Engineering. “Analyzing about 150 inquiries, we have come to the conclusion that a drone-based solution could open a new business opportunity for drone service companies to do bathymetry surveys of coastal and inland water, especially those for industrial needs.
“Compared with a standard approach using a boat or an unmanned surface vehicle, a drone could save a lot for its user,” Dobrovolskiy said. “An echo sounder itself could be integrated into a client’s drone with no need to purchase additional equipment. Moreover, it is small and easy to transport and operate. At the same time, such research method guarantees data accuracy and employee safety.”
A roundup of recent products in the GNSS and inertial positioning industry from the May 2020 issue of GPS World magazine.
SURVEYING & MAPPING
RTK thermal mapper
Asphalt paving with RTK positioning
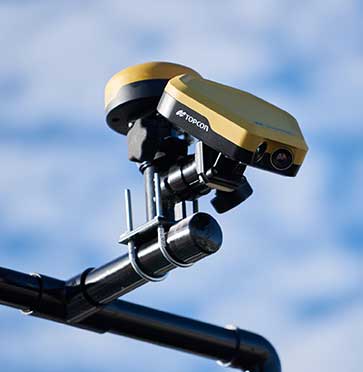
Photo: Topcon
The Thermal Mapper is designed to monitor temperature segregation to prevent future problems and measure performance, as well as provide accurate compliance reporting, using real-time kinematic (RTK) positioning accuracy. It records temperature readings behind an asphalt paver during paving and provides a visualization to operators in real time of whether the mix falls within a predefined temperature range. If the readings are unacceptable, operators can make adjustments. The system also creates data reporting files to download for applications such as U.S. Department of Energy compliance through the interactive Pavelink module, the Topcon cloud-based logistics application for asphalt paving.
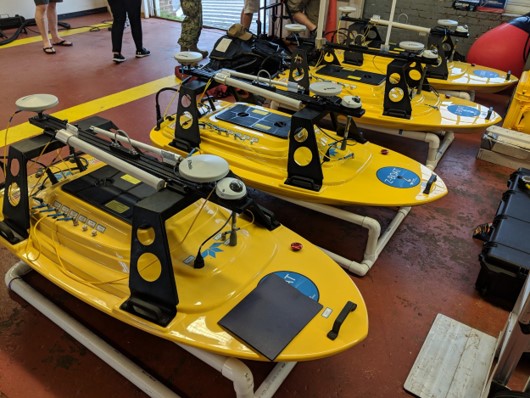
The Z-Boat 1800-T unmanned survey vessel is equipped with Trimble’s high-precision GNSS heading receiver and compatible with Trimble Marine Construction (TMC) software. The Z-Boat 1800-T enables marine construction and dredging projects to run efficiently and be monitored in real time anywhere in the world. The Z-Boat 1800-T is a high-resolution shallow-water hydrographic unmanned survey vehicle with the newly released Odom Hydrographic Echotrac E20 Singlebeam Echosounder and dual-antenna Trimble BX992 GNSS heading receiver. Each sensor is integrated into a compact, portable package for marine construction and allows data collection under harsh conditions. Both sensors can be removed and mounted on other watercraft and barges.
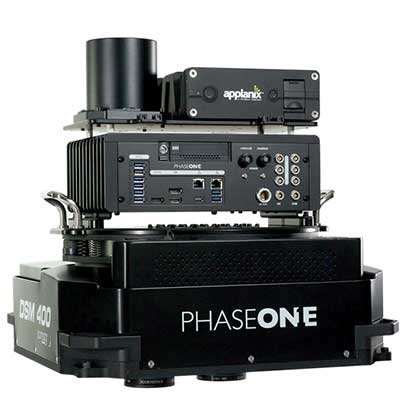
The 280MP Aerial Solution has an image coverage width of more than 20,000 pixels. The large format enables high-quality aerial surveys. Compact and lightweight, the aerial mapping solution consists of an iXM-RS 280F large-format camera, Applanix GNSS/inertial measurement unit (IMU) POS-AV receiver, DSM 400 Somag gyro-stabilized mount, Phase One iX Controller and iX Flight Management software. It is designed for use in a wide range of aircraft.
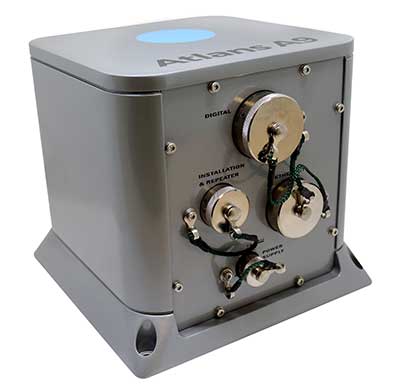
The Atlans Series of FOG-based inertial navigation systems (INS) is designed for land and air mobile-mapping applications. Based on iXBlue’s fiber-optic gyroscope (FOG) technology, the Atlans Series is a scalable range of north-seeking and north-keeping INS. They provide FOG performance to the full spectrum of land and air mobile-mapping applications and offer highly accurate positioning up to 0.01 meter in all conditions, including within GNSS-denied environments such as urban canyons, mountainous or forested areas.
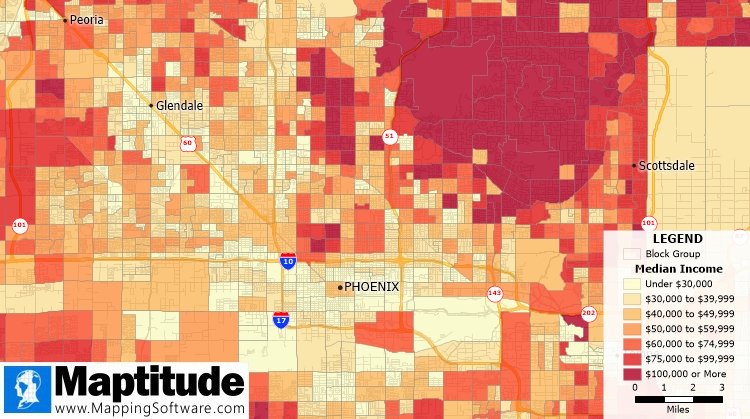
The Maptitude 2020 U.S. Census Blocks Groups data is now available for the United States. The small-area Census Summary Level is packed with neighborhood information for making accurate geography-based decisions. Users can explore locations by income, income growth, daytime population, age, race, gender, ethnicity, occupation, housing characteristics and more. The data can be leveraged by data scientists and market research analysts using the Maptitude application. The files are also available as shapefile, KML, KMZ or GeoJSON.
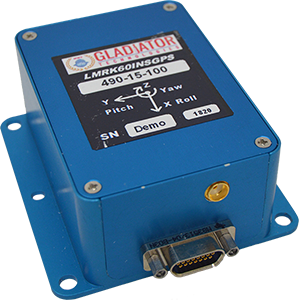
The high-performance LandMark 60 INS/GPS and compact LandMark 005 INS/GPS both feature advanced sensor-fusion technology, combining a 72-channel GNSS receiver with low-noise, high-output inertial sensors as well as barometric pressure and magnetometers. Both products use proprietary Velox processing technology and an extended Kalman filter (EKF), enabling precision position information during short-term GPS outages. The units provide accuracy of less than 2 nautical miles per hour during short-term GPS outages. The LandMark 60 provides +/– 0.3° heading accuracy and pitch/roll angle measurements of 0.1°. It is also available with an option for a real-time kinematic (RTK) GPS receiver. The LandMark 005 is less than 35 square centimeters, suitable for space-constrained applications that require a high standard of performance. Applications include flight control, navigation and stabilization for imaging, platforms and antennas. A development kit is available for set-up, configuration and data collection.
The IQCM-112 series of GNSS-disciplined oven-controlled crystal oscillators (OCXOs) incorporates an internal GNSS receiver with a 1-PPS output, which is compatible with an external GPS, GLONASS, BeiDou and Galileo source. It is housed in a 14-pin 60-millimeter-square package. When coupled to an external aerial antenna via the incorporated SMA connector, in the event of the loss of the GNSS signal the highly specified 10-MHz OCXO will switch in with a holdover capability of 1.5 µseconds for a 24-hour period, thereby maintaining lock until restoration of the reference signal. The standard operating temperature range of the module is –20° to 75° C, but it is also available with a –40° to 85° C operating temperature range. Other holdover specifications can be considered upon request.
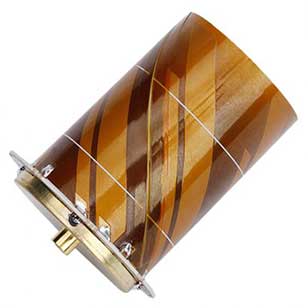
The HC977 covers GPS/QZSS-L1/L2/L5, GLONASS-G1/G3, Galileo-E1/E5a/E5b, BeiDou-B1/B2/B2a, IRNSS-L5 and L-Band correction services, as well as GLONASS-G2. Tallysman helical antennas are designed for high-accuracy applications where precision and light weight matter, such as unmanned aerial vehicles. The antennas are available in either a robust IP67 enclosure or an embedded format. The HC977 features a low current, low noise amplifier (LNA) that includes an integrated low-loss pre-filter to protect against harmonic interference from high amplitude interfering signals, such as 700-MHz band LTE and other near in-band cellular signals.
The RG500Q is a series of 5G sub-6-GHz modules optimized for internet of things (IoT) and machine-to-machine (M2M) applications. It supports the Qualcomm IZat location technology Gen9C Lite (GPS, GLONASS, BeiDou/Compass, Galileo and QZSS). The integrated GNSS receiver greatly simplifies product design and provides quick, accurate and dependable positioning capability. The RG500Q is provided in two variants: RG500Q-EA and RG500Q-NA. The RG500Q-EA 5G NR module has achieved commercial readiness and is now available to support global customers with mass deployment.
The V-150 is optimized for use from small naval vessels. It can be employed to support the homeland security, oil and gas and energy sectors. The UAV, which is free from International Traffic in Arms Regulations (ITAR) restrictions, incorporates two payload bays: up to 30 kilograms (kg) in the main bay and up to 12 kg in the nose. Within these, it provides a variety of payload options, including powerful electro optical and infrared (EO/IR) sensors, hyperspectral and multispectral cameras for airborne remote sensing, lidar and a variety of small tactical synthetic aperture radars (SAR) for delivering real-time intelligence in all weather conditions.
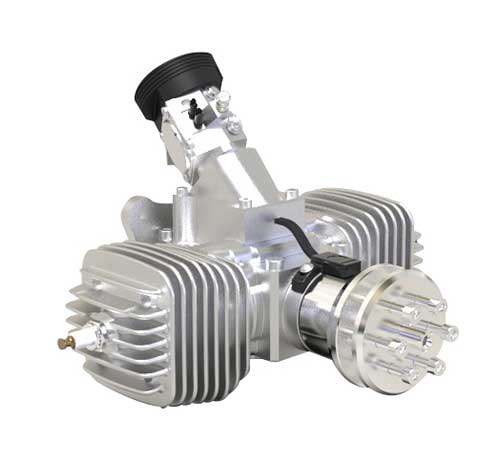
The SP-56 series is a family of small two-cylinder engines for UAVs. It can be integrated into small helicopters, which require smoother engine operation than single cylinders can provide. The SP-56 series provides 3.35 KW at 7,000 rpm; total weight of the carbureted version is 2.6 kilograms. The engine can be equipped with a generator or a starter generator on the rear output shaft. Hybrid applications are possible in which the engines are used only to generate electricity.
Two new small unmanned aerial systems (sUAS) are available to U.S. government defense and security markets. Vector and Scorpion form a 2-in-1 rucksack-portable system with an open source operating system, Auterion OS. The Scorpion tricopter can be used for dynamic urban environments and missions that require maneuverability and hover to collect intelligence, surveillance and reconnaissance (ISR) data. A tethering system enables 24/7 operations. By configuring the base fuselage with fixed wings and tail section, Scorpion transforms into Vector, a fixed-wing vertical takeoff and landing (VTOL) UAV for long-range, long-endurance ISR missions.
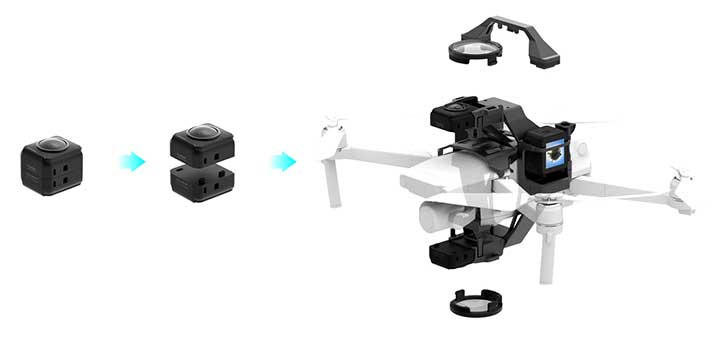
Insta360 ONE R is an interchangeable-lens action camera designed with three swappable Lens Mods for capturing different kinds of content. It has a Dual-Lens 360 Mod and a 1-Inch Wide Angle Mod co-engineered with Leica Camera AG. Advanced stabilization with Insta360’s FlowState algorithm achieves gimbal-like stabilization when shooting 360 degrees or with a standard wide angle lens. The 5.3K wide-angle lens can be swapped for a dual-lens setup that captures action in all directions at once. It captures brilliant 5.3K video and 19-megapixel photos even in complex lighting conditions. The ONE R is waterproof to 5 meters.
One industry important to the world’s fight and recovery from the COVID-19 pandemic is geospatial analytics. In response, the World Geospatial Industry Council (WGIC) has created an information hub for COVID-19 information.
“These are very uniquely challenging times for our industry. At the same time, our industry has stood up to assist the world, especially the key decision-makers and frontline workers to understand the scenarios on the ground,” said Harsha Vardhan, WGIC associate director. “Spatial analytics-based decision making has come to the forefront during these times.”
Governments are using location tracking in combination with personal data to track and combat COVID-19, and the use of location technology in conjunction with personal data is of high relevance and usage, Vardhan said. “This scenario brings before us the aspects of data privacy, data protection, and the role of geospatial information.”
In March, WGIC published a report titled “Geospatial Information and Privacy: Policy Perspectives and Imperatives for the Geospatial Industry.” Vardhan said the report is even more significant now. WGIC is hosting a webinar on the report on May 14 at 11 a.m. ET.
New hyperlocal business directory ZoomBusiness designed to help Main Street businesses across North America engage with local residents
GIS Planning has launched an online tool that enables local businesses across North America to communicate with customers for free in real time.
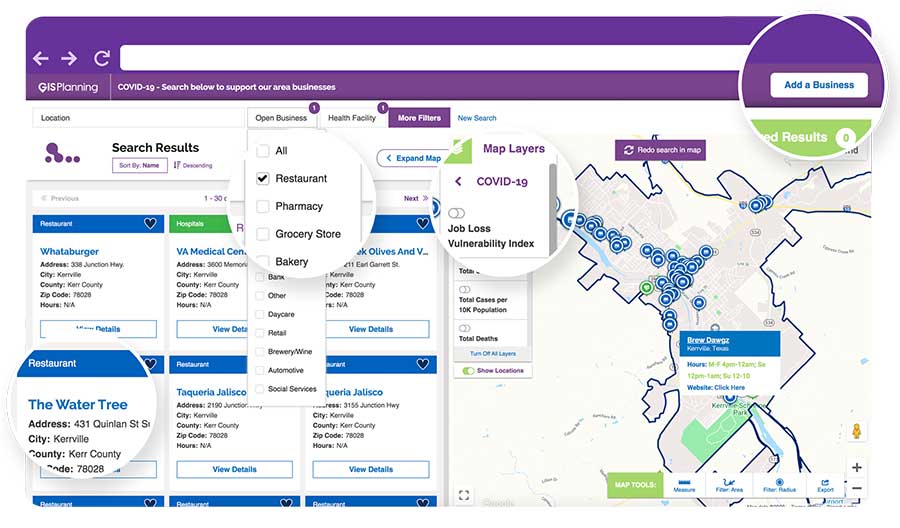
ZoomBusiness, created in response to the COVID-19 pandemic, is an interactive, mobile-responsive mapping directory for communities that ensures customers can find open restaurants, stores and services in their region at no charge.
Businesses can list themselves for free on their local ZoomBusiness site, hosted by economic development organizations like cities, towns, counties or chambers of commerce. The businesses can provide customized details including websites, modified hours, delivery or curbside pickup options, promotions and gift card stimulus programs.
Residents can search for area businesses by categories, including grocery stores, pharmacies, banks, health facilities, hardware stores, pet stores and automotive shops, among others.
North America deployment
Local ZoomBusiness sites have already been deployed in more than 20 communities across North America during its soft launch, including regions of eastern Pennsylvania;, the City of Columbia, South Carolina; the state of Wyoming (which has listed more than 600 businesses on the directory); and Abbotsford, British Columbia.
“We created ZoomBusiness after realizing that small businesses need new, accurate ways to communicate that they are still open to their customers, given that social distancing requirements, product availability and operating hours are changing by the day,” said Pablo Monzon, managing director and co-founder, GIS Planning. “Our development team has created an intuitive tool to index and map business information across North America in real-time, and we believe it will be an enormous resource for the communities we serve.”
ZoomBusiness is a simple-to-use data tool, powered by Google Maps, using various layers for precise queries. Businesses are prompted to directly enter information on their current status and the content is verified by the organization hosting the GIS tool.
GIS Planning also added free map layers, including a COVID-19 case map updated daily by the New York Times, and a job-loss vulnerability index using recent employment data from Chmura.
Screenshot: GIS Planning
Columbia, South Carolina
The city of Columbia features 180 businesses on ZoomBusiness, helping residents discover delivery and curbside food options. That number is expected to quickly rise to more than 300 as business owners input data. Columbia will continue to promote safe and responsible “Shop Local” practices, Coleman added, in hopes that residents will take advantage of the service and support local businesses.
“Through our work with GIS Planning, we’ve been able to take our list of open restaurants and businesses and integrate it into the available properties map on our website,” said Ryan Coleman, director of the City of Columbia Office of Economic Development. “During this crisis, local businesses need every advantage we can give them, and this is another tool in their arsenal in helping to mitigate the negative impact of COVID-19.”
Abbotsford, British Columbia
The new solution has also made an impact in Canada, including the City of Abbotsford, British Columbia, which is promoting 130 businesses ranging from grocers to auto shops and medical suppliers.
“This is a resource that fills an urgent need. The long-term health and security of our businesses depend, in part, on the decisions we’re making right now,” said Kim O’Sullivan, City of Abbotsford’s economic development coordinator. “ZoomBusiness allows owners to communicate directly with their customers, many of whom would frequent these businesses, even online, if they knew they were able to do so.”
ZoomBusiness clients are given a unique link to their region which is then shared across organizational websites and social media to reach residents.
“Main Street businesses are truly the lifeblood of a community,” said Alissa Sklar, vice president of marketing for GIS Planning. “According to FEMA, up to 40% of small businesses never reopen after a major disaster. With ZoomBusiness, we want to help make sure the local restaurants, retailers and service providers that define local communities are still there to serve area residents when this pandemic is over.”
GIS Planning has made its ZoomBusiness tool free for its existing economic development clients (those using its investment attraction map, ZoomProspector); it is also available to new clients for a nominal fee. Prices are indexed to population size to keep them affordable for all communities. New clients can also be set up and ready to launch the tool within one day.
Following the COVID-19 recovery, data experts at GIS Planning forecast continued use of the directory to promote small and medium-sized businesses across North America.
New hyperlocal business directory ZoomBusiness designed to help Main Street businesses across North America engage with local residents
GIS Planning has launched an online tool that enables local businesses across North America to communicate with customers for free in real time.
ZoomBusiness, created in response to the COVID-19 pandemic, is an interactive, mobile-responsive mapping directory for communities that ensures customers can find open restaurants, stores and services in their region at no charge.
Businesses can list themselves for free on their local ZoomBusiness site, hosted by economic development organizations like cities, towns, counties or chambers of commerce. The businesses can provide customized details including websites, modified hours, delivery or curbside pickup options, promotions and gift card stimulus programs.
Residents can search for area businesses by categories, including grocery stores, pharmacies, banks, health facilities, hardware stores, pet stores and automotive shops, among others.
North America deployment
Local ZoomBusiness sites have already been deployed in more than 20 communities across North America during its soft launch, including regions of eastern Pennsylvania;, the City of Columbia, South Carolina; the state of Wyoming (which has listed more than 600 businesses on the directory); and Abbotsford, British Columbia.
“We created ZoomBusiness after realizing that small businesses need new, accurate ways to communicate that they are still open to their customers, given that social distancing requirements, product availability and operating hours are changing by the day,” said Pablo Monzon, managing director and co-founder, GIS Planning. “Our development team has created an intuitive tool to index and map business information across North America in real-time, and we believe it will be an enormous resource for the communities we serve.”
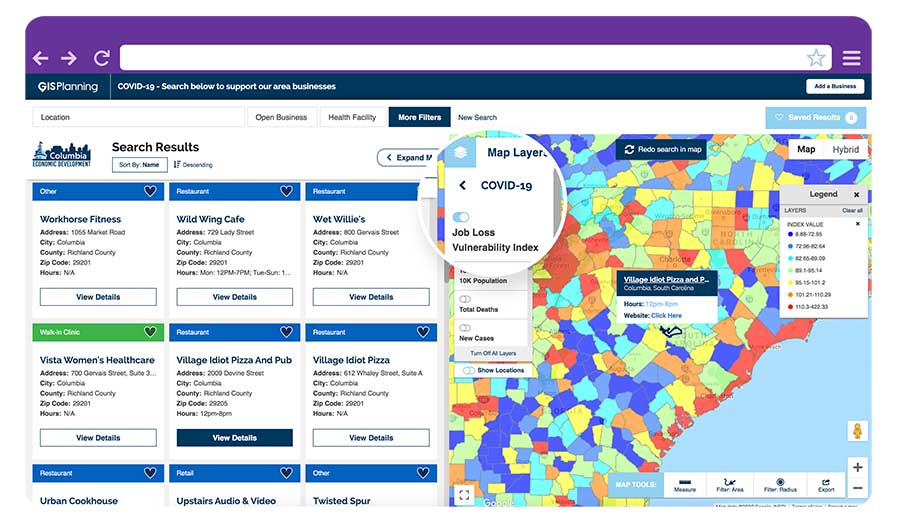
ZoomBusiness is a simple-to-use data tool, powered by Google Maps, using various layers for precise queries. Businesses are prompted to directly enter information on their current status and the content is verified by the organization hosting the GIS tool.
GIS Planning also added free map layers, including a COVID-19 case map updated daily by the New York Times, and a job-loss vulnerability index using recent employment data from Chmura.
Screenshot: GIS Planning
Columbia, South Carolina
The city of Columbia features 180 businesses on ZoomBusiness, helping residents discover delivery and curbside food options. That number is expected to quickly rise to more than 300 as business owners input data. Columbia will continue to promote safe and responsible “Shop Local” practices, Coleman added, in hopes that residents will take advantage of the service and support local businesses.
“Through our work with GIS Planning, we’ve been able to take our list of open restaurants and businesses and integrate it into the available properties map on our website,” said Ryan Coleman, director of the City of Columbia Office of Economic Development. “During this crisis, local businesses need every advantage we can give them, and this is another tool in their arsenal in helping to mitigate the negative impact of COVID-19.”
Abbotsford, British Columbia
The new solution has also made an impact in Canada, including the City of Abbotsford, British Columbia, which is promoting 130 businesses ranging from grocers to auto shops and medical suppliers.
“This is a resource that fills an urgent need. The long-term health and security of our businesses depend, in part, on the decisions we’re making right now,” said Kim O’Sullivan, City of Abbotsford’s economic development coordinator. “ZoomBusiness allows owners to communicate directly with their customers, many of whom would frequent these businesses, even online, if they knew they were able to do so.”
ZoomBusiness clients are given a unique link to their region which is then shared across organizational websites and social media to reach residents.
“Main Street businesses are truly the lifeblood of a community,” said Alissa Sklar, vice president of marketing for GIS Planning. “According to FEMA, up to 40% of small businesses never reopen after a major disaster. With ZoomBusiness, we want to help make sure the local restaurants, retailers and service providers that define local communities are still there to serve area residents when this pandemic is over.”
GIS Planning has made its ZoomBusiness tool free for its existing economic development clients (those using its investment attraction map, ZoomProspector); it is also available to new clients for a nominal fee. Prices are indexed to population size to keep them affordable for all communities. New clients can also be set up and ready to launch the tool within one day.
Following the COVID-19 recovery, data experts at GIS Planning forecast continued use of the directory to promote small and medium-sized businesses across North America.
The Esri User Conference, which usually takes place in San Diego in July, will this year be held virtually.
“As a result of the coronavirus disease 2019 (COVID-19) crisis, we are making the decision to move the 2020 Esri User Conference in San Diego to a virtual format. This is a great disappointment to me personally, as I know it will be for many of you,” Esri CEO Jack Dangermond told those planning to attend in an April 22 e-mail.
The following is an outline of Esri’s current plan, with more information available in the Esri UC FAQs:
The event will take place July 13–15, 2020.
The plenary session, technical workshops and Esri Showcase will be virtual, featuring many demonstrations and live discussions during the conference.
There will be many opportunities for networking, collaboration and real-time interaction with Esri experts and staff.
User presentations and the map gallery will be featured digitally.
A library of recorded sessions and demos will be created and kept available as an ongoing resource.
Registration will be complimentary for all Esri customers who are current on their maintenance or subscription.
“Forty years ago this month, we had our first User Conference in Redlands, California, with only a handful of participants,” Dangermond wrote. “While initially no one was quite sure of what the outcome would be, the event started an ongoing tradition where Esri and our users would come together, share our work, learn and create a community of common interests.
“That first meeting on the Esri campus provided the groundwork for the annual event at which thousands of professionals from every corner of the globe meet one another, share inspiring examples of work and learn from each other’s experiences.
“While we can’t replicate the experience of being together in person, we will do our best to create an amazing event that will continue to move you and our community forward. One of the benefits of going with a virtual format will be that organizations will be able to send an unlimited number of attendees.”
The National States Geographic Information Council (NSGIC) has released a joint statement on the value of GIS during the COVID-19 pandemic, alongside its partners the MidAmerica GIS Consortium (MAGIC), Open Geospatial Consortium (OGC), Urban and Regional Information Systems Association (URISA), and American Association of Geographers (AAG).
Joint Statement on the Value of GIS in the Pandemic
The spread and effects of COVID-19 can be best understood considering space and time.
As governments are responding to COVID-19, more leaders are recognizing the value of “knowing the where.” The importance of knowing where the outbreak is growing, where high risk populations are, where the hospital beds and important medical resources are, and where to deploy resources is essential. “Knowing the where” informs better decision-making.
In an effort to better understand the where, governments are recognizing the value of geospatial information and technologies and are engaging geospatial professionals to help them better understand the where to help them in their decision-making and response.
Geospatial professionals bring unique analytical and visualization skills to the table that help responders and decision-makers visualize where the pandemic is spreading more quickly and can make the important decisions regarding where response and resource needs need to be focused. The value of telling the story through a map coupled with a geospatial dashboard provides a view of the event not readily seen in a table such as a spreadsheet.
Beyond visualizing existing data, we can connect data from a location perspective, which enhances the value of the data sources being integrated. Equally important in this event is data on COVID-19 cases and testing packaged and shared in a way useful to scientists.
GIS (geographic information systems) is experiencing an unprecedented level of use. Historically, GIS was deployed following a disaster to help respond and recover. Today, GIS is used as a disaster is unfolding. The COVID-19 event is an outstanding example of how effective GIS is when robust data is available. Governments are realizing the value of investing in these systems and the people who run them.
The information necessary to empower all partners already exists.
Current nationwide models and response efforts may not benefit from the details of local geographic parameters. Local or statewide models and response efforts may not fully take advantage of the data from other areas of the country. Hospitals are surveyed by both federal and state agencies, and the results of those surveys are not readily available to the hospitals working together to care for patients. Nationwide geospatial data will empower a coalition of participants with a better understanding of the spread and impacts of COVID-19 and improve mitigation actions.
The same data can be made available in different forms to empower people playing different roles in the response. Researchers — epidemiologists — will benefit from nationwide COVID-19 testing data and data describing factors impacting the spread. This data needs to be as disaggregated as permissible under HIPAA and in a form readily digestible in models.
The case data could be aggregated to the same units of geography as a wealth of existing demographic data (Census tracts), which could explain and quantify local variances in the spread. Policy makers and those in emergency management can benefit from map and tabular dashboards, harnessing the power of the where by integrating data for analytics.
The emergency response, public health and geospatial communities must come together to understand COVID-19 in the U.S. and mitigate its spread and overall impact.
By geo-enabling public health and emergency response data, we can better:
understand the spread — with COVID case data, movements of people, and symptoms
understand the impact on individuals — with data including age, disease, obesity, and medical treatments
understand how to tailor outreach — by age, language, engagement with government, and lifestyle choices
understand the needs of the healthcare industry — by facility, day, bed capacity, type of care, ventilators, and PPE
understand the impact on the local economy — by county, day, unemployment, and bankruptcies
understand the societal impacts — by census tract, domestic violence, alcohol consumption, child abuse, animal abuse, elder abuse, mental health crises, 3-1-1 calls and firearm sales
We are committed to beginning the national conversation about leveraging the best available data to better understand the spread and impacts of COVID-19.
SafeGraph has launched a Shelter in Place Dashboard that enables users to visualize stay-at-home behavior for every county in the United States.
Image: SafeGraph
SafeGraph has also created and released two new datasets:
Weekly foot-traffic patterns
Social Distancing Index
The data is being provided at no cost to non-commercial entities.
“We currently have over 550 researchers, non-profits and government agencies in a Slack group using these new datasets,” said Evan Barry, vice president of marketing, SafeGraph. Academic and industry research articles based on the data are now published on the SafeGraph site.