STMicroelectronics is bringing next-generation satellite navigation to today’s drivers with the launch of enhanced, always-available, always-accurate 3D positioning on its TESEO III automotive-navigation integrated circuits (ICs).
The new TESEO DRAW firmware for ST’s multi-constellation positioning chips enables navigation devices to provide continuous, accurate location and turn-by-turn instructions even when satellite signals are poor or unavailable, such as in tunnels, covered car parks, or multi-level highways. TESEO DRAW also enhances performance in built-up areas, such as in urban canyons, where conventional navigation systems can lose accuracy.
TESEO DRAW merges the satellite information with data from vehicle sensors such as the gyroscope, accelerometer and wheel-speed sensors, to calculate location accurately in three dimensions including elevation. If the satellite signal is poor, TESEO DRAW compensates for the loss of accuracy, and if the signal becomes unavailable, navigation continues uninterrupted based on calculated location (dead reckoning). Road tests carried out by ST in difficult under-cover and urban environments have demonstrated continuous tracking from entry to exit in complex multi-level car parks, and at street level between tall buildings, where conventional systems have been unable to track the vehicle.
By enabling high-accuracy 3D dead reckoning, TESEO DRAW expands the opportunities for developers to commercialize new applications, the company said.
“TESEO DRAW strengthens GNSS performance and eliminates barriers to continuity, enabling exciting new services to emerge,” said Fabio Marchiò, Microcontroller and Infotainment Division general manager, Automotive Product Group, STMicroelectronics. “Users can also experience significant improvements in existing services such as fleet tracking, eCall, or ERA-GLONASS emergency response, usage-based insurance, road tolling, and anti-theft systems.”
TESEO DRAW firmware has multiple modes and is capable of referring to sensors on the vehicle’s CAN bus or discrete sensors such as the odometer, reverse sensor, MEMS accelerometer and gyroscope, or MEMS inertial module connected to the TESEO III IC.
ST is a supplier of MEMS motion sensors for automotive navigation, telematics and vehicle alarm systems, and is a provider of navigation engines with its TESEO IC family. With the launch of TESEO DRAW firmware, ST is able to provide a unified platform comprising navigation engines, 3D positioning capability and motion sensors.
TESEO III ICs loaded with the new TESEO DRAW firmware are sampling now, and will enter mass production in Q1 2016.
XRS Corporation, a subsidiary of Omnitracs LLC and provider of mobile trucking intelligence solutions, has announced integrations with Innovative IES and Appian DirectRoute transportation management software, both from TMW.
The newly integrated solutions are in addition to existing XRS integrations with TruckMate and TMWSuite software, also from TMW, and deliver enhanced operational visibility to fleets using both XRS and TMW platforms.
The integrated XRS solutions with TMW offer tangible benefits to drivers and to back-office personnel. Fleet managers can access vehicle and driver-specific data sourced from the XRS mobile fleet management solution directly through their TMW applications.
The streamlined information delivery saves time and eliminates the need to flip from one screen to another to access data from different systems. Furthermore, the availability of driver hours of service data from the XRS electronic logging device application within the TMS itself can help fleets improve driver and tractor use, as well as ensure they are HOS-compliant.
Also, drivers can now view routing and other driver-specific information from TMW software on their mobile devices. This simplified information delivery can streamline back-office to driver communication, reduce the likelihood of error, and lead to improved driver satisfaction and enhanced customer service.
“We continue to expand our stable of integrations, so that we are able to work with all major TMS solutions in the market. Our driver-centric integration with TMW solutions delivers significant value to our shared customers. Working with our industry partners, we’re continuing to make accurate data, including critical dispatch and routing information, easily accessible and even easier to share,” said Jon Van Winkle, vice president of product management for XRS. “These integrations allow drivers to focus on driving, without being bogged down by the cumbersome — and error-prone — task of manually entering data, while ensuring dispatchers have real-time updates to keep customers happy.”
“We have a long-standing relationship with XRS and these new integrations round out the suite of combined solutions available to meet and exceed the expectations of our shared customers,” stated Brian Larwig, VP and general manager, Appian, for TMW Systems. “The integration of the XRS Trip Management application with our Appian routing and tracking solutions makes possible the automatic route import and real-time trip activity updates from XRS Mobile, to deliver added value to the fleets we serve.”
The XRS platform, which runs on certified smartphones, tablets and rugged handhelds, provides drivers with a familiar interface for day-to-day operations and compliance. There are no additional, up-front hardware costs when the certified mobile devices are already in use, allowing fleets to immediately adopt the technology.
WorkWave, a provider of cloud-based field service management and “last mile” fleet management software solutions, has unveiled WorkWave Fleet, its mobile-first flexible route planning solution.
WorkWave Fleet helps field service and transportation and logistics businesses save time and costs while increasing capacity by better managing their mobile workforce with unique mobile capabilities.
“WorkWave Fleet allows for automating the dispatching and monitoring process to help keep our service levels high, with less overhead. Real-time dispatching gives us the flexibility we need to manage a dynamic environment,” said Ryan Walter, Co-founder of The Compost Crew, a Maryland-based organization aimed at collecting organic materials from local communities to be composted and used to replenish soil.
Typical productivity improvements for businesses that adopt WorkWave Fleet include:
20% reduction in drive time
30% reduction in mileage
25% reduction in overall costs
22% increase in capacity
“WorkWave continues to help its clients by saving them time and costs, while increasing capacity and on-time performance with the rollout of WorkWave Fleet,” said Chris Sullens, president and CEO of WorkWave. “Our new cloud-based application is designed to be simple to use and deploy, making it ideal for small to medium sized fleets, yet powerful enough to be used by enterprise clients. It enables businesses to easily make competitive commitments to customers while boosting responsiveness to last minute requests thanks to advanced functionality that raises the bar for mobile workforce productivity and instantly delivers savings, ROI and allows our clients to delight their customers.”
In addition to WorkWave Fleet’s core flexible route-planning capabilities, the new solution also features:
What-if Scenarios: Drag-and-drop functionality visualizes how changes impact performance to enable rapid scheduling and smarter planning.
Mobile Execution: Automatically updates progress from drivers, logs arrival and departure times, and allows for rescheduling requests.
Intra-Day Planning: Reschedule in real-time to avoid problems, update customers with courtesy calls, integrate with your system to provide ETAs via text or dispatch another vehicle.
Dramatic improvements to user interface, schedule management and path to ROI.
Rapid Deploy: An intuitive design and user interface that allows customers to learn the application in hours and deploy almost instantly after purchasing with no expensive and time consuming professional services.
Robust API: Connect directly to your own ERP, WMS, CRM or Customer Database to receive real-time updates within your own system and automate import/export operations and changes seamlessly.
WorkWave plans additional enhancements to WorkWave Fleet in 2015, including full integration with WorkWave GPS, its cloud-based telematics solution that tracks vehicle location, monitors drive behavior, and provides instant events-based alerts from any device.
AT&T and Telogis, a SaaS-based connected vehicle technology provider, have announced a collaboration to offer solutions for companies with mobile workforces. Connecting vehicles of all sizes from small trucks to 18-wheelers and heavy equipment, the combination of AT&T’s global network and Telogis’ telematics, compliance, and mobile and navigation software creates full-fleet solutions for businesses around the world.
The announcement was made at CTIA Super Mobility, being held this week in Las Vegas.
Telogis works with some of the world’s largest mobile companies to provide the critical data they need for more informed decisions relating to operational efficiency, reducing costs and improving safety. Telogis is the exclusive connected commercial vehicle technology provider for Ford Motor Company, powering its factory-installed Ford Telematics solution. Telogis also works with General Motors, Hino, Volvo, Mack, Manitowoc Cranes and Isuzu to build its solutions into vehicles and equipment in the factory.
Working with AT&T, Telogis is implementing a network solution to deliver a reliable, highly secure stream of data nearly anywhere in the world. The AT&T service management platform allows Telogis to easily manage the data, devices and services that support its customers. AT&T also is working with Telogis to help with over the air updates and provide unique split billing capabilities.
“We’re offering Telogis a complete wireless network that enables two-way, real-time data communication between the vehicle and office,” said Chris Penrose, senior vice president, AT&T Internet of Things (IoT) Solutions. “We look forward to driving new innovative services together in the fleet marketplace and offering true global solutions to our mutual customers.”
“Telogis provides mission-critical intelligence for some of the world’s largest mobile businesses and automotive manufacturers, and our customers demand the quality and reliability that only a provider like AT&T can deliver,” said David Cozzens, CEO, Telogis. “As we continue to capitalize on a rapidly growing, multi-billion dollar global market for connected vehicle and equipment technologies, AT&T provides the scalable infrastructure and backbone Telogis requires.”
TESSCO Technologies is introducing a low-cost investment vehicle tracking, monitoring and control solution at CTIA Super Mobility, being held Sept. 9-11 in Las Vegas. TESSCO is a provider of the product and value-chain solutions required to build, use and maintain wireless systems. The company is displaying the fleet management solution at booth 5932.
“Spending in the U.S. logistics and transportation industry totaled $1.33 trillion in 2012. However, fleet management systems have remained largely disjointed and costly for smaller fleets. Our Fleet Management Solution provides choice, convenience, best-in-class products and a total source for all of the elements needed to deploy a management solution faster and at the lowest cost investment,” said Steven Tom, TESSCO VP of Analytics, Innovation & Learning. “We provide the expertise and service built on our deep experience in wireless networks and in-vehicle communications. We deliver the end-to-end products and services including sensors, telematics, vehicle mounts and internet connectivity.”
Join Steven Tom for his presentation “The Road Ahead: The Future of Fleet Management and Telematics” on the Networked Society & Startup Stage at 2:30 p.m. on Wednesday, Sept. 9. He will share details about the new product offering as well as look ahead to the future of fleet management.
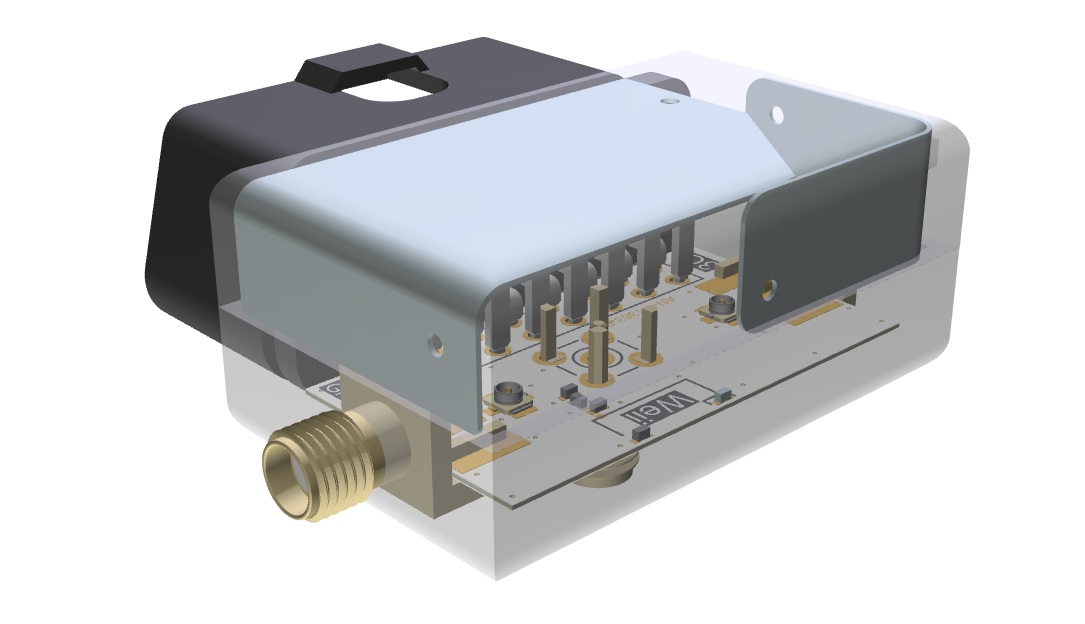
The Antenova ODB (on-board devices) design fully assembled.
Antenova Ltd., manufacturer of antennas and RF antenna modules for M2M and the Internet of Things, has built a model design for on-board devices (OBD) and vehicle telematics, which the company will be showing at CTIA Supermobility 2015.
The OBD design uses three new antennas inside an OBD housing to link to GNSS satellite, Bluetooth and a terrestrial network, while obtaining optimum performance from all three antennas simultaneously. The design also features a new small GNSS RF module to fix location, which Antenova is showing for the first time.
Antenova is using the latest antennas from it product ranges in the OBD design:
the Armata 3G FPC antenna for penta-band frequencies which operates at 824-960 MHz and 1710-2170 MHz
a new GNSS antenna named Bentoni operating at 1559-1609 MHZ,
the tiny Weii PCB-mounted antenna, which provides a Bluetooth connection at 2.4GHZ.
All three are new antennas Antenova released this year.
The new GPS/GNSS module (Antenova part number M10578) is a complete receiver that provides accurate location tracking for OBDs. It uses the latest MediaTek chipset with an additional LNA to give added performance when mounted under dashboards and out of line of sight with the sky.
Antenova’s product designers recently introduced the concept of “Design For Integration” (DFI), which considers how the RF antenna will operate when it is embedded with a manufacturer’s product. Antenova’s antennas are always used within a customer’s design, so they are designed to provide superior RF performance from within the device, and to make the integration of the RF elements easier for the designer. In addition to this, Antenova provides its customers with technical support during the design, integration and testing phases.
“We are demonstrating how a design for an OBD can give great performance, even when new antennas are added to an existing design,” explained Colin Newman, Antenova’s managing director. “OBD devices are growing fast in popularity, and the design of the RF components is critical to the overall performance of a device. In particular, Antenova’s engineers have invested many years in designing antennas that work effectively in very small spaces, whilst maintaining the efficiency of the antenna.”
Antenova offers a range of antennas for Bluetooth, ZigBee, Wi-Fi, ISM, 802.11, 3G, GSM, GPRS, Edge, UMTS, WCDMA, LTE, GLONASS, BeiDou and Gallileo.
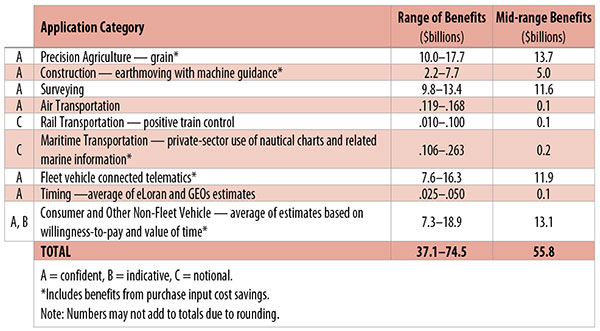
Table 1. Preliminary 2013 U.S. GPS economic benefit estimates. (Chart: GPS World, based on data from author)
This article is based on a presentation to the National Space-Based Positioning, Navigation and Timing Advisory Board in June 2015. The study reported on at the meeting was requested by the National Executive Committee for Space-Based Positioning, Navigation and Timing. It demonstrates the widespread use and importance of GPS to the U.S., with estimated benefits in 2013 of about $56 billion, or 0.3% of GDP for a subset of applications. The study is the first part of an effort that is expected to refine and extend this analysis.
By Irv Leveson
Critical to many civilian applications and innovations, GPS brings great economic benefits. These benefits have grown rapidly with the integration of GPS with other technologies and its wider and deeper infusion into applications. New GPS signals and other improvements in the system will further expand and enhance use. The unmistakable conclusion: GPS is everywhere.
Benefits of GPS to the U.S. will increase with the availability of other GNSS systems, even though GPS will constitute a smaller share of global GNSS benefits. The U.S. will continue to provide leadership, standards and innovation in technology and applications with positive domestic feedback.
GPS and other GNSS and enhancements raise productivity; reduce and avoid costs; save time; enable improved and new production processes, products and markets; increase health and well-being; reduce injury and loss of life; improve the environment; and increase security.
The National Executive Committee for Space-Based Positioning, Navigation and Timing (PNT), which is responsible for maintaining U.S. leadership in GNSS, commissioned a study to assign a quantitative value to the broad economic uses of GPS. The purpose is to inform the public, federal decision makers and critical infrastructure owners/operators on the importance of GPS and the need to protect it from disruption. Assessing the economic implications of actions such as preventing or disallowing interference, spectrum reallocation, developing supplementary or backup systems and/or toughening receivers can be informed by value estimates and the data used to derive them. In addition, economic values can contribute to planning for GPS modernization and analysis of budgets. Baseline estimates facilitate comparisons with future developments. GPS benefit estimates will be “ballpark” no matter how sophisticated the methodology because of limits to the availability of information, but in many cases, knowing orders of magnitude is essential in choosing courses of action.
Widespread, Pervasive Impact. The technological environment is one of rapid changes in information and materials technology and integration of technologies at levels ranging from systems on a chip to large-scale systems. GPS is increasingly integrated with other technologies and systems that build on each other to achieve greater outcomes.
The U.S. Department of Homeland Security counts GPS as an enabling technology because of its crucial role in 14 of the 16 industries that are classified as part of the nation’s critical infrastructure. It is useful to view GPS’ role as being especially important in “enabling the enablers,” industries that particularly support the rest of the economy and are at the forefront of economic growth. The most notable of these are transportation, communications, power and financial services.
Economic Value versus Impact
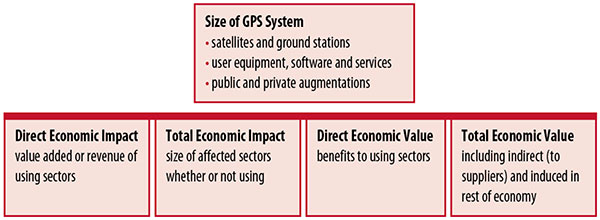
Economic value is the addition to the value of the economy from the provision of a good or service, or the introduction of a technology. Benefits are measured relative to what would have been expected if there were no GPS. Direct economic value is the increase in value in using sectors. Total economic value includes increases in value to suppliers and value induced in the rest of the economy.
Direct economic impact, on the other hand, refers to measures of the importance of sectors that are using GPS. Total economic impact is the importance of sectors affected by GPS, whether they are using it or not. Total economic impact of GPS is virtually the size of the whole economy, so it is not very meaningful.
Direct economic impact is measured by value added of using sectors when the purpose is to avoid duplication among sectors that buy from and sell to each other. It may be measured by revenue for a single sector when adding sectors is not involved, so there is no need to avoid duplication.
The distinction between economic value and economic impact is critical. Even if economic impact is measured by value added rather than revenue, the value is not the net addition to the economy from the use of the product or technology. It is only the size of the using sector. See Figure 1.
Figure 1. Measuring GPS economic value and economic impact. (Chart: author)
The GSA Study
The most comprehensive estimates of global GNSS market size come from the European GNSS Agency (GSA), which has released four market reports from 2010 through 2015. The data are measures of economic impact and not economic value. The reports are of great interest because of their comprehensive global look at the sizes of markets and inclusion of forecasts. In contrast, the emphasis in this part of the present study is on current economic value, with U.S. benefits assessed for GPS.
One reason for interest in the GSA reports is that market information and projections often are proprietary and there can be great inconsistency across market research studies. GSA makes use of many confidential studies without revealing which sources contributed to each estimate. It apparently has been allowed to incorporate proprietary information from a number of market research firms since the data is subsumed in GSA’s own estimates and/or presented in graphs for which underlying numbers are not provided — and from which it is often difficult to even roughly extract them.
The 2015 report stated the methodology as: “The underlying forecasting model uses advanced forecasting techniques applied to a wide range of input data, assumptions and scenarios…Where possible, historical values are anchored to actual data.” Results were checked against opinions of market segment experts and market research reports. However, these analyses are not provided in the reports and have not been made available.
A distinction is made between the core market which covers the value of components that provide GNSS functionality in devices and enabled markets which “represent the services and devices enabled by GNSS.” The 2015 report provides global data on both core and enabled market and goes into much more detail on core markets for application sectors. In addition to providing sector information that did not appear previously, the 2015 report presents data on the extent to which each combination of the GNSS constellations was supported by receivers or chipsets offered by suppliers. Additional information on enabled sectors is in earlier reports.
GSA found in its 2015 market report that:
3.6 billion GNSS devices were in use globally in 2014, of which 3.08 billion were smartphones and .26 billion were for road.
North America had about 450 million devices installed (about 80% U.S.).
North America had 1.4 devices per capita in 2014.
North American shipments were 250–300 million in 2013.
Global core revenue was estimated at roughly €62 billion and enabled revenue at €227 billion in 2014. As noted, core revenue includes GNSS device components, software and services, while enabled revenue refers to applications.
Location-based services (LBS) was projected to account for 53.2% of 2013–2023 core revenue growth, and road for 38%.
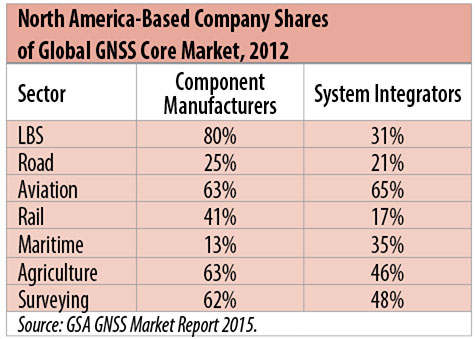
North American-based companies had sizeable shares of the global GNSS core market in 2012, particularly among component manufacturers. (See Table 2). Their market share among system integrators was highest in aviation.
North American-based companies had a 44% market share of value-added services revenue in 2012.
Table 2. North America-based company shares of Global GNSS core market, 2012. (Chart: author)
Markets and Applications
The pervasiveness of GPS-enabled applications is illustrated by the following statistics:
900 million mobile phones that incorporated GPS were sold globally in 2012.
The U.S. had 188 million smartphone subscribers and 263 million Internet users in 2013.
20% of U.S. mobile phone users get up-to-the-minute traffic or transit information.
The new industry category in the 2012 North American Industrial Classification System: “Internet publishing and broadcasting and web search portals” had U.S. revenue of $87 billion and 181,000 employees in 2012.
Google estimated that its search and advertising tools provided $111 billion in economic activity in the U.S. in 2013.
Deloitte estimated that Facebook enabled $104 billion of economic impact and 1.2 million jobs in North America in 2014.
Google Play and the Apple App Store each had more than 1.2 million apps in 2014.
How GPS Is Used. Uses of GPS include:
In agriculture for auto-steering tractors, combines and sprayers for precise operation, variable rate technology for precise placement of seed, fertilizer and pesticides, and for yield monitoring.
Managing forest health and ecological restoration, reducing fire and other hazards, and harvesting forest products.
In commercial fishing, navigation, finding fishing locations and monitoring fish catch by authorities.
In construction to direct the movement of dozers, excavators, pavers, scrapers, compactors and other heavy equipment and the placement of blades to give precise results.
In open-pit mining to guide loaders, dozers, drills and draglines.
In offshore energy exploration and development, for drilling, installations, pipe laying, diving operations, pipe inspection, repair and abandonment.
In surveying, to greatly reduce costs and to improve quality of products that rely on it.
In aviation, for navigation and monitoring positions of aircraft and for satellite-based augmentation systems (WAAS in the U.S.). GPS is the principal source for navigation for aircraft equipped with Area Navigation (RNAV) or Required Navigation Performance (RNP).
Railroad train pacing systems for cruise control, positive train control to keep track of train location and movement authorities, track defect location, and locating trucks with rail workers.
In marine transportation, for navigation, collision avoidance, communications and situational awareness and for monitoring by offshore authorities.
In vehicles, with handheld and embedded devices for navigation and fleet management.
For precise timing and time synchronization and frequency coordination (syntonization). It is used most notably in broadcasting and communications, including both cell phones and traditional telephone applications and the Internet, so packets arrive at the same time, for power generation and distribution to locate problems, and in financial services for time-stamping transactions.
In first responder services for location, navigation and communications and in emergency warnings and evacuations.
In structural monitoring of dams and bridges.
In environmental monitoring, including vegetation growth and sea-level change.
LBS and GIS
Rapid growth is taking place in location-based services (LBS) and geographic information services (GIS), which include everything from indoor location to many aspects of the Internet of Things and the “sharing economy,” and sophisticated systems for information management, analysis and display.
GPS is used for tracking and inventorying assets ranging from heavy machinery on farms and construction and mining sites, to pipes and other materials, containers in trucking sites and ports, and the location of utilities in the ground. In logistics it facilitates planning of product flow and transport.
The growth of same-day delivery — which takes advantage of Internet, cell phone, and location and navigation technologies enabled by GPS — is a continuation of the growth in just-in-time delivery that has been a phenomenon in manufacturing for several decades. Now it is having a profound effect on wholesale trade, retail trade and transportation.
The size of the LBS and GIS sectors is not defined and measured in a consistent way, and except for vehicle use, there is little information on productivity and saving in costs and time. (See sidebar box.)
LBS and GIS Market Size Estimates
For LBS and GIS, definitions and measures can vary greatly and often are not explicit.
Location-Based Services Market Size Estimates
Frost & Sullivan estimated the global LBS market at €22.8 billion in 2012 and forecast €32.0 billion in 2015.
Market and Markets estimated global LBS revenue at $8.1 billion in 2014.
Berg Insight estimated North American LBS revenue at $835 million in 2012.
(The U.S. can be assumed to spend 20–25% of the world value and about 80% of the North American value.)
Geographic information Systems Market Size Estimates
BCG estimated revenue of the U.S. GIS industry at $73 billion in 2011.
The global GIS market will reach $10.6 billion in 2015, according to a report of Global Industry Analysts in 2013.
The Canadian Geomatics study found private-sector spending of $2.3 billion in 2013. If U.S private spending was the same percentage of GDP, it would be $23.6 billion.
International Trade
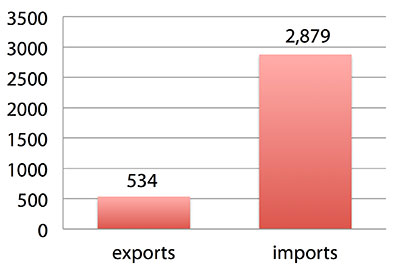
Official data show a $2.3 billion U.S. deficit in trade in GPS equipment in 2013. This gives an incomplete and misleading picture of the role of the U.S. and the benefits that result. See Figure 2.
Figure 2. U.S. trade in GPS equipment, 2013 (millions of dollars). (Chart: author)
The trade numbers for GPS equipment do not include revenue for licensing, international payments received by social media and e-commerce companies, or other Internet-based revenue for which the U.S. may have a substantial net trade surplus and which are an important source of revenue and profits of U.S.-based companies.
Imports of GPS equipment software and services enable the U.S. to gain more efficient production in many applications at home and enable the U.S. to export more goods and service that rely on GPS.
Exports of GPS equipment come back to the U.S. as components that benefit U.S. businesses and consumers with more capable products and lower prices. Exports of GPS equipment enable other countries to build on the technologies and contribute to innovation, while imports enable the U.S. to share in foreign innovations. Exports of GPS equipment and associated knowledge also raise incomes in other countries, creating larger markets for U.S. goods and services.
Scope of Benefit Estimates
The U.S. benefit estimates reported here are the result of an initial effort and are not meant to be comprehensive. More work is expected to be done to fill in some of the gaps.
Sectors were chosen based on availability of information to permit relatively robust estimates and importance to the economy or policy issues. These considerations limited the number of sectors for which estimates could be made. Methods were determined based on the nature of available studies and varied among sectors. Only economic benefits were included, with health and safety and environmental benefits left for later research.
Benefits include the value to users above their costs (consumer surplus). Benefits of GPS are compared with alternatives without GPS or an application using it (counterfactuals). Estimates are gross. They are not reduced by the costs of achieving the benefits. Contributions of augmentations are included, since a quantitative basis for separating them is not available.
Estimates were primarily benefits through productivity and cost savings in operations, with savings in input costs included where their magnitudes were clear. Benefits to the rest of the economy are not included. Illustrative allowances were made for the contributions of other technologies and systems to the outcomes examined.
In the case of GPS timing, the estimates were based on the costs avoided by not having to develop an alternative timing source on the assumption that the type of alternative source possible would have evolved from the time GPS became available. The measure does not represent the value of GPS time and synchronization to the nation and to users relative to the absence of a precise time and frequency source.
Government was included in the estimates for construction, surveying, and fleet and non-fleet vehicles. For timing and non-fleet vehicle benefits, two alternative measures are averaged. Sectors with lower quality estimates — rail and maritime transportation — were included because of their importance to the economy. Shares of benefits attributable to GPS were rough assumptions. More robust estimates would require extensive data collection and interviewing in studies greatly exceeding available time and resources.
The primary focus was on productivity improvements, cost savings and cost avoidance, where costs include users’ time. Productivity increases and cost reductions allow more to be produced with the same amount of resources in the sectors utilizing the technology or allow resources to be freed up for other purposes. In that sense, they are equivalent.
When benefits are measured by productivity gains or cost savings, much of consumer surplus (the value to users above what they pay) is implicitly included. Some sources measure value by willingness-to-pay. Willingness-to-pay includes consumer surplus. It also encompasses costs of the purchase and other costs incurred by the user.
Criteria for Selecting Sectors
The potential for making sector estimates of economic benefits was categorized in three basic levels:
confident: based on robust estimates.
indicative: based on one or more less robust estimates.
notional: illustrative, if major contributions of other technologies are not separated and estimates must be based on a plausible percentage of a larger benefit, or if information is not available and estimates must be based on a percentage of market size.
Choices among categories for estimation and estimation methods depended not only on which of the basic criteria are satisfied but also on the following additional criteria:
The importance of the sector to the economy, for example as an enabler of other activities.
The potential use of benefit estimates for the category as an input into analyses of the effects of signal disruption.
Several dozen studies were assessed to determine categories for inclusion and to select studies that can form the basis of estimation. Studies for use in estimation of benefits in a category were chosen according to how well they met the following criteria:
GPS. A test of introduction of GPS or comparison with and without GPS rather than benefits of a broader service.
Coverage. Estimates that cover a major part of the category.
Robustness of estimates, including the type of review the source is likely to have had.
Consistency. If alternative better estimates are not in such a wide range that an average is less meaningful except where explainable by expected sources of variation.
Timeliness. Preference to a recent period being covered by the estimates.
U.S. Economic Benefit Estimates
Preliminary estimates of economic benefits for included U.S. sectors totaled $55.8 billion in 2013. Averaging the alternative estimates, the sum of the benefits in the two vehicle categories is $25 billion, by far the largest of the sectors estimated. Next were agriculture with $13.7 billion, and surveying with $11.6 billion.
Economic benefits are underestimated for several reasons. Some sectors are not included because of lack of information on productivity and cost savings, namely LBS other than vehicle, including asset tracking and locating people; GIS and mapping other than nautical charts, forestry, fisheries, mining, energy exploration and development, land and coastal management, weather, and scientific applications and space.
Parts of others are not included: non-grain agriculture, construction other than earthmoving, GPS in aviation for some Area Navigation (RNAV) Standard Instrument Departure Routes (SIDs) and Standard Arrival Routes STARS) and Required Navigation Performance (RNP), and rail other than positive train control.
Some estimates are conservative. The value of saved time in non-fleet vehicle transportation is based on the recommendation of the Transportation Research Board rather than the much higher value used by the U.S. Department of Transportation.
Some types of benefits are not included — specifically, benefits of GPS timing applications above the cost of alternatives, and avoided income loss, property damage and medical costs associated with reduced accidents and improved emergency response.
Increases in benefits between 2003 and 2005 are not estimated.
And, as indicated, non-economic benefits such as those to health, safety, security, reduced loss of life and to the environment are not yet addressed.
Benefits as measured thus far are about 0.3% of GDP in one year. If all of the excluded sources of benefits were quantified, the benefits would be much larger.
Estimating Benefits for Sectors
U.S. economic benefits of GPS for grain farming were estimated for farms with grain sales of $250 million or more. The same method as was applied for earthmoving in construction.
A composite range of percentages of productivity gains and cost savings of 18–25% was determined from various studies. In the case of grain farming, benefits also come from yield increases due to improvements in plant health. The productivity gains used in the calculations incorporated both sources of benefits. Productivity was taken together with market size and an estimate of 68% adoption of technologies taking advantage of GPS to compute initial estimates of benefits. A notional adjustment was then made to exclude the contributions of other technologies and GNSSs. While having the adjustment determined by a group of experts would have been preferred, that was not possible with the time and resource constraints of the study.
Benefits of GPS machine guidance with earthmoving in construction were calculated based on an 8–12% share of construction for earthmoving operations, a benefit of 18–22% and a 20–25% adoption rate, relying on a number of sources.
For surveying, an estimate of market size was constructed based on U.S. Bureau of Labor Statistics data on numbers of surveyors, cartographers and photogrammetrists in the engineering services industry vs. the rest of the economy, together with revenue data for private surveying and mapping from the Economic Census. This was combined with a composite estimate of productivity gains over conventional surveying of 45–55% and an assumption of 100% adoption.
The benefit values for air transportation were estimated for the study by the Federal Aviation Administration (FAA) based on effects of WAAS and performance-based navigation (PBN). The rail estimates cover only positive train control, which is in early stages of implementation. Information is highly uncertain, but impacts as of 2013 are small. Maritime benefits were based on updating an earlier estimate of benefits of the private-sector value of nautical charts. The estimates for fleet vehicle-connected telematics were based on savings found in an extensive survey of fleet customers over a five-year period.
Timing benefits were based on the avoided costs from not having to develop an alternative source of timing. Alternatives considered were eLoran and a system of three geostationary satellites. Since there would have been strong pressures to develop an authoritative timing source in the absence of GPS timing, it was assumed that one of the alternatives would have been developed rather than assuming as in other cases that technologies in use when GPS became available would have continued in use.
Two estimates also were made for consumer and other non-fleet vehicle use. One was based on extrapolating results of a study of consumer willingness to pay for navigation services, and the other on time saved by navigation services.
Part of the benefits of LBS other than those that are vehicle-related and for GIS are implicitly included in estimates for sectors that use them.
Data and Research Needs
Additional work would be desirable to extend and refine the GPS economic benefit estimates, quantify safety-of-life and environmental benefits, examine international benefits, assess potential future benefits and consider loss from denial of GPS. Benefits of many new and rapidly growing services are yet to be quantified.
Systematic research is needed to fill in gaps in adoption, productivity and cost savings with comparative before-and-after studies as well as with case studies. Robust studies require major and often multi-year efforts involving targeted data collection, which are rarely done by government or academics for GNSS. Information needs to be much more granular, taking into account specific functions in which GNSS is used (such as plowing, seeding, fertilizing, harvesting), specific GNSS and non-GNSS technologies employed in each function at each site, and extent of their use.
Also, results for GPS might be improved or at least be more acceptable if the contribution of other technologies and GNSSs to measured benefits were assessed by a group of knowledgeable individuals rather than by a single researcher.
Information on market size, penetration and growth from market research firms, which tends to capture recent developments, is based on greatly varying sources and methods, resulting in major gaps and great divergence in estimates, especially in new or rapidly growing areas like LBS and GIS. The North American Industrial Classification System (NAICS) and its application in federal data collection such as in the Economic Census lags far behind in recognizing new categories and providing sufficient detail. Lags in data collection and research lead to understatement of the use and benefits of GPS.
Looking to the Future
Future benefits are expected to be even greater because of evolution of technologies, expansion of GNSS systems, creation of new products and markets, and growth and penetration of markets. The possibilities are suggested by the numerous nascent applications that have been emerging. Many will be enabled by expanding GNSS systems, signals and capabilities in conjunction with geographic expansion and increased capabilities in wireless systems.
The progression of platforms is long and growing: mainframes, PCs, mobile phones and other handheld devices, tablets, game controllers, wearables, TVs, home appliances, air and space — including planes, UAVs, satellites, planets, moons, rovers, rockets and spaceships.
The widespread availability of platforms and the growing ability to utilize them promises a long way to go in developing applications and deriving benefits.
Acknowledgments
The author thanks the PNT Advisory Board and Gov. Jim Geringer, liaison from the board to the study; Jason Kim of the Department of Commerce who oversaw the project; Jim Miller of NASA; and the members of the interagency Economic Study Team that advised the effort. Numerous additional people in and out of government provided information and assistance. Responsibility for the content and findings rests with the author.
IRV LEVESON, who has a Ph.D. in economics from Columbia University, is an economic and strategy consultant and founder of Leveson Consulting. He has done extensive work on GNSS markets and issues for more than 10 years. He is a member of the Institute of Navigation, the American Economic Association and the National Association for Business Economics.
Garmin International Inc. has expanded its partnership with Honda Motors to provide the infotainment systems in new-model Hondas with Garmin’s navigation system. The latest vehicle platform to launch with Garmin and its navigation solution is the all-new Honda Pilot.
“We are delighted to expand our esteemed partnership with Honda across multiple new vehicle platforms, bringing our navigation expertise to their customers via an integrated system that is feature-packed and easy to use,” said Matt Munn, Garmin managing director of automotive OEM. “This growing partnership is a testament to the reliability and quality of our navigation solutions and we are honored by Honda’s continued confidence in Garmin.”
The Garmin system integrates seamlessly into Honda infotainment consoles. Preloaded maps allow users to navigate through areas that lack cell reception, while millions of points of interest make it easy to find existing or new locations, Garmin said.
Spoken turn-by-turn directions are enhanced with advanced guidance features to navigate drivers through challenging and rigorous circumstances. Lane guidance indicates the proper lane for a driver to make a turn, and photoReal junction view provides photo-realistic images of junctions and exits. The system also includes real-time traffic avoidance, speed limit display, 3D buildings, terrain views and more.
Fleet management company Omnitracs LLC will develop telematics software for Volvo Trucks North America and Mack Fleet Management Services for Mack Trucks. The two separate memorandums of understanding will provide customers of both Volvo and Mack Trucks with fleet management services such as routing and predictive analytics solutions.
According to Omnitracs, the agreements represent a move toward standardization in the trucking industry, making it easier for fleets to better control costs, safety, vehicle management and diagnostics, driver workflow and compliance. It also paves the way for other strategic partnerships within the OEM network, the company said.
“This partnership brings together two leading brands in the vehicle and technology space, and addresses the industry’s growing need for high-tech trucks offering improved productivity and compliance. As the Internet of Transportation Things moves beyond concept to reality, Omnitracs will continue to lead and become part of the larger ecosystem of OEMs that are redefining the traditional telematics landscape,” said Rich Glasmann, vice president of OEM strategy, sales and marketing for Omnitracs.
Most railroads will miss the Dec. 31, 2015, deadline for implementing positive train control (PTC), according to a report submitted to the U.S. Congress by the Federal Railroad Administration (FRA). Congress established the deadline in 2008.
An automatic train control system — many of which use GPS — was not installed on the commuter rail route where an Amtrak train left the track in May.
The FRA sent its “Status of Positive Train Control Implementation” report to Congress this week. The report is mandated by the House of Representatives Appropriations Committee.
“Positive train control is the most significant advancement in rail safety technology in more than a century,” U.S. Transportation Secretary Anthony Foxx said. “Simply put: it prevents accidents and saves lives, which is exactly what we seek to do at the Department of Transportation every single day. We will continue to do everything in our power to help railroads install this technology.”
The National Transportation Safety Board (NTSB) began calling for train control systems like PTC in 1969, and the FRA was involved in establishing PTC standards with stakeholders for more than a decade before the 2008 mandate. Three years before Congress passed the PTC mandate, the FRA issued its final rule that established uniform PTC standards for railroads willing to voluntarily install the technology.
Positive train control prevents train-to-train collisions, over-speed derailments, incursions into established work zone limits and a train going to the wrong track because a switch was left in the wrong position.
In 2008, Congress passed the Rail Safety Improvement Act, requiring all Class I railroads transporting poisonous-by-inhalation hazardous (PIH) or toxic-by-inhalation hazardous (TIH) materials, and all railroads providing passenger service, to implement Positive Train Control by Dec. 31, 2015.
The FRA has provided assistance and support to railroads to help them become PTC compliant. Those efforts include:
Providing more than $650 million to passenger railroads, including nearly $400 million in Recovery Act funding.
Issuing a nearly $1 billion loan to the Metropolitan Transportation Authority to implement PTC on the Long Island Rail Road and Metro-North.
Building a PTC testbed in Pueblo, Colo.
Working directly with the Federal Communications Commission and the Advisory Council on Historic Preservation to resolve issues related to spectrum use and improve the approval process for PTC communication towers.
Dedicating staff to continue work on PTC implementation in March 2010, including establishing a PTC task force.
“The Federal Railroad Administration will continue to use its resources and expertise to help railroads achieve the critical goal to have Positive Train Control implemented,” FRA Acting Administrator Sarah Feinberg said.
TomTom’s map and traffic information have been chosen by the University of Minnesota’s Accessibility Observatory as part of a new national accessibility data set.
TomTom will provide map and historical speed data to help analyze accessibility to jobs for driving and transit for metropolitan areas across the United States. For transit data, the Observatory is relying on open, public sources using a method developed at the University with support from the Center for Transportation Studies.
Study partners will be able to use this data for policy development, local transportation system evaluation, performance management, planning and research efforts. Each partner will have direct digital access to the accessibility datasets for the jurisdictions of all partners and will receive detailed reports of local accessibility trends and patterns. The Minnesota Department of Transportation is the lead agency and coordinator for the national pooled-fund study. Other participating agencies are the Federal Highway Administration (FHWA) and the DOTs of California, Florida, Iowa, North Carolina, Virginia and Wisconsin.
“Today’s transportation user wants more than mobility — they want accessibility and they want MnDOT to invest in the appropriate solution, at the right place, at the right time, and at the appropriate cost,” said Tim Henkel, division director of modal planning and program management at MnDOT. “The Accessibility Observatory offers solutions to these decision-making challenges.”
The Transportation Pooled Fund Program, part of the National Cooperative Highway Research Program, allows state DOTs, FHWA program offices, and other organizations to combine resources and achieve common research goals. Additional partners are welcome to join the study.
“We’re excited that the UMN Accessibility Observatory has selected TomTom to help provide geospatial and transportation information for this project,” said Ralf-Peter Schäfer, head of traffic at TomTom. “We are confident that the TomTom map and traffic content will contribute to a better understanding of job accessibility nationwide.”
After months of negotiation, Nokia will sell its HERE Maps division to a consortium of German automakers — BMW, Daimler and Volkswagen — for $2.71 billion, according to the TU Automotive website.
Under the agreement, HERE Maps would turn into an open platform that all car manufacturers can use for navigation and mapping inside vehicles, giving automakers independence from companies such as Google for maps and navigation at a time when the technology moves toward the connected and self-driving car, which rely on navigation technology.
The three German car makers plan to offer the platform to Fiat Chrysler, Renault, Peugeot, Ford, Toyota and General Motors, allowing them to use the mapping service for free without licensing issues.
Nokia is selling the entire unit of HERE, meaning the car consortium will likely continue hiring developers to work on the platform. Companies like Chinese search giant Baidu and Facebook use HERE Maps to power its own mapping services. It remains to be seen how the new deal will affect those services.
“Only with high-precision maps will automated driving on freeways be possible from 2020,” said Bosch board member Dirk Hoheisel. TomTom says it plans to have new high-precision maps for automated driving for all freeways and freeway-like roads in Germany by the end of 2015.