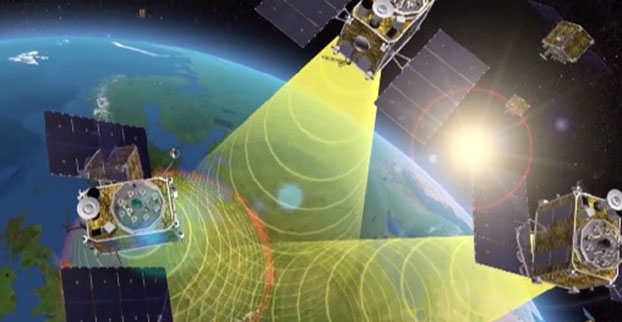
Two further satellites have formally become part of Europe’s Galileo satnav system, broadcasting timing and navigation signals worldwide while also picking up distress calls across the planet, reported the European Space Agency.
Liftoff of Ariane flight VA233, carrying four Galileo satellites, on Nov. 17, 2016.
These are the 15th and 16th satellites to join the network, two of the four Galileos that were launched together by Ariane 5 on Nov. 17, 2016, and the first additions to the working constellation since the start of Galileo Initial Services on December 15.
The growing number of Galileo users around the world will draw immediate benefit from the enhanced service availability and accuracy brought by these extra satellites.
The launch into space and the maneuvers to reach their final orbits still left a lot of rigorous testing before the satellites could join the operational constellation.
Their navigation and search and rescue payloads had to be switched on, checked and the performance of the different Galileo signals assessed methodically in relation to the rest of the worldwide system.
Galileo L-band antenna at ESA’s Redu ground station.
This lengthy testing saw the satellites being run from the second Galileo Control Centre in Oberpfaffenhofen, Germany, while their signals were assessed from ESA’s Redu centre in Belgium, with its specialized antennas.
The tests measured the accuracy and stability of the satellites’ atomic clocks – essential for the timing precision to within a billionth of a second as the basis of satellite navigation – as well as assessing the quality of the navigation signals.
Oberpfaffenhofen and Redu were linked for the entire campaign, allowing the team to compare Galileo signals with satellite telemetry in near-real time.
Making the tests even more complicated, the satellites were visible for only three to nine hours a day from each site.
The satellites are now broadcasting working navigation signals and are ready to relay any Cospas–Sarsat distress calls to regional emergency services.
Now that these two satellites are part of the constellation, the remaining pair from the Ariane 5 launch is similarly being checked to prepare them for service.
Detection of anomalous harmonics in the L1 spectrum
Interfering signals are one of the most well-known nuisance for GNSS receivers. A number of terrestrial systems and devices can generate various types of interference, either intentionally or not, but one would not expect interfering signals to arrive from space. On May 17, researchers of the Navigation Signal Analysis and Simulation (NavSAS) Group at the Politecnico di Torino detected the presence of anomalous spikes in the L1 signal spectrum. The origin of the spikes was identified to be the transmission of non-standard codes from a non-operational GPS satellite (GPS IIF-9, SVN49). In this article, we report on some of the most significant signal observations we performed in an effort to identify and localize the source of the interference and we address the possible impact it could have on GNSS signal processing.
By Fabio Dovis, Nicola Linty, Mattia Berardo, Calogero Cristodaro, Alex Minetto, Lam Nguyen Hong, Marco Pini, Gianluca Falco, Emanuela Falletti, Davide Margaria, Gianluca Marucco, Beatrice Motella, Mario Nicola and Micaela Troglia Gamba
On the afternoon of May 17, 2017, during an outdoor data collection experiment, researchers of the NavSAS Group detected the presence of two spikes in the L1 spectrum, with sufficient power to be clearly visible on a display of the spectrum obtained by processing the raw digital samples at the receiver’s intermediate frequency. The initial check looked for a possible interfering source in the experimental set-up, since it was quite complex and included multiple GNSS receivers, PCs, a video camera and a couple of car batteries. But the likelihood of this source was soon dispelled as the same kind of spectrum was visible on a spectrum analyzer (SA) connected to an active, survey-grade GNSS antenna mounted on the lab roof, as displayed in FIGURE 1. The spectrum is centered at 1575.42 MHz, with the SA set to a frequency span of 5 MHz. Connecting the SA to a different survey-grade antennas on the lab roof, we saw no remarkable differences.
The spikes also appeared on subsequent days, becoming clearly visible at about 13:00 UTC and disappearing at about 19:00 UTC, as illustrated in FIGURE 2. The main lobe of the GPS signal spectrum is visible, along with two spikes, at approximately ±0.5 MHz above and below the L1 carrier frequency. Weaker harmonics are also visible at ±1.5 MHz from the central frequency.
Figure 1. L1 Spectrum of the received signal at 16:51 (Central European Summer Time; 14:51 UTC) on May 19, 2017, at the NavSAS Lab, Torino (located at 45°03’54.98767″ N, 7°39’32.28920″ E, 311.9667 meters).Figure 2. Spectrogram of the received signal. Power spectral density (PSD) is color coded.
Response from the U.S. Air Force about the anomaly
The 2nd Space Operations Squadron is performing maintenance on a presently non-operational satellite. SVN49 is broadcasting non-standard C/A and non-standard Y codes as described in IS-GPS-200. Space professionals continue to conduct safe and responsible command and control of the constellation to continue to provide accuracy that exceeds established system requirements.
As always, GPS users who experience issues should address them through the appropriate channels: military users should contact DSN 560-2541, commercial 719-567-2541 while civilian users should contact the U.S. Coast Guard Navigation Center at 703-313-5900.
Very Respectfully,
NICHOLAS J. MERCURIO, Capt, USAF Director, 14th Air Force (Air Forces Strategic)/JFCC SPACE Public Affairs
Exclusion of terrestrial sources
The 24-hour repetition period of the phenomenon, along with the shape of the spectrum, could indicate the presence of a signal anomaly from a GNSS satellite. However, we could not exclude the hypothesis of unintentional interference generated by a nearby terrestrial communication system, since the area is crowded with research labs belonging to the Instituto Superiore Mario Boella and the Department of Electronics and Telecommunications of Politecnico di Torino. Nevertheless, we probed the L1 spectrum in a wider area using a simple setup, consisting of a patch antenna and a narrow-band front end. We analyzed the spectrum at the output of the front-end’s analog-to-digital converter, plotting the results on a smartphone running our software receiver in real time.
FIGURE 3 shows the L1 spectrum observed several kilometers from the NavSAS Lab. The shape of the spectrum is different than that in Figure 1 because of the narrow-band filter of the front end, but again, the presence of the two spikes is clearly visible at ±0.5 MHz from the central frequency, approximately with the same power strength. In addition, during a dynamic data collection experiment, we recognized that the interfering signals disappeared when the western part of the sky was obscured by buildings, as demonstrated in Figure 3. This was further investigated (and confirmed) when we processed the collected set of data in the lab. At that time (May 19), the hypothesis of an interfering signal from space became more plausible.
Figure 3. L1 Spectrum of the received signal observed on the afternoon of May 19 in Torino, 6.7 kilometers away from the NavSAS Lab: (left) in open sky conditions, (right) with the western portion of the sky obscured by a nearby building.
Meanwhile, the presence of suspicious spikes was confirmed by colleagues at the European Commission Joint Research Centre located in Ispra, Italy, and also from researchers of the Finnish Geodetic Institute in Helsinki, Finland, and by the South African National Space Agency at the station of the South African National Antarctic Expedition IV. These multiple observations definitely excluded the possibility that the interference it could be coming from terrestrial sources or from within the receiving equipment.
Checking the satellites in view during the presence of the spikes in the spectrum (that is, from about 13:00 to about 19:00 UTC) and bearing in mind the periodicity of the event over consecutive days, we excluded the possibility that a Galileo satellite could be the source of interference. It is indeed known that, due to an orbital period of approximately 14 hours for observers on the ground, the constellation geometry repeats only every 10 days.
Figure 4. Visible operational GPS, Galileo and BeiDou satellites over Turin for the full time window between 13:00 and 19:00 UTC on May 20, 2017.
FIGURE 4 shows the visibility of operational satellites over the full time window of interest for the GPS, Galileo and BeiDou constellations.
Considering the duration of the satellites’ visibility, the search for the source of interference was restricted to SVN71 (PRN26), SVN45 (PRN21) and the C11 BeiDou satellite. However, considering the previous tests, the satellite should have been in the western portion of the sky with respect to our location, and the only operational satellite of this set is SVN71, which we initially identified as the possible source of the interfering signal.
GPS SVN71 (PRN 26) or SVN 49?
The frequency of the harmonics could be measured over time. The first peak at approximately 0.5 MHz above the central frequency was analyzed by post-processing a set of digital samples collected with an Universal Software Radio Peripheral, which was slaved to a 10-MHz rubidium standard and which converted the RF signal to baseband, sampling it at 5 MHz. The frequency was measured exploiting a Welch periodogram, based on a 102,400-point discrete Fourier transform, with rectangular windowing and no window overlaps.
FIGURE 5 (a) shows the trend of the measured frequency versus time, from 12:43 to 18:38 UTC, on May 21. The frequency profile reveals that it is not constant and has a trend similar to the typical Doppler frequency shift of a GPS satellite. FIGURE 5 (b) shows the derivative of the frequency, with a minimum around 16:22 UTC. At that time, we expected to have a null Doppler shift from GPS PRN26, whereas the frequency of the peak was equal to 510.449 kHz. This is the inverse of 1.959056 microseconds, which is close to the inverse of twice the chip length, 2/Rc = 1.955034 microseconds. This indicates that the interfering signal could be a square wave with the same rate as the C/A spreading code.
Figure 5(a). Measured frequency of the first upper harmonic versus time.Figure 5(b). Measured frequency of the first upper harmonic versus corresponding frequency rate.
FIGURE 6 shows the Doppler frequency of PRN26 (blue line), as estimated by the tracking loop of a GNSS software receiver, and compares the Doppler shift to the frequency of the first upper peak (orange line), measured on the spectrum. It is possible to note that the two curves almost overlap, with a significant difference at the beginning and at the end of the observation. Thus, although the frequency of the peak follows the Doppler trend of a GPS satellite, it does not exactly match the Doppler curve of PRN26. This result weakened the hypothesis indicating that PRN26 was the source of the interference.
Furthermore, since it was still possible to acquire and track the L1 C/A-code signal from PRN26, this satellite was unlikely to be the source of the interfering components. Thus, also motivated by the mismatch in the Doppler shift of PRN26 (as previously highlighted in Figure 6), we started to think that the source of the interference could be another satellite broadcasting a GPS-like signal.
The search then focused on potential sources of interference coming from a non-operational satellite. The non-operational GPS satellite SVN49, launched on March 24, 2009 (also known as NAVSTAR 63 with NORAD ID 34661), has an orbit similar to that of SVN71 (see FIGURE 7). The previous remarks, let us guess that the transmission of a non-standard code (NSC) from such a satellite was the origin of the problem in the L1 spectrum. Such a case, could be similar to what has been previously reported in by Zhu et al. [1,2] when discussing the effects of the transmission of an NSC on Nov. 28, 2006.
Figure 6. Doppler shift of GPS PRN26 estimated by a tracking loop (blue line) and comparison with the measured frequency of the first upper harmonic versus time (orange line).Figure 7. Skyplot illustrating the path of SVN71 (PRN26) and SVN49 over the time window of interest.
Transmission of NSCs for testing purposes is foreseen in the GPS Interface Specification, IS-GPS-200 [3]. GPS satellites can switch off regular broadcasts of the C/A code and the P/Y code and transmit a non-standard C/A code and non-standard Y code. Such operation is intended to protect users from receiving and utilizing erroneous satellite signals in case of unhealthy conditions on the spacecraft. Strictly speaking, this case cannot be formally considered as an “anomaly,” because the transmission of non-standard codes is documented in the IS-GPS-200. Therefore, the transmission of an NSC can be considered a normal operation in itself, even though it may reflect a problem with the transmitting satellite.
However, in this case the choice of the spreading sequence, which is likely a square wave, allowed the total power of the signal to be concentrated in just a few spectral components, thus originating continuous-wave-like in-band signals.
The distribution of the harmonics, the main components of which are at ±500 kHz, and the presence of the odd harmonics only, matches the case recalled by Zhu et al. [1,2], of a transmission of an NSC modulated as a binary-phase-shift-keying (BPSK) sequence with alternating logical 0s and 1s, transmitted at the C/A code chipping rate (Rc=1.023 megachips per second). The spectrum of this “square wave” with period used as a spreading signal is in fact know to be (1)
where δ is the Dirac-δ function. Zhu et al. [1,2] considered this specific case of a “non-standard code” to be especially remarkable, because it can affect the L1 spectrum, introducing multiple harmonic components similar to those previously illustrated in Figure 1 and Figure 3 (a).
Figure 8. Spectrum of the simulated NSC for different C/N0 values.
The hypothesis of the BPSK with Rc=1.023 megachips per second spreading signal has been verified by simulation. Figure 8. shows how the tested case of a received signal from SVN49 with a C/N0=55 dB-Hz best matches the measured spectrum when SVN49 is at its maximum elevation angle and the power of the received signal is the strongest.
However, it has to be remarked that according to Zhu et al. [1,2], the NSC is designed to have negligible effect on tracking other healthy GPS satellite signals. Nonetheless, their analyses showed that an NSC transmission (as occurred on Nov. 28, 2006) can have a non-negligible impact in the performance on user equipment. In detail, when a GPS satellite is switched to NSC mode, a receiver immediately loses its capability to track that satellite signal. This is not the case with SVN49 as it is currently declared non-operational. However, due to the modified code sequence, an even worse effect is possible. In fact, the NSC introduces irregular components at a sustained level in the GPS signal spectrum.
As a final confirmation of the transmission of the NSC from SVN49, we have used the technique of averaging and summing over the code period as described by Mitelman [6]. Considering a time window during which the Doppler shift of the signal is negligible, we have extracted the spreading code, confirming the square wave hypothesis (see FIGURE 9).
Figure 9. Square wave code obtained by averaging and summing.
According to the Notice Advisory to Navstar Users (NANU) 2001701, SVN49 was broadcasting standard signals as PRN04 (although set unhealthy) since the beginning of the year, but NANU 2017042 announced that PRN04 was to be re-allocated to SVN38 starting from May 18. This switch actually matches the dates when we started to see the spikes in the spectrum, since, probably, the SVN49 started that day to use the “square wave” for the spreading.
Implementing the square wave local code, it has been possible to successfully acquire and track the NSC, as shown in FIGURE 10.
Figure 10. Acquisition and tracking of the NSC. Source: GPS World
Source: GPS World
The real-time software receiver N-Gene, documented by Molino et al. [5],has been forced to acquire and track in real time the signal coming from SVN49. FIGURE 11 shows a screenshot of the N-Gene graphical interface while processing this signal.
Figure 11. N-Gene software receiver processing the SVN49 signal.
The receiver was able to perform the decoding of the navigation message transmitted by SVN49, which exhibits a regular format, even if marked with an unhealthy flag (see FIGURE 12).
Figure 12. Decoded navigation message.
Impact on receiver signal processing
It is well known that the spectrum of GNSS signals is basically a line spectrum in the frequency domain, which is susceptible to interference (see, for example, the book edited by Davis [4]).
Interference with harmonic components such as those generated by the use of a square wave could strongly impact a GNSS receiver in the acquisition and tracking blocks because the interference power is dispersed over the whole search space by the correlation with the local code, compromising the acquisition accuracy and impacting other functional blocks. The impact of interference spectral lines strongly depends on their location within the frequency band. This is due to the almost periodic nature of the GNSS signals. In fact, the spectrum of a GNSS signal has components spaced at multiples of the inverse of the code period (for example, 1 kHz for GPS C/A code) with different power allocated to each component depending on the shape of the code spectrum. The effect is larger in case of matching of the interference spectral components with the ones of the GNSS signal. Furthermore, in the present case, the strongest harmonics are close to the L1 carrier frequency and are not mitigated by the front-end filter since they fall within its narrow bandwidth.
As opposed to the case discussed by Zhu et al. [1,2] when GPS was virtually the only code-division-multiple-access system occupying the bandwidth around L1, the overall GNSS scenario has changed a lot recently. Galileo and BeiDou are also present, and the signals of the Galileo system, due to the different structure and code periods, have spectral lines spaced at 0.25 kHz. The frequency modulation of the interfering signal due to the variable Doppler shift is then even more likely to hit some of the spectral components of these signals.
We are performing further investigations are being performed to assess the impact of the interfering signal from SVN49 on Galileo-based high accuracy applications.
Acknowledgments
The NavSAS Group thanks Dr. Matteo Paonni (EC Joint Research Centre) for the support given in the analysis of the L1 signal spectrum and Dr. Laura Ruotsalainen (Finnish Geospatial Institute) and Danielle Taljaard (South African National Space Agency), who performed the data collection in Antarctica.
Bios
Fabio Dovis, Nicola Linty, Mattia Berardo, Calogero Cristodaro, Alex Minetto and Lam Nguyen Hong are with the Navigation Signal Analysis and Simulation (NavSAS) Group, Politecnico di Torino, Torino, Italy.
Marco Pini, Gianluca Falco, Emanuela Falletti, Davide Margaria, Gianluca Marucco, Beatrice Motella, Mario Nicola and Micaela Troglia Gamba are with the Navigation Technologies Research Area of Istituto Superiore Mario Boella, Torino.
[2] “Satellite Anomaly and Interference Detection Using the GPS Anomalous Event Monitor” by Z. Zhu, S. Gunawardena, M. Uijt de Haag and F. van Graas in Proceedings of the 63rd Annual Meeting of The Institute of Navigation, Cambridge, Massachusetts, April 23–25, 2007, pp. 389–396.
[4] GNSS Interference Threats and Countermeasures by F. Dovis (ed.) published by Artech House, Norwood, Massachusetts, 2015.
[5] “N-Gene GNSS Software Receiver for Acquisition and Tracking Algorithms Validation” by A. Molino, M. Nicola, M. Pini and M. Fantino in Proceedings of EUSIPCO 2009, the 17th European Signal Processing Conference, Glasgow, Scotland, Aug. 24–28, 2009, pp. 2171-2175.
Europe’s Galileo satellite navigation system has undergone its first performance report since it started work at the end of last year, and it passed with flying colors, said the European Space Agency.
The European GNSS Agency, GSA, through its GNSS Service Centre, has published the first of its regular quarterly performance reports on Galileo. This European GNSS (Galileo) Initial Services Open Service report, now available online, covers the first three months of 2017 and documents the good performance of Galileo Initial Services to date.
The report shows the 11 satellites then operating in the Galileo constellation were able to provide healthy signals 97.33 percent of the time on a per satellite basis, with a ranging accuracy better than 1.07 m and disseminating global UTC time within its signal to within 30 billionths of a second on a 95 percentile monthly basis.
“Galileo Initial Services were declared by the European Commission on 15 December 2016,” said Joerg Hahn of ESA’s Galileo System Office.
“It was thanks to the tremendous effort of ESA’s Galileo team working closely together with colleagues from the commission and GSA that this milestone could be achieved: the key pillars for reaching are the currently deployed Galileo satellites in combination with the global Galileo ground segment infrastructure, defined and implemented by the ESA team with their respective industry partners.”
The Initial Service performance levels achieved by the system are monitored using two complementary monitoring platforms: the Time and Geodetic Validation Facility, an independent precision time-measuring system accurate to a billionth of a second — using an ensemble of atomic clocks located at ESA’s ESTEC technical centre in Noordwijk, the Netherlands — and the Galileo System Evaluation Equipment, GALSEE, based in Rome.
The steadily declining Signal in Space Ranging Error (SISE) of the Galileo constellation from 2014 to the present.
In the future, the independent monitoring of the services will be carried out by GSA’s Galileo Reference Centre, currently taking shape beside ESTEC in Noordwijk. The results for the first quarter of 2017 show the measured performances are generally far better than the minimum performance levels identified in the Service Definition Documents.
“Looking back over the ranging accuracy of the Galileo constellation from the time of the very first positioning fix in 2014 to the present, the overall performance trend for the Open Service is very positive,” Joerg said.
“It has reached values of less than 1 m in recent months, being already competitive with other satellite navigation systems.
“The high-quality ranging service enables user level positioning with a typical accuracy of around 3 m on the ground and 5 m in altitude during periods when four satellites are visible. With the limited infrastructure so far deployed, current horizontal position fixes can be achieved during more than 80 percent of the time with accuracies better than 10 meters.
“This user level performance is expected to improve with the launch of more satellites making the provided Galileo services more accurate, more available and more robust for end users.”
The Loran sites at Havre, Montana; George, Washington; and Fallon, Nevada, will continuously broadcast from 0900 (MST) June 20 through 1200 (MST) on June 30. The sites will operate on the 5990 rate but occasionally may operate at other rates.
Only the site at Fallon will operate as an eLoran site. The sites at Havre and George will operate as Loran-C sites synchronized to UTC.
For further information on eLoran, tune into the free webinar on June 15, “Alternative PNT Services.” One of the four presentations will be by Steve Bartlett, executive vice president of UrsaNav, who will provide a brief overview of eLoran technology and performance characteristics with a focus on timing in critical infrastructure applications. Other presentations will cover a new Satellite Time and Location service and indoor timing with a terrestrial beacon system.
UrsaNav is engaged in a Cooperative Research And Development Agreement with the U.S. Department of Homeland Security, the U.S. Coast Guard and Harris Corporation to research, evaluate and document eLoran technology as a candidate for providing position, navigation and timing (PNT) information. eLoran is being evaluated as a potential complementary system to GPS. UrsaNav believes that there is a potentially viable market, in both the public and private domain, for an alternative PNT service that is independent of GPS signal reception or which can be used in GPS-denied environments.
José Ángel Ávila Rodríguez (left)) and Laurent Lestarquit holding a satellite model. (Credit: ESA)
The engineering team behind the signal technology underpinning Europe’s Galileo satellite navigation system has reached the final of this year’s European Inventor Award, run by the European Patent Office, reported the European Space Agency.
The team is led by Spanish engineer José Ángel Ávila Rodríguez — now part of ESA’s Galileo team — and his French colleague Laurent Lestarquit from France’s CNES space agency.
The team also includes German Günter Hein, formerly head of the department studying the evolution of EGNOS and Galileo for ESA, as well as Belgian Engineer Lionel Ries, now in ESA’s technical directorate, as well as French CNES engineer Jean-Luc Issler.
The engineers, who had previously worked together as members of the multinational Galileo Signal Task Force, came up with a pair of innovative signal modulation techniques to pack multiple Galileo signals together, simultaneously serving different sets of users while boosting signal performance and robustness. Both innovations have been adopted by Galileo and are in use today.
The first technique, called Alternative Binary Offset Carrier modulation — AltBOC — combines four signals into one large one, resulting in the widest bandwidth navigation signal ever transmitted. Two of these signals are sitting on the one carrier, namely E5a, while the other two are on E5b.
“AltBOC is a way of transmitting four components in a very wide bandwidth signal, using a single radio frequency chain on the satellite in an intelligent way, where originally two chains would have been needed to transmit in two separate frequency bands (E5a and E5b),” explains José Ángel, now ESA’s global navigation satellite system evolution signal and security principal engineer for Galileo.
“The result is a frequency-rich signal that fundamentally improves positioning performance and robustness.
“AltBOC is interoperable with GPS in E5a/L5 and allows receiver manufacturers to process it as one very large signal – extending over the whole E5a and E5b range – or as two separate signals, one at each frequency carrier (E5a or E5b).
“AltBOC serves open service users in general. Moreover, when used in its full performance mode (E5a+E5b), it also facilitates geodetic and precision scientific applications such as gradual tectonic motion, or the use of accurate positioning on Earth — including proposed ‘reflectometry’ missions to make altimetry measurements from satnav signals reflected from Earth’s surface.
“But the application of AltBOC could go beyond the current use by providing accurate positioning to satellites in space thanks to its unique bandwidth characteristics.”
Trimble’s RTX-based correction services now support the Galileo constellation. As a true five-constellation technology that uses GPS, GLONASS, BeiDou, QZSS and now Galileo satellites, Trimble RTX delivers improved real-time positioning performance to its users worldwide.
With accessibility to the Galileo constellation, users now have visibility to more satellites, which can be advantageous for extreme latitudinal positions or in environments where line-of-sight may be limited.
Surveyors, farmers, mapping and GIS professionals now have a more versatile and robust correction solution wherever they may work, even in the most challenging terrain locales.
Benefits of adding Galileo to Trimble RTX correction services includes:
Increasing the number of in-view satellites, improving the accuracy and reliability of corrections
Improving positioning integrity using observations from additional satellites to better mitigate errors
Operating at higher cut-off angles, delivering better performance in urban canyons and other less than optimal environments
Minimizing multipath and interference through the addition of available satellite signals
“Trimble is continually investing in its correction service technology to remain at the forefront of the industry,” said Mark Richter, marketing director for Trimble’s Networks and Services business. “Our focus is to ensure that the latest GNSS developments are leveraged to continue to deliver productivity improvements for our customers across the globe.”
Mitsubishi Heavy Industries Ltd. and the Japan Aerospace Exploration Agency (JAXA) successfully launched a second navigation satellite on June 1.
The H-IIA Launch Vehicle No. 34 (H-IIA F34) delivered into orbit Michibiki No. 2 of the Quasi-Zenith Satellite System (QZSS) at 9:17:46 a.m. (JST) from JAXA’s Tanegashima Space Center.
The launch and flight of the rocket proceeded as planned, and the separation of the satellite was confirmed 28 minutes and 21 seconds after the launch time.
GNSS and PNT markets continue changing, sometimes very rapidly. No news there. Technology advances relentlessly, opening up new application areas and new price points as it goes.
The market for inertial navigation systems (INS), a subset of that PNT universe, is no exception. The number of available options in inertial has grown substantially. Micro-electrical-mechanical systems (MEMS) sensors lead the charge. Smaller, lighter, lower power and less expensive than previous inertial measurement units, they are truly changing the game and exploding past their previously limited deployment.
So much so that I now need to find a MEMS expert to join our editorial board, advise me on article selection, and attend an ever-widening spectrum of PNT-relevant conferences on behalf of this magazine.
That’s not the only smaller, faster, lighter, cheaper advance warping the speed of change in PNT. Our reporter Robin Wrinn got a look at the 33rd Annual Space Symposium at the ways 3D printing is changing how GPS satellites are put together. I had to rub my eyes when I read her account. Yes, GPS satellites. The column in The System of Systems (page 10) touches only lightly upon this phenomenon. I had to edit all the rest out as we are so short of space in this issue. But go online, where space no longer constrains us, for a fuller account and startling photos.
If this trend goes on much longer, I’ll need a 3D printing expert on the editorial board as well. Indeed, we gave some consideration a few years back to bringing 3D printing “under the umbrella,” so to speak, inside the magically expanding tent — like something out of Harry Potter — that encloses all the technologies we must cover, just to keep up with you folks.
I sense something else lurking about, awaiting an entrance. And for this I’ll really need an expert adviser. I don’t even know what to call it. Somehow it combines virtual reality and gamification. Yes, really. Games are about to begin playing a role in PNT. First in mapping, through the visualization of data; this is explored in our May Defense PNT & Geointelligence Insidernewsletter column.
Gamification is “the application of game-design elements and game principles in non-game contexts.” To what purpose? To improve productivity, of course. Though we may call it accuracy, or availability, or robustness in our realm. It begins with crowdsourcing, probably. Though I feel the ice getting thinner, the limb weaker beneath me as I climb out upon it. Think I’ll stop now.
Upgrades to the monitoring stations underpinning Europe’s EGNOS satnav augmentation system will support its evolution, said the European Space Agency.
The current 40 Ranging and Integrity Monitoring Stations (RIMS) sites across Europe and beyond are the bedrock of the European Geostationary Navigation Overlay Service (EGNOS), supplying highly accurate and robust satnav information that can be relied on for safety-critical purposes.
Thales EGNOS V3 RIMS rack.
Once a second, these stations gather raw satnav data to transmit information on signal quality and range measurements to the GPS satellites, allowing EGNOS to identify and remove any error in the signals.
The resulting corrections are then passed to users via a trio of geostationary satellites, delivering a several-fold increase in precision plus “integrity” — a guarantee of navigation service — for safety-of-life applications.
The result is that the EGNOS-augmented signals are guaranteed to meet the extremely high performance standards set out by the International Civil Aviation Organisation standard, adapted for Europe by Eurocontrol, the European Organisation for the Safety of Air Navigation.
The signals from space can therefore be relied on routinely for safety-critical tasks, such as vertically guiding aircraft during landing approaches.
“These current RIMS V2 stations have some inherent limitations, which we’ve sought to tackle in this upgraded V3 design,” said Didier Flament, ESA’s EGNOS programme manager.
Airbus EGNOS V3 RIMS rack.
“For instance, our current stations work only with GPS frequencies L1/L2 P(Y), while the future post-2020 EGNOS system will be operating on a multi-constellation basis, additionally employing modernized GPS signals, notably on both the L2 (L2C) and L5 frequency bands, as well as other signals from Galileo, on the similar E1 and E5 frequency bands.
“Our experience working with RIMS has emphasized the significance on performance of factors such as signal scintillation — caused by the ever-changing ionosphere, the electrically active layer of the upper atmosphere — as well as other environmental threats such as interference and multipath signal reflection.
“So this upgraded design increased robustness to these factors, based on more stringent development and operating standards, along with innovative radio-frequency environment monitoring.
“It also includes upgraded receiver technology to accurately monitor potential GPS and Galileo signal distortion — ‘evil waveform’ signal anomalies — in full compliance with international standards.”
The RIMS V3 stations will be based in the same or similar secure location as today’s stations — typically airports or space-based telecommunication sites.
Dual tracking antenna concept incorporated in EGNOS V3 RIMS design.
The individual RIMS antennas themselves can be relatively compact, about 50 cm high, with links to receiver and computing equipment.
Most of the RIMS V2 station antennas are currently surrounded by dedicated protection structures that limit the impact of interference and multipath local effects.
Spirent Communications plc is offering a solution that enables the civil aviation industry to evaluate the growing threat of GNSS interference, jamming and spoofing.
The new GSS200D Interference Detector was developed as part of Spirent’s partnership with Nottingham Scientific Limited.
Spirent’s GSS200D interference detector.
As skies and airports become more congested, there is increasing pressure on airports to be safely accessible at all times — which cannot be achieved by relying solely on non-precision approaches with high minimums or on today’s expensive and rigid ground-based infrastructure such as ILS (Instrument Landing Systems).
Ground-Based Augmentation System (GBAS) and instrument approach procedures based on Satellite Based Augmentation Systems (SBAS), such as Localizer Performance with Vertical Guidance (LPV) and Required Navigation Performance (RNP), provide Air Traffic Management with flexible, cost-effective alternatives while providing equivalent operational performance.
For example, the European Geostationary Navigation Overlay Service (EGNOS) launched the LPV-200 service in Europe that enables aircraft approaches without the need for visual contact with the ground until a height of only 200ft. above the runway.
With this service, accessibility, sustainability, efficiency and safety of the landing are greatly improved, especially in bad weather conditions.
Spirent’s new GSS200D solution monitors the radio bands used by EGNOS, as well as other GNSS augmentation systems such as the Wide Area Augmentation System (WAAS) or the GPS Aided Geo Augmented Navigation system (GAGAN), to ensure awareness of interference that could compromise positioning information.
Since local interference near the runway in the GNSS bands could degrade position accuracy or lead to a total loss of the navigation service, it is critical to continuously monitor and understand the RF environment and level of interference around airports.
The GSS200D collects quantitative data on interference allowing assessment of the risks, so that robust mitigation plans can be created. The new Spirent solution has been trialed at a number of European airports, and has collected numerous interference signatures from both unintentional man-made interference and intentional jamming.
“As more airports begin to use GNSS-based instrument approach procedures, they need to know what could be affecting their GNSS signals,” said Martin Foulger, general manager of Spirent’s positioning business. “With this latest solution we can detect interference in the key radio bands, based on levels defined by the United Nations International Civil Aviation Organization and European Organisation for Civil Aviation Equipment. This enables the aviation industry to gain a much better understanding of the electronic environment, helping to avoid dangerous situations going forward.”
For more information on Spirent’s GNSS testing solutions, visit the website. To learn how to test receivers of GPS, Galileo and other GNSS, download Spirent’s latest eBook.
The European GNSS Agency (GSA) has published its first Galileo Open Service quarterly performance report.
The report, which covers the first three months of 2017, is available online in the GSC Electronic Library, or directly here.
Following the Declaration of Initial Services in December 2016, the GSA will publish a new Galileo Initial Services Open Service report after each quarter. The quarterly reports aim to provide the public with the latest information on the Galileo Open Service’s performance.
The document reports on such parameters as:
Galileo Initial Open Service ranging performance
Galileo Coordinated Universal Time (UTC) dissemination and Galileo to GPS time offset (GGTO) determination performance
Galileo positioning performance
Timely publication of Notice Advisory to Galileo Users
In the first quarterly reporting period after the Declaration of Galileo Initial Services, the measured Galileo Initial Open Service performance figures generally exceeded the MPL targets specified in the OS-SDD by significant margins.
Some highlights from the report:
Availability of the Galileo ranging service at the worst user location, with monthly values of 100 percent, is significantly above expectations, where the MPL is 87 percent.
The signal in space ranging accuracy shows a 95th percentile monthly accuracy better than 1.07 [m] for individual space vehicles.
Availability of the Galileo UTC time determination service was achieved, with a monthly value of 100 percent, compared to the [OS-SDD] MPL target of 87 percent.
Availability of GGTO determination (not declared as a service in this phase) was 100 percent in January and March. February showed a slightly lower figure of 96.44 percent, although still well above the [OS-SDD] MPL target of 80 percent.
Excellent values were achieved for UTC time dissemination service accuracy. The measured Galileo Initial Open Service performance figures generally exceeded the MPL targets specified in the OS-SDD by significant margins.
For up-to-date information, check the European GNSS Service Centre (GSC) website. For all support related to Galileo, contact the Galileo Help Desk. The Help Desk allows close interaction with users, both to support the exploitation of Galileo services and to collect relevant information on signal performance as observed by the users themselves.
“Since then, we’ve made a lot of progress,” Steve Malkos, Google technical program manager, told GPS World.
Frank van Diggelen and Mohammed Khider joined Malkos in hosting a half-day tutorial at ION GNSS+ 2016 in September that detailed how to access and use GPS measurements from Android devices.
“We (Google) launched a new website around our efforts with GNSS Measurements that has the latest updates about all things GNSS, such as supported devices, collection tools and analysis tools,” Malkos said.
The Android GNSS Analysis Tool shows how users can select and run the analysis on a per-satellite basis. This tool now supports multi-constellation and dual frequency (L1 and L5) by default. (Credit: Google)
Also, many devices releasing this year will support multi-constellation raw GNSS measurements for the first time. The Phone section on Google’s website shows the latest phones that support multi-constellation measurements. “Google also has launched a device with this capability, one of the first in the world,” Malkos said.
Android O, the next version of Android, will include new GNSS measurement features, such as true multi-constellation support with GNSS measurements (API supported constellations include GPS, SBAS, GLONASS, QZSS, BeiDou and Galileo), measurement support on multiple frequencies (including L1 and L5) and reported AGC (accumulated gain control) jamming detector.
This plot shows the generated output from the Android GNSS Analysis Tool: Signals strengths for the top four satellites per constellation, Skyplots, C/N0 plots, clock continuity or discontinuity, WLS output, PRR and PRR residuals. (Credit: Google)
Google hosts ION GNSS tutorial
Google is hosting a full-day tutorial, “Raw GNSS Measurements from Android Phones,” at ION GNSS+ 2017, which will be held Sept. 25–29 in Portland, Oregon.
The interactive course covers:
The Android Software Stack. Learn how GNSS measurement data flows through the Android software stack. Google will also show attendees where to find the definitions of the different data structures and identify which ones are available at the Application layer.
Updates to Android O. Preview the new GPS-related changes that are slated for Android O.
Description of the available data. Review the data that is accessible in Android, the definitions of the different types of GNSS measurements, their physical meaning and how to use them for analysis and location.
Using the data. Collect GNSS measurements outside and download the data from a provided test device to do some processing. Google will provide software tools that allow participants to log data from an Android Nougat or Android O device, view the raw measurements, and complete basic measurement analysis and position computation.
Examples. Finally, Google will give those who attend specific examples of research projects and applications that users can develop with the tools and knowledge obtained in the class, such as how to build a GNSS data analysis app or how to build a crowd-sourced jammer detector.
To help the Android Measurements team tailor this tutorial to your needs, fill out this form with additional items you’d like covered in the class.