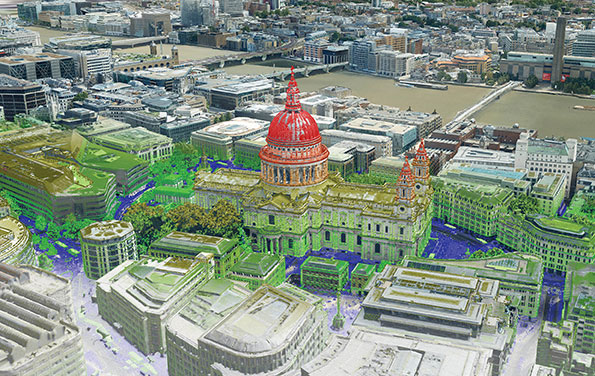
The Bluesky MetroVista range includes high-resolution imagery combined with high-accuracy, wide-scale 3D models. (Image: Bluesky)
Bluesky International has launched its international MetroVista city mapping service for Europe at Intergeo 2019, which took place Sept. 17-19 in Stuttgart, Germany.
The mapping service incorporates the Leica CityMapper hybrid airborne sensor, which can simultaneously capture vertical and oblique aerial photography, as well as lidar.
According to the company, the Bluesky MetroVista range includes high-resolution imagery combined with high-accuracy, wide-scale 3D models. Bluesky’s CityMapper also has already been used to capture MetroVista data for cities across the United Kingdom, including London, Manchester, Newcastle and Bristol.
Bluesky’s CityMapper, used to produce the MetroVista data, includes a traditional vertical camera, as well as survey-grade oblique cameras. The sensor, designed for 3D city modeling and urban mapping, incorporates lidar technology to accurately collect elevation and infrared data.
“Here at Intergeo, we’re showing our MetroVista data sets, which are the city meshes,” Ralph Coleman, sales director at Bluesky, told GPS World. The city meshes are extremely dense, they’re very feature-rich, and they’re vey accurate. They provide a vast range of detail for a massive range of applications.”
Bluesky is a United Kingdom-based aerial survey and geographic data company that produces and maintains digital aerial photography and height data. The company has offices in the United Kingdom, United States and the Republic of Ireland, as well as a production center in India.
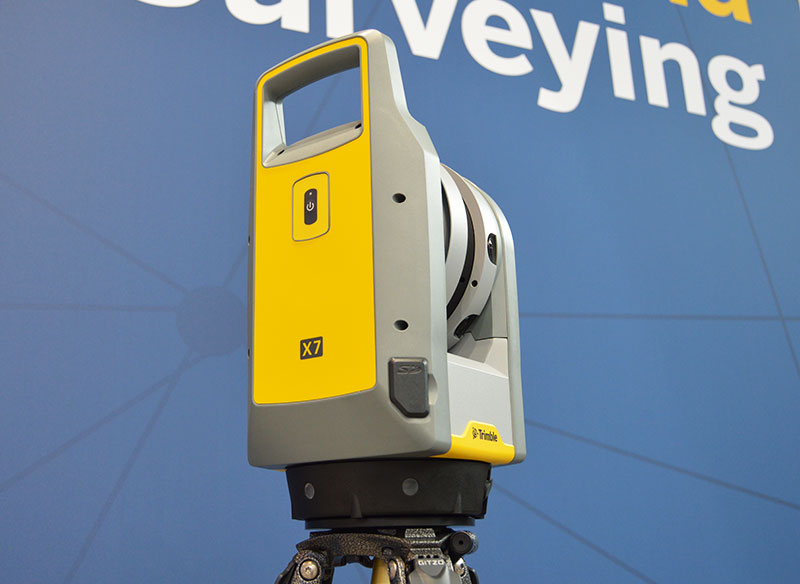
The Trimble X7 is designed for surveying, construction, industrial and forensic applications. (Photo: Allison Barwacz)
Trimble has released its X7 3D laser scanning system at Intergeo 2019, which took place Sept. 17-19 in Stuttgart, Germany. According to the company, the system is designed to enable professionals of all scanning levels to quickly and easily capture precise 3D scanning data to produce high-quality deliverables.
The X7 is designed for surveying, construction, industrial and forensic applications. The scanner features Trimble X-Drive technology, survey-grade self-leveling and a smart calibration system.
“We are really excited to bring the X7 to the market,” Gregory Lepere, marketing director, optical and imaging, Trimble, told GPS World. “It’s a very simple solution but offers a lot of smart technology. Every time you turn the instrument on, the automatic calibration will start, so you’re guaranteed to have all of the specifications all of the time.”
It also integrates streamlined workflows to provide automatic registration of point cloud data in the field with Trimble Registration Assist.
“The feature bringing the most simplicity to the solution is the Trimble Registration Assist technology, which is a full registration in the field, bringing all of the scans together thanks to self-leveling IMU technologies combined with cloud-based software,” Lepere said.
Survey applications
For surveyors and geospatial professionals, the X7 provides fast and balanced performance in both indoor and outdoor environments and is ideal for industrial survey/tank calibration, civil infrastructure, general surveys, road intersection surveys, utilities, mining, and historical documentation and renovation, Trimble said.
The X7 is fully integrated with the Trimble Perspective software, which enables scans and images to be captured, fully registered together, refined, controlled and exported to a variety of established data format for Trimble and non-Trimble software suites.
Building design and construction applications
For users in building design and construction, the X7 assists with measurement problems and improves field productivity for a broad range of applications in architecture, engineering and construction industry projects.
For these applications, the X7 is fully integrated with Trimble Field Link software to provide streamlined workflows specific to the building construction industry — from scanning to modeling to field layout.
Forensics applications
According to Trimble, the X7 can perform in demanding conditions and offers easy setup for investigators and law enforcement. It also pairs with the company’s Trimble Forensics Capture software.
The Trimble X7 is expected to be available in the first quarter of 2020.
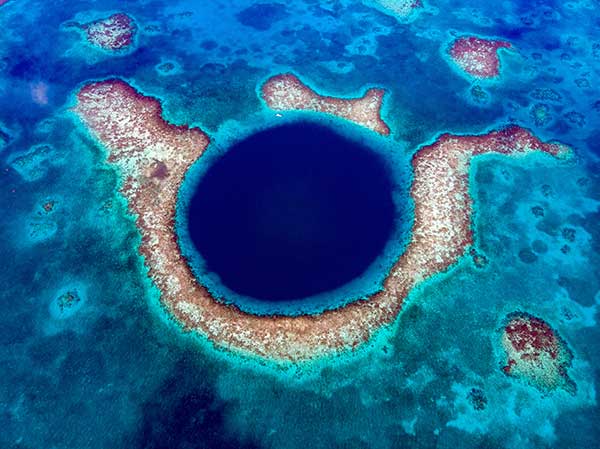
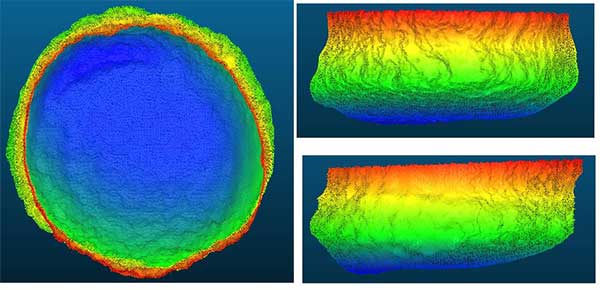
A sonar survey, camera and sensor data of the world’s largest marine sinkhole is shining light on sea level and climate change over 100,000 years.
From Nov. 27 to Dec. 13, 2018, the Blue Hole Belize Expedition mapped the sinkhole. Led by Aquatica Submarines, the team of scientists, explorers and film makers included Virgin ’s Sir Richard Branson and Fabien Cousteau, grandson of the conservationist Jacques Cousteau.
Kongsberg used both surface and submarine-mounted sonar equipment.
Sonar expert Mark Atherton from Kongsberg’s Canadian subsidiary Kongsberg Mesotech was a key member of the science-based sonar and scientific data collection team. Atherton operated the sonars aboard the Research Vessel Brooks McCall, contributing to an invaluable high-resolution map of the entire sinkhole.
“By understanding the geological history and geometric structure at the Blue Hole we can contribute new data to the global scientific community studying sinkholes and cenotes,” he said.
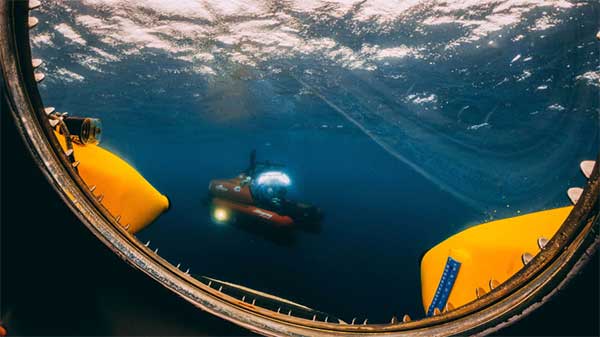
Photo: Aquatica Submarines
Aquatica Submarine’s Stingray 500 submarine was used for sonar surveying, filming and dives. The team conducted more than 20 dives into the large sinkhole, taking videos and 3D images during each trip. They also completed a two-hour live broadcast featured on The Discovery Channel.
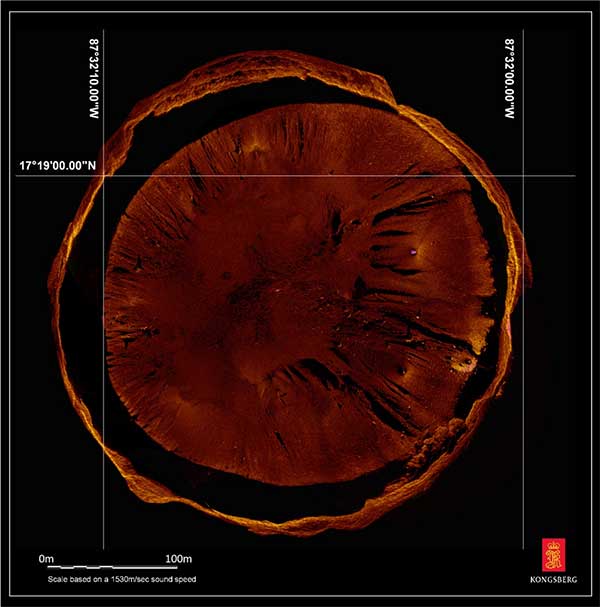
A key outcome of the Expedition is creation of a complete 3D sonar map of the Blue Hole. The sonar map is enhanced with other passive submarine-collected environmental data. Once processed and collated, the data will be shared with the Government of Belize and the larger global scientific community as a legacy from the expedition.
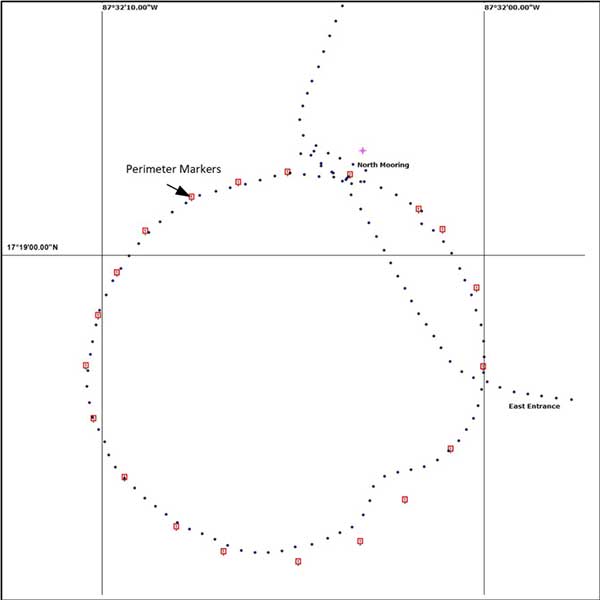
Perimeter Markers: Using an SBG Systems Ellipse receiver positioned directly over suspended tripods, positions were locked in the MS1000 processing software the instant each tripod touched bottom. With no current within the Blue Hole and the tripod and sonar weighing 21.7 kg, there was no issue with offset position differences between the vessel and the tripod hanging plumb during deployment. (Image: Mark Atherton/Kongsburg)Processed Scan Data: A dual-axis sonar (DAS) system collected point-cloud data to create a 3D representation of the Blue Hole. The unit was pole-mounted on the survey vessel with the GPS and motion reference unit directly over the scanner’s head. (Image: Mark Atherton/Kongsburg)Mosaic: GPS tripod position and target matching on overlapping scans were used to align the 50-, 75- and 100-meter-range data collected at 21 drop locations. This mosaic is a very close approximation of the bottom of the Blue Hole. (Image: Mark Atherton/Kongsburg)
Spectra Geospatial has introduced the MobileMapper 60, a durable, efficient and accurate handheld device for geographic information system (GIS) and professional data-collection applications.
The MobileMapper 60 all-in-one GNSS receiver and smartphone combines a convenient form factor for geospatial data collection with 2-4 meter positioning accuracy. Its slim, lightweight all-weather design, complete with a hand strap, features a large 6-inch screen with high resolution for easy viewing and data manipulation.
With a large capacity all-day battery and rugged exterior, the MobileMapper 60 will operate continuously in range of extreme temperature and environmental field conditions.
Running an Android 8.0 operating system, it has a fast 2.2 GHz processor, 4 GB of memory and 64 GB of storage for managing large data sets with ease and speed. Bluetooth 4.1, 4G LTE and Wi-Fi capable, the MobileMapper 60 is ideal for a wide range of jobs, including cadastral, survey, topographic, forestry, control and much more.
“The MobileMapper 60 gives GIS and survey professionals a rugged, easy-to-use, smartphone device for data collection in the field,” said Olivier Casabianca, general manager, Spectra Geospatial. ”The MobileMapper 60 is a powerful solution for field professionals , making it easier than ever to work efficiently in the field.”
Latitude Geographics (a VertiGIS company) has released the 4.12 version of its flagship product Geocortex Essentials to make it easier for developers of mapping applications to take advantage of Esri’s ArcGIS technology.
Smart mapping. Using Esri’s smart-mapping functionality, GIS departments around the world are creating eye-catching, informative maps in ArcGIS Online. Smart mapping allows analysts to visualize and review their data in unique ways to discover trends and solve complex problems. By styling data and displaying it in a thematic map, hidden meaning can be found.
For example, a map can now be created that uses clustering, opacity and varying color schemes to display:
the most prevalent level of education in a county by neighborhood,
the incidence of that level of education in that neighborhood, and
the variance from that mean level of education in that neighborhood.
Web maps output from ArcGIS Online can now be imported into Geocortex Viewer for HTML5 (GVH) exactly as they are, meaning that all smart mapping symbology, legends and other information will be preserved and appear in GVH in the same format.
Scripting. The Arcade expression language adds powerful scripting capabilities to the ArcGIS platform. By writing simple scripts, users can manipulate their map data on the fly in several ways.
For example, a user could use an Arcade script to set up an identify parcel operation that also returns a summary of both the population density and communications infrastructure in the area, along with any other variables of interest. The portability of these scripts allows them to now be used within Geocortex applications.
“The new functionality added in this release provides even stronger support for developers using the ArcGIS platform, particularly those familiar with creating smart maps in ArcGIS Online,” said Drew Millen, chief technology officer for Geocortex. “It’s now easier than ever to build a mapping application that pulls data from various sources and uses it creatively to improve decision making.”
To learn more about the latest version of Geocortex Essentials, visit the company’s product release page.
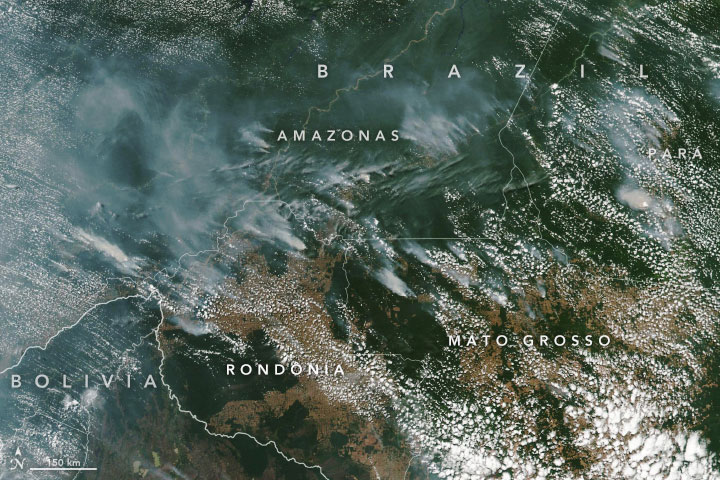
Wildfires in the Amazon rainforest in Brazil have hit record numbers, and satellites have been able to capture imagery of them.
According to NASA, the Moderate Resolution Imaging Spectroradiometer on its Aqua satellite captured images of several fires burning in the states of Rondônia, Amazonas, Pará and Mato Grosso on Aug. 11 and Aug. 13.
A satellite view of the Amazon wildfire on Aug. 13. (NASA Earth Observatory images by Lauren Dauphin, using MODIS data from NASA EOSDIS/LANCE and GIBS/Worldview and VIIRS data from NASA EOSDIS/LANCE and GIBS/Worldview, and the Suomi National Polar-orbiting Partnership.)
There have been 72,843 fires in Brazil this year, with more than half in the Amazon region, Brazil’s space research center, the National Institute for Space Research (INPE), said. This marks an 84% increase over the same period of 2018 and is the highest since records began in 2013, INPE added.
Amazonas, the largest state in Brazil, recently declared a state of emergency over the forest fires, said Euro News.
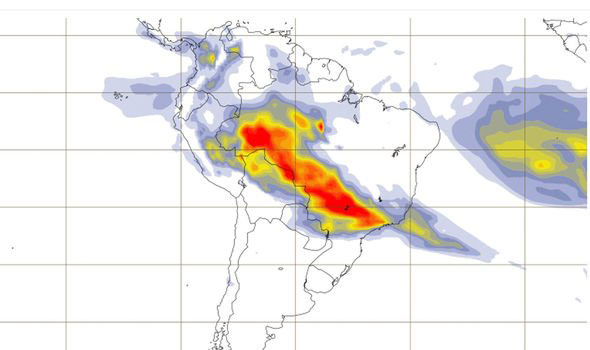
This map shows the “Biomass burning aerosol optical depth.” (Image: Copernicus’ Atmosphere Monitoring Service)
In the Amazon region, fires are rare for much of the year because wet weather prevents them from starting and spreading. However, in July and August, activity typically increases due to the arrival of the dry season, NASA said.
A security technology firm reduced the time needed for public-safety personnel to engage a simulated active shooter by providing the team with site floorplans created from 3D laser scan data.
Before the exercise, the firm scanned the entire 112,000-square-foot building interior in just 2.5 hours with the GeoSLAM ZEB-HORIZON 3D mobile scanner.
“In the role-playing scenario staged at a mega-church, the off-duty police officers reached the shooter in up to 21 percent less time using a 2D floorplan generated from the laser scans,” said Robert W. Myers, CEO of Entropy Group LLC. “However, we expect engagement times to drop considerably by leveraging the 3D scan data to create virtual reality training simulations.”
Based in San Ramon, Calif., Entropy Group was established to save lives during active shooting incidents at schools and churches by providing law enforcement with the situational awareness information they need to reach perpetrators more quickly inside complex building spaces.
Handheld mapping. The firm uses the GeoSLAM ZEB-HORIZON handheld mapping device to capture 3D scans of school and church interiors, including small offices, classrooms and closets. The GeoSLAM software generates highly accurate 2D floorplans for use by responders, either hardcopy or digital, to navigate the interior of the building.
The same data set can also be used to create virtual environments where multiple officers train on computers to respond to attack scenarios in realistic, immersive 3D simulations of actual schools and churches in their jurisdictions.
“Eventually, we plan to utilize machine learning technology that will allow individual officers of first responder teams to be dispatched to specific locations within the facility in real time to quickly reach shooter engagement locations within the buildings,” Myers said.
The handheld ZEB-HORIZON laser scanner allows users to map interior and exterior spaces in 3D at walking speed. The lightweight device captures up to 300,000 points per second with an accuracy of 1-3 centimeters up to 100 meters from the user.
SLAM technology ensures points are tied to local coordinate systems even in interior spaces where GPS/GNSS coverage is poor. Large multi-room buildings that might take days to scan with a stationary scanner can be mapped in a few hours with the ZEB-HORIZON.
“Mobile laser scanning technology is the fastest and most cost-effective way to create the 2D and 3D building information tools public safety personnel need to prepare for a variety of emergency scenarios,” said Shelley Copsey, GeoSLAM CEO.
The GeoSLAM Hub software creates a fully integrated data collection and mapping workflow, enabling ZEB-HORIZON users to process, view, merge, edit and output 2D and 3D deliverables within minutes of data capture. Outputs include 2D floorplans, CAD, as well as an integrated workflow for the creation 3D building information models (BIMs).
Entropy Group is working directly with school districts and places of worship to provide scanning services and develop standardized procedures for the capture of 3D data inside their buildings. These reality capture data sets and derived 2D and 3D products will be provided to local public safety organizations for use in generating hardcopy and digital representations.
A new night map integration feature is available for all Concept3D maps. The toggle-on map overlay is designed to enhance campus safety and security by making it easy to find the best, well-lit routes and critical resources such as emergency phones.
The Concept3D interactive mapping platform is used by hundreds of major universities, colleges and schools, as well as convention centers, hospitals, resorts, retirement communities, data centers and businesses.
The night map feature offers all of these clients a way to provide their audiences with important safety and security information for visiting and navigating the campus at night.
The University of Denver, Boise State University, and Pacific Lutheran University are the first to integrate this feature into their Concept3D-powered interactive campus maps.
The night map of the campus of Boise State University. (Image: Concept3D)
Boise State University is using the new night map feature to highlight Public Safety Dispatch Centers, Emergency Blue Light and Refugee Phones and locations of automated external defibrillators (AEDs). Each item has a display box that further explain the exact location of the service and additional information.
Pacific Lutheran uses the night map to display campus AEDs, emergency telephones, and its safety building.
Colleges and universities that participate in federal Title IV student financial assistance programs must comply with the Clery Act, which requires annual security reporting, details and geographic information about crimes committed on campus and on public areas immediately adjacent to the campus, and timely warnings and emergency notifications, among other requirements.
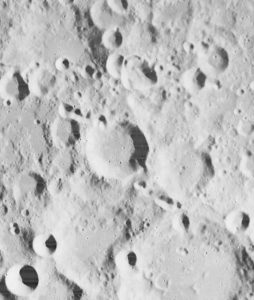
I was inspired by the 50th anniversary of the Moon landing on July 16 and our focus on mapping this month to look into imagery of the Moon.
Only recently have we learned that the lunar orbiters that photographed the Moon in the 1960s sent back images that were stunningly high resolution (HR), even by today’s standards. The actual resolution was presumably kept secret because the imaging technology was also used in our Cold War spy satellites.
Under the Lunar Orbiter Program, satellites took photographs of the Moon’s surface to identify suitable landing sites for the Apollo Program. Managed by the Langley Research Center, five Lunar Orbiters were successfully flown in 1966 and 1967, mapping 99% of the Moon’s surface with a resolution of 60 meters or better.
The first three missions were dedicated to imaging 20 potential landing sites, and were flown at low-inclination orbits.
The fourth and fifth missions were devoted to broader scientific objectives and were flown in high-altitude polar orbits. Lunar Orbiter 4 photographed the entire nearside and 95% of the farside, and Lunar Orbiter 5 completed the farside coverage and acquired medium (20-meter) and high (2-meter) resolution images of 36 pre-selected areas.
In that pre-digital era, the Lunar Orbiters had an ingenious imaging system, which consisted of a dual-lens camera, a film processing unit, a readout scanner and film-handling apparatus. Both lenses, a 610-mm narrow angle HR lens and an 80-mm wide-angle medium resolution (MR) lens, placed their frame exposures on a single roll of 70-mm film.
The axes of the two cameras were coincident so the area imaged in the HR frames were centered within the MR frame areas.
The film was moved during exposure to compensate for spacecraft velocity, which was estimated by an electric-optical sensor. The film was then processed, scanned, and the images transmitted back to Earth. Based on these images, the NASA Apollo Site Selection Board would name five candidate landing sites in February 1968.
Data from Earth Monitor reveals the number of cars and trucks in an area of Amsterdam. (Image: Airbus)
The new Earth Monitor tool draws from the Airbus imagery archive and satellite tasking capabilities to provide advanced geospatial analysis, trends and detection maps.
Available as part of Airbus’s OneAtlas suite of geospatial tools, Earth Monitor enables customers to draw precise, timely and meaningful conclusions. It uses Orbital Insight’s machine learning and computer vision expertise through algorithms that detect changes in infrastructure and land use in near-real time. It can identify and count objects such as cars, trucks, roads, homes, buildings and construction sites and, soon, aircraft.
Earth Monitor can identify trends, spot patterns and track economic activity, delivering advanced geospatial analysis and change-detection maps on customized areas of interest to users in defense, intelligence and law enforcement.
Earth Monitor comes from a collaboration between Airbus Defense and Space, a French aerospace company, and Orbital Insight, a Silicon Valley startup. The OneAtlas platform combines Airbus’ constellation and tasking services with Orbital Insights’ analytic capabilities.
Orbital Insight’s algorithms draw on petabytes of data from multiple sources, such as satellite and synthetic aperture radar imagery, geolocation intelligence and vessel traffic data.
The tool’s interface enables users to create and manage projects, customize analyses and define period and measurement frequencies.
A major use of remote sensing data is to compare images of an area taken at different times and identify the changes it underwent. With a wealth of long-term satellite imagery in open use, detecting such changes manually would be time-consuming and most likely inaccurate.
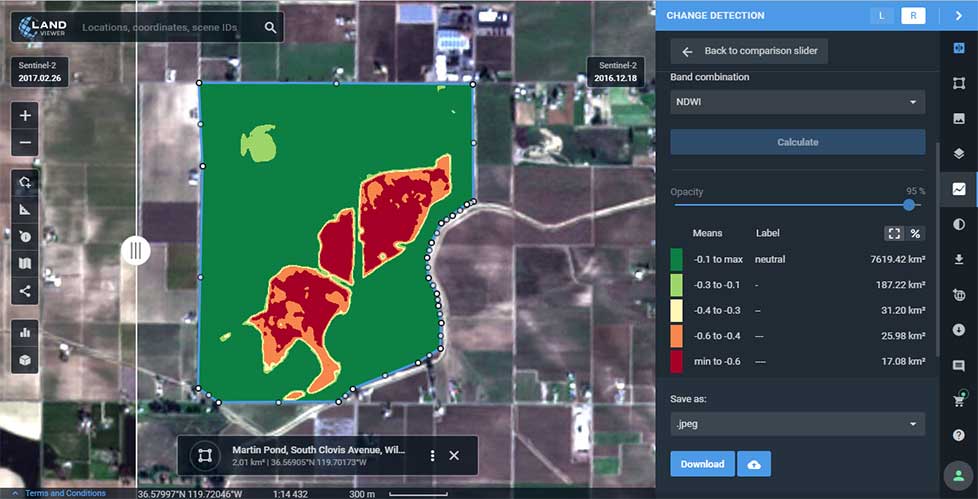
To address this, EOS Data Analytics has introduced an automated Change Detection tool to its flagship product LandViewer, a cloud tool for satellite imagery search and analysis in today’s market.
Unlike the methods involving neural networks that identify changes in the previously extracted features, the change detection algorithm implemented by EOS is using a pixel-based strategy, meaning that changes between two raster multi-band images are mathematically calculated by subtracting the pixel values for one date from the pixel values of the same coordinates for another date.
This new signature feature is designed to automate a change detection task and deliver accurate results in fewer steps and in a fraction of the time needed for change detection in most image-processing software.
Change detection interface: Images of Beirut city coastline selected for tracing the developments of the past years. (Image: LandViewer)Change detection interface: Images of Beirut city coastline selected for tracing the developments of the past years. (Image: LandViewer)
Applications from farming to environmental monitoring
One of the main goals set by EOS team was to make the complex process of change detection in remote sensing data equally accessible and easy for non-expert users coming from non-GIS industries.
With LandViewer’s change detection tool, farmers can quickly identify the areas on their fields that were damaged by hail, storm or flooding. In forest management, satellite image detection of changes will come in handy for estimation of the burned areas following the wildfire and spotting the illegal logging or encroachment on forest lands.
Observing the rate and extent of climate changes occurring to the planet (such as polar ice melt, air and water pollution, natural habitat loss due to urban expansion) is an ongoing task of environmental scientists, who may now have it done online in a matter of minutes. By studying the differences between the past and present using the change detection tool and years of satellite data in LandViewer, all these industries can also forecast future changes.
Top change detection use cases: Flood damage and deforestation
A picture is worth a thousand words, and the capabilities of satellite image change detection in LandViewer can be best demonstrated on real-life examples.
Forests that still cover around a third of the world’s area are disappearing at an alarming rate, mostly due to human activities such as farming, mining, grazing of livestock, logging, and also the natural factors like wildfires. Instead of massive ground surveying of thousands of forest acres, a forestry technician can regularly monitor the forest safety with a pair of satellite images and the automated change detection based on NDVI (Normalized Difference Vegetation Index).
How does it work? NDVI is a known means of determining vegetation health. By comparing the satellite image of the intact forest with the recent one acquired after the trees were cut down, LandViewer will detect the changes and generate a difference image highlighting the deforestation spots, which can further be downloaded by users in JPG, PNG or TIFF format. The surviving forest cover will have positive values, while the cleared areas will have negative ones and be shown in red hues indicating there’s no vegetation present.
A difference image showing the extent of deforestation in Madagascar between 2016 and 2018; generated from two Sentinel-2 satellite images. (Image: LandViewer)
Another widespread use case for change detection would be agricultural flood damage assessment, which is of most interest to crop growers and insurance companies. Whenever flooding has taken a heavy toll on your harvest, the damage can be quickly mapped and measured with the help of NDWI-based change detection algorithms.
Results of Sentinel-2 scene change detection: The red and orange areas represent the flooded part of the field,; the surrounding fields are green, meaning they avoided the damage. California flooding, February 2017. (Image: LandViewer)
How to run change detection in LandViewer
There are two ways you can launch the tool and start finding differences on multi-temporal satellite images: by clicking the right menu icon “Analysis tools” or from the Comparison slider ‒ whichever is more convenient. Currently, change detection is performed on optical (passive) satellite data only; addition of the algorithms for active remote sensing data is scheduled for future updates.
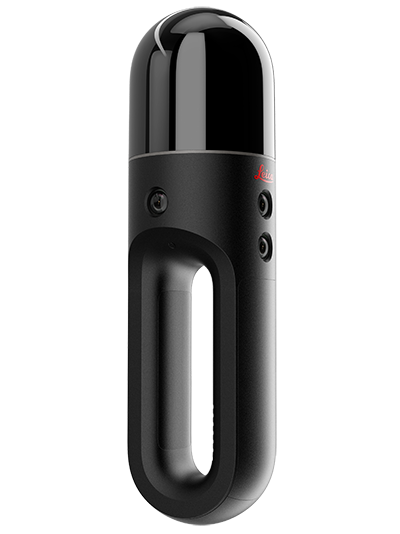
Hexagon AB has introduced two new additions to its Leica BLK series. The Leica BLK2GO is a small, portable, integrated handheld-imaging scanner, and the Leica BLK247 is a 3D laser-scanning sensor for security surveillance providing continuous, 24/7 situational awareness.
“Extending the BLK series continues Hexagon’s 20-year focus on revolutionising reality capture,” said Ola Rollén, Hexagon president and CEO. “These sensors are not only ground-breaking for their technical capabilities, but also for their practicality. The Leica BLK2GO can be taken anywhere, and the Leica BLK247 never sleeps.”
Leica BLK2GO. The Leica BLK2GO introduces mobility for scanning complex indoor environments. The handheld-imaging laser scanner combines visualisation, lidar, and edge-computing technologies to scan in 3D while in motion, allowing users to be more agile and efficient in capturing objects and spaces.
The BLK2GO has a wide range of applications from adaptive reuse projects in the architecture and design industries to location scouting, pre-visualisation, and VFX workflows for media and entertainment.
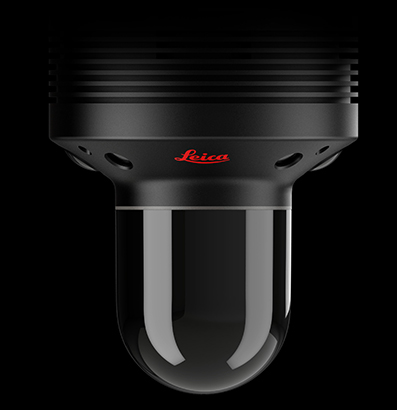
The Leica BLK247. (Photo: Hexagon)
Leica BLK247. The Leica BLK247 is designed for continuous 3D reality capture, extending capabilities for safety and security applications. The sensor provides real-time situational awareness through edge computing and LiDAR-enabled change-detection technology.
Using artificial intelligence, the BLK247 can tell the difference between still and moving objects — such as a person walking who leaves a suitcase behind — and identify security threats to provide real-time alerts for both expected and unexpected changes.
The BLK247 greatly enhances situational awareness within restricted or high-security spaces, as it eliminates the need for people to constantly monitor walls of security screens or smart building dashboards.
The Leica BLK2GO and Leica BLK247 are among the many innovative solutions showcased this week at HxGN LIVE 2019, Hexagon’s annual digital technology conference.