Category: Opinions

  • GPS, surveyors and politics — a 2018 refresher

    GPS, surveyors and politics — a 2018 refresher

    While not as glamorous as mild-mannered Clark Kent holding down a day job while Superman comes to the rescue in time of crisis, there are professional surveyors who work day jobs to perform our duties as practitioners to make a living and participate in association activities in their off-hours to help promote and protect their profession as well as the public they serve.

    Many of the hours spent to protect the profession are in the political arena, where the battle for budget dollars and service rights are fought on nearly a daily basis. Because of the reliance of the surveyor on technological advances, the profession has been thrust into the political arena at all legislative levels. The surveyor has been tasked with leading the discussion and help the public understand why significant dollars are needed for funding many different programs to continue with our high-tech trends and lifestyles.

    Three of the four presidents on Mount Rushmore started as surveyors — George Washington, Thomas Jefferson and Abraham Lincoln. (Photo: National Park Service)

    The role of the surveyor has not been considered political even though several significant U.S. presidents were surveyors in their early careers. Surveyors aren’t particularly known for their public personas, much less their political prowess. Other than states that still have county surveyors, rarely do practitioners stray beyond local municipal government. One is more likely to see a professional engineer or architect as an elected official than a surveyor, but that doesn’t mean the issues we face are any less important.

    My current position is a professional land surveyor with a full-time job overseeing a department in a multi-discipline office in a major metropolitan area. Besides being a contributing editor to GPS World through these articles, I also voluntarily wear many hats within our state association and the national surveying society. Several of these hats are government affairs positions at both state and federal levels, as it has become a full-time operation to keep a watchful eye at all governmental levels. From changes in regulations, budgetary revisions and threats to our professionl by outside entities, government affairs take a small army of people to keep abreast of all situations.

    This month’s submission is just a snapshot of the current National Society of Professional Surveyors (NSPS) Joint Government Affairs Committee action item list being addressed and monitored through its committee members and a governmental lobbyist. The importance of this list is to give the reader a sampling of the seemingly endless battles being waged on Capitol Hill by NSPS and its members nationwide.

    All these issues have GNSS at their heart and will have dire consequences if any of these subjects fall short of their intended marks.

    This is not just about the GNSS and how we collect data; it’s also about the necessity of large scale data collection to provide better and safer services to the citizens of the United States and its territories.

    Our current datasets and standards for data collection, like our infrastructure, is aging and lacking in detail. Serious upgrades are overdue, so several actions have been put forth to try to rectify the shortcomings.

    3DEP

    Formally known as the 3D Elevation Program, this language was introduced as part of S. 1460 (“Energy and Natural Resources Act of 2017”) by Senator Lisa Murkowski of Alaska. This program is being created so that consistent elevation data, cultivated through many surveying and mapping sources including lidar, will be available for efficient design use throughout the American infrastructure.

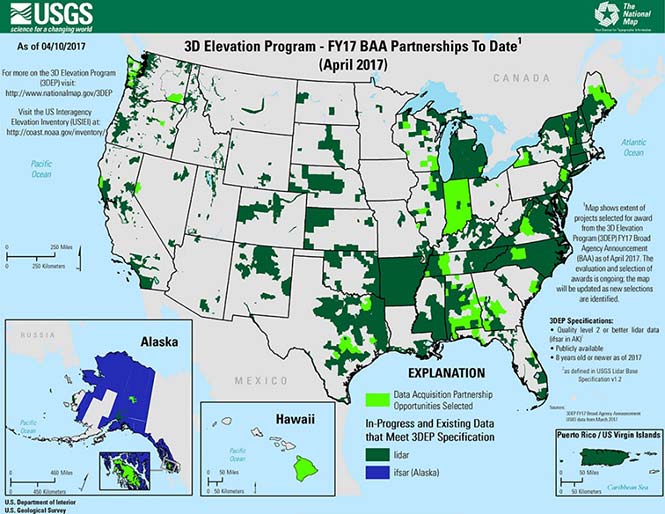
    While it currently does not have a single line item in any budget, the USGS Budget Summary lists its necessity in the Core Science Systems Program as part of the National Geospatial Program. This program is intended to provide high-quality topographic, geologic and hydrographic data nationwide to assist with further development of energy, transportation, drainage, emergency response and hazard mitigation.

    As part of the 2019 President’s Budget, the USGS Green Book also lists having the entire nation covered by an ongoing lidar program by 2033, along with completing a significant amount of data collection by various means in Alaska by 2022, including high-resolution interferometric synthetic aperture radar (IfSAR) necessary for data collection in more difficult terrain.

    The Green Book also lists high-resolution hydrographic data to support flood risk management studies, as the frequency of large scale flooding seems to be increasing substantially in more places than ever before. It also includes additional mapping data, programming and functionality for emergency personnel charged with oversight of public safety in times of crisis.

    FAA reauthorization

    The current FAA authorization bill expires on March 31. The biggest hang up holding up getting the bill reauthorized is privatization of the air traffic controllers, but there are rumors of tightening of UAV rules due to the rapidly growing use of the vehicles for business and personal use.

    Surveyors are working with federal and state officials to help implement reasonable rules for use and coverage of the UAV as the field of surveying has been drastically affected by use of aerial vehicles. Many tasks that used to take days now take hours with increase accuracy, so the effects of the UAV will be seen for many years to come.

    Digital Coast Act

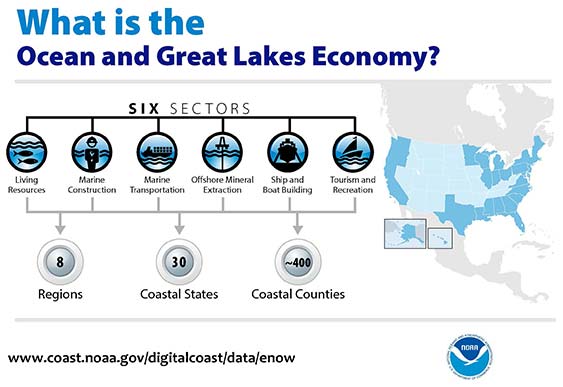
    One of the legislative acts that NSPS was a big part of in 2017 was Senate Bill 110, “The Digital Coast Act” which led to the introduction of the companion bill in the House as H.R. 4062. This Act will allow NOAA to perform the necessary actions to actively and effectively monitor all coasts (including the Great Lakes) by various means, including bathymetric and conventional survey methods. This will require services to be performed by public and private surveyors primarily with GNSS capability to provide NOAA with standardized information based upon established datum.

    FLAIR Act

    The Federal Land Asset Inventory Reform (FLAIR) Act of 2017 was introduced as House Resolution 2199 to help with creating a database of government property nationwide. The Government Accountability Office (GAO) has stated that the management of federal real property has become a “high-risk” item on its list of duties. Management of the number and value of properties has increased to a point that an overall dollar amount of federal buildings and land cannot be accurately determined.

    How does the surveyor fit in with this issue? Simple. The U.S. government will need to upgrade its database of existing facilities through having them surveyed for asset management. Part of the requirements for providing these surveys will be completing the work in datums that will be following the geographical databases being designed to contain the parcel and building information. All this data will have geospatial information regarding parcel, address, utilities and functionality of the inventory, so providing the data with the sufficient attributes will become a key role for the surveyor. GNSS data collection will be at the heart of this monumental task.

    Geospatial Data Act

    As introduced in May 2017, the Geospatial Data Act (GDA) of 2017 is intended to jumpstart the nationwide initiative to develop and coordinate efforts to collect and maintain new datasets of elevation and infrastructure information. It is intended to improve and enhance federal geospatial activities to encourage state and local agencies to participate at the local level.

    It is interesting to note, however, that the revised Geospatial Data Act was introduced by the same sponsors that did not include procurement procedures that follow the typical Brooks Act of quality-based selection, and instead relied on bid-based selection commonly found with suppliers. Both bills are being vetted by their sponsors and potential geospatial providers for clarity with ongoing debate going forward.

    Hydrographic Services Improvement Act

    H.R. 211 bring us the Hydrographic Services Improvement Act to provide NOAA with incentive and funding to standardize surveys desperately needed in waterway areas. Ongoing discussion continues this spring to determine sources of funding and priority of projects.

    Infrastructure bill

    February brought us the introduction of a significant infrastructure program aimed at improving roads, airports and bridges, with other major improvements across the country. This program is noteworthy in recognizing the need of current geospatial data and inventory of major infrastructure needs. The program sets forth the need for surveying, mapping and geospatial data for planning, design, construction, operations and maintenance for a multitude of projects nationwide. Much more will be discussed regarding the funding and priority of projects as the political year moves on.
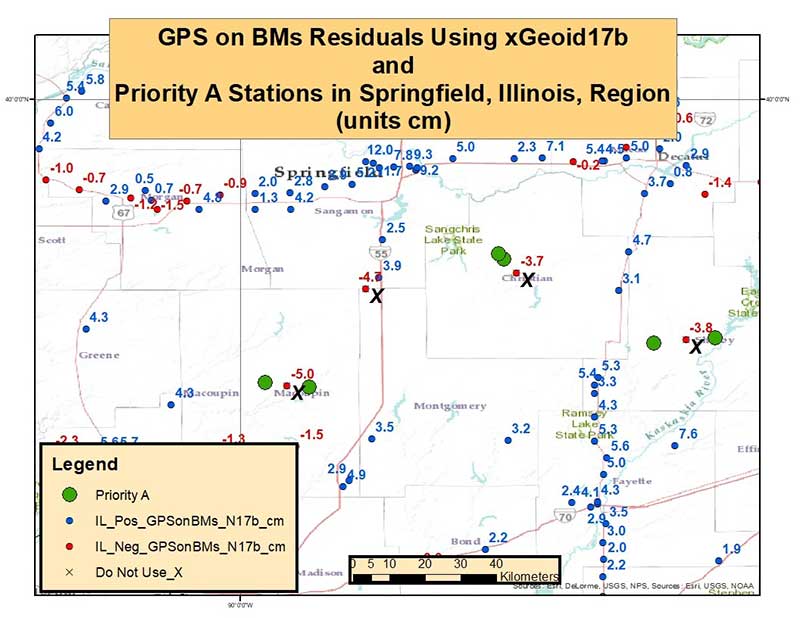
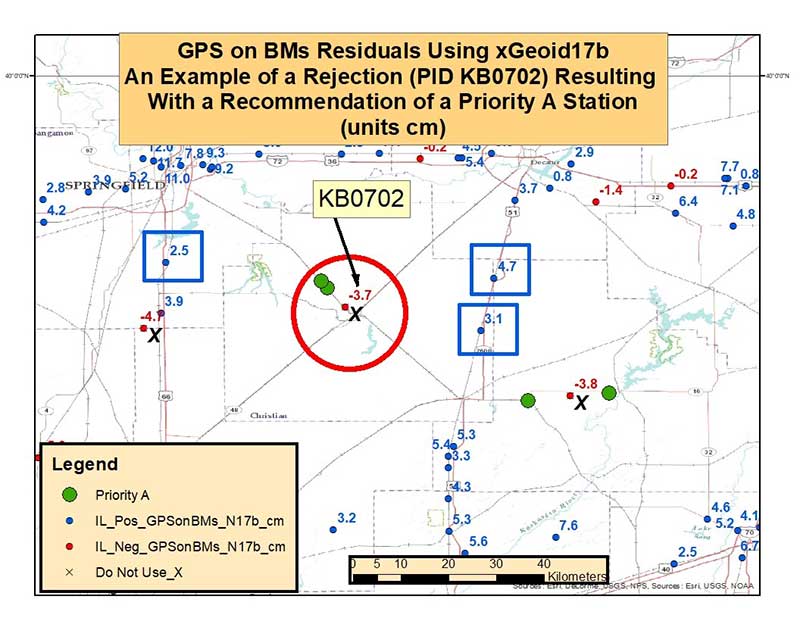
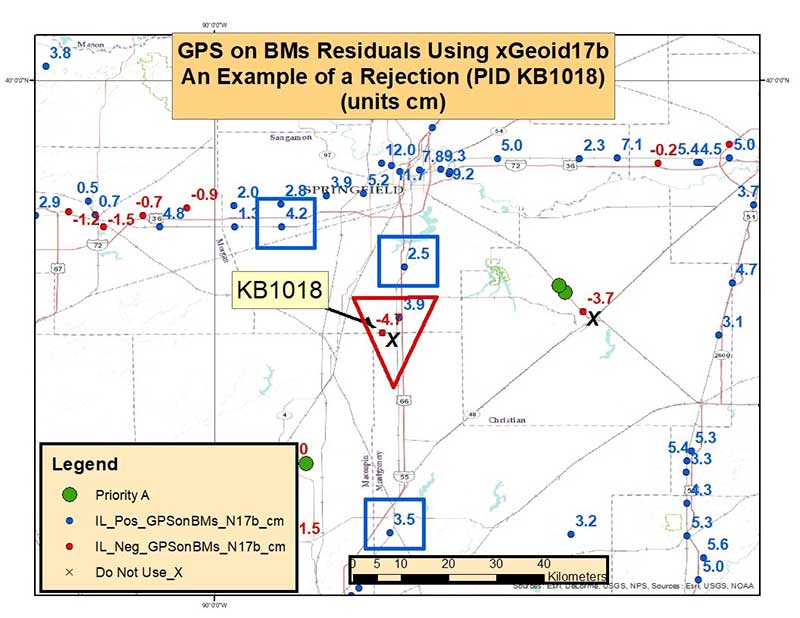
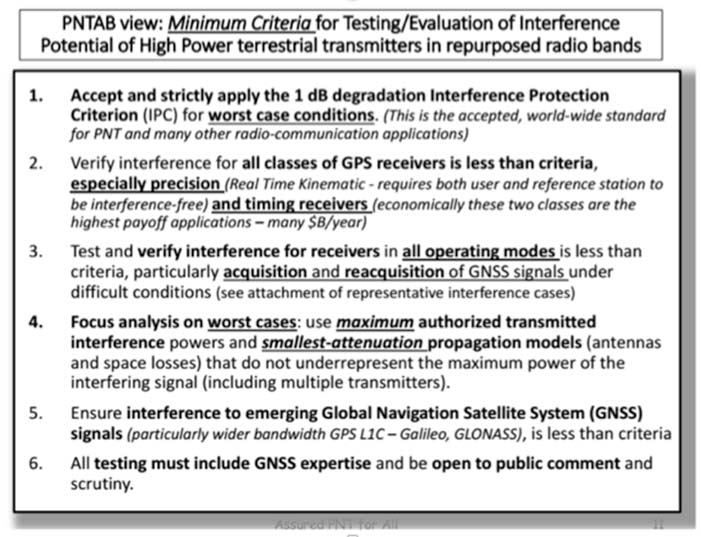
    LightSquared/Ligado

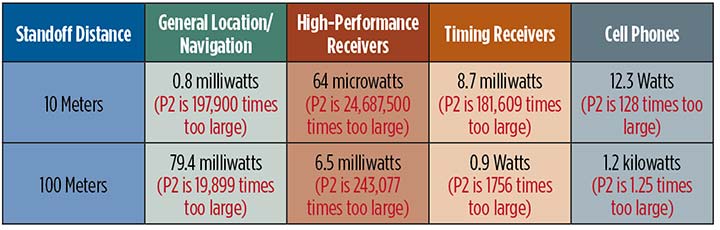
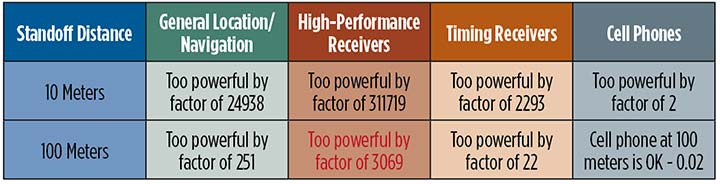
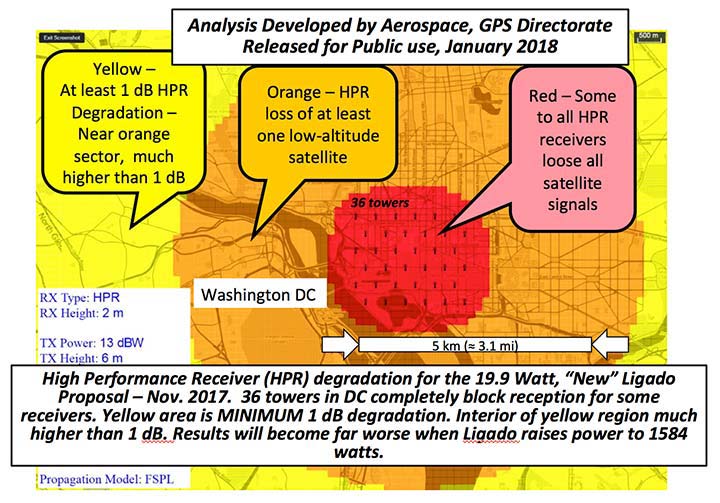
    Readers may remember when the original confrontation with LightSquared began in 2011, and the subsequent battle over the frequency ranges adjacent to the GPS bandwidth. The FCC gave LightSquared initial but conditional approval to move forward with terrestrial-based transmission for 4G cellular transmission for up to 40,000 land-based stations. Testing by private and governmental agencies through 2011 and 2012 proved that LightSquared would greatly harm GPS activity for both public and private use. Once exposed, the conditional FCC approval was rescinded and LightSquared retreated into the shadows…until now.

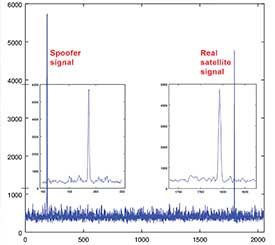
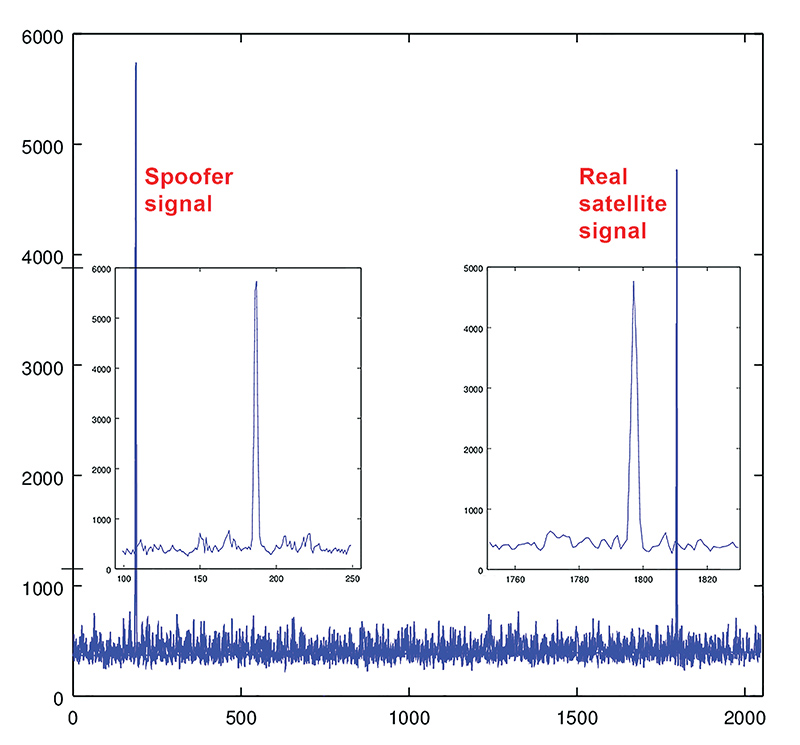
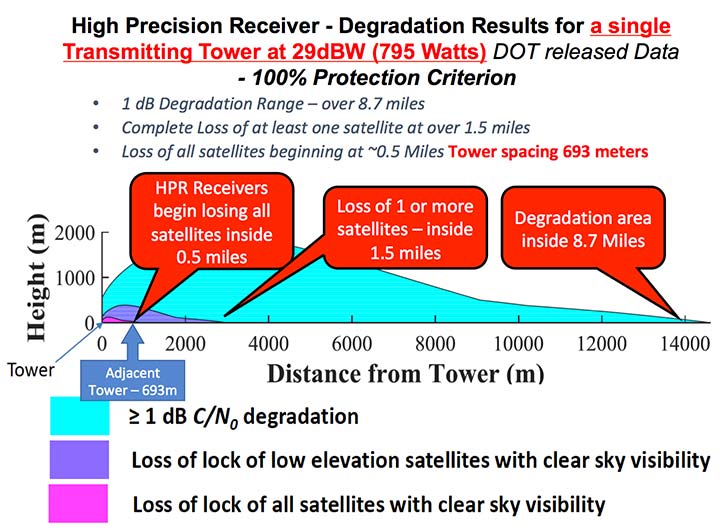
    Reformed as Ligado, it has fresh investors and is making a charge into 5G technology with a revised game plan. While it is also looking to use other spectrums for communication, it once again is dangerously close to other current uses. Couple the proximity of adjacent bandwidth with the intense land-based signal versus a very weak satellite signal, there will be significant overriding by the new user. All of this is still being worked out through the FCC and the Department of Defense, so final resolution is yet to be seen.

    IMAGES Act

    The National Flood Insurance Program (NFIP), as part of FEMA, is looking to move forward with legislation introduced as Improvement of Mapping, Addresses, Geography, Elevations and Structures (IMAGES) Act (H.R 4905). This act intends to reform the NFIP program by utilizing new elevation data collected through the 3DEP program, which will be combined with other parcel attributes including addresses and structure types. This data will then be combined with refined floodway information to identify parcels that are more susceptible to damage caused by storms and flooding.

    New legislation can be a good thing, but only if funding can be provided. This bill could provide a major upgrade to the flood mapping and insurance program, but it will hit a big snag with lack of monetary support. The proposed funding for FY2019 is $100 million, yet the project costs for the FY2018 budget is $178 million. This significant difference will make a large impact on the effectiveness of the program and proposed revamp.

    Railroad reauthorization

    NSPS has spent several years working with various legislators trying to find the right bill to insert language to require railroads to monument their routes before removing tracks. But with the recent accidents of various rail lines, the spotlight has been put on various factors that cause the incidents and how to eliminate their occurrence.

    Positive train control (PTC) systems incorporate geospatial data collected through GNSS, lidar and conventional surveying means to work with operational systems to assess dangerous situations. Surveyors will need to be at the forefront of the necessary data collection so our efforts to continue lobbying for railroad funding will continue.

    Net Neutrality Act

    A political hot topic the surveyor doesn’t typically think about is net neutrality. Most people think they will be affected by lack of neutrality slowing down their home internet or streaming service, but for surveyors it will be a much bigger deal.

    A remarkable number of surveyors and mappers use cellular data streaming to provide a connection to a positional correction service. The throttling of this data will effectively slow down the performance and quality of the positional data, leading to less reliability and productivity. It will also slow down the data interaction of office and field staff exchanging data and image files critical to project productivity and success.

    So, when the call goes out to contact your federal representative to protect net neutrality, remember how it will affect your surveying business model and make that call.

    How professional land surveying associations get it done

    Many thanks to the countless hours put in by the NSPS Joint Government Affairs team, consisting of Committee Chair Pat Smith, NSPS Government Consultant John Palatiello, NSPS Federal Lobbyist John “JB” Byrd and NSPS Executive Director Curt Sumner. This group is constantly monitoring legislative action across the country as well as in D.C. and is quick to respond when action is needed on legislative issues. They do a tremendous job, yet not many see them in action. Hopefully all surveyors will continue to see and feel the benefits of their results.

    As simple as the process is, the political world has gotten much more complicated as time marches on. From local municipal offices to Washington, D.C., getting things done through legislation has become a long process that takes patience and plenty of money to get your voice heard. Surveyors are no different than any other profession in that we must stay out in front of issues that affect our physical and business world. The important part is to stay informed and have a voice.

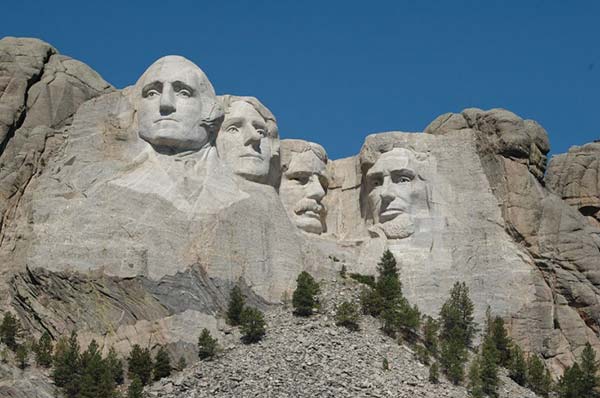
    Let’s also remember those three fine individuals, memorialized on Mount Rushmore, who accomplished great things after their stints as  surveyors, so anything is possible if we keep our voice in government.

    Surveying has evolved into a highly technical professional with GNSS as a backbone method of data collection. With the U.S. government at the center of that technology, we need to make sure we, as the surveying practitioner, stays engaged.


    Featured photo: National Park Service

  • Expert Opinions: How to select the right GNSS antenna

    Q: What are the key criteria in selecting a GNSS antenna for a particular application?

    Jerry Freestone, Chief Engineer, Antennas and Anti-Jam, NovAtel

    A: Performance, size and cost. Size and cost are easy for the integrator to assess; determining the necessary antenna performance to achieve the desired system-level performance is difficult to evaluate. Obtaining the complete GNSS solution from a single source is ideal; vendors that sell both antennas and receivers will generally understand the minimum system-level performance their solutions can provide for a given application and deliver the optimized solution to meet all three criteria.


    Brandon Oakes, Director, North American Sales and Marketing, OriginGPS

    A: Antenna selection for GNSS applications must consider performance, size and cost. Successful GNSS deployments start with the antenna selection in mind rather than waiting until the end and letting other design constraints drive the antenna selection. Patch antennas are always our preferred solution due to polarization, robustness and our patented integration method that minimizes bandwidth shift. Chip antennas are attractive due to their size, but consideration must be paid to ground-plane size and detuning.

  • Signals of opportunity: Holy Grail or a waste of time?

    The military is always looking at new techniques and technology for deriving position and, it seems, every few years signals of opportunity (SOOP) becomes fashionable again.

    In broad terms, SOOP refers to the use of any signals for navigation, which are not normally intended for navigation. This might mean TV or radio broadcast signals, cellular network signals, or anything else you can receive.

    Figure 1. Navigating using opportunistic signals, such as phone, TV and radio transmissions. (Image: Michael Jones)

    The promise of SOOP

    In the quest for resilient positioning and navigation, SOOP certainly sounds attractive. When GPS goes down, why not simply continue to navigate by receiving digital TV signals instead? Why not receive a whole pile of different signals, and make yourself virtually immune to jamming?

    You can even turn jamming from a problem to a solution. If someone does decide to turn on a bunch of jammers, why not use the jammers themselves as signals of opportunity, and position yourself using those? With so many possibilities, it’s no wonder SOOP excites people. Certainly it’s of great interest to the military of many countries.

    Let’s dip our toes into the world of opportunistic navigation.

    What signals might we use?

    The figure below shows what we get if you use a spectrum analyzer to quickly sample what’s on the airwaves in the UK, in this case looking fairly coarsely from 10 MHz to 3 GHz. A number of candidate signals immediately present themselves, which are labeled 1 to 11 and identified in the table.

    Figure 2. Plenty of opportunistic signals are out there. (Image: Michael Jones)

    There are, of course, many more signals-of-opportunity out there, but this illustrates a few of the more visible ones. How do we go about using these signals for positioning ourselves?

    Bringing in defense techniques

    For decades, one of the principle requirements in electronic warfare (EW) has been to geolocate enemy transmissions. This has given rise to a plethora of techniques for determining location, such as received signal strength (RSS), angle-of-arrival (AOA), time-of-arrival (TOA), time difference of arrival (TDOA), frequency difference of arrival (FDOA), and so on.

    In a positioning application, we have the reciprocal problem: instead of trying to geolocate a transmitter relative to ourselves, we are trying to geolocate ourselves relative to a set of transmitters. But of course we use the same techniques: GPS is an excellent example of a TOA system.

    Let’s look at the basics of TDOA. A signal s arriving at location 1 can be expressed as

    where A1 is an amplitude scaling to account for attenuation over the path, n1 is additional noise, and d1 is the signal delay time. We can repeat the equation for further locations:

    Usually we designate one location as the reference, in which case we can rewrite the above equations as:

    The first problem is to determine D, the time difference of arrival. There are many ways to do this, but a popular method is to perform generalized cross-correlation:

    Or, in a realizable digital form:

    Finding the peak of this function gives us our estimate of the time difference D. It’s a little bit more involved in practice, as we would normally apply filtering functions to improve the TDOA resolution, but you get the idea. Each TDOA measurement gives a set of possible locations that form a hyperboloid. With three stations, we will have two hyperboloids, the intersection of which gives a set of possible locations along a hyperbola. The addition of a fourth signal allows us to plot three hyperboloids, from which we can then determine position.

    Figure 3. Positioning using TDOA involves solving for the intersection of hyperboloids. (Image: Michael Jones)

    There are various ways to solve for the hyperbolic intersections. With only four measurements it is possible to compute the solution analytically, but with many measurements an iterative approach or minimum mean squared error technique is often used.

    TDOA, when used properly, can form the basis of a highly accurate positioning system. A number of navigation systems utilize TDOA technology, such as LORAN and its variants.

    Now let’s consider angle-of-arrival. AOA techniques generally make use of an antenna array to provide spatial diversity, allowing the direction of a source transmission to be determined. Measured angles to multiple transmitters then allows triangulation to be performed and the position computed. There are some advantages to AOA techniques, when compared to TDOA: position can be computed with as few as three signals, there is no requirement for time synchronization in any form, and narrowband signals can be used without loss of accuracy. Disadvantages include larger physical size due to the use of an array of antennas, and potentially more susceptible to environmental effects such as multipath.

    Classical AOA methods include Capon’s method, but since the 1980s the preferred techniques have often been signal subspace methods such as Multiple Signal Classification (MUSIC), Estimation of Signal Parameters by Rotational Invariance Techniques (ESPRIT), and variants of these techniques. The most well known of the subspace methods, MUSIC, performs an eigendecomposition of the sample covariance matrix given by:

    Once the signal and noise eigenvectors have been separated the array manifold is projected into the appropriate subspace to yield the MUSIC surface:

    The peaks of the function P, give us the direction-of-arrival of any signals. From these multiple lines of bearing we can perform triangulation, and derive our position.

    We’ve looked at TDOA and AOA methods, which are just two of many techniques that can be used to process signals-of-opportunity to derive position. But there are some perceived drawbacks to navigation by SOOP. By definition, SOOP makes use of transmitters that are uncooperative, and not generally designed with navigation in mind.

    For TDOA you are dependent on signals that are transmitted synchronously (or else you need a separate source of reference), which may or may not be the case. You also need to know the locations of the various transmitters, for example the coordinates of any GSM base stations, digital TV transmitters, and so on. It may be difficult to obtain this information, especially in some parts of the world. But whilst it certainly helps to have this information, it isn’t entirely necessary. It is possible to both position yourself, and build up a map of the transmitter locations, without a-priori information.

    SLAM

    Simultaneous localization and mapping (SLAM) is a field popular in the autonomous vehicle and robotics communities. It’s often described as a machine-learning concept, which aims to solve the problem of positioning oneself within a map, whilst simultaneously constructing and updating that map. There are a pile of techniques and algorithms that have been applied to the problem, including the good old Kalman filter, and the particle filter.

    In basic SLAM, you use a state vector to store an estimate of your position (and often orientation as well), just as you would in a typical GPS receiver. However, in SLAM, we also store estimates of the transmitter positions (called “features” in SLAM terminology). If we want to localize ourselves in a global coordinate frame it does mean we need an initial estimate of our position from some other means, like GPS. Otherwise we can only localize ourselves within the map we are generating.

    From our initial position estimate, we then move in some way. We then estimate our position again, perhaps using some form of dead reckoning technique, like inertial or visual odometry. Together with our motion model, this forms the prediction phase of the Kalman filter. We perform the measurement phase by re-measuring any features (our transmitters of opportunity), along with any new ones.

    Figure 4. Basic SLAM concept: simultaneously estimate the locations of both the vehicle and the transmitters of opportunity. (Image: Michael Jones)

    If you know about Kalman filters, you might spot one of the problems with SLAM: As the number of features increases, the size of the state vector becomes larger, until you end up with huge matrices that are very time-consuming to solve. The solution time is a quadratic function of the number of state variables. For this reason, it is often necessary to constrain the problem in some way: perhaps by limiting the number of transmitters we keep track of.

    But when done properly, SLAM is a powerful technique for signals-of-opportunity navigation.

    Is SOOP worth it?

    We’ve seen that, by using a variety of techniques, almost any radio signal can be used for opportunistic navigation purposes.

    One disadvantage of SOOP is that it can require complex hardware to do it well. If you truly want to use all the opportunistic signals out there, then you need a receiver that can handle a very wide range of frequencies. You also need an antenna or set of antennas that can do the same.

    When resilient PNT is a critical military requirement, you cannot afford to rely on signals that you don’t control. SOOP is also highly dependent on where you are. There aren’t many opportunistic signals at sea or in the desert, compared to in the urban environment (perhaps the odd satellite signal, or HF signal).

    So SOOP is unlikely to become a primary technology for the military. But it does have the potential to be a powerful augmentation to GNSS, and it certainly deserves a place in the PNT kit bag.


    Figures: Michael Jones

  • 5G, cellular’s next step, brings new positioning capabilities

    This comment piqued my ears when heard over the coffee-break table at ION’s International Technical Meeting last month: “There is a great deal of mutual ignorance between the 5G and PNT communities. I think that the 5G people are pretty naive about PNT and the PNT community is missing an opportunity.”

    So when news releases leading up to next week’s Mobile World Congress — several of them mentioning 5G in rosy terms, “catalyst for a better future” typical among these — started flooding my inbox this morning, it seemed an opportune time to investigate. Pardon my top-slice view; I’m not well-versed enough in the technology to discourse knowledgeably, but here’s quick round-up of salient points related to positioning in the fast-oncoming Next Step in cellular communications.


    Regular contributing editor for Professional OEM and UAV Tony Murfin will return to this space next month, with a column previewing the massive AUVSI Xponential show in Denver, April 30–May 3.  He’ll be there, too, covering the event!


    The cellular 5G standard has been designed to target latencies under one millisecond, data rates of up to ten gigabits per second, extremely high network reliability, and better accuracy in positioning. With location awareness becoming an essential feature of many new markets, positioning is consequently considered as an integral part of the system design of upcoming 5G mobile networks.

    Its feet firmly planted in both the present and the future, the cellular industry is currently in the midst of implementation of Long Term Evolution (LTE)-Advanced, an evolution of what might be called plain old LTE, and a “true 4G” mobile broadband. Simultaneously, the industry is preparing the next step, as “there is a vastly increased need for a new mobile communications system with even further enhanced capabilities, namely a fifth generation (5G) system.” 5G will process communication 10 times faster than 4G, according to experts. That’s enough to download a 3D movie in 30 seconds. It would take six minutes on 4G.

    Pyeongchang

    Alert techie viewers of the present ongoing Olympics in South Korea may have noted 5G in action there, in demos of such things as live-streaming virtual reality of bobsled and luge runs, putting the viewer in the breathtaking driver’s seat, and a test drive earlier this month from Seoul to Pyeongchang, a journey of several hours, without any human intervention whatsoever at the car’s controls. The demonstrations in Pyeongchang are laying down a backbone for what will be on show at the Tokyo Games in 2020, when 5G roll-out will be complete in many major metro areas.

    As trumpets sound the fanfare for next week’s Mobile World Congress in Barcelona, AT&T announced it will first roll out 5G to three locations: Dallas, Texas; Waco, Texas; and Atlanta, Georgia. The plans introduce the service to about a dozen U.S. markets by late this year. Qualcomm meanwhile is offering insight into its 5G chips.

    What has all this got to do with GNSS? Well, aside from the aforementioned precise positioning via cellular to be afforded by 5G, the two technologies share one prominent technique: adaptive array antennas for digital beam-forming. Here I am indebted to Gary McGraw of Rockwell Collins for a primer on the subject, which he presented at the International Technical Symposium on Navigation and Timing (ITSNT) in November 2016.

    Adaptive array technologies have many advantages for PNT: primarily, in mitigation for multipath and for jamming and spoofing mitigation. Adaptive antenna arrays  with digital beam-forming (DBF) are becoming increasingly important for PNT in challenging signal environments. DBF combines multiple antenna inputs to generate gain in arrival direction of the desired satellite signal and to create spatial nulls in direction of jamming.

    Langley Strikes Again — Early

    For some of the technical underpinnings to this technique, see the January 2017 Innovation column “Correlator beamforming for low-cost multipath mitigation” and the esteemed Prof. Langley’s February follow-up, “Mitigating interference with a dual-polarized antenna array in a real environment.”

    Emerging applications of DBF in 5G  involve dense networks of picocells, small cellular base stations typically covering a small indoor area. Picocells extend coverage where outdoor signals do not reach well, and add network capacity in areas with very dense phone usage. In this context, 5G cellular architectures will use adaptive array technology to achieve high data rates, spectrum reuse and communications robustness.

    The implications for PNT are that 5G system architectures will require improved (relative) PNT to operate effectively, and these 5G picocells will be a source of PNT information in constrained environments.

    5G involves massive directional communications via multiple-input multiple-output (MIMO), enabling high-bandwidth communications in fading (multipath) channels by using multiple antenna inputs to adapt to channel. It can do this without knowledge of user location, but it adds to the processing complexity. The directional capability can enable multiple users to be serviced in a picocell at different frequencies, while permitting spectrum re-use by nearby picocells through narrow beam-width and the limited range of millimeter-wave frequencies.

    The PNT implications of 5G architectures, according to Gary McGraw of Rockwell, are, principally, that efficient operation of directional links will require some level of knowledge of user location with regard to picocells. Picocells will need to have the ability to do direction-of-arrival positioning and ranging in order to maintain connectivity with user nodes. This can be exploited by the user node for positioning and location-based services, particularly for indoor and dense urban environments. Meanwhile, the proliferation of adaptive array technology will drive down costs for other applications. Further, millimeter-wave transmit/receive modules will become commodity items, analogous to what cell phones have done for GPS chips.

    McGraw’s Summary

    5G picocells will be synergistic with PNT in challenged environments — naturally, indoor and dense urban. They will necessitate development of distributed, networked PNT processing and infrastructure. Availability of adaptive array technology will increase with deployment of 5G, and costs can be expected to drop dramatically. In addition to GNSS, adaptive array technologies can be employed to support short-range, relative PNT applications such as vehicle-to-vehicle communications and relative positioning.

    Driving the Bus

    The key driver for all this is that customers, the global We, expect the same quality of experience from Internet applications anytime, anywhere, and through any means of connectivity. The rapid proliferation of smartphones and other mobile devices that support a wide range of applications and services mean that image transfer and video-streaming, as well as more cloud-based services, such as cloud speech services, have become the new norm. Their requirement for massively more data than, say, simple texting is conveniently hidden from or forgotten by users.  We want it.  We want it now.

    From a DOCOMO 5G White Paper: 5G Radio Access: Requirements, Concept and Technologies. NTT DOCOMO, INC., July 2014. At https://www.nttdocomo.co.jp/english/binary/pdf/corporate/technology/whitepaper_5g/DOCOMO_5G_White_Paper.pdf.

    Tomorrow, or perhaps the next day, everything will be connected by wireless to enable monitoring and collection of information and control of devices. Thus, remote monitoring and real-time control of nearly all electronic devices in machine-to-machine (M2M) services and Internet of things (IoT): connected cars, connected homes, moving robots and sensors. Such services will become more extensive and enriched through richer content delivered in real-time. Get set for the tactile Internet, augmented reality, and other brave new wonders.

    Fraunhofer Enters the Fray

    The 5G positioning framework will thereby integrate a multitude of sensors based on both, cellular signals and 3GPP independent techniques, into a hybrid positioning scheme, according to the Fraunhofer Institute for Integrated Circuits (IIS) in Germany.  Fraunhofer IIS is currently prototyping low-latency and high-precision positioning systems for legacy LTE and future 5G New Radio (NR). Two selected industrial IoT live demonstrations can be seen at next week’s Mobile World Congress 2018.

    Respective positioning performance for 5G NR and other technologies in different environments. (Image: Fraunhofer IIS)

    5G NR enables positioning performance by providing high bandwidths for precise timing, new frequency bands at mm-wave, massive MIMO for accurate angle-of-arrival estimation and new architectural options that support positioning. Improved levels of accuracy, robustness and latency, not possible today, can soon be achieved, according to Institute. 5G provides fast and reliable access to moving objects, to achieve time-critical process control and optimization in industrial environments not possible with today’s cellular technology. As requirements vary according to the specific use cases, 5G NR will provide a flexible air interface allowing for scalable bandwidths, data rates, latencies, and positioning accuracy levels.

    High-Precision Positioning

    With location awareness becoming an essential feature of many new markets, positioning is an integral part of the system design of 5G mobile networks. Increased contextual awareness of goods, parts, machines and workers will enable new interaction and collaboration.

    High-precision positioning, in the view of Fraunhofer IIS. (Image: Fraunhofer IIS)

    Fraunhofer IIS is working on novel approaches for sub-meter accuracy to enable tracking of mobile devices in indoor and urban areas where GNSS is not sufficiently accurate nor available. Its 5G positioning framework integrate several sensors. The key benefits of 5G in this regard are high accuracy, reliability, mobility and coverage; low latency and low power; and scalability.

    The Institute offers the facilities of its Test and Application Center L.I.N.K. in Nuremberg, Germany. The test center includes a 3D positioning system capable, according to the organization, of reproducing, simulating and emulating all kinds of possible environments, using every common communication and positioning system commercially available.

  • A first look at the FleetUp Trace device for truckers

    FleetUp Trace is a ruggedized tablet designed for fleet drivers required to display Records of Duty Status (RODS) upon request instead of printing out hard copies with the new Electronic Logging Device (ELD) mandateTim provides thoughts on the product hardware, ease-of-use and various app features.

    Photo: FleetUp-Trace
    Photo: FleetUp-Trace

    By Tim Spence

    Sometimes, there is great anticipation when buying a new electronic gadget. The look, the feel and the flashy presentation is what many products on the market rely on to make their product the best. With ELDs though, drivers and fleets managers are thinking about these products a bit differently. Thoughts like:

    • Will this satisfy our need for compliance?
    • How much training will this take?
    • How many drivers am I going to lose?
    • Is this even going to work?

    When powering up the FleetUp Trace tablet for the first time and opening the Hours of Service (HOS) app, it was evident that a lot of thought went into fulfilling these needs. Here is a first look at FleetUp Trace, a ruggedized tablet designed for fleet drivers required to display Records of Duty Status (RODS), as part of the FMCSA ELD mandate.

    Unboxing

    When removing the FleetUp Trace case from the box, you will notice that it is quite unique and will not easily be lost among other items because of that. The case was durable and tough but soft as well. When unzipped it revealed the Android tablet, a couple of short manuals and various accessories for charging and memory.

    The Tablet

    Safety orange is the key color with this tablet and since it is a popular color in our industry, it definitely catches the eye. In addition, the protective case fits the tablet so well, it looks to be a part of the product (if you have ever purchased a tablet and tried to find a durable hard case that fits well, you know).
    Booting the tablet, a brilliant orange screen for FleetUp appears and then four preloaded apps on the home screen: FleetUp’s HOS app, FleetUp’s CamVue app, Camscanner (a very reliable document scanner) and a preset version of Teamviewer QuickSupport, which provides an ID and easy instructions to show the FleetUp screen to another device.

    HOS app tutorial

    Starting the app and logging in, the Voice Over HOS greets you by name, gives you the current date, tells your current duty status, how many hours you have left in the 70-hour cycle, and how many on-duty hours you have before you are required to take a break. It then tells you to select a vehicle. After selecting a vehicle and confirming, you are told to tap the HOS button.

    The app automatically uses a tutorial showing each feature. One button at a time, the app guides you to the next feature prompted by your action of pressing the “GOT IT” button. This tutorial is available on each section of the device and can be turned off on the main menu that slides over from the left. That is a great feature not only because you wouldn’t want to go through the tutorial EVERY SINGLE TIME but just in case you forget how to use a certain section, like driver vehicle inspection report (DVIR), you can manually slide open the main menu and turn it back on to REINFORCE YOUR LEARNING. After going through the tutorial for each section, you will find a lot of reasons (mainly regulatory) why this is valuable.

    Using the HOS app

    After going through the tutorial once, even if you have years of experience on paper logs, you will find that many of the basics of logging are easy to find or figure out. It is very comfortable operating without the Voice Over HOS or Tutorial features. On the “Status” tab, you can see your current status and log graph, as well as change your status and check your available hours. On the “LOGS” tab, you can fill out a pre-trip or post-trip inspection and edit your time (except for driving time, of course). This section also allows you to enter shipping document information, edit any equipment information and certify your logs by signing with your finger (no special pen needed).

    Features that make the difference

    Tutorial mode. While this feature may sound simplistic, it has the capability to answer a driver’s question with the flip of a switch. Just the fact that you can turn it on whenever you need to be reminded is so valuable. It is beneficial to know that this feature does work best in the portrait or vertical mode.

    Voice over HOS. This feature reminds you of the actions that many drivers forget. If you have ever used ELDs in the past as a driver or fleet manager, you understand. Along with the text prompts, it reminds the driver to do things such as certifying the log at the end of the day, sign the DVIR, release the vehicle, etc. All the voice and text prompts work hard to keep the driver in compliance. Even when you want to LOG OUT, the app asks you if you still need to complete unfinished actions.

    Easy-to-read availability. Many electronic logging devices make it very challenging to understand what hours are left for a driver. With FleetUp, there is no confusion at all because it is stated in text and graph.

    Big buttons to change status. No more calibrating screens or needing a stylus just to change your status. Just touch a big button with your finger, enter the note under the GPS-enabled address entry, and tap “Yes.” It is that easy.

    On top of everything else, FleetUp Trace and the HOS app are extremely user-friendly. This should be the key to it all because if the device and app are not user-friendly and easy to operate, there is no reason for it to exist.

    FleetUp has accomplished a great feat by making the transition to E-Logs painless and smooth while complying with a multitude of regulations. Whether you’re looking for a simple way to track internal records of duty status (RODS) or to ensure HOS compliance and DVIR with a simple, hands-free gadget, FleetUp is one provider that clearly committed a lot of thought into what drivers are going to go through on the road, and offers plenty of features for an all-encompassing solution to the ELD mandate.

    Tim Spence, creator of Apps4truckers, is an app consultant, writer and safety manager in Birmingham, Alabama.

  • Could we be entering the Autonomous Age?

    Rolls Royce is investing in autonomous shipping systems.

    We no longer live in the Nuclear Age. Did you notice? Use of the term faded away. We no longer define our lives by the existence of nuclear technology, though of course it’s still part our world.

    While the naming of “ages” is arbitrary, most people would say we’re currently in the Information Age. The last Great Age before the Information Age was the Industrial Age. We also experienced smaller “ages” such as the Space Age and the Atomic or Nuclear Age, but these didn’t impact our daily lives like the Industrial Age and Information Age have.

    Which led me to wonder, what’s next? There’s a good chance we will find ourselves in the Autonomous Age, a daily experience of interacting with machines, robots and drones accomplishing tasks formerly done by people — including ourselves. We already use industrial robots; this trend will continue into new, more personal areas.

    Inside our Smart Cities, we’ll wake up in a talking house built by autonomous construction machines, eat breakfast food that arrived via autonomous shipping and then delivered by drones, and travel to work via autonomous vehicles.

    Artificial intelligence, augmented reality and autonomous vehicles will be woven into the tapestry of our daily lives. Overarching infrastructures and architectures will coordinate all the diverse autonomous and intelligent devices that we use.

    “Artificial intelligence is sweeping across industries, and its next frontier is autonomous intelligent machines,” NVIDIA founder and CEO Jensen Huang said, speaking at GTC Japan in December. “Future machines will perceive their surroundings and be continuously alert, helping operators work more efficiently and safely.”

    Hang onto your hats — we’re just getting started.

  • Expert Opinions: Challenges faced by multi-constellation GNSS receiver designers

    Expert Opinions: Challenges faced by multi-constellation GNSS receiver designers

    Javad Ashjaee
    President and CEO,
    Javad GNSS

    Q: What is the biggest challenge facing designers of multi-constellation GNSS receivers today?

    Javad Ashjaee, founder of Javad GNSS: The biggest challenge now is spoofing.

    Some years ago the issue was jamming —the hot issue of LightSquared — that would hurt GNSS. To solve that problem we created the J-Shield and showed that J-Shield technology could protect against LightSquared and similar signals. We manufactured dozens of units that were successfully tested by several independent laboratories.

    Now GNSS faces the spoofing issue. Reports of Black Sea spoofing and other examples show the urgency of paying attention to this problem. When a spoofer is successful, both position and time are spoofed.

    A Nov. 3 CNN video report on this subject gives an example of how little people know about spoofing and about the work that has been done on this subject. The report claims that GNSS technology companies have not done much or spent money on this subject. Obviously the reporter doesn’t know what we have done, as I will report here.

    I’ll review the spoofing methods and how we counter them.

    Source: Javad GNSS
    Source: Javad GNSS

    Spoofers use three methods: One simple way is to broadcast GNSS-like signals that provide the wrong ranging information which, when used, creates wrong position and time solutions. Most probably this is the method that Prof. Todd Humphreys used to spoof the GNSS receiver on the $80 million yacht [“GNSS Lies, GNSS Truth,” November 2014 GPS World.] This method fools the GNSS receiver into ignoring the correlation peak of the real satellite signal and using the correlation peak of the spoofer signal. To deal with this type of spoofer we take advantage of the 864 tracking channels and over 130,000 fast acquisition channels of our TRIUMPH chip. We assign more than one channel to each satellite signal and we track all their peaks: The real peak and the spoofer’s peaks. Then in Step 1, below, we exclude all signals with more than one correlation peak.

    Method Two is broadcasting spoofed signals for satellites that are below the horizon in the spoofed area or for satellites that do not exist. In this case only one correlation peak exists. Our equipment and OEM boards can download valid and certified almanac data from our website to know the status of satellites and their visibility ahead of their mission. Almanac data can be used for several weeks.

    Method Three is to cover the signal of a visible satellite with noise and on top of the noise add the spoofer signal with more power. We recognize such spoofers by their unreasonable signal power and the background noise.
    In the first counter-spoofing step we ignore these signals:

    1. Those with more than one peak;
    2. Those that according to our almanac should not be visible;
    3. Those with unreasonably high or inconsistent signal-to-noise ratio (SNR);
    4. Systems whose satellites all have similar SNR.
    5. Satellites that do not generate complete multi-frequency signals (spoofers usually generate only C/A code).

    After removing all questionable signals, we use the remaining signals to compute our approximate position. We need at least 4 signals from the many available signals of GPS L1, L2P, L2C, L5, GLONASS L1, L2, L3, and the many signals of BeiDou, QZSS and IRNSS.

    In the second step we validate all questionable signals against the approximate position that we have calculated and keep only those that pass our validation. We then re-compute the more precise position using all good signals. We consistently throw away the spoofer correlation peak and use the real satellite signal.

    If all signals of all satellites are spoofed, then we warn the user to ignore the GNSS signals and use some other sensors (like compass and gyro) to get out of the spoofed area. A spoofer that can spoof all signals of all satellites will be very expensive to build and deploy.

    In a very difficult situation, the user can enter their approximate position to quickly understand if spoofers exist, and then identify them.

    All the counter-spoofing methods that I have discussed here are the subject of patents for which we have applied.

    Since currently most of spoofers spoof the L1 C/A code, we can simply initially ignore the C/A signals to compute the initial approximate position and use it to identify the spoofed signals.

    It is vital that in areas that spoofing danger exists, users employ OEM boards that provide more satellite systems and more signals, rather than using a simple GPS C/A code, for example.

    Finally I would like to challenge Prof. Todd Humphreys [professor and director, Radionavigation Laboratory, University of Texas-Austin] to spoof any of our receivers that have this anti-spoofing option. We offer this as an option on all of our OEM boards.

  • NGS 2018 GPS on BMs program in support of NAPGD2022 — Part 5

    NGS 2018 GPS on BMs program in support of NAPGD2022 — Part 5

    My last column highlighted two components of the North American-Pacific Vertical Datum of 2022 (NAPGD2022) — the geoid undulation model of GEOID2022 and gravity model of GRAV2022. It expressed that these two models will be very important to future surveyors and mappers that are incorporating geodetic data into NAPGD2022. The last column also emphasized the significant differences between NAPGD2022 and the U.S. National Vertical Datums of NAVD 88 and NGVD 29. A year ago, my February 2017 column provided information on strategically occupying benchmarks to support NGS 2017 GPS on BM Program. The column focused on addressing the following questions: (1) Is the large GPS on BM residual due to an issue with the NAVD 88 orthometric height or the NAD 83 (2011) ellipsoid height? and (2) Should stations with large GMS on BM residuals be included in the development of NGS’ hybrid geoid models? The column provided suggestions on how users can assist NGS in determining the reason for the large difference between the modeled hybrid geoid value and computed GNSS/leveling geoid computed value. My October 2016 column demonstrated how to use the GPS on BMs dataset to identify potential issues in published NAVD 88 and NAD 83 (2011) heights. It focused on analyzing the NGS’ GPS on BM data set that was used to create NGS’ GEOID12B hybrid geoid model. It provided procedures that users could employ when analyzing the differences between the modeled geoid values and the computed geoid values using GNSS/Leveling data (GNSS-derived ellipsoid height minus leveling-derived orthometric height). The October 2016 column provided several examples of large relative differences in residuals between neighboring stations.

    It should be noted that many of these large GPS on BM residuals could be due to an invalid NAVD 88 published height because the bench mark moved since the last time the height of the bench mark was adjusted and published, and/or an undetected error in an ellipsoid height due to a weak GNSS project design. Either way, in my opinion, most of these stations with large GPS on BMs residuals don’t accurately represent a bench mark with a current NAVD 88 height (or what I call a valid NAVD 88 height). When performing a geodetic survey, these stations would be identified as bench marks with invalid heights when following the appropriate Federal geodetic survey guidelines, procedures, and specifications. These bench marks should not be used in the hybrid geoid model just like they would not be used in controlling geodetic surveys. NGS’ goal is to create a hybrid geoid model that is consistent with published valid NAVD 88 values. User participation in NGS’ GPS on BMs Program is critical to creating a hybrid geoid model consistent with a current NAVD 88.

    Recently, NGS performed a detailed analysis of the latest GPS on BMs data file using the published NAD83 (2011) ellipsoid heights, NAVD 88 orthometric heights, and the latest experimental geoid model height, xGeoid17b, to compute a new set of GPS on BMs residuals. At this time, the analysis has only included the 48 conterminous States, District of Columbia, Puerto Rico, and Virgin Islands. These data included NAD 83 (2011) ellipsoid heights from all submitted GNSS projects and OPUS Shared results. The goal of the detailed analysis was to create a statistical ranking of the marks based on a quantitative analysis of the leveling and GPS data. The following attributes were considered during the analysis:

    • Total number of GPS observations to and from the station
    • Date of last GPS observation to and from the station
    • Whether or not the GPS station has repeat baselines between closely spaced neighboring GPS on BMs stations
    • Total number of times the mark has been leveled to
    • Date of latest leveling
    • Quality of leveling (single run; double run; or single run, double simultaneous)

    The analysis of this data set was used to identify stations that should not be used in the creation of a hybrid geoid model or a NAPGD2022 Transformation tool. The stations identified as outliers and labeled as “Do Not Use” in a hybrid geoid model were based on issues associated with the NAVD 88 published orthometric height and/or the NAD83 (2011) ellipsoid height. I have described some of these issues in previous columns (August 2015 column, June 2016 column, October 2016 column and February 2017 column) so I won’t go into details in this column. NGS used the detailed analysis of the latest GPS on BMs dataset to: (1) generate a prototype hybrid geoid model to evaluate the residuals at stations not used in the hybrid geoid model, (2) confirm that the stations recommended for re-observations should be observed again, and (3) identify void areas that need additional observations.

    Since GEOID12B was created, users have been instrumental in providing OPUS results on bench marks in areas NGS said that they needed additional stations. Saying that, NGS realizes that everyone is busy and has limited resources to collect GNSS data on bench marks to support the next hybrid geoid model. NGS has used the detailed analysis to prepare material to assist users on strategically occupying stations to help support the GPS on Bench Marks Program, and create a hybrid geoid model that accurately represents a current NAVD 88. To eliminate confusion of where NGS would like new observations, NGS’ material contains a specific list of stations that they would like occupied with GNSS during the 2018 GPS on BMs program. This column provides a summary of the latest details of NGS’ 2018 GPS on BMs campaign which will be used to create the next hybrid geoid model in 2019 (see box titled “Personal Communication received from Galen Scott, Project Lead of NGS’ GPS in BM Program.”).


    Personal Communication received from Galen Scott, Project Lead of NGS’ GPS on BM Program

    In early 2019, NOAA’s National Geodetic Survey (NGS) will replace GEOID12B with GEOID18, a new hybrid geoid model to deliver improved GPS-derived NAVD 88-equivalent orthometric heights. This new model will serve as the official means for obtaining NAVD 88-equivalent heights via GPS. It will be the last hybrid geoid model that NGS will create before NAVD 88 is replaced by NAPGD2022.NGS will use available GPS on bench mark data to create the new model. Recent analysis of existing GPS on bench mark data and a prototype of the new hybrid geoid model created using that data has highlighted areas where additional data is needed to either confirm or update the local relationships between the ellipsoid, orthometric, and geoid heights.

    This email provides a prioritized list of bench marks for which additional GPS data is needed to improve the hybrid model. Data submitted on these marks will also support the development of the transformation tools that will be developed as part of the transition to the new datums.

    Data to support the hybrid geoid model will be accepted through August 31, 2018. NGS will continue to accept data to support the transformation tools through 2020. New prioritized lists of marks to support the transformation tools will be made available over the next few years as analysis of data requirements progresses.

    For the marks included in the attached document, NGS is requesting support in two ways:

    1. Attempt to locate the marks on the list and submit a mark recovery through DS World. Check this NGS page for more information on mark recovery.
    2. Collect 4 or more hours (more is better) of GNSS data on the mark following NGS guidelines, submit the data to OPUS and select the option to Share.

    More information, including training material, is available on the NGS GPS on Bench Marks (GPS on BM) website. Two matching, independent GPS observations are required for each mark. The list indicates how many observations we have so far on each mark (obs_cnt column). A tracking map showing the currently prioritized marks and the number of observations we have on each will be added to the GPS on BM website in the near future. To maximize efficiency, please check this map before observing a mark to ensure that the required data has not already been submitted.

    Please note: Marks on this list may be inaccessible, destroyed, or not GPS’able. If this is the case, please locate and observe another nearby NAVD 88 mark, within ~10 km.

    The mark list is provided in three file formats, but all contain the same information, so choose the format you are most comfortable with: excel spreadsheet, esri shapefile, and Google Earth kmz.

    The image below shows the changes between GEOID12B and the prototype hybrid geoid model. While data is needed on all the marks in the list, you may further focus your data collection efforts by looking for areas in this image that show large changes in your region.

    It is important for users to understand that NGS needs to have a high level of confidence that the OPUS Share results are accurate; therefore, they are requiring that “two matching, independent GPS observations are required for each mark.” The list of stations that they would like observed includes a count of the number of times that station has already been observed. NGS will be updating a website as stations are submitted so participants will not be wasting resources observing a station that has already been observed by someone else. It should be noted that if a station is only occupied once, it will still be useful for validating the hybrid geoid model; but stations occupied twice can be used in defining the hybrid geoid model.

    The attached file includes the list of stations that NGS would like observed to support the next geoid model. The information is provided in three different formats — excel spreadsheet, esri shapefile, and Google Earth kmz (See the box titled “List of Files for the 2018 GPS on BMs Program.”)


    List of Files for the 2018 GPS on BMs Program

    The data set also contains a folder titled “GEOID Model Changes by Region” which contains plots that depict changes between GEOID12B and the Prototype Hybrid Geoid Model (Note: at this time, NGS is denoting this prototype hybrid geoid model as GEOID18v2.2).


    List of Files from Folder Titled “GEOID Model Changes by Region”


    Figure 1 is a plot of the change between the prototype GEOID18v2.2 and GEOID12B in the Mid-Atlantic States. Looking at figure 1, the reader can see that there are some significant differences between the prototype hybrid geoid model values and the published GEOID12B values. On figure 1, all of the dark blue values are differences at the -10 cm level and the dark orange values are differences at the 10 cm level. There are several reasons for these changes including newly observed gravity data observations (especially in area with new GRAV-D data), improved data and models from satellites programs, new and improved algorithms for processing gravity data and estimating topographic effects, additional OPUS Share results in areas where GEOID12B didn’t have observations, and differences based on stations that were included in GEOID12B but rejected in the prototype model based on the latest detailed analysis.

    Figure 1 – Changes between Prototype GEOID18v2.2 and GEOID12B in the Mid-Atlantic States (units = meters).

    As previously mentioned, the list of stations that NGS would like observed with GNSS are provided in three formats: excel spreadsheet, esri shapefile, and Google Earth kmz. The box titled “Sample Data Elements Extracted from the Excel File Titled “gpsonbm_priority_list_20180205.xlsx” provides a sample of the data from the excel file. The box titled “Definition of Columns of GPS on BMs data file” provide the columns and a brief definition of the data field.

    Sample Data Elements Extracted from the Excel File Titled “gpsonbm_priority_list_20180205.xlsx”

    The priority column has two entries – A or B. Priority A is more important than priority B. In other words, if the user has to make a choice, NGS would like the priority A station observed first. The obs_cnt field will be updated as users submit their OPUS Shared results. Remember, NGS is requiring two matching, independent GPS observations for the station to be included in the development of the hybrid geoid and transformation tool.

    The near_pid provides the pid of the station that is near the original station. The selection of the near_pid was based on the original station’s position and a search of the NGS database for a station within 5 to 15 kilometers of the original station. NGS’ analysis indicated that the original GPS on BMs station may have moved so an additional observation on the same station will not help to generate a hybrid geoid model that represents the current NAVD 88. It would warp the geoid model to fit the published NAVD 88 height but if the station moved since it was last leveled to, then it does not have a valid NAVD 88 height. As previously stated, when performing a geodetic survey, these stations would be identified as bench marks with invalid heights when following the appropriate Federal geodetic survey guidelines, procedures, and specifications. The surveyor would then level to another bench mark until they met the survey’s specifications. These bench marks with invalid heights should not be used in the hybrid geoid model just like they would not be used in controlling geodetic surveys. If the near_pid column is “n-a” then NGS would like the original station observed.

    The box titled “Number of Priority Stations in Each State” provides the number of priority A and B stations for every State in the lower 48, the District of Columbia, Puerto Rico, and the Virgin Islands. Overall, there are 6082 stations in the list – 3544 Priority A stations and 2538 Priority B stations.

    Number of Priority Station in Each State

    As an example of a State in eastern United States, the box titled “List of PIDs of Priority “A” and “B” Stations in North Carolina” provides the list of priority A and B stations that need to be observed in North Carolina. The box titled “List of PIDs of Priority “A” Stations in North Carolina” provides the list of priority A stations in North Carolina. Figure 2, titled “NGS 2018 GPS on BMs Program, Priority A and B Stations in North Carolina,” depicts the locations of these stations. Figure 3 depicts the location and PID of the priority A stations in western North Carolina. Figure 4 depicts the same stations with their Obs_Cnt value.

    List of PIDs of Priority “A” and “B” Stations in North Carolina That Need to be Observed
    Information extracted from Excel File Titled “full_priority_list.csv”

    (Note: The stations in this table may not be the final list of priority A and B. The attached zip file contains the latest list of stations. The latest list was received too late to modify the table.)

    List of PIDs of Priority “A” Stations in North Carolina

    (Note: The stations in this table may not be the final list of priority A and B. The attached zip file contains the latest list of stations. The latest list was received too late to modify the table.)

    Figure 2 – NGS 2018 GPS on BMs Program – Priority A and B Stations in North Carolina.
    Figure 3 – NGS 2018 GPS on BMs Program – Priority A Stations in Western North Carolina With the PID of the Station.


    Figure 4 – NGS 2018 GPS on BMs Program – Priority A Stations in Western North Carolina With the Number of Observations.

    For completeness, I will provide an example of a region in the western United States – California and Nevada. They are larger States than North Carolina and have more Priority A stations that need to be observed. Figure 5 depicts the Priority A and B stations in California and Nevada, and figure 6 depicts the Priority A stations in California and Nevada. It is recognized by NGS that managing how these stations are observed and who does what is a monumental task. Some state agency may undertake observing all of the Priority A stations; for example, Gary Thompson, Chief of the North Carolina Geodetic Survey, has committed to observing all of the Priority A stations (personal communication). Other States have County and City surveyors that will help observe and manage the process. All of the information provided in the 2018 GPS on BMs allow individuals to sort the data in ways that meet their needs. For example, the box titled “List of Priority “A” Stations by County in California” provide the list of stations in California by county.

    Figure 5 – NGS 2018 GPS on BMs Program – Priority A and B Stations in California and Nevada.
    Figure 6 – NGS 2018 GPS on BMs Program – Priority A Stations in California and Nevada.

    It should be noted that NGS identified the priority stations based on hybrid geoid requirements. The NGS geoid team would desire a valid GPS on BMs observation every 30 km. Therefore, some of the priority A stations are in areas void of any GPS on BMs stations. There may be many reasons for this but, most likely, it’s because it’s located in an unpopulated or mountainous region of the county. Either way, it may be difficult to obtain observations at these stations. The new hybrid geoid model will be created using whatever data are available. In these void areas, the geoid will be controlled by the nearest GPS on BMs stations. There is nothing wrong with this approach. The only issue will be that it will not be possible to evaluate the relation of the hybrid geoid model and NAVD 88 in these void areas. Figure 7 depicts the priority A stations and the population of cities in Northwestern Nevada and Northeastern California. The figure indicates that these priority A stations are located in an unpopulated region of Nevada. It’s obvious why there’s no GPS on BMs in this region since nobody lives there but the geoid doesn’t depend on population. In any event, if the user can obtain an observation in these regions it will really help in creating an accurate hybrid geoid model.

    List of Priority “A” Stations by County in California

    (Note: The stations in this table may not be the final list of priority A and B. The attached zip file contains the latest list of stations. The latest list was received too late to modify the table.)


    NGS’ process for determining which stations were outliers and which stations should be re-observed involved analyzing both GNSS and leveling data from NGS’ database. The GPS on BMs residuals were computed using the procedure described in the box titled “Procedure for Computing the GPS on BMs Residuals.”

    Figure 7 – NGS 2018 GPS on BMs Program – Priority A Stations in California and Nevada. (Numbers are 2012 Population Values from Census – ESRI online)

    Figure 8 depicts the location of the GPS on BMs stations in Illinois. The box titled “Summary of Statistics for GPS on BMs Residuals in Illinois” provides a summary of the GPS on BMs residuals for the State of Illinois. The results indicate that there are 804 GPS on BMs in Illinois and the residuals range between -14.1 cm to 31.2 cm. They have a mean of 6.0 cm with a standard deviation of 4.6 cm. The table titled “Statistics for GPS on BMs Residuals in Illinois With Rejections Removed” indicates that most residuals fall between 2 and 10 cm. The box titled “Summary of Positive and Negative Statistics for GPS on BMs Residuals in Illinois” provides a summary of the statistics for the positive and negative set of residuals.

    Figure 8 – GPS on BMs Stations in the State of Illinois.

    Figure 9 depicts the GPS on BMs residuals in the Springfield, Illinois, Region. During the detailed analysis of the latest GPS on BMs dataset, the analysts identified outliers that appeared to be large relative to their neighbors. Figure 9 depicts these outliers with a “X.” Stations designated with a “X” are stations that were designated as DO NOT USE in the creation of the hybrid geoid model. Figure 9 also indicates were the analyst recommended that a station should be observed before the creation of the next hybrid geoid model. These stations are labeled as Priority A stations on figure 9. Figure 10 is an enlargement of the same area that depicts a station that was recommended to be rejected in the hybrid geoid model (PID KB0702). The stations surrounding PID KB0702 all seem to be consistent with each other (residuals in smaller blue squares) so the analyst recommended that station KB0702 be rejected. At the same time, by rejecting this station, this creates a void area that needs to be filled. Therefore, the analyst also recommended that a new station be observed here; hence, the two priority A station plotted near the rejected station. Figure 11 is a plot of another rejected station (KB1018) in the same region but, in this case, the analyst did not recommend an additional observation in the area because there was another nearby station (station in red triangle) that was consistent with its neighbors (residuals in smaller blue squares).

    Figure 9 – GPS on BMs Residuals Using xGeoid17b and Priority A Stations in Springfield, Illinois, Region (unit cm).
    Figure 10 – GPS on BMs Residuals Using xGeoid17b – An Example of a Rejection (PID KB0702) Resulting with a Recommendation of a Priority A Station (units cm).

    As previously mentioned, and provided in the box titled “Attributes Considered During Analysis,” several attributes were analyzed before making the recommendations but, typically, GPS on BMs residuals between +/- 5 cm were used to identify which stations needed to be investigated.

    Attributes Considered During Analysis

    ➢ Total number of GPS observations
    ➢ Date of last GPS observation
    ➢ Whether or not the GPS station has repeat baselines
    ➢ Total number of times the mark has been leveled to
    ➢ Date of latest leveling
    ➢ Quality of leveling

    Figure 11 – GPS on BMs Residuals Using xGeoid17b – An Example of a Rejection (PID KB1018) of an Outlier (units cm).

    This analysis is the first cut at identifying stations that should not be used in a hybrid geoid model and providing a list of specific stations that could help improve the hybrid geoid model. All new data received by the cut-off date of August 31, 2018, will be analyzed by NGS and, if appropriate, the results will be included in the next hybrid geoid model. This is a great opportunity to provide data that will help to improve the hybrid geoid model in your region. My next column will provide a status report on the 2018 GPS on BMs Program.

  • Ask an artificially intelligent question…

    There was plenty for a philosophy major to sink his teeth into at ION’s January workshop on Cognizant Autonomous Systems for Safety Critical Applications (CASSCA).

    What is knowledge? What is meaning? What is understanding? What is intelligence? What is learning? What is thinking?

    These questions excited Plato and Kant, Buddha and Descartes, perhaps out of intellectual or spiritual curiosity. Who’s to say? But the people asking them now are driven, quite literally, by practicalities. They have come to realize that we cannot ride in driverless cars or fly in pilotless plane-taxis, we cannot live in an autonomous, artificially intelligent environment without knowing a bit more exactly what knowledge is, in this brave new world.

    Without thinking about what thinking may be, for a machine.

    Why does this matter to a GPS/GNSS/PNT readership? Because as positioning and navigation engage more deeply with artificial intelligence (AI) generally, and with autonomy in particular, these issues emerge as part of the environment that such solutions explore, and in which they must verify and validate themselves.

    Welcome to the future, it’s yours. Now think about it.

    Culture Club. Some of us may have believed that only technical obstacles remain in the path of a driverless car and an otherwise automated society, salted with a few regulatory wrinkles to iron out. But as build-a-robot R&D projects transform into full commercial partnerships, cultural challenges jump up as well: inertia, instability of requirements, unanticipated expectations, magical thinking (the development of empathetic attitudes towards robots), misplaced trust and misplaced distrust. All this according to Signe Redfield, roboticist and mission manager at the U.S. Naval Research Laboratory.

    Joao Hespanha, professor of electrical and computer engineering at the University of California, Santa Barbara, outlined three key concepts for AI development: computation, perception and security. The critical questions for the first named are, how much computing will be done onboard the platform, how much learning will be done onboard, and how much of each process will be distributed to offboard computation. Perception, a crux for autonomy, is closely bound in a feedback loop with control. The platform must gather data to make autonomous decisions (control), and those decisions must maximize the gathering of information (perception).

    Amply consider security. All safety-critical systems must provide for — and prevent where possible — decisions based on compromised measurements, which may stem from system or environmnetal noise, sensor faults, hacked sensors, or other corruptions.

     Second Wave. We are in the second wave of AI, according to Steven Rogers, senior scientist for sensor fusion at the Air Force Research Laboratory. In the first wave, 60s and 70s, large and complex algorithms, relatively low on data, drove new developments — but they hit real-world problems, hard. Since the mid-80s, we have been in the “classify” stage with relatively simpler programs generating and consuming lots of data. Intense statistical learning will eventually lead to the third wave of AI: Explain.

    On a timeline yet to be determined, contextual adaptation will give rise to “explainable” AI, capable of answering unexpected queries. That is, it will have learned how to teach itself.

    Some of this stuff gets pretty scary.

    Most future knowledge will be machine-generated.

    Let’s run through that one more time.

    “Most future knowledge on Earth will come from machines extracting it from the environment,” said Rogers. “Machine generation of knowledge is key for autonomy.”

    Here’s where the thought processes really started to levitate. “Current sense-making solutions are not keeping pace, not growing as knowledge is growing,” Rogers asserted. And he challenged us with the questions posed at the beginning of this column: in AI, the context we will use to explore much of the future, what is knowledge? What is meaning? And so on.

    He gave us one of his answers: “Knowledge is what is used to generate the meaning of the observable for an autonomous system. Correspondingly, machine-generated knowledge is what is used to turn observables into machine-generated meaning.”

    Slide from Steven “Cap” Rogers’ presentation at CASSCA.


    He suggested a book by George Lakoff and Mark Johnson, Metaphors We Live By. Pretty heady stuff for a room full of engineers. I don’t know about you. I’m headed down to the library to check it out.

    Requirements, Simple/Not. We got back to earth with some technical challenges we could actually chew on with David Corman, program manager for Cyber-Physical Systems and Smart and Connected Communities at the National Science Foundation. Seemingly simple requirements for safety-critical applications break down into hundreds of requirements that no one has really thought about, Corman said, as he displayed a chart of “Some Example Research Problems.”

    Precision agriculture and environmental monitoring are two sectors where he thought autonomous operations come closest to being full realization, because their operational environments are structurally defined enough. In such constrained niches that we more fully understand, we can implement autonomous operations. Elsewhere, “we don’t know how to specify what we want, so that we get only ‘good results’ and no ‘bad results.’ ”

    He identified a looming Cambrian explosion in AI, analogous to that for plants and animas following the dinosaur extinction, in which systems interact, gather data, sense the environment, learn, improve and multiply. He suggested we browse “The Seven Deadly Sins of Predicting the Future of AI,” an essay by Rodney Brooks.

    The afternoon’s workshop talks followed, from experts in autonomous flight software, legal and insurance aspects of autonomy, the Ohio State University’s Center for Automotive Research, and the U.S. Department of Transportation. But I tell you, this morning done my brain in.

    Before folding up, I must mention a short video on autonomous flying taxis displayed by Paul DeBitetto, VP of software engineering at Top Flight Technologies. It depicts Pop.Up, a modular ground and air passenger vehicle for megacities of the future. Check it out.

    The CASSCA workshop was organized and moderated by Zak Kassas, an assistant professor at the University of California, Riverside and director of the Autonomous Systems Perception, Intelligence & Navigation (ASPIN) Laboratory. He is also co-author of two cover stories in GPS World, “LTE cellular steers UAV” and “Opportunity for Accuracy.”

    ION president John Raquet expressed the hope that we may see a fully fledged conference on this topic in the near future: CASSCA 2019, perhaps, to join the rotating repertory of ION annual meetings.

    Agreed. We need to think more.

    Don’t look back, the machines may be gaining on us.

  • Documentary sheds light on Hollywood star, inventor

    Documentary sheds light on Hollywood star, inventor

    With George Antheil, Hedy Lamarr invented spread-sprectrum communications in 1942.

    What do a 1930’s Hollywood star and the inventor of spread-spectrum communications have in common? They are one and the same.

    The new documentary Bombshell highlights not just the acting career of Hedy Lamarr, but her contributions as an inventor. With George Antheil, Lamarr invented spread-sprectrum communications in 1942 and, specifically, the frequency-hopping version.

    Explains Innovation editor Richard Langley, “When a signal’s frequency is quickly shifted in a seemingly random way among a large number of frequencies, the signal can become buried in the background noise and difficult to detect.

    “However, when received, the signal can be recovered by changing the tuned frequency in exactly the same manner as was used for the transmission, thereby lifting the signal out of the noise, allowing it to be heard. Enemy eavesdroppers might not even know a signal was present and wouldn’t be able to decode it anyway unless they knew the frequency-shift sequence.

    “Another way to create a spread-spectrum signal is to spread it using a direct pseudorandom code sequence, and this is what GPS and the other GNSS do.”

    Lamarr and Antheil’s radio system answered a different need — to guide torpedoes to their targets during World War II. The team was granted U.S. Patent No. 2,292,387 for a “Secret Communication System.”

    Their system “employs a pair of synchronous records…which change the tuning of the transmitting and receiving apparatus from time to time, so that without knowledge of the records an enemy would be unable to determine at what frequency a controlling impulse would be sent.”

    Bombshell, a Zeitgeist Films release, opened in theaters Nov. 24.

  • Unmanned taxis, solar-powered UAS in development

    This month’s highlights from the UAV industry include:

    • more on the potential for unmanned airborne taxis,
    • a drone recovery system aimed at satisfying FAA requirements for flying over people,
    • a temporary stumble for camera supplier GoPro as it withdraws from the UAS end-product business, and
    • a possible commercial re-emergence of the high-altitude, solar-powered drone.

    Passenger drone tested in UK

    Y6S passenger-carrying drone. (Photo: Autonomous Flight)

    If a passenger-carrying drone could cost about the same as a regular passenger car, like those used by taxi and Uber drivers, then the economics might work. So it’s interesting that an outfit in the United Kingdom — Autonomous Flight — is talking about building passenger-carrying drones for around $25,000.

    Autonomous Flight says has a prototype up and running, testing the concept in Southern England;  testing with passengers is expected to get underway this year. The YS6 is battery-powered with multiple redundant systems for safety and is designed to fly at 70 mph, with a range of 80 miles at 1,500 ft.

    This happens to meet a design goal of covering a distance from Heathrow Airport to Charing Cross train station in 12 minutes, a journey that would normally take around an hour by car in London traffic. There are similar “hops” that could save a massive amount of time in almost every city in the world.

    But don’t hold your breath. It could take more than five years to get regulatory approval for the vehicle and for the initial routes over cities — never mind the time needed to get this particular concept into large-scale production to achieve the target price. But it’s nevertheless a good sign with good prospects for the future.

    Drone Recovery System

    While the U.S. Federal Aviation Administration (FAA) considers the regulations for drone flights over people, in the meantime several applications have been developed for people-overflight with drones equipped with parachutes.

    Presumably, a drone would be safer if lowered by parachute in the event of equipment failure, but apparently such applications that rely on parachutes for risk mitigation have all been turned down by FAA. University of Alabama and Virginia Tech research has indicated a 70 percent chance of significant injury or death when a drone the size of an 8.85-pound DJI Inspire 2 fails and falls onto people.

    Indemnis in Anchorage, Alaska, has been working with the FAA and other interested stakeholders to draft the regulatory standard for flight over people and has now gone on to develop its Nexus ballistic drone recovery system, which it plans to have on the market by next summer.

    With a retail price of between $1,700 and $2,500, the system is expected to satisfy these coming FAA regulations for UAS flight over people and in urban areas for Part 107 commercial operations, but would seem to be quite expensive for smaller recreational drones.

    The system is scalable for drones from eight pounds to “several thousand” pounds. The Nexus system is designed to automatically deploy within 30 milliseconds of detecting a failure on the drone or of entering unrecoverable flight, and the system is capable of determining normal flight or a failure to within six feet of vertical movement.

    According to Indemnis, more than 10,000 requests for flight over people have been received by the FAA in the last 14 months, but all those that rely on parachutes for risk mitigation have been refused. This is apparently because conventional parachute systems have a tendency to become tangled with the aircraft or manual deployment is required. It is also said that current quadcopter drone safety systems — which cut power to an engine to prevent tumbling and which slow descent by adding power to the remaining engines — are inadequate for flying over people.

    The Nexus system automatically detects failure, cuts engine power, and deploys an aircraft parachute within 30 milliseconds, slowing vertical speed to around 7 mph. This should be slow enough to allow the operator to catch up with the vehicle before it hits the ground. However, reducing vertical speed is only half the solution, as a vehicle under parachute will still travel horizontally due to wind velocity. So Indemnis is testing their parachute system with an airbag on a 33.29-pound DJI M600 drone. The airbag turns the drone “into a giant pillow” once the chute deploys.

    The expected FAA standard is anticipated to require 45 tests in two failure modes — critical motor failure and full motor failure — at full flight speed, hover, and in automatic and manual deployment scenarios. Tests with a DJI Inspire 2 cutting one motor, two motors or four motors have pitched the drone violently just before it enters a slow roll — at 60 mph, it will roll quickly and violently.

    This drone safety and recovery system is expected to be on the market within the next few years, following release of the projected FAA standards.

    GoPro Karma hits the dust

    In what would seem to be an unusual turn of events in a rapidly expanding market, GoPro has decided to exit the UAS vehicle business. GoPro cameras are still a favorite on a wide range of UAVs, but the company has chosen to get out of the business of making end-item unmanned vehicles, despite reaching second place in market share in 2017 for its price range.

    At the Consumer Electronics Show (CES) Jan. 9-12 in Las Vegas, GoPro explained that its decision was based on inadequate returns versus the investment required to support their single-product UAS business.

    However, Karma’s demise was apparently brought on not only by an expensive initial product recall, but also by the apparent additional financial pressure of poor Hero5 camera sales.

    Nevertheless, GoPro still feels that the “action-camera” market has the legs to sustain growth, so it’s likely UAV manufacturers will not have to go looking for another reliable video camera source any time soon.

    Joint venture for solar HALE UAS

    The solar-powered Helios in flight.

    In late 1990s/early 2000s, NASA contracted with AeroVironment to develop a high-altitude solar-powered UAS for NASA’s Environmental Research Aircraft and Sensor Technology, or ERAST, program.

    In August 2001, the Helios prototype reached a world-record altitude of 96,863 ft., and in 2002 the Pathfinder Plus prototype provided from 65,000 feet high-definition television (HDTV) signals; third-generation (3G) mobile voice, video and data; and high-speed internet.

    AeroVironment has now formed a joint venture with Japanese SoftBank Corporation to develop a solar-powered high-altitude long-endurance (HALE) UAS for commercial operations that may include applications such as high-altitude pseudo-satellites.

    The joint venture — known as HAPSMobile — is a Japanese corporation in which AeroVironment holds minority ownership but is still able to directly exploit commercial and military opportunities outside Japan.

    Summary

    It’s encouraging to see another airborne taxi initiative joining the folks who were demonstrating prototypes in Dubai back last September. If the market is there, more entrants should help make this option a reality.

    It’s also good news that a company already has a drone recovery system in the works that could reduce the potential for injury in the event one falls out of the sky. This might start to reverse adverse public opinion about drones and help the FAA move forward with regulations allowing wider usage.

    Meanwhile, it’s sad but true that new industries inevitably see some entrants pull back and even leave in the early stages. It’s fortunate that popular drone camera supplier GoPro still has the ability to retrench and fall back on its existing business.

    Finally, the promise of high-altitude solar-powered drones would seem to be still alive. If it could be possible to hang TV and other comms systems on these high-altitude loitering vehicles, there might be a much less expensive way of getting transmitters into very high altitude orbits without the cost of a space launch. Then many areas around the world could benefit from low-cost signal distribution that might not otherwise work commercially.

  • A grave threat to GPS and GNSS

    A grave threat to GPS and GNSS

    By Bradford Parkinson
    Vice-chair, U.S. PNT Advisory Board

    In the coming months, the U.S. Federal Communications Commission (FCC) may allow high-powered, ground-based, communication transmitters to broadcast at a frequency near GPS L1. U.S. Department of Transportation (DOT) tests have shown that such transmitters effectively become jammers for many existing GPS receivers.

    I believe that this possibility is the greatest current threat to the position, navigation and timing (PNT) community.

    L1 is the primary band for GPS as well as for similar GNSS. For example, the international signal called L1C is to be centered at L1, albeit with wider spreading than the current L1 civil signal, C/A.

    Why is this of critical importance? An economics study that only considered a small subset of benefits concluded that the U.S. alone realized $65 billion per year in direct economic value. A more complete recent study for the UK, extrapolated to the U.S., estimated the total impact of the loss of GPS to be over $3 billion per day for a five-day outage — a far greater rate. Virtually all GPS applications rely on the signals at L1. Thus, any threat to GPS is not simply an inconvenience, it would have great potential to do economic harm.

    The PNT Advisory Board (PNTAB)has been trying to protect PNT, particularly GPS, and at the same time accommodate Ligado, a company that has requested repurposing of nearby spectrum. At our November meeting, we reviewed the Ligado proposal and framed a response that will be made public in due time. Meanwhile, these observations and conclusions are my own.

    History

    In 2011, LightSquared proposed that existing restrictions on its existing frequency authorization in the Mobile Satellite Service (MSS) band (a faint signal, satellite-to-ground) be waived so that the band is effectively repurposed to allow for high-power terrestrial transmissions.

    The company has two space-to-ground authorizations in the 1525–1559 MHz band (1526–1536 MHz and 1545–1555 MHz) very close to the GPS primary frequency (L1 at 1575MHz). Initially it requested repurposing to ground transmission of 42 dBW (15.8 kW).

    Faced with tests and analysis that showed this would be very destructive to GPS, it proposed to abandon the closer band and reduce power in the further band to 32 dBW, or 1580 Watts.

    Ligado filings suggest a spacing of approximately ¼ mile between transmitters. A GPS receiver would find even these weaker signals 5 billion times the power of GPS at the maximum range of ¼ mile.

    Most PNT users would be much closer.

    International criterion

    To ensure ranging accuracy, the international standard for interference to GPS is a 1-dB increase in noise levels. In conventional terms, this max allowable 1 dB is a 25.8% increase in background noise. The power of the weak GPS signal is only about 1% of the background radio noise. Sophisticated signal processing algorithms allow the signal to be reconstructed.

    The result: the international 1-dB standard is equivalent to a 25% reduction in GPS radiated power.

    Two additional points

    The 1 dB is not simply to protect signal lock, it is to protect ranging accuracy. Most GPS receivers will stay locked for higher levels of interference but lose high precision. This is particularly a problem for high-precision receivers, which need relative timing to sub-nanosecond accuracies.

    These measurements are equivalent to the time it takes light to travel ¼ inch. Protecting such accuracies is of paramount importance to PNT users and applications.

    Allowing such maximum degradation from a single source is not the whole picture. There are many other potential sources of interference and attenuations of the GPS signal. For example, foliage may reduce the GPS signal.

    A receiver must cope with all of these difficulties. Allowing a single cause, such as the Ligado repurposing, the 25.8% equivalent reduction might be considered quite generous, but it is the accepted International Standard.

    Ligado has specifically rejected this criterion, largely because testing has shown that the Ligado repurposing would then be unacceptable for many PNT user classes.

    To support its rejection of the International Standard, Ligado has repeatedly alleged that five of the major manufacturers are in complete agreement regarding its repurposing. This is a substantial distortion. The record was set straight by Brian Ramsay of MITRE at the November PNTAB meeting: “Four of the five parties that reached agreements with Ligado (except for Topcon Positioning) support the 1-dB Interference Protection Criterion (IPC) in comments filed in response to this Public Notice.”

    Further support was highlighted by Captain Robyn Anderson: “In June 2017, the Air Force produced a white paper on the 1-dB IPC that explained the relationship between harmful interference (levels that affect GPS receiver performance) and the 1-dB IPC (keeps interference below a level that would cause harmful interference).”

    Lightsquared’s motivation in 2011 was clear: a $10 billion windfall profit (estimated increased value of the spectrum on open-market auction). The FCC did not confirm Lightsquared’s modified request, and in 2012 the company went into bankruptcy.

    Reorganizing as Ligado and emerging in December 2015, it continued to pursue repurposing of its spectrum, sponsoring tests by Roberson and Associates, and tests at National Institute of Standards and Technology (NIST)/National Advanced Spectrum and Communications Test Network (NASCTN) to establish test procedures.

    Both groups of tests were carefully reviewed by our PNTAB who found serious flaws. In general, Ligado rejected the 1-dB criterion and did not accept the need to protect all classes of users, particularly high-precision receivers. In addition, it did not consider the new GPS L1 signals (L1C and L1M), nor did it check the impacts on the international GNSS. The PNTAB assembled a 14-point summary of deficiencies and requested updates and corrections for the flaws.

    NASCTN’S response did not really address the points, or claimed that there were no funds to correct the problems. The PNTAB then developed a Six-Point Criteria for acceptable interference testing, summarized as:

    • Accept and strictly apply the 1-dB criterion.
    • Verify interference for all classes of receivers.
    • Test and verify for all operating modes.
    • Focus analysis on worst cases.
    • Include the new GNSS signals.
    • Include GNSS expertise and openly publish results.
    Image: PNTAB
    Image: PNTAB

    We believe it is a very reasonable set that aims to protect PNT users and our economic benefits. In its sponsored tests, and in representations to the FCC, Ligado has consistently overlooked a basic facet of radio ranging: it is ranging accuracy, not simply locking onto a signal, that is the fundamental objective for PNT.

    Both Ligado test sets clearly failed on all six points.

    DOT ABC tests

    While the Ligado-sponsored tests were neither independent nor adequate, the Department of Transportation, led by Karen VanDyke, sponsored a very complete set of independent tests; these are the most credible estimates of harmful interference. The ABC results have been made public. The PNTAB’s six points were published after DOT testing had begun, but DOT expanded and modified their effort to satisfy the criteria. The DOT conclusions, based on modeling real-world antennas and propagation patterns, are shown in Table 1.

    TABLE 1. DOT ABC test results. Maximum tolerable effective radiated power (EIRP) for classes of the most susceptible GPS receivers for modified Ligado proposal (P2) of 1.58 kilowatts. In red are the factors that Ligado P2 exceeds the maximum tolerable radiated power. (Chart: GPS World)
    TABLE 1. DOT ABC test results. Maximum tolerable effective radiated power (EIRP) for classes of the most susceptible GPS receivers for modified Ligado proposal (P2) of 1.58 kilowatts. In red are the factors that Ligado P2 exceeds the maximum tolerable radiated power. (Chart: GPS World)

    At 100 meters, all classes of receivers tested had results that would exceed the 1-dB threshold, even for the reduced power level (P2, 1580 Watts) that has been the most recent filing. The shaded square is particularly troublesome. It shows that, for the most susceptible high-precision receivers, the Ligado proposed power exceeds the 1-dB threshold by over 200,000. This result is particularly damning for the proposed repurposing, because it is this class that produced the highest payoff in the recent Department of Commerce Study — over $30 billion per year.

    PNT operations at risk

    These are examples of unintended and potentially hazardous consequences of repurposing.

    UAVs. Unmanned aerial vehicles (drones) will fly very close to the dense array of transmitters that Ligado would deploy. They usually require GPS for flight control. Even more important, if we are to monitor them and keep them from collisions, GPS offers the only viable techniques with 3D accuracy and almost 100% availability.

    Precision survey. This is routinely used in urban areas for building construction and is a major source of productivity gains. These survey receivers are all high precision and routinely make measurements to better than ¼ inch.

    Helicopters. These are found in urban area at all altitudes. They are used for law enforcement, rescue and passenger transportation. GPS is mainly used for general navigation.

    Public safety vehicles. Fire, police and ambulances use GPS for both navigation and dispatch tracking. In a city, they would drive in and out of susceptible high-interference zones.

    The PNTAB believes the DOT results are representative, accurate and credible. The National Coordinating Office for PNT also sponsored an evaluation of all testing to date. A summary report is now in coordination, as a combined Department of Defense (DOD) and DOT effort.

    The DoD, which uses GPS in the national airspace for routine flight, testing, training, guiding rocket launches, and for humanitarian rescue missions, has opposed repurposing. The Air Force reported, “Results from the DOD ABC Assessment support the conclusions drawn from Department of Transportation’s ABC Assessment.”

    November PNTAB meeting

    At our November meeting, the board invited Ligado to make a presentation on its repurposing proposal. The invitation said: “Specifically describe your implementation plan, with a corresponding test plan addressing the issues we have openly raised. We request you specifically focus on those regarding the potential for interfering with any GPS/GNSS services that operate in the protected space-to-Earth L-band (1559–1610 MHz). Included should be all modes of operation and the use of all current and future GNSS signals.”

    Valerie Green, executive vice president and chief legal officer of Ligado Networks, represented Ligado. In the run-up to the meeting, the Six-Point Criteria had been sent to Ligado. Green did not address the six points at all.

    She did offer to reduce initial power to “the safe power level in the 1526–1536 MHz channel ranges from 9 to 13 dBW EIRP nationwide,  not just near airports.”

    FIGURE 1. Potential impacts on high-performance receivers. Red: loss of lock of all satellites. Yellow: loss of lock of low-elevation satellites. Green: 1-dB degradation. (Chart: PNTAB)
    FIGURE 1. Potential impacts on high-performance receivers. Red: loss of lock of all satellites. Yellow: loss of lock of low-elevation satellites. Green: 1-dB degradation. (Chart: PNTAB)

    The 13 dBW corresponds to initial power levels of 19.95 W. However, Ligado has made clear in its FCC filings that it ultimately still wants a full 32 dBW base-station transmit power level, consistent with typical 4G/LTE networks.

    The initial reduced power sounds like a major move in the right direction, but further questioning revealed two major issues:

    Tower Spacing. Green was very evasive on the spacing of transmitter towers. Clearly, at the reduced power level, greater density would be needed to carry the original data bandwidth. At about 1/100th the power, density would have to increase by a factor of 100, and the spacing would have to decrease to 1/10th for the same data output rate.

    Green referred us to an earlier filing which specified 0.25 mile, but did not clearly state that this was the plan; she claimed the details were proprietary. If this fundamental parameter, spacing, is not specified, it is hard to see the basis for the FCC evaluation of any new proposal. If the transmitter spacing is reduced to less than 1/10th of a mile, the sources of potential harm would be multiplied in a very worrisome way.

    Future power constraint. A public presentation does not ensure that Ligado will actually file and agree to abide by those power constraints indefinitely. Board members pressed Green on the permanence of the power constraint.

    She suggested it would be tied to the RTCA Minimum Operational Performance Standard. Revising the MOPS takes many years, if not decades, both to formulate and to implement. Retrofitting the commercial aircraft fleet is very expensive and time-consuming.

    Further, her statement focuses only on commercial aircraft, ignoring the high-precision classes as well as future signals.

    A modified summary chart (Table 2) for the lower power, based on the DOT ABC test results, shows that even at the lower power, the threshold for high-precision receivers is exceeded by a factor of over 3,000 at 100 meters. In fact, only cell phones, which are relatively inaccurate, could operate at 100 meters without exceeding the threshold.

    TABLE 2. Results of DOT ABC test with Ligado transmitters constrained to 19.95 Watts (13 dBW). This illustrates that the International Interference Limit is exceeded many times over at 100 meters for certain high-precision receivers, highlighted in red. (Table: GPS World)
    TABLE 2. Results of DOT ABC test with Ligado transmitters constrained to 19.95 Watts (13 dBW). This illustrates that the International Interference Limit is exceeded many times over at 100 meters for certain high-precision receivers, highlighted in red. (Table: GPS World)

    With these expectations and uncertainties, the PNTAB did not find the new revision acceptable to the PNT community.

    Three fundamental issues

    Ligado has steadfastly not accepted the realities of non-interference.

    1 dB. Acceptance of the 1-dB (25.8% noise increase) International Interference standard is fundamental to protecting GPS applications throughout the country.

    All current and future uses. Users of great concern are emergency services, helicopter and general aviation, UAVs, and precision survey and machine control. For example, many of the underground utilities in the U.S. have been mapped with precision, GPS-based, geographic information receivers. This application requires sub-meter accuracy and operates in both rural and urban environments.

    Ligado has tended to simply focus on certified aviation, claiming that protecting that class of user is enough. The PNT community rejects that view. All current and future PNT users must be protected.

    Worst–case interference. The recent round of testing was largely in a laboratory. Extrapolating to the real world must examine the situations with greatest interference. For example:

    • Number of simultaneous interfering transmitters. A single transmitter situation is not typical; three or more are apt to be in range. The additive power must be considered.
    • Propagation models. Propagation models for communications differ from those for evaluating potential interference to a navigation signal. For assured communication, a typical model assumes transmitted signal fall-off a little faster than 1/(distance squared). Ligado would naturally prefer to use this model, which is far from worst-case for interference. The early round of tests in Las Vegas verified the communications model would vastly underestimate interference levels, by factors of 10 or more. A more realistic model must be used.
    • Degradation Radius. This is the size of the circle within which the International Standard is violated for receivers in a specified class. If the spacing of transmitters is 400 meters, and the degradation radius is 200 meters, virtually all receivers are in the degradation zone. Ligado suggested an appropriate degradation radius is 250 feet for aviation (approximately 100 meters). Thus, they claim the PNT community should tolerate violation of the standard when closer than 100 meters to their transmitters. At 400 meters spacing, 25% of the area would be in violation.

    But the ABC test results reveal a much graver situation. They show that, for the current Ligado proposal (1580 watts), the degradation radius is over 14 kilometers for high-precision receivers. See Figure 2.

    FIGURE 2. Macro urban transmitter, high-precision receiver, 1530 MHz. (Image: PNTAB)
    FIGURE 2. Macro urban transmitter, high-precision receiver, 1530 MHz. (Image: PNTAB)

    Conclusions

    The 1-dB criterion is the correct, accepted and somewhat generous allocation of interference that can be accepted by the PNT community. We would hope that the FCC would continue to insist on this standard.

    PNT users must, yet again, defend the spectrum vigorously. Most of us are scientific and technical people. We are not used to discussions that deliberately avoid the technical issue or deny scientific evidence. We reject arguments that violate the fundamental laws of physics.

    The currently filed proposal, 1580 Watts at spacing of ¼ mile, is unacceptable. It will do grave harm to many important PNT applications

    We must be very leery of the new proposal by Ligado of 9–13 dBW. It still would violate the 1-dB criterion at 100 meters for many PNT users.

    Moreover, the company history has been to bait and switch; it has an authorization for MSS Ancillary Terrestrial Component (MSS ATC) stations to fill the gaps in satellite coverage with ground transmitters. These must operate in conjunction with the space-to-ground link that made them effectively self-limiting. However, in 2011, it almost succeeded in switching this to a ground-only system, which would have achieved a huge financial windfall.

    Open-air verification

    If the FCC continues to consider this proposal, there is one step that it should take before granting it. It should require Ligado to deploy an array of transmitters in its advocated configuration, and run real-world, open-sky testing to assess the harm that may result, particularly to high-precision accuracy.

    Such testing was done when the issue was first raised in 2011 and conclusively demonstrated unacceptable interference. Nothing has really changed from the baseline that was tested and found unacceptable then.

    The company should carry the full financial burden of such a verification, under PNT supervision. The government, having already spent millions of dollars to defend the spectrum, should not bear the cost of such retesting.

    Without this confirmation, it is hard to conceive of putting GPS and PNT at significant risk to satisfy investors who want to flip a company, after gaining “rezoning” permission for their spectrum.

    From 20,000 feet altitude

    If we examine the situation without the technical details, we have this: Fundamentally Ligado wants to provide service using its allocated frequency band for an unlimited number of Internet-of-Things installations.

    It is not proposing a small, fixed number of transmitting towers located in isolated regions, but rather an accelerating deployment of private networks, many of which will be close to commercial and essential infrastructure where GPS use is critical.

    It seems unrealistic that Ligado can or will reliably guarantee that these widespread installations will be continually adjusted and monitored to avoid GPS interference.

    I believe the concept of allowing the installation of transmitting towers that, by design, will interfere with normal GPS use at some distance away opens the door to tacit approval of short-range (or not-so-short-range) GPS jammers.

    While I can commend the entrepreneurial spirit, the Ligado proposal seems very reckless indeed. The incremental value of an additional broadband transmitting system when there are at least five already in existence seems trivial compared to the potential damage done to the modern utility named GPS.

    I sincerely hope the FCC can find a spectrum swap or deny outright the current Ligado application.