An oblique image of downtown Chicago, captured in June 2017, with measurements. (Image: Nearmap)
Guest column by Sanchit Agarwal Vice President, Field Operations, Nearmap
With high-resolution imagery comes the ability to model reality, creating real-life visualizations for engineers, planners, construction teams and many others.
A quantum leap in computing capacity has allowed us to model and analyze the real world — all from our desktop and mobile devices. In days past, maps were purely for visualization and direction.
Today, they have graduated to full-blown analytics platforms empowering users to make decisions faster than ever before.
Why?
They closely represent truth on the ground — truth created from high-resolution aerial imagery captured at heights of up to 18,000 feet. Camera systems mounted in the bellies of planes can efficiently map the real world in incredible high detail. These aerial photographs are updated continuously.
In years past, access to aerial mapping content and services was reserved for more significant players.
Today, with easy access to scalable high-definition mapping content, anyone can utilize the power of maps in applications that extend far beyond directions and navigation.
There are two essential attributes of aerial maps driving this transformation — image resolution and model density. Today, most users are applying low-resolution satellite images that lack the detail needed for accurate decisions. But, as resolution increases, the imagery becomes more detailed; the visualizations, more vivid.
Ground features have gone from fuzzy satellite photos to clearly identifiable homes, buildings, roads, lakes and more — all captured using powerful cameras that have found the perfect pixel. With high-resolution comes added benefit.
Aerial image of the Aria Resort in Las Vegas captured in May 2017. (Image: Nearmap)
Users can manipulate the imagery — zoom closer and closer without losing the details. Computers can classify the features, distinguishing skylights from solar panels, walking paths from sidewalks, and pools from ponds.
Rich imagery is yielding richer data used to instantly query massive databases and return results that answer complex questions for businesses and government.
With high-resolution imagery comes the ability to model reality, creating real-life visualizations for engineers, planners, construction teams and others.
These models of landscapes, cities and neighborhoods are portrayed inside design tools and mapping systems, saving the analyst countless days of traveling to the site only to be surprised that the outdated low-resolution imagery does not depict what’s actually on the ground.
Imagery can vary greatly in resolution. Pixel resolution refers to the actual distance on the ground that each pixel represents in the orthophotography — the vertical image. For example, one-foot pixel resolution means that each pixel in the image covers one foot on the ground.
Common resolutions include three-inch, six-inch, one-foot and one-meter. The higher the imagery resolution (for instance, three inches per pixel), the greater the visible detail within the photograph. Clearly, a three-inch resolution is much better than a one-foot resolution.
Most mapping content currently consumed is two-dimensional and generated from low to mid-resolution nadir imagery. In other words, you see the land as if you were staring straight down at it, not height-of-ground features and certainly not change over time.
While that was adequate for some users, others reached for higher resolution and, while they were at it, decided they needed a third and fourth dimension — namely, height and time. These new perspectives provide more analytical options, more insights and a variety of new use cases that show change over time, height and multi-perspectives of the same property or landscape.
With the democratization of mapping products and services and the general trend toward consumption of multi-dimensional experiences, there is an implicit need to increase resolution, detail, dimensions and perspectives in mapping content and services as well.
The Rancho Mirage community of California, captured in February 2017. (Image: Nearmap)
Traditionally, satellite imagery has been used to monitor large areas of the earth at scale remotely. The resolution of the satellite imagery has graduated from multiple meters to feet with the advent of advanced mapping satellites.
The challenge here is the resolution. Low-resolution satellite imagery, although scalable, is good for macro-analysis of cities and neighborhoods but is not detailed enough for accurate measurements and micro-analysis at the level of each individual property.
On the other end of the spectrum come drone mapping solutions that offer the promise of delivering incredibly high-resolution datasets (sub-centimeter resolution) but fails to provide the scalability and repeatability.
Let’s get specific. Why does resolution matter?
You cannot measure what you cannot see. The resolution of imagery provides a more detailed, zoomed in and richer view of the real world, thereby enabling desktop based reconnaissance, inspection, analysis and measurement of features that are not traditionally visible in satellite imagery.
Higher resolution means high fidelity and dependable measurements. With the added details and definition of features that high-resolution offers comes the much-needed advantage of clearly and legibly identifying feature boundaries and hence measuring the feature with high precision and accuracy.
Higher resolution map content means fewer site visits. Rather than travel onsite to inspect and measure, many organizations are now relying on high-resolution imagery and, in the process, not having to waste resources sending team members on site.
High resolution means more detailed documentation of reality. Gamers have experienced reality-like landscapes for quite some time. Now, 3D and 4D mapping content allows users to immerse themselves in the landscape, navigate through street views, and fly like a bird to inspect rooftops with ease.
High resolution and refreshed content means more accurate change analysis. Identifying how locations have changed over time through multiple captures that embody leaf-off and leaf-on imagery allow users to not only visualize detail but also notice progress, changes in construction, degradation of property features, growth in vegetation and more.
High-resolution content means more automated workflows. High-resolution content allows for better feature definition models resulting in higher success rates in interpreting and analyzing the reality algorithmically. Higher success rates of automated algorithms results in efficient exploitation of datasets to solve real world problems.
Machine learning thrives on high-resolution content. There’s no shortage of news on the use of machine learning and artificial intelligence in data science. With the advent of high-resolution maps, machine learning is now able to differentiate skylights from solar panels, decks from patios and pavement from pavers. In turn, the ground features identified are being stored in databases for lightning fast queries to complex problems.
The higher the resolution, the higher your confidence will be.
As the days tick down towards the coming AUVSI Xponential convention in Denver April 30 to May 3, new UAV/UAS developments and applications continue to appear, indicating that this industry could be moving from startup into the beginning of a growth phase.
Skycatch and DJI high-precision drones for Komatsu
The construction industry has always been one of the preeminent areas that require medium- to high-precision surveys. And Komatsu has become one of the world’s leaders in machine automation for the construction site.
Now Komatsu has committed to the automation of site surveys using drones, which ultimately appears to be packaged as a turnkey service for construction companies.
Komatsu aims to show up at a site with all the necessary automated construction machinery and a small staff of automation experts. The experts will survey the site using Skycatch drones and manage the construction for the contractor.
Skycatch drones will survey construction sites with existing RTK networks. (Photo: Skycatch)
Skycatch, based in San Francisco, California, has teamed with Komatsu, who has apparently invested financially in the company and purchased around 1,000 Explore1 drones manufactured by DJI from Skycatch.
Explore1 is actually a modified Matrice 100 DJI drone with special additions. A Skycatch onboard computer links GPS real-time kinematic (RTK) high-precision positioning with a gimbal-mounted 20-megapixel high-resolution camera and the flight computer, resulting in centimeter-level geocoded data.
The big deal is that the system uses existing RTK networks.
Komatsu has been using Skycatch systems for more than three years. The Explore1 system is a combination of all the lessons learned on ease of use and time to collect usable data. Explore1 is used to digitize construction sites during planning, construction and completion.
NASCAR drone protection
It’s unfortunate, but nowadays there always seems to be heightened awareness that events where lots of people gather may present ideal opportunities for possible terrorist attacks. And there has been much made of the possibility that UAVs may be included in the next wave of offensive means for terrorists to inflict civilian casualties on the Western world.
So it’s comforting to hear that for the recent NASCAR race in Fort Worth, Texas, a number of security organizations decided to take the precaution of installing drone countermeasures for the event.
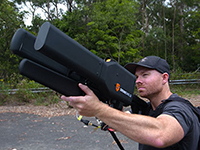
DroneGun, part of the DroneShield anti-UAV system. (Photo: DroneShield)
At the Fort Worth race, the Texas State Department of Public Safety, the Denton County Sheriff, the Fort Worth Police Department, the Texas Forest Service and the Texas Rangers used DroneShield anti-drone systems for the protection of the 2018 Monster Energy NASCAR Cup Series at the Texas Motor Speedway on April 8.
DroneSentinel for drone detection, DroneSentry used for integrated detection and defeat, and DroneGun drone interception were all deployed to determine where drones may be operating and to intercept them if required.
This appears to have been the first known live operational use of all three products by U.S. law enforcement to provide “peace of mind in the aerial domain,” as expressed by an officer about the event.
No bees? Just call for a drone
I’m always frustrated by the fruit tree in my backyard — it absolutely insists on flowering in March when there seems to be more high winds than at any other time of the year, so most of its blossoms are blown to the ground. It’s a mature tree, and you would imagine that it should have learned by now.
But when it is calm and warm, only a few butterflies and birds seem to show any interest. I hardly ever see any bees buzzing around and doing their pollinating thing, and so fruit is hard to come by later in the year.
I’ve thought of borrowing my wife’s make-up brush and dabbing my way round the flowers, but the neighbors, or my wife for that matter, might see me and call the cops to get me taken away…
So I was quite interested when I saw that an outfit called DropCopter, based in Corning, California, is setting about pollination using customized drones. DropCopter basically supplements lost bees by flying over flowering fruit trees and dropping pollen on their blossoms using a drone.
This UAS start-up has initiated a drone pollination service which uses automated multi-rotor drones to dust almonds, pistachios and cherries, boosting crops by up to 15 percent! It seems that fruit producers can rent bees when it comes to pollination time, but bee-rental costs have apparently soared recently. Growers may have been paying up to $180 for one hive to be relocated among their fruit trees. These costs have been cutting into margins and raising the price of fruit at the store.
Enter DropCopter to alleviate pollination problems and restore profit margins for the growers.
DropCopter is using some funding provided by GENIUS NY sponsorship to operate its patent-pending pollination system during nighttime over local New York orchards. Bees don’t like the colder night temperatures, so DropCopter can double the pollination time by operating at night while the bees work the day shift.
But where the heck does DropCopter find all the pollen necessary to fill its pollen distribution containers on its drones? The mystery of fruit pollination still puzzles me.
Range of novel UAV applications grows
So, it’s quite a range of interesting drone applications: automated site survey using drones and a suite of Skycatch processing and data-delivery software; anti-drone protection systems becoming commonplace at larger events; and nature getting a helping hand from pollinating drone systems… Who would have ever thought we’d be seeing these novel, innovative drone solutions?
But, then again, who would have ever expected in the pre-2000 timeframe all the applications that GNSS alone has managed to open up?
The miniature UAV, smaller than a human palm, zips right to its human target — identified through facial recognition technology — and pierces the forehead with a projectile, for an instant kill.
That harrowing scene takes place in a seven-minute viral video issued by autonomousweapons.org, a non-profit sounding warning bells over potential automation of weapons. Its Campaign to Stop Killer Robots (#BANKILLEROBOTS) seeks a preemptive international ban on “fully autonomous weapons which enable strikes to be carried out without human intervention.”
“Allowing machines to choose to kill humans will be devastating our security and freedom,” warns Stuart Russel, professor of computer science at the University of California at Berkeley, on the video.
What feels like science fiction to those of us raised on the Terminator franchise could be closer than we think. Because of this, a new U.S. Army report emphasizes the need to develop countermeasures against swarming drones and other unmanned weapons.
The Army and U.S. Department of Defense have invested significantly in technologies in response to these threats, often focusing on detecting radio frequency transmissions of the UAVs or their operators.
However, as the report points out, today’s consumer and customized UAS increasingly can operate without radio frequency command-and-control links by using automated target recognition and tracking, obstacle avoidance, and other capabilities enabled by software.
The U.S. Army discusses the pros and cons of autonomous weapons in a June 2017 article in Military Review, saying an international ban should be considered on “fully autonomous weapons with missions that cannot be aborted and that cannot be recalled once they are launched. If they malfunction and target civilian centers, there is no way to stop them.”
Sobering thoughts about a future that may not be too distant.
A: The availability and quality of GPS in the application is critical. Industrial-grade MEMS IMUs can provide survey-grade performance when high-quality GPS is continuously available, but even tactical-grade MEMS cannot provide more than a couple of minutes of GPS-denied navigation. The level of integration between the two technologies is also important. Even comparing two systems using the same sensors, the performance is highly dependent on the ability of the system designer to leverage their respective strengths.
A: Successful integration of inertial sensors with GNSS requires understanding both the goals and environment of the application. Consider the required accuracy of attitude and position, severity of GNSS obstructions, expected dynamics and environmental conditions. Tradeoffs in size, power and cost narrow the choices, but achieving the desired performance is more nuanced. Data sheets for IMUs can also be notoriously difficult to compare. My advice is to focus on the goals and listen to the experts.
A: There is a clear need for reliable consumer-grade GNSS/INS in GNSS-degraded environments. In this case, two key aspects are: removal of measurement outliers, mostly caused by multipath; and adequate modeling of inertial errors. The first aspect is efficiently addressed via residual monitoring, especially with GNSS carrier phase. A 15-state INS error model is generally sufficient. Yet, modeling parameters and contribution of other terms such as axis misalignment must be evaluated using test data.
My last column described how the U.S. National Geodetic Survey (NGS) used the detailed analysis of the latest GPS on Bench Marks dataset to:
generate a prototype hybrid geoid model to evaluate the residuals at stations not used in the hybrid geoid model,
confirm that the stations recommended for re-observations should be observed again, and
identify void areas that need additional observations.
Since GEOID12B was created, users have been instrumental in providing OPUS with results on benchmarks in areas where NGS said that additional stations were needed. It showed how NGS used the detailed analysis to prepare material to assist users on strategically occupying stations to help support the GPS on Bench Marks Program and create a hybrid geoid model that accurately represents a current NAVD 88.
To eliminate confusion of where NGS would like new observations, NGS’ material contains a specific list of stations that it would like occupied with GNSS during the 2018 GPS on BMs program. My previous column provided a summary of the latest details of NGS’ 2018 GPS on BMs campaign, which will be used to create the next hybrid geoid model in 2019.
The analysis described in my column was the first cut at identifying stations that should not be used in a hybrid geoid model, and providing a list of specific stations that could help improve the hybrid geoid model. All new data received by the cut-off date of Aug.31, 2018, will be analyzed by NGS and, if appropriate, the results will be included in the next hybrid geoid model.
This is a great opportunity to provide data that will help to improve the hybrid geoid model in your region.
This column will describe NGS’ GPS on BMs 2018 interactive web map and provide an update and status report on stations observed in support of the 2018 GPS on BMs Program.
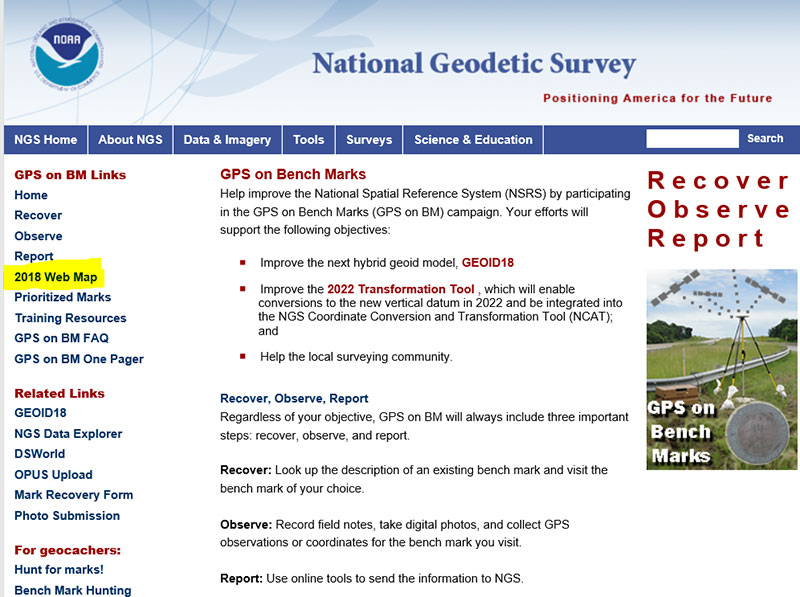
First, NGS has a web page dedicated to the 2018 GPS on BMs program. See the box titled “GPS on Bench Marks Web Page.”
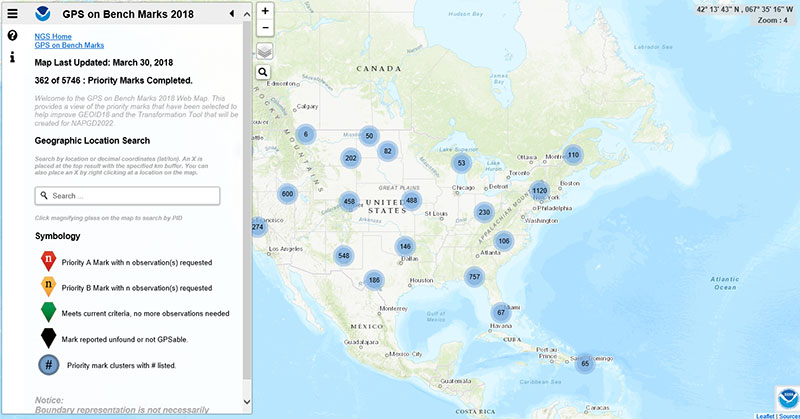
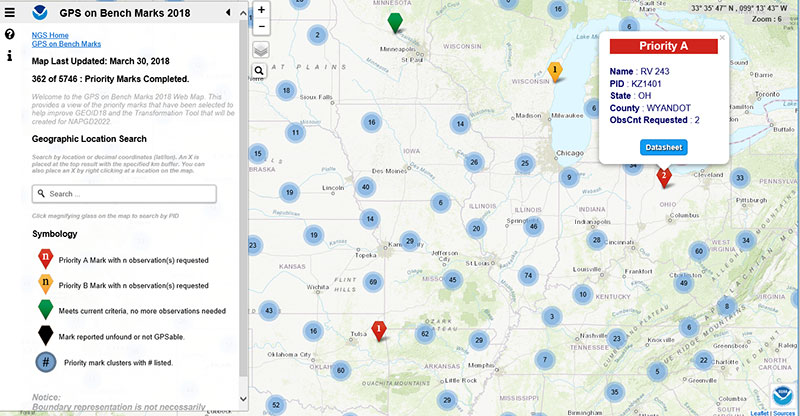
The GPS on BMs 2018 web page contains a link to a web map where users can determine which bench marks NGS would like users to occupy before the Aug.31 deadline. On the left-hand side of the web page there is a link titled “2018 Web Map” (see highlighted section of box titled “GPS on Bench Marks Web Page”). The next few boxes demonstrate how a user can use the web map tool to locate bench marks in their local area of interest. The box titled “2018 Web Map” depicts what the user will see when the link “2018 Web Map” is clicked.
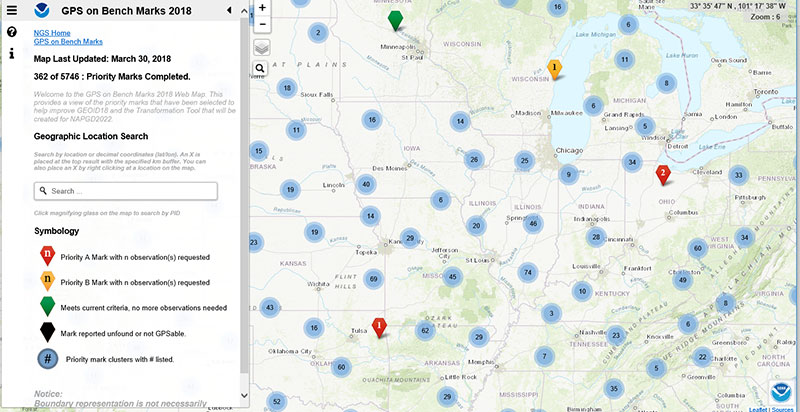
The user can then click on the map and the tool will provide more details. The box titled “Map After Clicking on Priority Mark Cluster #488 in the Great Plains Region“ is a depiction of the map after clicking on a priority mark cluster.
Map After Clicking on Priority Mark Cluster #488 in the Great Plains Region
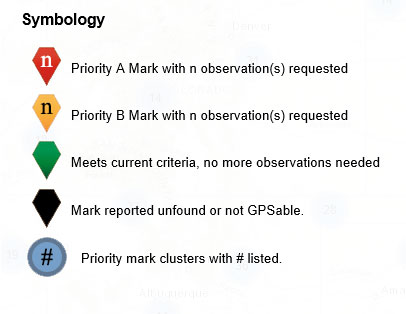
The user can continue to check on the map until the map depicts individual bench marks where the symbology indicates the status of the monuments. The symbology labels are fairly straightforward. The box titled “The Web Map Symbology” provides the five different categories of monuments.
The Web Map Symbology
NGS is updating the map weekly to reduce users occupying stations that already have enough redundant observations. Clicking on a station provides the status of the station. The box titled “An Example of a Priority A Station” depicts station (PID KZ1401) that is labeled as a Priority A station and requires two observations.
An Example of a Priority A Station
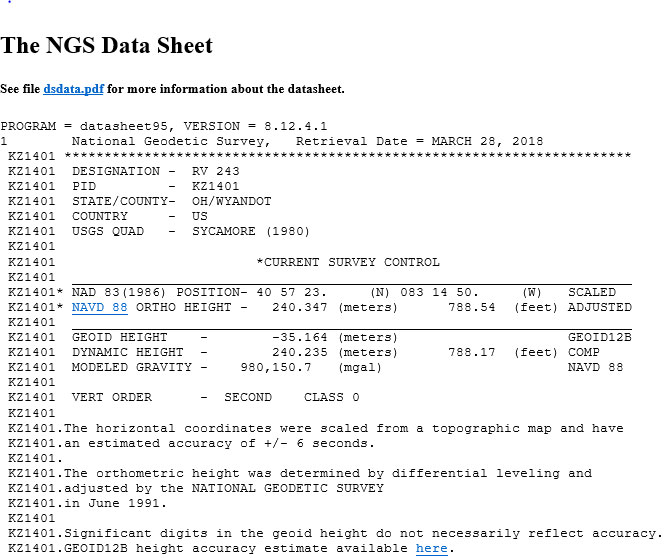
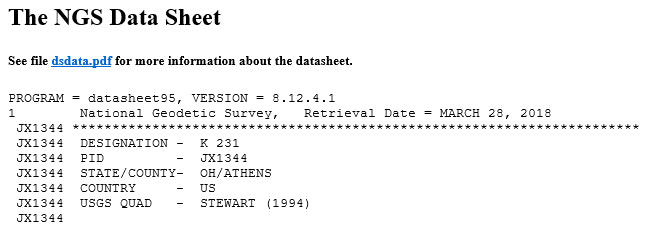
The user can obtain the datasheet for the station by clicking on the Datasheet button in the box (see box titled “Excerpt from the Datasheet for PID KZ1401”).
Excerpt from the Datasheet for PID KZ1401
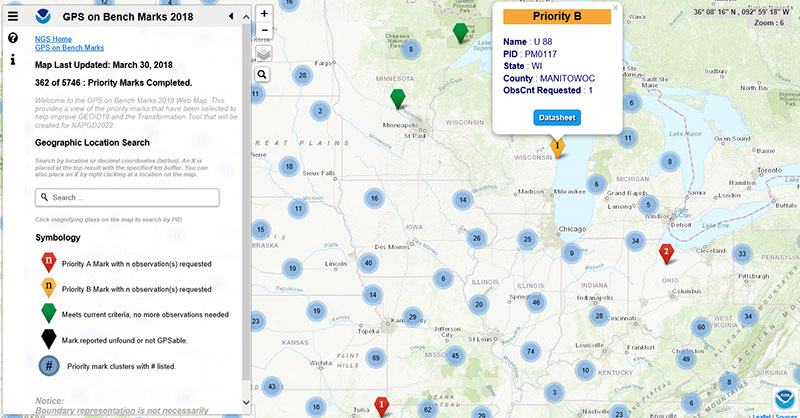
The box titled “An Example of a Priority B Station” depicts a priority B station (PID PM0117) that NGS would like one more observation. Users should remember that priority A stations are more important than priority B stations but B stations are still important for the development and analysis of the hybrid geoid model.
An Example of a Priority B Station
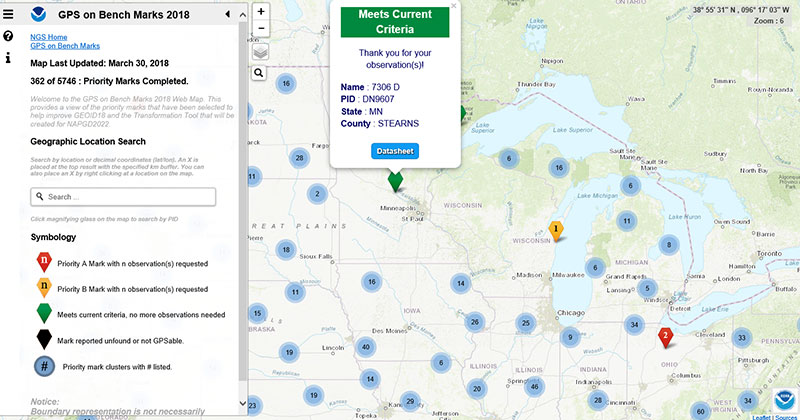
The box titled “An Example of a Station that Meets Current Criteria” provides an example of a station that does not need any more observations. As previously stated, NGS will be updating this web map on a regular basis so users will not waste their time and resources.
An Example of a Station that Meets Current Criteria
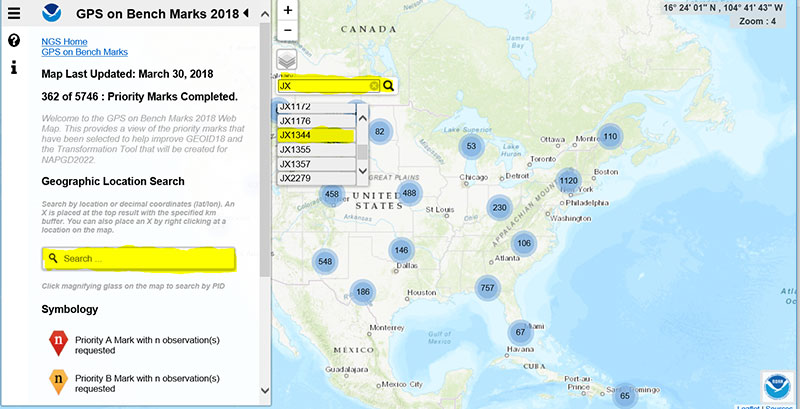
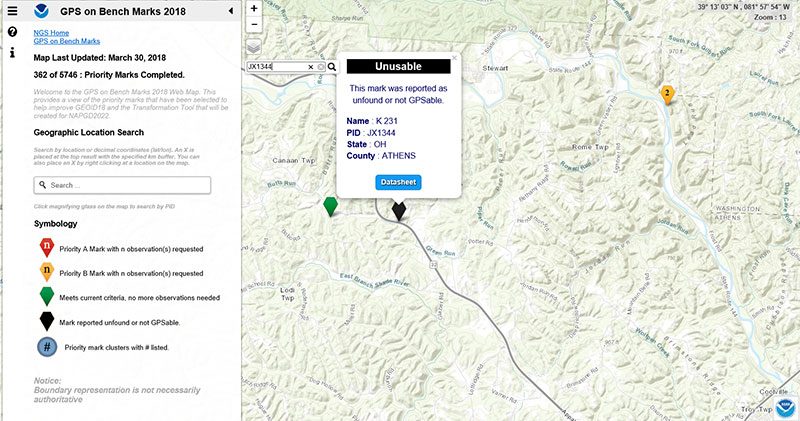
The web map has a search feature, so if the user knew a priority A or B station’s PID, they could locate the station on the map. The box titled “An Example of Using the Web Map Search Feature“ demonstrates the search feature using PID JX1344 (see highlighted section in the box).
An Example of Using the Web Map Search Feature
The box titled “Output from Search Feature for PID JX1344“ is a depiction of the output using the search feature.
Output from Search Feature for PID JX1344
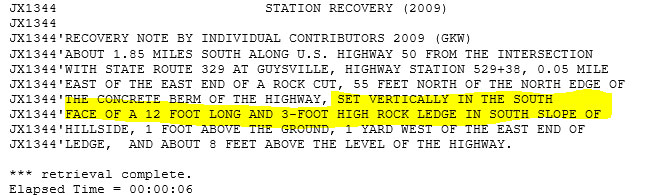
The last category of stations that are shown on the web map are monuments that are reported as unfounded or not GPSable. This is very useful information for NGS and others to have on datasheets. The box titled ” Output from Search Feature for PID JX1344 “ depicts bench mark PID JX1344 that is labeled as unfound or not GPSable. The datasheet for JX1344 indicates that the bench mark is set vertically in a rock ledge (see highlighted section in the box titled “Excerpt from the Datasheet for PID JX1344.”
Excerpt from the Datasheet for PID JX1344
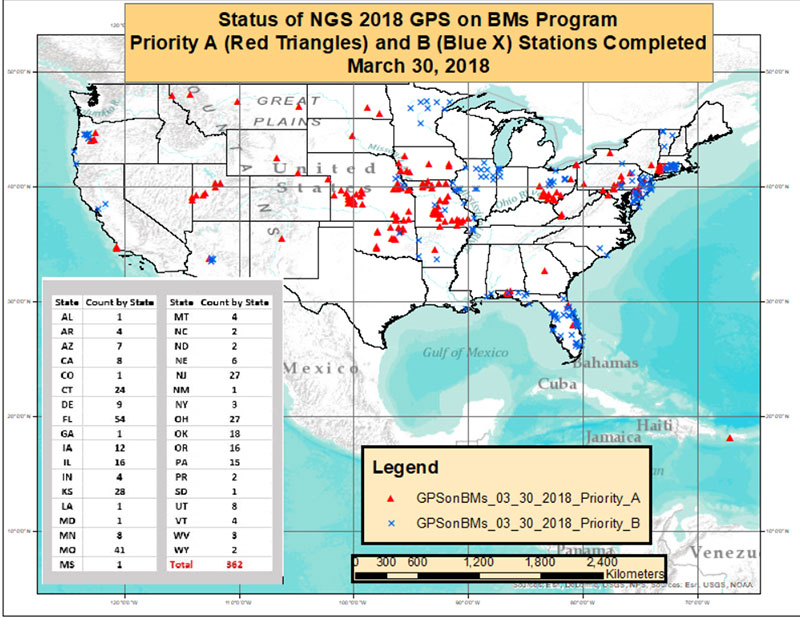
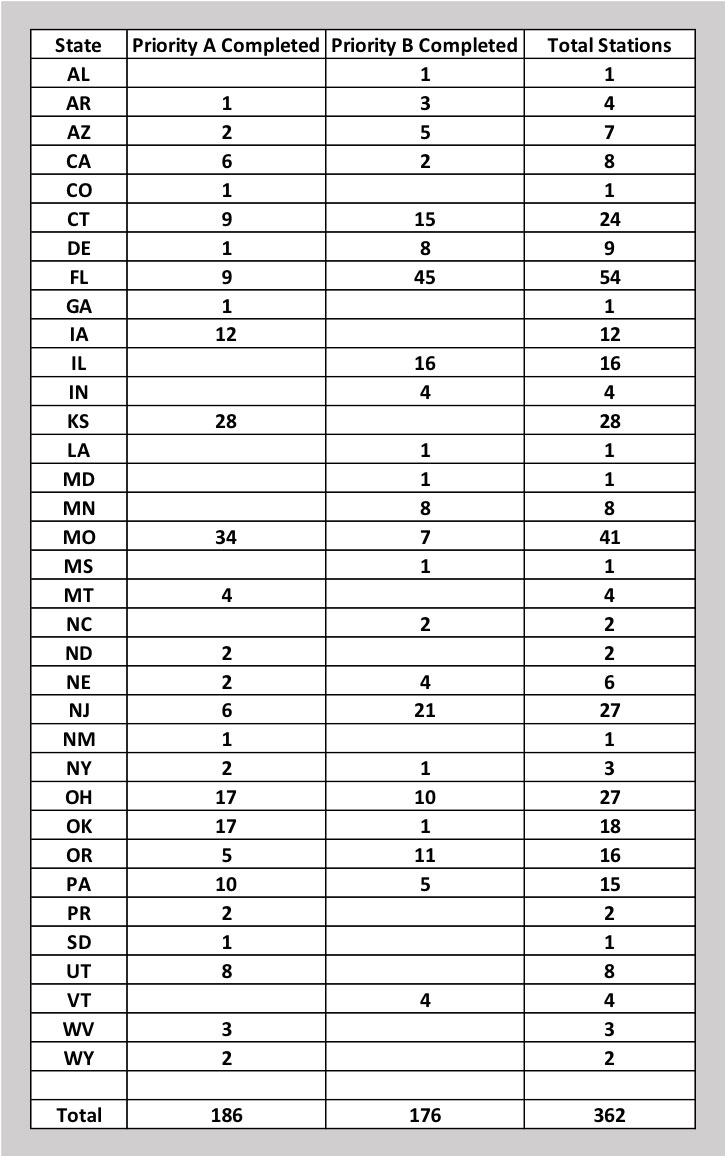
As of March 30, 362 of the 5745 priority marks have been completed. The box titled “Status of NGS 2018 GPS on BMs Program as of March 30, 2018“ is a plot of the stations that are completed, and the box titled “Count of Stations Completed by State “ provides the number of stations completed by state. The red triangles are priority A stations completed and the blue “X” are priority B stations labeled as completed.
It appears that the central portion of the country has been very active. For example, there are 34 priority A stations completed in Missouri and 28 completed in Kansas. The State of Florida has completed 45 priority B and nine priority A stations for a total of 54 stations (see box titled “Count of Stations Completed by State “).
Status of NGS 2018 GPS on BMs Program as of March 30, 2018
Count of Stations Completed by State
March 30, 2018
The number of stations completed to date represents about 6 percent of the total number of stations that need to be observed. Aug. 31 is only five months away. Hopefully, the number of completed stations will significantly increase during the next several months.
If you have a GNSS receiver, please identify a priority monument nearby and occupy it. As I have explained in previous columns, there are many invalid GPS on BMs stations that may be used in the next hybrid geoid model unless more benchmarks with valid NAVD 88 heights are observed with GNSS.
Please encourage your fellow surveyors and friends to occupy a benchmark to support the next NGS hybrid geoid model. This is your opportunity to help develop a current, valid hybrid geoid model in your area.
“If successful,” the story elaborated, “the project will divide the entire world into two zones of influence by two united systems: GLONASS-BeiDou and GPS-Galileo, operated by the U.S. and the European Union.”
Intriguing. Mind-boggling. With some initial smattering of verisimilitude.
I don’t want to say, “Yet in the end, spurious.” Because we haven’t yet reached the end. But indicators point in that direction.
What. The story claimed that “The countries will reportedly negotiate the merger in May at the International Conference on Advanced Technologies in Manufacturing and Materials Engineering in the Chinese city of Harbin, Izvestia daily reports.”
The primary reason for all GNSS and for GPS itself in the very beginning is military advantage. For these two superpowers in particular to share one military resource is unthinkable; for either to disclose aspects of its security and weapons guidance operations to the other, untenable.
Whence. Who is RT? According to Wikipedia, the outfit formerly known as Russia Today is an international television network funded by the Russian government, operating cable and satellite television channels and internet content directed to audiences outside of Russia. Based in Moscow, it presents around-the-clock news providing “a Russian viewpoint on major global events.” In 2008, Prime Minister Vladimir Putin included RT’s parent organization on a list of core organizations of strategic importance to Russia.
RT has been frequently described as a propaganda outlet for the Russian government and its foreign policy, and has been accused of spreading disinformation, broadcasting “materially misleading” content. In 2017, during the French presidential election, a spokesperson for successful candidate Emmanuel Macron said that both RT and the Sputnik news agency showed a “systematic desire to issue fake news and false information,” and banned them from campaign events.
Why. No one to whom I reached out in either Russian or Chinese government or satnav operations agency has returned any comment. Silence on all fronts.
We can only guess at the underlying reasons for this floated, unsubstantiated story. To stir things up, as has been done in other arenas by these same “news” actors. It’s just a bit stinging, and a bit scary, to find it in our own world of science and technology.
There is no evidence that any GLONASS officials have been in any way involved — there’s no evidence of anything at all, when you come right down to it. The development does not reflect favorably on the Russian news system, and it may be as well to take everything from Moscow with a barrel of salt until something more tangible emerges.
A GLONASS-M satellite is prepped for launched in February 2016. (Photo: Russian Ministry of Defense)
Tony Murfin Contributing Editor, Professional OEM & UAV, GPS World
As the days tick down towards the always-anticipated Association for Unmanned Vehicle Systems International (AUVSI) Xponential convention in Denver May 1-3, the unmanned vehicle industry is preparing once more for one of its largest exhibitions.
More than 750 exhibitors will be spread over a huge 370,000-square-foot exhibit floor at the Colorado Convention Center and 8,500 visitors from unmanned systems and robotics are expected to come to share ideas, gain insights and carefully examine the unmanned innovations on show.
STEM Outreach. This year the show will not only feature industry innovation and growth, but will also highlight resources for potential science, technology, engineering and math (STEM) graduates with interactive and engaging content, including:
A buildathon/hackathon to conceive, design and build inventions during a timed competition prior to Xponential. Final projects will be displayed on the Xponential show floor as a representation of innovation and collaboration.
A dedicated area in the Xponential exhibit hall will describe the STEM education programs and services supported by AUVSI and the AUVSI Foundation to foster and cultivate the next generation of innovators and leaders.
An area of the show floor will also showcase the winners of student robotics competitions.
Denver area high school students will be invited to tour the exhibit area to introduce them to emerging unmanned technologies and applications.
A reception at the show promises to mix young professionals in unmanned systems with seasoned industry leaders, and finally,
The Women and Diversity in Robotics forum will feature speed networking with leaders to review STEM opportunities for career-focused women and girls.
Survive and Thrive. Meanwhile, the Denver exhibition will demonstrate how the rapidly evolving world of UAVs has encouraged “survive and thrive” for those new entrants who together seem to have adapted to address almost any and all opportunities. We’ll mention a couple of examples here, and attempt to provide a better cross section of the huge number of companies and products present following the actual show.
For instance, one of the drawbacks for small, predominantly electric-powered, multi-rotor UAVs is that their endurance is limited. Providing longer duration operations may be outside their envelope — for such longer term things as providing temporary mobile-phone signal coverage, or police/agency reconnaissance/search, or for larger vertical inspection jobs.
Presumably, floating one of several available models of lighter-than-air, blimp-type UAVs might be more expensive or cumbersome than using a multi-rotor unmanned vehicle, so overcoming power-supply issues would seem to be key. One way to do this is to attach a strong tether bringing power up from the ground.
Orion UAS. The Elistair (France) Orion UAS will no doubt be featured on the company’s booth. This multi-rotor UAV has been developed for longer term aerial surveillance and telecommunications operations. Typical users include law enforcement, private and public safety, national security, asset protection, emergency communications and crisis management, so these tethered drones are deployed by police forces, public security departments, public and private security companies, and governments in more than 30 countries.
Photo: Elistair
The Orion UAS uses industrial components and system redundancy, including autopilot sensors, motors, power distribution and logic controls, and has an emergency parachute system. The patented micro-tether system ensures a stable platform supplied with continuous power from the ground to enable up to 10 hours of endurance. The mechanical structure of the drone is designed to sustain strong winds with maximum stability. With system redundancies and automated emergency procedures, the user is able to focus on safety-critical missions and data collection, while the risk of human mistakes is reduced.
The onboard camera has both FLIR and optical, enabling night/day surveillance with gimbal stabilization and low latency — the 30x optical zoom makes it possible to detect a moving person from kilometers away. And the tether system provides high-speed, interference-free data transmission so the system is also virtually undetectable. It’s easy to see why tethered drones are becoming more popular for security applications.
Identifying UAVs. At the FAA Unmanned Aircraft Systems (UAS) Symposium last week in Baltimore, a key issue discussed concerned remote identification and tracking of drones. It would seem that the FAA is about to announce a new rule that could eventually clear the way for drones flying over people and beyond line-of-sight of their operators — and this may be a key topic of discussion at Xponential.
The FAA rule appears to mandate that every drone should in some way communicate its identification — presumably its FAA registration ID — so that its operator could also be known.
One well-known company, Ford, has already announced that it has a concept using onboard collision lights on a drone to optically signal the 10-digit FAA registration number to the ground for capture and decoding. Maybe other exhibitors at the show will have other solutions — perhaps radio based? We’ll see.
Sensefly eBee drone.
Sensefly’s eBee. At the sensefly booth, we may also hear about several interesting announcements on recent drone applications:
Products on display will include the RTK/PPK-enabled eBee Plus professional mapping drone, the eBee SQ drone for agricultural applications and the albris mapping and inspection drone, as well as the senseFly S.O.D.A camera and GeoBase.
In addition, senseFly sales manager and GIS scientist Briton Voorhees will deliver a presentation titled, “Comparing workflow and point cloud outputs of the Trimble SX10 TLS and senseFly eBee Plus drone,” on Wednesday, May 2, at 11 a.m. in the Mapping and Surveying Track.
Booth visitors can also find out more about senseFly’s comprehensive 360 solutions, which are designed to improve operational efficiencies and support decision-making in the surveying, mining and quarries, agriculture and inspection sectors.
And many more. GNSS players also expected to be at the show include Hemisphere GNSS, NovAtel, Rockwell-Collins, Septentrio, Tersus, Trimble, Accord/Aspen Avionics, Comnav, Navtech, Swift and Topcon, as well as GNSS chip manufacturers u-blox and Intel — although Intel may likely focus on its UAV/communications offerings at this show.
There will also be a number of antenna suppliers, inertial sensor manufacturers, UAV autopilot manufacturers and several ancillary electronics and mechanical systems suppliers — all trying to solidify their positions in the UAV vehicle and systems integration supply chain.
The major focus, as usual, will be on UAV/UAS vehicle manufacturers and system integrators and their products — there is always a great exhibition of actual UAVs from all sectors of the industry.
So, along with a parallel program of educational presentations on a wide range of industry aspects, the AUVSI Xponential convention promises to have plenty of opportunities to find things of interest to almost anyone, and many areas to focus on for experts already in the industry.
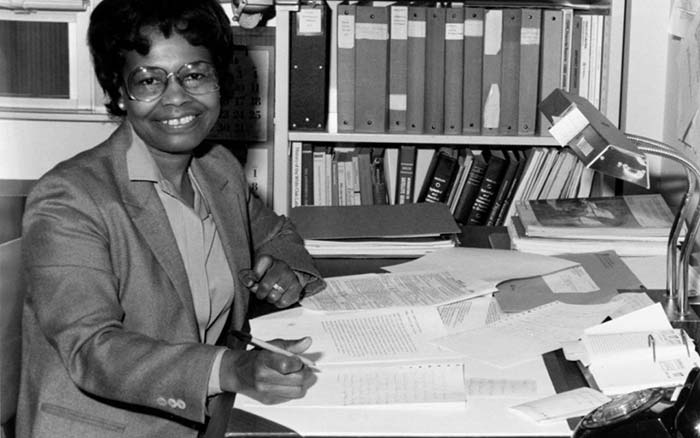
For Black History month in February, the Free-Lance Star of Fredericksburg, Virginia, profiled a woman few of us know about — Gladys West.
Capt. Godfrey Weekes, then-commanding officer at the Naval Surface Warfare Center Dahlgren Division, described to the newspaper the “integral role” played by West.
Gladys West’s work helped develop the Global Positioning System. (Photo: U.S. Navy)
“She rose through the ranks, worked on the satellite geodesy and contributed to the accuracy of GPS and the measurement of satellite data,” he said. “As Gladys West started her career as a mathematician at Dahlgren in 1956, she likely had no idea that her work would impact the world for decades to come.”
West collected data from the satellites, focusing on information that helped to determine their exact location as they transmitted from around the world. Data was entered into large-scale super computers that filled entire rooms, and she worked on computer software that processed geoid heights (precise surface elevations).
As a girl growing up in Dinwiddie County, Virginia, Gladys knew she didn’t want to work in the fields or a tobacco factory like her parents did.
“I was ecstatic,” she said of her career. “I was able to come from Dinwiddie County and be able to work with some of the greatest scientists working on these projects.”
Jim Colvard, technical director at NSWC Dahlgren from 1973 to 1980, knew West as a student in his graduate program and as a professional employee. “She was an excellent student and a respected and productive professional,” he wrote in an email. “Her competence, not her color, defined her.”
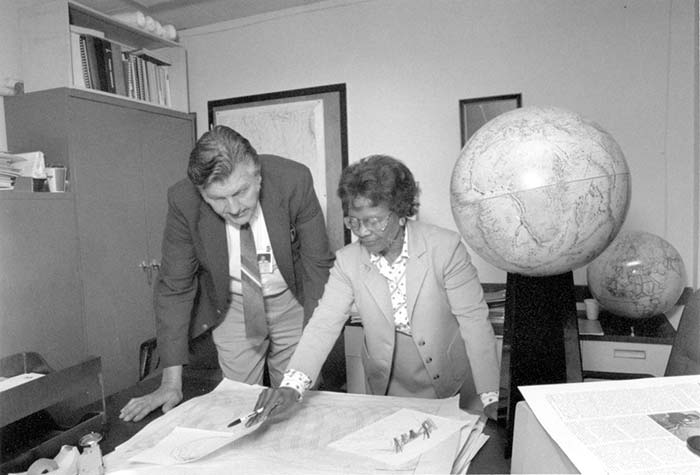
Gladys West, at Dahlgren with Sam Smith in 1985, looks over data from the Global Positioning System she helped develop. (Photo: U.S. Navy)
A: Anti-spoofing is a receiver function. It is the ability of a GNSS receiver to distinguish between actual navigation signals and false signals. Simulators allow a receiver developer to play “what if” games with their receiver. A simulator user controls every variable that a receiver processes. Time, satellite information and almanac are all specifiable.
A: With a simulator, a user may include spoofing signals in a variety of test scenarios. The results from the receiver under test may then be compared to the “truth” data available from the simulator, in order to demonstrate any susceptibility to spoofing. As anti-spoofing measures or product features are developed and applied, the same tests may be repeated, in order to evaluate the effectiveness of the countermeasures.
A: Since live-air spoofing is illegal, simulators provide a fully controlled and repeatable environment for evaluating spoofing resilience of algorithms and products. Newly available low-cost simulators may also reduce the overall cost and time, and increase the confidence level as well as reduce the environmental impact compared to having to go to a military test-range for live testing. Simulators also provide the ability to test spoofing scenarios that may not yet be possible with today’s technology, such as multi-GNSS spoofing.
A: Simulation is of great benefit when developing product features due to its repeatability. By replaying a consistent scenario, new products can have GNSS capabilities edge-tested for criteria such as receiver sensitivity, programming robustness and latency. Additionally, by replaying two scenarios created with signal-generator software on a multi-constellation simulator, starting at the same position and time and using the same constellation(s) but with one that diverges in position, spoofing vulnerabilities can be assessed.
A: One of the most effective methods for mitigating GNSS spoofing is spatial discrimination. This supposes two or more receiving antennas are used. To test such systems and help designers to tune their algorithms in a controlled environment, the spoofing and truth GNSS signals must be simulated by a wavefront approach. This ensures that the signals’ code and carrier-phase offsets at the antennas’ phase center will be a function of the relative receiver/transmitter geometry.
A: A flexible, high-quality RF constellation simulator provides the capability to model a multitude of scenarios in realistic environments. Users can configure signals and data to perform spoofing attacks, echoing both those observed and those purely theoretical today. Performing these tests via RF simulation provides highly controlled, repeatable system tests while providing flexibility to evaluate performance thresholds. The ability to assess risk and evaluate system robustness using simulation is vital in the evolving GNSS threat environment.
A: A spoofer is a simulator that has been modified to be a slave of a master system, which defines the signal and trajectory to be emitted. To test an anti-spoofing system, it is necessary to have two simulators: the first will emit the real GPS constellation and the second will emit the spoofing signal, which will be probably synchronized in time and position at the beginning, but with divergent evolution in time.
A: Simulation is currently the best method to develop and test anti-spoofing algorithms. To ensure realism, it is often necessary to simulate both the true and spoofed signals from separate simulators. This provides flexibility for the threat to be modeled differently than the real satellites, a critical nuance that is often overlooked. Without the repeatability and control that such simulation provides, it would be impossible to adequately test the anti-spoofing capabilities of a GNSS receiver.
While it sounded like good news at first, once the real results were plucked from the slurry, they resemble nothing so much as the same old uncertainties.
About the future of GPS III, I mean.
Additional money allocated by Congress to the Department of Defense budget — $80 billion on top of $549 billion for FY18 and $85 billion added to the $562 billion previously set for FY19 — alleviated longstanding worries about sufficient funding for GPS. The satnav system has always been at the mercy of raiding by other military programs, over budget and cash-strapped. At least that pressure will be off, we thought.
But money on paper does not always lead, expeditiously or at all, to boots on the ground or birds in the sky. The funds come with an enthusiasm for reorganizing everything. To streamline it, effectivize it, make it more…businesslike.
In the case of the Space and Missile Defense Command, this means eliminating three top-level decision-making positions, and designating someone other than the secretary of the Air Force as responsible for space budget prioritization.
Congress stopped short of its initial idea, which was to establish a whole new department for military space activities, separate from and equal to the Air Force. But there’s no doubt that the 2018 National Defense Authorization Act strongly rebukes the current way of doing space things in the Pentagon and the Air Force — while proffering more money to do them.
Like many announced initiatives to drain the swamp elsewhere, this one has just drawn in more murky water. It may take four or five years, according to some with Pentagon insight, to figure out new procedures, lines of command and the actual fulcrums of decision-making. In the meantime, matters will — you guessed it — slow down.
All this as the GPS III launch schedule and OCX next-generation ground-control readiness slide rightward, and military GPS user equipment can count on at least a decade to even partially update. Mind you, Increment I of the new M-code cards is not yet complete. Once it is, the three major contractors who have developed them will compete to sell their varying versions to the different branches of the military, the different arms of those branches, and the different weapon systems (716, by GAO’s count) operated by those arms.
The pursuit of increased resilience in space, clearly destined to be a contested domain in the event of large-scale international conflict, may actually inhibit itself in the near term.
As noted below, the previous wielder of this space has relinquished satnav matters to take up, as he says, “some unfinished business with life.” I owe him a great debt. He gave me my start here.
Glen Gibbons Retires
Glen Gibbons announced his retirement from active leadership of Inside GNSS magazine at the end of last year, when he wrote he was “promoting myself to Editor Emeritus.” Gibbons was editor of GPS World from 1989 to 2005, and editor and publisher of Inside GNSS from 2006 through 2017.
In 2003, he received the U.S. Institute of Navigation’s Norman P. Hays Award for inspiration and support contributing to the advancement of navigation. GPS World joins all those around the industry and the international GNSS community in recognizing and thanking him for his many years of coverage of and service to the field of positioning, navigation and timing.
Story maps combine geographic data withmultimediato tell a story and present information in a useful, interesting way.
While many story maps are designed for general, non-technical audiences, some story maps can also serve highly specialized audiences. They use the tools of GIS, and often present the results of spatial analysis, but don’t require their users to have any special knowledge or skills in GIS.
“Story maps use geography as a means of organizing and presenting information. They tell the story of a place, event, issue, trend or pattern in a geographic context,” explains Esri’s press staff in a blog. “They combine interactive maps with other rich content — text, photos, illustrations, video and audio — within intuitive user experiences.”
Haven’t yet dipped your toe into Story Maps? This Esri blog takes users through story map creation step by step.
Below are six visual narratives that provide timely information using Esri’s Story Map creation tools.
Faces Show Personal Impact of Opioid Epidemic
The National Safety Council is adopting the Celebrating Lost Loved Ones map, which allows family and friends of those lost to the opioid epidemic to place an image and description of their late loved one on an interactive map. The project helps raise awareness of the broad impact of the opioid crisis and advances the council’s mission of ending opioid deaths. Unintentional opioid overdose deaths totaled 37,814 in 2016.
Jeremiah Lindemann, a solution engineer for Esri, created the map in 2016 following the death of his younger brother. Since its launch, the map has gathered more than 1,300 memorials from people across the U.S.
The map has been a crowdsourced effort, allowing grieving friends and family members to honor their loved ones, share their stories with others and find a supportive community in return.
Communities Potentially Affected by DACA Policy Changes
When elected officials talk about changing our immigration system, just who and where are people affected? That’s the question Esri is trying to help answer with a new interactive story map that explores communities with the highest shares of non-citizen residents and DACA (Deferred Action for Childhood Arrivals) recipients.
The map shows estimates on DACA eligible, recipients, and annual GDP loss from removing DACA workers by congressional district. Data comes from USC’s Dornsife Center for Immigrant Integration.
The size of the symbol shows the estimate of DACA recipients, and the color of the symbol shows the estimated GDP loss from removing DACA workers. This map shows that the economies of many states in the Southwest and several major urban cities could be substantially disrupted if DACA recipients are no longer permitted to work.
The Ever-Changing Minimum Wage
National, state and local government policies toward the minimum wage vary widely and are continually changing. On Jan. 1, new or adjusted minimum wage policies took effect in 18 states and territories. Varying rates, policies, and impacts across the nation make it challenging to understand the minimum wage landscape.
This Esri story map provides an overview of the the nation’s changing minimum wage policies. A few notable findings:
At the highest level, the variability of minimum wage policies from state to state is striking — this ranges from some states in the South that don’t even require a minimum wage, to places like D.C. that have a $12.50 minimum wage (currently the highest for a state or territory).
Similarly, the number of cities and counties that have taken it upon themselves to raise wages locally is impressive; these cities and counties have robust plans for raising minimum wages over the next few years.
Regardless of an area’s minimum wage, all states fail to guarantee minimum wages that actually match up to the cost of living for their respective areas. As such, there is a growing divide between states that have raised minimum wages and are at least bringing minimum wages closer to the cost of living, versus those states that are slower to raise minimum wages (or don’t raise wages at all) and fall much further below the local cost of living.
Even while minimum wages have nominally increased, inflation has devalued the dollar in such a way that even in 2018 some wages today have less purchasing ability than nominally lesser wages in the 1970s.
Ireland Encourages Emmigrees to Come Home
Like much of Ireland, the history of County Donegal is inextricably wedded to the geography of migration. Now county officials are using a story map to try and woo émigrés back to the Emerald Isle.
The Irish government views the loss of its citizens so seriously that a minister for diaspora affairs was appointed to the Irish cabinet in 2014.
“Ireland’s Call — To Return Its Global Diaspora Home” displays key factors to assist those in contemplating returning. The story map launches the Global Skills Locator to link its global diaspora with job opportunities back home.
Smart City 3.0 Book Explained
Esri China (Hong Kong) Limited uses the story map tools in a unique way — to highlight its new book Smart City 3.0. The book and map discuss artificial intelligence, the internet of things, robotics and the sharing economy, and how all of them are shaping a new phase of development for the smart city.
Hurricane Harvey’s Lasting Effects
Within cities, poor communities often live in segregated neighborhoods with higher flood risks. This is especially true in Houston, where Hurricane Harvey hit this past August.
As in previous disasters like Katrina and Sandy, the heaviest cost of Harvey’s destruction is likely going to be borne by the most vulnerable communities in its path.
Humanitarian aid organization Direct Relief’s interactive Esri maps used the Centers for Disease Control and Prevention’s social vulnerability index to show the geographic distribution of households with elderly or disabled members (in orange), immigrant and limited English-speaking populations (in purple), and pockets of poverty (in green). The darker the color, the higher the concentration of these factors in each region.
Learn more about story maps and how to create them here.
“The blockchain cannot be described just as a revolution. It is a tsunami-like phenomenon, slowly advancing and gradually enveloping everything along its way by the force of its progression.” — William Mougayar *
A kidnapping in Kiev
War-torn and ragged, the once glistening jewel on the Dnieper River adorned in Christmas lights bustled with Yuletide celebration. But further from the city center, the streets were quieter, more demure as the dark night settled in. A black Mercedes Benz pulled up and parked along a poorly lit street. In the car sat four men wearing facemasks and carrying Kalashnikovs. In the cold Kiev night, they waited.
Across the street a large, husky man pulled shut the security curtain, turned out the lights and locked the front door of his store. He turned, his briefcase hanging at his side, and walked a few steps toward his car.
The four men crossed the dim street, forming a semi-circle as they moved toward the man. He slowly raised his hands. He was Russian; his accent gave him away. One of the four men placed a thick black bag over the Russian’s head. With gun barrels pointed into his back, he followed their orders, climbing into the back of the Mercedes Benz.
The four men got into the car and sped away into the cold, dark Kiev night. The man was Pavel Lerner, a blockchain expert and owner of a digital currency exchange in the Ukrainian capital. His captors demanded a ransom of $1,000,000 paid in Bitcoins, the highest valued cryptocurrency.
Three days later, on Dec. 29, 2017, safe and unharmed, Pavel’s abductors released him along an unmarked road in the middle of nowhere.
Cryptocurrencies and crime. Crimes involving cryptocurrencies have been increasing; perhaps the most widespread is hackers using ransomware demanding payment in Bitcoins. The worldwide WannaCry virus is the most pernicious of these attacks, costing hundreds of billions of dollars.
Other crimes of the more traditional variety are also on the rise such as kidnapping, as in the case of Chloe Ayling, a British glamour model held for $500,000 payable in Bitcoin.
Blackmail and money laundering are also on the rise; all of them are using Bitcoin as the currency of choice, as are black markets lurking on the darknet.
The fall of the dark web marketplace Silk Road netted unexpected surprises, capturing two rogue FBI Agents and a DEA agent found to be peddling in the underworld’s vast enterprise. Silk Road’s net worth when it was shut down was 614,305 Bitcoins.
As December 2017 came to a close and Pavel Lerner paid his ransom, the value of one Bitcoin peaked at $19,843, making Silk Road worth $12.2 billion and the Dread Pirate Roberts the second wealthiest criminal in history. Ross Ulbricht, the creator of Silk Road, is serving a life sentence.
The 2015 documentary Deep Web describes the government’s takedown of Silk Road. View the trailer below.
When currencies fail
Governments have always been slow to act, or at least slow to comprehend. Such is the case with cryptocurrencies. The government sees the phenomenon as a mechanism supporting criminal enterprise, but the trending use in digital currencies represents a seismic shift in the way people think about money and where they are placing their trust.
There is a decline in the faith of fiat currencies as the countries backing them fall into mounting debt. Concern is fueled by the instability of national and international politics and the threat to the U.S. dollar by the unraveling of the petrodollar.
As well, the euro has been hit by wave after wave of bad news by the economies of Greece, Italy and Portugal and the so-called Brexit, as the United Kingdom withdraws from the European Union. What does that spell for the future of the euro?
Plus, with sanctions, Russia’s Ruble has lost 50% of its value since 2013. The farcical worthlessness of a Zimbabwe 50 trillion dollar note proves there is no limit to the loss in value a fiat currency can suffer when it implodes.
Photo: iStock
Venezuela’s currency collapse. And now, Venezuela is in a plummeting currency death spiral, officially falling in value from a par of 10 Bolivars to equal one U.S. dollar to 25,000 bolivars, all in the month of February. Unofficial reports are that the value has sunk to 230,000 bolivars to the U.S. dollar.
As of Tuesday, Feb. 27, in a desperate attempt to salvage itself, Venezuela announced an initial coin offering (ICO) for a national cryptocurrency called the petro. The irony in this is that the digital currency will probably survive because it’s on the blockchain, but Venezuela will not.
If anyone wants to learn about what happens when a nation’s currency collapses, Venezuela is a terrifying case study. It is no wonder people around the world seek refuge in an asset that promises freedom from government meddling. It is also no wonder governments are terrified of blockchain’s potential, yet fascinated at the same time, like so many other technologies holding great power for both good and evil.
There is a stalemate of sorts, a stand-off between those early adopters with the courage to invest and risk it all for the hope of great fortunes, and governments who hold the power to regulate, fine, confiscate and imprison. Tension separates both sides. Who will budge?
The United States and Europe have so far been measured in their response, while China and South Korea are cracking down on cryptocurrencies. Most people, curious and cautious, sit waiting it out. These stories represent the darker side of bitcoin, blockchain and the rise of cryptocurrencies, but there is another side, the more benevolent, useful and hopeful side.
What are cryptocurrencies?
Unlike gold, which has traditionally been considered a store of value, cryptocurrencies have no physical existence. They are digital assets held in a digital wallet. They are an asset with a finite number of tokens. They are driven purely by supply and demand. If there is a greater supply than there are traders, the value is next to nothing as there was in 2009 when Bitcoin first came into existence.
May 22, 2010, marks the milestone when a digital currency first purchased something in the physical world. Two pizzas sold for 10,000 Bitcoins. Now, there are more traders than tokens, and the demand has driven the value to unprecedented heights. One Bitcoin was worth $19,499 on Dec. 15, 2017.
Bitcoin is the most explosive financial instrument ever created. But Bitcoin is not the only digital currency. In all, there are more than 1,800 cryptocurrencies. The term “crypto” implies they are secretive and have a layer of anonymity, but there is an irony. Cryptocurrencies are based on blockchain technology.
Blockchains have an unalterable integrity system built into them, leading to the adage “What happens on the blockchain stays on the blockchain.” That creates a conundrum and begs the question, just how is it that what provides a veil of secrecy also holds the promise of open transparency?
Blockchains
Image: iStock
To answer that question, we need to explore blockchains. What exactly is a blockchain? A blockchain is a digital, decentralized, distributed, open and immutable ledger. Each transaction has a string of characters called a hash. Each hash includes a date/time stamp, a unique ID, a code linking it to the previous hash, and a private key identifying ownership, albeit anonymously.
Each transaction is another link in a chain that can be traced backwards to the previous link, all the way back to the origin of the entire chain, called the Genesis Block.
What makes the blockchain decentralized is no single computer or entity controls it. Hundreds and thousands of computers make up a blockchain network. Each computer is called a node. A blockchain is distributed because all the nodes work together in a peer-to-peer network. Nodes on a network record each transaction, and these transactions are mirrored on every other node throughout the network.
The transactions can be accessed and downloaded from any node on the network. This makes a blockchain an open and distributed ledger. When a node is out of sync with other nodes on the network, it is rejected until it is reset to match the other nodes. That makes it impossible to alter any records, making a blockchain immutable.
For these reasons integrity, is built into the blockchain. Anonymity is provided by a private key that ties it to a digital wallet that can only be accessed by the owner. The digital wallet connects to the owner, but not the blockchain itself. As a result, a blockchain identifies what, when and who about each transaction. A blockchain does not provide where the transaction occurred.
At this time, blockchains lack a geospatial capability.
“Anytime there’s some data that needs to maintain its integrity, blockchain is definitely there. Essentially, what you would do is get the hash and you would have a hash key and then any changes or alterations are made fully aware at all times.” — Reem El Seed **
Geospatial blockchain benefits
Image: FOAM
A company called FOAM is working to change that, creating a geospatially enabled blockchain using a crypto-spatial coordinate (CSC) system. Location in a FOAM blockchain doesn’t just record a specific time, it also validates proof of location and gives a spatial context that regular blockchains lack.
This functionality creates an immutable digital connection to the physical world. Kristoffer Josefsson, CTO of FOAM Inc., confirms this, saying, “We can securely connect offline spaces to online assets.”
If digital currencies based on blockchain technology are going to be considered a safe and viable medium for conducting business, they must include location. Blockchain’s abilities are what the world needs to curtail crime and corruption and be able to follow the money trail from whom and to where it flows.
“This is what we are working on at FOAM and believe that such a system is needed as a crucial infrastructure in our decentralized future and can open new marketplaces of privacy preserving location data.” — John Ryan King, CEO, FOAM Inc.
Adding a geotag to a blockchain is like adding ribonucleic acid to a cell bringing it to life. Something can’t exist until it exists in time and space. A blockchain with a geospatial tag makes that possible and allows mapping of events in a temporal sequence. This inhibits criminal activity.
If a crime were committed using a geotagged blockchain, the location of the crime would immediately be known. The hash code from the blockchain would be extracted with a date/time/location stamp and would be flagged on the network to all the nodes, making that hash code “hot.” A hot blockchain means that particular hash in the chain would be monitored. If it were involved in a transaction, an alert would be broadcast throughout the network, focusing on the location.
Security cameras and other assets would converge, putting eyes on the target, and the transaction would be rejected. Authorities would then be able to trace the digital wallet’s owner like running license-plate tags for a car, and, shortly thereafter, descend on and apprehend the offender.
Did George Orwell dream the dream we are now living, “Big Brother is watching you,” while he himself mocks us from his eternal sleep?
Empowerment with location. Mansour Raad, senior software engineer and Big Data advocate at Esri, sees location-enabled blockchain opening up opportunities for people to interact with their representatives. He is excited about the prospects saying, “We can envision dozens of potential use cases in geospatial contexts, from fine-grained citizen engagement in smart-city initiatives through to activity-based military intelligence applications.”
Certainly, this is a more empowering view. Some of the largest companies in the world are also exploring uses for blockchain and geospatially tagged ledgers. This mass effort and focus on innovation will have some magnificent results.
Mansour goes on to add, “The influx of companies like Boeing and Lockheed Martin and forward-thinking communities like Dubai are searching for blockchain-based solutions to their problems.” This will drive innovation. Both ends of the spectrum are there, from the frontline developers to the back-end buyers with large pockets.
Latitude and longitude has been the backbone of location and navigation for more than 2,000 years, when people navigated primarily by landmarks and the stars. That worked well for those not venturing beyond their familiar locales; but as knowledge of the world expanded and monarchs ruled larger and larger empires, and trade spread to further and further regions, and wars and conquest extended to unknown realms, maps were necessary. A grid system for maps was created by Hipparchus, another of those great Greeks upon whose shoulders the world still stands. That coordinate system, known as latitude and longitude, has served well for two millennia, but the digital age demands another solution.
And so it is with change. It happens over many years, but the transformation happens all at once. The change has been taking place for years with location-based formats such as the Military Grid Reference System (MGRS) and the more universal digital Degrees Minutes Seconds (DMS) supporting GPS-based systems, as well as the more novice friendly what3words (W3W), which is especially useful for disaster-relief operations. All of these serve their purpose, but fall short of providing a concise code that is critically important to make geotagging a blockchain possible. That is of great value considering blockchain’s potential in logistics and transportation, both of which are dependent upon precise location data.
Photo: Port of Rotterdam
Add the growth of IoT (the internet of things) and one gets a sense of the demand for a location-based blockchain and how enormous such a system would be. The Port of Rotterdam, Europe’s largest shipping facility, is testing blockchain for logistics. Companies like Ford, IBM and PwC also are looking at its potential.
Mansour Raad adds, “Some data scientists see a benefit to utilizing an addressed reference system such as the Open Geospatial Consortium Discrete Global Grid System (OGC DGGS), due to its holistic ability to fit into existing hashing algorithms. This also turns map algebra into map-set mathematics with drastic advantages to speed, computational resource usage and distribution.”
Get ready! Blockchain is a disruptive technology. It is so powerful that it is difficult to predict its impact, but it will touch everything.
“The old question ‘Is it in the database?’ will be replaced by ‘Is it on the blockchain?’” — William Mougaya
Governments will be more accountable to the people tracing where their expenses are actually going. The government could post an annual tax bill for each person online that could, in theory, show each taxpayer where each dollar was spent. This is an empowering new model for transparency.
A digital wallet is virtual, but it can be connected to the physical world through a smart key, like a SIM card. And, if the blockchain were geospatially enabled, it would create a layer of security preventing any use if the owner of the digital wallet were not nearby. That’s automatic two-step authentication.
A geospatially embedded blockchain could make that possible. Cash can transfer hands and no one is any wiser about where the money came from, but transfer a blockchain-based currency and the new owner is part of the permanent record.
Tough on crime. What would that do to crime? How would it affect blackmail, kidnapping, human trafficking? Perhaps the smart key is attached to the owner’s cellphone, or a smart watch, or a smart ring? Most likely it would be a smart chip implanted in the owner’s arm or thigh.
A smart chip implant. (Photo: Escape Alert, LLC)
The technology would also be useful for password tokens, building access security cards, passports, etc. It holds great promise for warding off theft and increasing security.
Uses for a blockchain extend beyond currency and are not necessarily associated with financial transactions. Transactions are events: a download is a transaction; clicks on a webpage are transactions; passing through a checkpoint is a transaction; an image capture is a transaction; IoT-triggered events are transactions; and electronically signing a document is a transaction. Blockchains can be coded into software to track downloads of digital copies such as songs, movies, audio, video, images, programs and documents. The obvious implications are copyright protection.
Blockchains can also provide information security for trade secrets, military secrets and even national secrets. Companies that contract to the government would be able to lock their trade secrets from hackers and spies by controlling digital copies with a blockchain. A geocoded blockchain could encrypt data outside of geospatially approved areas or if accessed by anyone other than approved private keys. The contents of secure packages could never fall into the wrong hands even if the package was intercepted. The encryption could not be unscrambled without being in the proximity of the smart key.
Additionally, every download would record what, when, who and where any attempts at access occurred. Blockchain technology also enables smart contracts such as medical records, land ownership records, shipping manifests and notaries. Blockchains can be made a part of physical inventory.
Geocoded-embedded blockchains make asset management more secure, restricting transactions to within specific locations. This would be beneficial in a store for controlling inventory, or at a facility for tracking movements of assets, whether the facility is a military installation, an industrial complex, a government facility, a school campus or a penitentiary. In the case of a penitentiary, the prisoners themselves can be tracked.
Closing Thoughts about Blockchain
“In a time of deceit, telling the truth is a revolutionary act.” ― George Orwell
Elections. In a free republic, the integrity of elections must be protected and made fully transparent. Geotagged blockchain election ballots would be an immutable record of the election. A little geospatial analysis could easily detect locations with multiple votes making it highly suspect for voter fraud. Add the requirement to have a private key associated with each voter and voter fraud would be eliminated.
One of the benefits would be eradicating the months of post-election bickering wasting time, tax dollars and sanity. It’s hard to argue with a transparent, decentralized, distributed and immutable ledger; so, no matter which side of the political divide someone is on, removing reasons for conflict should benefit everyone.
Immutable record. If you look at the non-stop news cycle about the government missing texts, missing emails, possible collusion, a dossier, possibly two, and who knew what, and when did they know it, all of that could be resolved with blockchain technology. An immutable record would make it nearly impossible for anything to come up missing, and a geospatially tagged blockchain would show exactly who knew, what they knew, and where they were when they learned it. Deception would be made much more difficult.
Blockchain has the potential to sterilize corruption in politics. The ideal for an open and transparent political system is worth holding on to.
Learn about blockchain, because it will become more and more prevalent in conversations, on television, in movies, and on the news. I hope this article helped shed some light on the technology and its future and the advantages of adding a geospatial component to a blockchain.
* William Mougayar is the Voltaire of the blockchain revolution. He applies his visionary intellect to the merits of a trust-based, information-sharing system prescribing it a cure against the ills of business, politics and society. Mougayar is stoking the coals of the digital transformation just as Voltaire helped light the torch of the French Revolution.
** Reem El Seed is the coordinator of the Blockchain Users Group for the Washington, DC Chapter. She is a prodigious and enthusiastic proponent of blockchain and cryptocurrencies and a well-known figure in the Washington, D.C., area.