Trimble has acquired Axio-Net GmbH from Airbus Defence and Space. Based in Hannover, Germany, Axio-Net is a provider of GNSS corrections and professional data services serving Germany, the United Kingdom and Benelux. Financial terms of the transaction were not disclosed.
Axio-Net, founded in 2008, delivers both real-time and post-processed network real-time kinematic (RTK) solutions to a broad range of users including surveyors, GIS professionals and farmers. In addition to traditional correction services, Axio-Net performs a variety of data-based professional services for the geospatial market, including coordinate transformation services as well as network set-up, configuration and operations consulting.
“Our philosophies are highly complementary and together, we will extend Trimble’s position as a global leader of GNSS corrections,” said Patricia Boothe, general manager of Trimble’s Advanced Positioning Division. “We are committed to supporting Axio-Net’s brand-agnostic position, while we leverage their experience with professional services, not only in traditional markets such as geospatial and agriculture, but in emerging high-accuracy GNSS markets such as automotive.”
Eos Positioning Systems has announced that its Arrow series of GNSS receivers is compatible with Esri’s Collector for ArcGIS running on iPads and iPhones. The Arrow receivers have been tested and certified as high-accuracy GNSS receivers compatible with Collector 10.4.0 for iOS.
The full range of Arrow GNSS receivers from sub-meter to decimeter to centimeter RTK accuracy all work flawlessly with Collector for ArcGIS running on all iPhones and iPads running iOS 8.x or later, according to the company. GNSS metadata — including estimated accuracy, correction status, correction age and number of satellites used — is displayed in real-time in Collector, so the user can monitor data quality in the field.
“We worked closely with Esri during their development of Collector to ensure the best high-accuracy GNSS user experience with the Arrow GNSS series receivers, and I think we’ve achieved that,” said Eos CTO Jean-Yves Lauture. “Whether it’s our Arrow Lite, Arrow 100 or Arrow 200 receiver, they all work smoothly with Collector for iOS for sub-meter, sub-foot, decimeter and centimeter accuracy.”
Eos Tools Pro.
As a companion software to Collector, Eos offers a free iOS app called Eos Tools Pro that allows the user to connect to an RTK network and to set alarms for estimated accuracy, HDOP, correction age and others. If a threshold is exceeded (such as estimated accuracy greater than 10 centimeters), an alarm sounds on the iPhone or iPad to alert the user.
“We have tested Arrow receivers and confirmed that Collector for ArcGIS (iOS) is completely compatible with the Arrow GNSS series receivers,” said Esri Product Manager Jeff Shaner. “The tight integration between Collector and Arrow GNSS receivers really enhances the high-accuracy user experience, and during our recent beta program, customers like Le-Ax Water District have shared their success using Collector and the Arrow receivers.”
Collector for ArcGIS (iOS) is a geographic information systems (GIS) data collection program that runs on iPhone and iPads. It records data directly, in real time to ArcGIS Online, Portal for ArcGIS and ArcGIS Server at sub-meter, decimeter and centimeter accuracies when using the Arrow GNSS receivers. No post-processing or other specialty software is required.
Collector 10.4.0 can be configured to automatically transform between horizontal datums on-the-fly, so no matter which datum the user’s GNSS data is referenced to, it can be configured to be compatible with the user’s geodatabase, and Esri provides scripts for transforming between vertical datums when back in the office.
Eos GNSS Tools and Arrow receivers are targeted at high-accuracy applications such as GIS; environmental monitoring; agriculture; electric, gas, water utilities; surveying; machine control; and federal, state and local government.
All-in-one time-and-frequency master time and clock server
Spectracom’s VelaSync time server and grandmaster clock.
When the VelaSync time server platform was introduced in 2014, it met the needs of financial trading networks’ move to 10 gigabit-per-second networking. Now available with 40-GbE network interfaces, it offers high-performance synchronization for time-sensitive networks. Matching network speeds between timing and data on a single low-latency high-throughput network enhances synchronization accuracy and eliminates queuing delays and hidden time errors caused by slower connections. The availability of a network timing appliance with 40-GbE interfaces benefits any deployment of critical network infrastructure at high data rates.
The TW3970 / TW3965 antennas have superior cross polarization rejection to enhance multi path signal rejection, tight phase center variation and an excellent axial ratio. The TW3970 is a pole mount or through-hole mount antenna; the TW3965 is an embeddable form. Bothemploy Tallysman’s Accutenna technology and are capable of receiving GPS L1/L2/L5, GLONASS G1/G2/G5, BeiDou B1/B2, Galileo E1/E5a+b plus L-band correction services (1164 MHz to 1254 MHz + 1525MHz to 1606 MHz). The antennas are designed for precision agriculture, autonomous vehicles and other precision applications. The ability of the antennas to access L-band correction services extends its utility to a wider range of applications.
The Tactical Series of inertial navigation systems (INS) is a next-generation family for high performance. Built on a common tactical-grade proprietary micro-electro-mechanical (MEMS) inertial sensing core, the Tactical Series includes the VN-110 inertial measurement unit and attitude heading reference system (IMU/AHRS), the VN-210 GPS-aided INS (GPS/INS), and the VN-310 dual-antenna GPS/INS. The Tactical Series offers the same functionality and features as the Industrial Series for integrators of SWaP-C (size, weight, power and cost) constrained manned and unmanned systems. The Tactical Series takes advantage of the latest developments in solid-state MEMS technology to incorporate a three-axis gyro with <1°/hour in-run bias stability, leading to an attitude accuracy of 1 to 2 milliradian. In addition to the improved IMU core, the Tactical Series enclosure is designed to DO-160G airborne standards and rated IP68 for deployment in harsh and extreme environments.
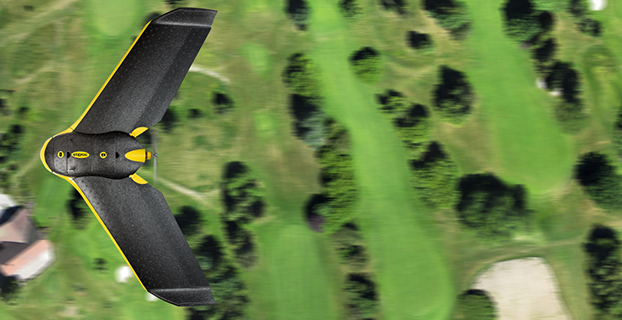
Plug n’ fly control system for UAV, UAS, USV and UGV systems
Veronte Autopilot is a miniaturized fail-safe avionics system with an embedded suite of sensors and processors for advanced control of unmanned systems. The OEM version weighs 90 grams, and the version with an aluminum enclosure weighs 200 grams. Both versions include a datalink radio. The control system is fully configurable — payload, platform layout, control phases, control channels and the user interface layout can be user defined, making it cost effective for a wide range of professional applications. The embedded GPS module offers RTK-like positioning with centimeter precision. It meets DO-178C / ED-12, DO-254 and DO-160G aircract regulations.
Critical coverage for autonomous driving development
TomTom’s HD (high-definition) Map and RoadDNA are highly accurate digital map products helping automated vehicles precisely locate themselves on the road and plan maneuvers, even when traveling at high speeds. These technologies are being rolled out in strategic geographies and are the subject of key partnerships with other automotive suppliers. TomTom now offers more than 122,000 kilometers of HD Map coverage globally, including Interstates in Connecticut, Delaware, District of Columbia, Georgia, Idaho, Kansas, Louisiana, New Hampshire, New Mexico, North Carolina, Ohio, Pennsylvania, Rhode Island, South Dakota, Tennessee, Texas, and Vermont; Interstates and highways in California, Michigan and Nevada; and the Autobahn network in Germany.
Applications range from infrastructure to infotainment
Smart Antennas by Laird Technologies combine antenna elements and radio receivers in the same robust package. Compared to traditional architectures, the Smart Antenna provides signifcant performance improvement and system-wide cost savings. Custom solutions are available, including 4G LTE cellular, GNSS, Wi-Fi and Bluetooth, as well as the emerging dedicated short-range communications (DSRC) technology with a 1,000-meter range for V2X. Applications include navigation systems, vehicle-to-vehicle communication,vehicle to infrastructure communication and infotainment. Operating temperature range is –40 C to 85° C.
The CEESCOPE-USV is a waterproof one-box echo sounder, GNSS and broadband radio telemetry package that can be installed on practically any remotely operated unmanned surface vehicle (USV). The self-contained unit requires no interface with the USV, eliminating challenges of instrument data integration on the vehicle. Using real-time broadband radio telemetry, detailed 20-Hz dual-frequency soundings, up to 20-Hz RTK GNSS and a 3200-sample-per-ping digital echogram are available to the USV operator on shore via the CEE-LINK radio base station. Data from the CEESCOPE-USV telemetry link allows the operator to steer the USV along the survey line like in any manned boat survey. The CEESCOPE-USV offers users a range to their vehicle of more than 1,000 meters.
The new ALS80-UP airborne sensor enables even more flexible data acquisition with extended range measurement capability. It takes advantage of the dual-output optical system pioneered in the ALS70 and enhanced in the originl ALS80. The AL80-UP has higher Multiple Pulse in Air (MPiA) operation settings, enabling data collection in extreme terrains with minimal variation in swath width due to terrain elevation variations. The ALS80-UP works perfectly in a wide variety of scenarios, including wide-area mapping, detail mapping from high-flying heights and detail mapping over mountainous terrain. With its expanded maximum range, the system has demonstrated good results at up to 6,000 meters above terrain and with terrain relief of up to 2,300 meters.
The Settop Repeater allows rover-RTK network users in areas of low or no GSM coverage to receive differential corrections via radio. It can connect to any external radio model on the market for precision agriculture systems or machine control. Repeater field application versatility is managed by an intuitive software controlled using a touchscreen. It can also be used for land surveying and marine work. It reduces the need for an RTK base station and offers flexible field configuration.
Expanded toolsets and capabilities for speed and accuracy
FieldGenius 8 software takes advantage of the high-power processors, high-definition displays and larger memory in modern Windows Mobile powered data collectors and Windows 7 powered tablets. It provides tight control through expanded toolsets. Features include easy GNSS local transformation with the ability to export and import localization files; enhanced DXF support; advanced point averaging, which allows users to take multiple GNSS measurements and calculate an averaged position; support for integrated inertial sensors; native unicode support;and simplified GIS mapping. FieldGenius 8 also has improved road alignments, an onboard basic measurement mode, dynamic screen rotation and expanded ASCII export options. Supported coordinate systems, geoids, instruments and data collectors have been expanded, making it easier to integrate into existing survey operations.
The FLIR Vue Pro R adds radiometric functionality to the Vue Pro camera, giving drone operators the ability to save pictures for post-flight image analysis and accurately measure the temperatures of individual image pixels. Calibrated radiometric imaging allows it to capture the temperature data of every pixel in an image. When saved in Radiometric JPEG format, still images can be imported into FLIR Tools software for detailed analysis and reporting. FLIR Tools, a free download on FLIR.com, lets drone operators adjust settings including object emissivity, background temperature, target distance, relative humidity and thermal sensitivity, as well as assigning various color palettes for each image. The Vue Pro R records digital thermal video, along with radiometric thermal still images, to an on-board micro-SD card. For applications such as electrical inspection, infrastructure assessment and precision mapping, the onboard recording allows operators to capture high-quality thermal data for post processing and analysis.
Reconnaissance for disaster relief, time sensitive situations
The Digital Mapping Reconnaissance Toolkit (DMRT) creates up-to-date orthomosaic maps and 3D models. Users can fly a drone to survey the landscape for real-time solutions, and geotag reference points in impacted areas without a time lag. Seeing what the drone sees, pilots can create search patterns and map with situational awareness. Modular aerial and land-based solutions are available.
Skyward and senseFly are partnering to deliver a custom operations management software and consulting services package for senseFly aircraft.
The package, available for customers in North America through the senseFly distribution network or Skyward, gives operators a preconfigured Skyward account with senseFly flight log import, senseFly manuals, customized preflight checklists, and other information specific to senseFly operations.
These features are part of the Skyward drone operations management platform that includes up-to-date airspace information and tools to plan and log flight; manage personnel, equipment and flight hours; and meet regulatory reporting requirements.
Customers will also have access to a team of regulatory and drone operations experts and benefit from Skyward expertise to define their flight operations procedures and write related operating manuals.
“Ensuring the highest level of safety and ease of use has always been essential in the design of our lightweight drones,” said Jean Christophe Zufferey, senseFly CEO. “By providing easy access to Skyward, we are now extending this seamless experience toward operation and fleet management. Our professional customers will get an elegant and efficient way to keep up with the constantly evolving regulations, while making sure they operate their fleet of drones efficiently and in full compliance.”
Operators using Skyward and senseFly together are able to meet regulatory compliance and insurance requirements. The partnership will create an end-to-end solution that delivers professional results for drone operators in mapping, surveying, GIS, industrial inspection and agriculture.
“Businesses operate drones because they return value, and senseFly builds some of the best professional drones in the industry to provide that value,” said Jonathan Evans, Skyward CEO. “Many of our customers are flying eBee and albris drones already because, quite simply, they get the job done. We will continue to deepen the technical integration across our platforms to provide a seamless and elegant user experience for our joint users.”
Alaska. “The Last Frontier” is a fitting slogan for this great land. The rugged terrain and harsh winters make an environment that only the bravest inhabitants can stand. Here, one of the latest surveying battles is being fought; not between land owners, but within the professional surveying community itself and pitting technology against historical tradition.
In the beginning…
The United States agreed to purchase Alaska from Russia in 1867 for $7.2 million dollars, or about two cents an acre. In 1959, Alaska, with a land mass larger than Texas, California and Montana combined, became the 49th state in the union.
For the professional surveyor, more than 20 million acres of federal government land is scheduled to be measured and divided for conveyance to the state for eventual sale to private individuals.
Surveying can be a challenging profession, and creating new townships in Alaska is no exception. In addition to the difficult environmental conditions, new procedural and technological advances are contesting historical means and methods of the creation of newly surveyed township tracts. The two main items are:
establishing coordinate values at corners instead of setting monuments.
GNSS and potential issues with atmospheric interference and lack of satellite coverage.
We will discuss the challenges ahead for the future of surveying in Alaska and how it will affect parcel division. While it is too soon to know whether or not this will bottleneck sales of parcels to new landowners, it does bring many technical and procedural questions for surveyors to the forefront.
Challenging historical methods
From the early days of our new nation, surveyors from the Bureau of Land Management (BLM) followed long standing procedures and placed retraceable monuments at various intervals along township boundaries for tract establishment, with two mile intervals being the predominant length for parcels in Alaska. The position of these monuments are held by subsequent surveyors to retrace these tracts for the state or individual owners.
During the course of the original field surveys, crews tasked with establishment of the new corners will note natural and artificial features for reference to these new parcel lines. These features may be trees or forestry lines, streams and rivers, mountains or glaciers. Because of these environmental challenges, these surveys take a great deal of time and effort to traverse through the difficult Alaskan wilderness.
However, the physical act of performing the survey is the only way to establish accurate ties to features found along the way. Surveyors will establish permanent markers at the chosen intervals along the township lines with measurements to nearby features for future retracement. Once placed, the monument becomes a corner for the township parcel and its position holds over any distance or angular measurement to other monuments or reference ties.
Performing these surveys is very costly and takes a great deal of time, so finding ways to reduce the budgetary expenditure for this task has been a priority for the BLM. Modern equipment and technology has improved efficiency and cut down on some necessary manpower, but it still takes a significant number of people to traverse through the dense areas of Alaska.
The BLM has proposed the following changes to establishment of township and section corners during property establishment through a system referred to as a “Direct Point Positioning Survey” (DPPS):
Implementation Direction: When preparing official surveys for areas of land selected by the State of Alaska pursuant to the Alaska Statehood Act, exterior boundaries of the selection area will be shown on the official plat by combinations of dependent resurvey, incorporation of record surveys where closure is met, and original survey. For original surveys, all angle points along the exterior boundary of the selection area shall be marked on the ground with a physical monument and shown on the official plat by reported coordinate and reference relationship to the NSRS datum and existing control stations. When deemed appropriate and directed in the Survey Special Instructions, other corner positions along, or internal to, the exterior boundary of the selection area can be reported and fixed by measure using reported coordinate and reference relationship to the NSRS datum and existing control stations and other marked corners of the survey with reported coordinates on the official survey plat. For surveys conducted using DPPS methods, if a corner is not marked with a physical monument, the geographic coordinate reported on the official survey record as fixing the corner location shall be accepted as the only evidence of the original corner position. For corners marked with a physical monument, the geographic coordinates reported on the official survey record shall be accepted as collateral evidence of the original corner position; the actual monumented location will remain the best evidence of the original corner position.
The BLM goes on to state the following conditions for implementation:
Ease of unofficial location of boundaries on the ground by using satellite positioning in mobile devices for groups like miners, oil and gas lessees, recreational users, prospective land owners, etc.
More economical future legal surveys when the need arises to mark the corners of property boundaries
A clear plan for future surveys that will allow efficient procedures for private land surveyors.
Reduced boundary uncertainty and costs due to monument destruction or disturbance.
Compatible and accurate boundary framework for GIS and other geospatial databases.
DPPS methods generate a greater certainty of comer positions and they are correct, consistent and repeatable.
DPPS methods introduce an economy of resources in the future for leaseholders and landowners when additional parcel boundary demarcation is required because geographic coordinates referenced to a known national datum are directly reported on the survey record and do not need to be calculated from the legacy measurement of bearings and distances.
Adoption of DPPS methods avoids spending substantial funds on unnecessary procedures like recovery, maintenance and rehabilitation of physical monuments in future survey work.
Surveys conducted using DPPS methods can be completed much more quickly than surveys completed using historical methods, thereby facilitating quicker patent to the State.
These new policies are reshaping not only how traditional surveyors perform their craft, but also flies in the face of more than 200 years of boundary establishment and case law determination of property rights. Surveyors follow a strict guide when evaluating evidence in legal descriptions and/or property boundaries:
Priority of Evidence Rules:
Possessory Evidence
Seniority of Title
Documentary Evidence
a. Call for a survey
b. Call for monuments
i. Natural
ii. Artificial
iii. Record
c. Distance (or Direction)
d. Direction (or Distance)
e. Area
f. Coordinates
Coordinates have historically always been the last resort for corner positioning and/or retracement use, yet the BLM feels that GNSS measurements have increased in reliability to a place where they can be more heavily relied upon for establishment of section corners and other significant points. This is where the second issue comes to light: positional accuracies using satellite-based measuring devices at high latitudes.
GNSS measurement and environmental challenges
For most of us “regular” surveyors in lower latitudes, our GPS/GLONASS measuring equipment operates with little to no trouble. Newer receivers are taking advantage of not only the U.S. and Russian satellites, but will eventually use the European Union Galileo satellites, China’s BeiDou, the Japanese QZSS and India’s IRNSS. Once these additional systems are operational, achievable accuracies worldwide will increase dramatically but we are still several years off.
The issues GNSS users in higher latitudes face are not only lack of satellite coverage, but several factors of environmental interference within the atmosphere. The result of these conditions and hazards are scintillation, positioning errors and cycle slips. These are very difficult to predict, thus increasing data-collection time and efforts to catch potential errors.
Scintillation occurs when rapid changes in amplitude and phase are observed and directly impacts the signal from the GNSS. Solar radio storms (caused by coronal mass ejection), large- and small-scale ionospheric structures (causing unpredictable values in environmental electrons) and geomagnetic activity (aurora) are also factors that affect signal, create cycle slips, and thus deteriorate the positional accuracy.
Studies performed by several technical teams (including NOAA/NGS) have shown that variations in position occurs often at CORS stations with little or no warning. Ongoing studies are helping to establish potential patterns in the atmospheric intruders, but will require much more analysis.
Some of these issues will be solved with more satellite coverage from the pending systems, but it will also require additional monitoring equipment to help forecast when potential environmental factors are about to occur. These systems will take time and money to develop, and thus increase the budgetary requirement for a new surveying procedure that was planned to save time and money.
But what does this all mean? From the historical side, placing monuments only at perimeter corners and not at township and section corners will place an extraordinary burden on future surveyors to “follow in the footsteps” of the original surveyor.
This flies directly against the duty of the retracement surveyor, so that alone will be a challenge. Studies have shown the instability of GNSS-derived accuracies as performed by highly trained scientists who are well educated at atmospheric recognition. Pairing a revised retracement procedure with providing GNSS-derived coordinate values with potentially faulty data instead of placing monuments is a recipe for disaster.
The biggest issue for most surveyors with implementation of the DPPS method will be for other jurisdictions to follow suit. The main priority of the surveyor is to protect the public. Making a change to allow coordinates to become acceptable evidence will lead to many more boundary disputes and court cases. Too often I hear that one surveyor thinks his coordinates are better than the next (myself included), yet we are dependent on what the receiver gets and the software calculates.
The surveyor tends to believe that GPS is “our” measuring device, and we have exclusive knowledge of its use and application, but we would be hard pressed to tell the client exactly what the equipment does to determine position and distance. A general understanding of your measuring tools is necessary, but it still comes back to knowledge of boundary law and the principles of how to apply them.
While I applaud the BLM for proposing a new procedure to help reduce costs for new original surveys in Alaska, I’m also afraid of the residual effect everywhere else as it establishes a new precedent.
So in the meantime, let the surveyors keep setting monuments and we will revisit the coordinate standard another day. And to quote the surveyor’s favorite geodesist, David Doyle: “Good coordination begins with good coordinates.” So let’s make sure we have accurate data.
Esri has made available the Trimble R2 GNSS receiver for collecting professional-grade GPS data with Collector for ArcGIS.
The GNSS receiver is rugged certified MIL-STD-810G, IP65 rated and compact, Esri says in a news release. The receiver is capable of delivering submeter and centimeter positioning accuracy in real-time to Android or iOS mobile devices via a wireless Bluetooth connection, or USB cable, to support geographic information system (GIS) or survey-grade workflows.
“Today’s geospatial professionals require flexible solutions which allow for configuration to meet their specific job requirements,” says Ron Bisio, vice president of Trimble’s surveying and geospatial Division. “By offering a complete, integrated solution, Esri and Trimble enable our joint customers to build a better and more reliable asset inventory using the mobile device, workflow and accuracy they choose.”
With the upcoming high-accuracy improvements to the Collector for ArcGIS App, Esri says the Trimble R2 GNSS receiver provides total flexibility to choose a solution based on the accuracy and GNSS performance level that suits the application. Now the locational precision of mobile devices can be enhanced via the Trimble R2 GNSS receiver. It is capable of supporting multiple global satellite constellation systems, including GPS, GLONASS, Galileo and BeiDou, and delivers GNSS positions in real time without the need for post-processing.
“Collector for ArcGIS is used by organizations to collect and update GIS data in the field,” says Dean Garner, Esri hardware solutions manager. “Many of our customers like the ease of use of Collector for ArcGIS on consumer handheld devices. Paired with the Trimble R2 GNSS receiver and the upcoming high-accuracy enhancements of Collector for ArcGIS 10.4, users can capture GIS data on their smartphones and tablets that meets the more stringent accuracy requirements of their organization.”
Designed for GIS professionals in a variety of organizations, the stand-alone Bluetooth or USB connected Trimble R2 GNSS receiver enables users to collect high-accuracy location data with Collector for ArcGIS on existing technology — whether it’s a modern smart device, such as a mobile phone or tablet, or a traditional integrated data collection handheld or tablet. The receiver can be pole mounted or carried in a backpack.
Trimble introduced its Trimble TDC100 handheld data collector at the 2016 Esri User Conference, which is being held July 27 to July 1 in San Diego, California.
An entry-level GNSS device for a variety of geographic information system (GIS) applications, the Trimble TDC100 combines both smartphone and ruggedized data collection capabilities in a single, mobile device, the company says in a news release.
The Android-based TDC100 can run commercially available or in-house developed applications on a professional, IP-67 ruggedized platform with a sunlight readable display and user replaceable batteries. The built-in GNSS receiver also provides real-time accuracy.
The Trimble TDC100 is available in two models — both models are available with an Android operating system and Wi-Fi, with an optional 4G LTE cellular version. It has a high-resolution 5.3-inch display, an 8 MP (Wi-Fi model) or 13 MP (4G LTE model) camera, and lithium-ion batteries in standard or enhanced capacity. It also supports GPS, GLONASS and BeiDou, as well as satellite-based augmentation system (SBAS) capabilities.
“GIS professionals using GNSS handheld devices for a wide range of data collection applications are expressing a desire for smartphone like capabilities in a built-to-last form factor,” says Ron Bisio, vice president of Trimble’s geospatial division. “We believe the TDC100 will be a workhorse. It has been designed for mobile workers who need a functional field computer that is tougher than a consumer-grade device, while providing easy-to-use features and convenience that people have come to expect. Users can collect and retrieve highly accurate spatial data anytime, and from virtually any place, while remaining in touch with the office — with a single device.”
Trimble TDC100 is expected to be available through Trimble’s geospatial distribution channel in mid-August 2016.
Esri has launched two new ArcGIS apps for field operating efficiency at the Esri User Conference, being held June 27–July 1 in San Diego. Attendees can see live demonstrations and experiment with Drone2Map for ArcGIS and Survey123 for ArcGIS.
“These two apps are already becoming game changers,” said Esri President Jack Dangermond. “What we’ve done is make it much easier for our users to collect data, including imagery, and then right away start working with that data — mapping, analyzing, sharing—in ArcGIS.”
Drone2Map for ArcGIS provides safe and affordable imagery on demand—a benefit especially useful to people who work in land analysis or infrastructure inspection and those monitoring events such as natural disasters and environmental change. Drone2Map takes still imagery captured by a drone and quickly turns it into high-quality 2D and 3D products in ArcGIS.
The app detects camera and sensor parameters and intelligently applies appropriate defaults. Its rapid-process capability allows teams in the field to be sure they’ve captured everything they need to avoid costly return trips. The imagery products created using Drone2Map can be used for analysis in ArcGIS Online and ArcGIS Pro to support informed decision-making.
Esri Survey123.
Survey123 for ArcGIS is a simple yet powerful form-centric field data gathering solution that makes it possible to create, share, and analyze surveys in three easy steps. With Survey123, paper forms are effectively transformed into digital surveys. Surveys, from simple to sophisticated, are authored and then shared in ArcGIS.
Using the Survey123 mobile app for iOS, Android or Windows, teams in the field capture survey results with their smartphones and tablets, even in disconnected environments. Data captured in the field is immediately available for analysis in ArcGIS to help users make better decisions. Survey123 is a versatile data collection solution already popular with people in public health, education, public works, disaster response, and humanitarian agencies.
Attendees of the Esri User Conference can see live demos and get hands-on experience with both of these new apps along with hundreds of other solutions designed to enable a smarter world.
]The annual event attracts 16,000 geographic information system (GIS) users, managers, and developers. It offers 300 moderated sessions, 450 hours of technical training, access to 300 software vendors, inspirational keynotes, and one-on-one sessions with Esri technical and professional support staff. See more of GPS World’s coverage.
Sentera LLC, a global provider of UAV hardware, sensors and data management platforms, has launched the Phoenix 2 fixed-wing unmanned aerial vehicle (UAV). The Phoenix 2 is light-weight and highly durable, and can follow precise grid patterns.
“The Phoenix 2 brings a level of precision and accuracy to UAVs that hasn’t been seen before,” said Todd Colten, chief aerospace engineer for Sentera. “Users can now collect highly detailed data quickly, and with complete certainty about its accuracy.” Colten went on to describe the professional-grade autopilot: “The grid pattern you specify is mapped pre-flight. The drone knows exactly what line to follow to get the exact looping radius, and the exact flight level needed for perfect tiling.”
Sentera Phoenix 2.
At only 4 pounds, the Phoenix 2 is easily hand-launched in just a few steps, and can carry multiple sensor options for up to an hour of flight time. The professional-grade autopilot is part of what makes the precision possible. It constantly auto-calculates and auto-optimizes according to the grid pattern specified to ensure the data collected meets exact specifications.
“Growers are using the Phoenix 2 with agriculture-specific sensors to collect RGB, NIR, and NDVI imagery. That imagery is so precise – [the growers] tell us they’re targeting and treating specific parts of their fields, and then they’re using fewer chemicals, saving money and increasing yields,” continued Colten. “Follow-up flights can be programmed to use the same pattern for exact data comparison at multiple times throughout the growing season. We’re getting great feedback from our customers.”
Attributes
Payload Solutions: The Phoenix 2 is a highly-versatile UAV that accepts multiple sensors, including the Sentera Double 4K Sensor, providing true RGB and normalized difference vegetation index (NDVI) data in a single flight. The Sentera Quad Sensor, a multi-spectral six-band imager with red edge capabilities is also popular in agriculture applications. Other compatible mapping sensors include the Sentera-Q for high-resolution orthomaps and the Radiometric Thermal Sensor, which quickly builds high-resolution true temperature maps. Sentera also offers EO and IR gimbaled payloads for live video public safety missions.
Precision: Up to a 60-minute endurance and cruise speed of 30 mph, the Phoenix 2 is capable of covering broad areas that other UAVs of the same size cannot. The highly reliable and accurate Kestrel OnBoard autopilot ensure images are captured with precise, even spacing and overlap that is auto-calculated and can be adjusted by the user at the click of a button.
Ease-of-Use: Effortlessly hand-launched in just a few steps, the 4-pound Phoenix 2 flies autonomously on a predetermined flight pattern that can be updated during flight by accessing the easy-to-use ground station software. Upon completion, the Phoenix 2 automatically returns to safely land.
End-to-End Solution: The Phoenix 2 includes the aircraft, ground station, transportation cases, batteries, chargers, and software with multiple training options available. Sentera offers a wide variety of sensors, ensuring every application has the perfect imagery solution. Sentera’s AgVault and OnTop Open Software Platforms manage the multitude of images and data collected during flight, and allow near-real time reading and analysis of the data, including working with other data sources via APIs.
Geneq has introduced a new NTRIP client app for iOS that works with iSXBlue receivers.
iSXBlue RTN is used alongside other geospatial information systems (GIS) and surveying apps to obtain real-time centimeter accuracy on an iPhone or iPad.
Key features include real-time kinematic (RTK) alarm configurations with NTRIP and DIP modes. The easy-to-use app allows users to update their receiver with the latest firmware, the company said.
Other features include real-time map location with accuracy and satellite skyplot for GPS, GLONASS and SBAS. The app supports all current and future constellations such as BeiDou and Galileo, the company said.iSXBlue and SXBlue GPS Receiver users include GIS and surveying professionals in industries such as agriculture, environmental, government, mining, natural resources, surveying and utilities.
Size, weight and power designed for smaller unmanned platforms
MB-Two module by Trimble.
The MB-Two GNSS module delivers highly accurate GNSS-based heading plus pitch or roll in an advanced industry standard form-factor for system integrators. The module’s embedded Z-Blade GNSS technology uses all available dual-frequency GNSS signals equally, without any constellation preference, to deliver fast and stable centimeter-accurate position and heading information. The MB-Two is designed for a wide variety of applications such as unmanned, agriculture, automotive, marine and military systems. The MB-Two features an enhanced dual-core GNSS engine with 240 channels capable of tracking L1/L2 frequencies from the GPS, GLONASS, Galileo and BeiDou constellations. The GNSS engine supports Trimble RTX correction services, including CenterPoint RTX and RangePoint RTX, delivered worldwide via L-Band satellite. The MB-Two combined with CenterPoint RTX delivers centimeter-level positioning without requiring a local base station or VRS network.
High performance, uninterrupted positioning for vehicle applications
The S1722DR8 GNSS dead-reckoning receiver, compared to a U.S. penny.
The S1722DR8 GNSS dead-reckoning receiver integrates a three-axis gyroscope/accelerometer and barometric pressure sensor with a GNSS receiver. Using wheel speed data from a vehicle, the S1722DR8 achieves 100-percent coverage. It can be flexibly mounted in any orientation, and does not have to be placed horizontally as do conventional dead-reckoning solutions that use a single-axis gyroscope. Its auto-calibration feature simplifies installation, while the short calibration time upon first use improves the user experience. The barometric pressure sensor provides highly accurate altitude information, which is useful for differentiating floor levels of multi-story parking garages or stacked highways.The S1722DR8 measures 17 x 22 millimeters. It offers continuous navigation even in GPS-signal-denied environments such as tunnels or underground parking lots.
The HX-DU1603D rover radio is an advanced, high-speed, Bluetooth-enabled wireless data link designed for GNSS/RTK (real-time kinematic) surveying and precise positioning. It is a lightweight, ruggedized UHF receiver for digital radio communications between 410 and 470 MHz in either 12.5- kHz or 25-kHz channels, which can be widely used in GNSS/RTK surveying and GNSS precise positioning systems. The HX-DU1603D is equipped with a Bluetooth transceiver for cable-free communications with external devices. It features an internal, rechargeable battery for ease of use and portability that allows long operational hours. Its display screen and buttons can be used to configuration parameters such as frequency, protocols, power display, serial port baud rate and air baud rate. By deploying the technology, users can instantly communicate with GNSS precise positioning receivers that share the same protocols throughout the world. The rover radio HX-DU1603D joins the line of Harxon products that include 25W base radio HX-DU8602T with simplex and 35W base radio HX-DU8608D with Duplex.
EyesMap3D generates accurate 3D models and point clouds, measured directly from images. It allows users to create high-density points clouds with textures achieving a realistic 3D model appearance. It is able to measure accurately on the images to generate true orthophotos, and geo-reference and scale the results. eyesMap3D users can use their cameras, mobile phone or camera drone to capture images. The program is compatible with most popular software packages on the market. The goal of maker eCapture is to allow the user to easily generate and work with 3D models and photogrammetric tools, while maintaining data quality.
Basic procedures and tools for determining valid NAVD 88 heights for constraints
To date, the six parts of “Establishing Orthometric Heights Using GNSS” have provided the reader with basic concepts, routines and procedures for understanding, analyzing, evaluating and estimating GNSS-derived ellipsoid and orthometric heights.
In Part 5 of this series, we discussed National Geodetic Survey’s NGS 59 guidelines and methods for evaluating the results of the GNSS-derived orthometric height project. It provided methods for evaluating the results of the project and identifying stations with valid North American Vertical Datum of 1988 (NAVD 88) published heights.
In Part 6, we continued to analyze the changes in adjusted heights due to different NAVD 88 height constraints and compared the results to the published NAVD 88 orthometric heights. We demonstrated that every constraint has an influence on the final set of adjusted heights so determining valid published NAVD 88 heights is important. With that, when incorporating new geodetic data into the National Spatial Reference System (NSRS), it is important to maintain consistency between neighboring stations. If the station has moved since the last time its height was established, then not constraining the published value and superseding the height is the appropriate action to take. As it was mentioned and emphasized in Part 6, if the difference is not due to movement and is due to some other reason such as the results of a previous adjustment distribution correction then superseding the height may not be the appropriate action to take.
In this part of the series, we will look at the network design of the NAVD 88 project and estimate the potential NAVD 88 distribution correction between two benchmarks involved with the original NAVD 88 adjustment.
First, we need to address the network design in the area that was used in the General Adjustment of the North American Vertical Datum of 1988 (NAVD 88). The NAVD 88 was a major leveling network adjustment project performed by the National Geodetic Survey (NGS) that was started in the early 1970s and completed in the early 1990s. NGS provides a summary of vertical datums. The excerpt (below) from the website describes the major attributes of the NAVD 88.
North American Vertical Datum of 1988 (NAVD 88) consists of a leveling network on the North American Continent, ranging from Alaska, through Canada, across the United States, affixed to a single origin point on the continent:
Tide Station & Location = Pointe-au-Pere,Rimouski, Quebec, Canada
PID = TY5255
GSD* Designation = 54L071
Bench Mark = 1250 G
Ht above LMSL(Meters) = 6.271
* Geodetic Survey of Canada = GSD
In 1993, NAVD 88 was affirmed as the official vertical datum in the National Spatial Reference System (NSRS) for the Conterminous United States and Alaska. Although many papers on NAVD 88 exist, no single document serves as the official defining document for that datum.
Abstract from the NAVD 88 Special Report Special Report Results of the General Adjustment of the North American Vertical Datum of 1988 David B. Zilkoski, John H. Richards, and Gary M. Young
American Congress on Surveying and Mapping Surveying and Land Information Systems, Vol. 52, No. 3, 1992, pp.133-149
ABSTRACT. For the new general adjustment of the North American Vertical Datum of 1988 (NAVD 88), a minimum-constraint adjustment of Canadian-Mexican-U.S. leveling observations was performed holding fixed the height of the primary tidal benchmark, referenced to the new International Great Lakes Datum of 1985 (IGLD 85) local mean sea level height value, at Father Point/Rimouski, Quebec, Canada. IGLD 85 and NAVD 88 are now one and the same. Father Point/Rimouski is an IGLD water-level station located at the mouth of the St. Lawrence River, and is the reference station used for IGLD 85. This constraint satisfies the requirements of shifting the datum vertically to minimize the impact of NAVD 88 on U.S. Geological Survey mapping products, and provides the datum point desired by the IGLD Coordinating Committee for IGLD 85. The only difference between IGLD 85 and NAVD 88 is that IGLD 85 benchmark values are given in dynamic height units, and NAVD 88 values are given in Helmert orthometric height units. The geopotential numbers of benchmarks are the same in both systems. Preliminary analyses indicate differences for the conterminous United States between orthometric heights referred to NAVD 88 and to the National Geodetic Vertical Datum of 1929 (NGVD 29) range from -40 cm to +150 cm. In Alaska, the differences range from +94 cm to +240 cm. However, in most “stable” areas, relative height changes between adjacent benchmarks appear to be less than 1 cm. In many areas, a single bias factor, describing the difference between NGVD 29 and NAVD 88, can be estimated and used for most mapping applications. The overall differences between dynamic heights referred to IGLD 85 and to International Great Lakes Datum of 1955 will range from 1 cm to 40 cm. The use of Global Positioning System (GPS) data and a high-resolution geoid model to estimate accurate GPS-derived orthometric heights will be directly associated with the implementation of NAVD 88 and IGLD 85. It is important that users initiate a project to convert their products to NAVD 88 and IGLD 85. The conversion process is not a difficult task, but will require time and resources.
More than one million kilometers of leveling data were analyzed during the NAVD 88 project. The design of the leveling network involved in the NAVD 88 project is shown in Figure 1.
Figure 1. Leveling Network Design Used in the General Adjustment of the North American Vertical Datum of 1988 (Figure 3 from the NAVD88 report).
Not all of the leveling data depicted in Figure 1 were used in the general adjustment. Some of the older leveling data were not consistent with the newer data so these older data were not included in the adjustment. When proper procedures are followed, leveling data is very precise and accurate over short distances but the leveling network design usually does not provide a lot of redundancy. That’s why it is important to design a leveling network with many connecting loops. The loops provide the redundancy required to ensure that the leveling data does not contain any remaining significant systematic errors and/or blunders. At a minimum, the connected loops help to control and/or localize the remaining errors. Some of the older leveling data that were not included in the general adjustment were incorporated into the NAVD 88 after the general adjustment and were loaded into the NGS database. These stations are denoted as POSTed monuments on the NGS datasheet, shown in the highlighted section below in the excerpt labeled “NAVD 88 General Adjustment: What Does This Really Mean?”
NAVD 88 General Adjustment: What Does This Really Mean?
The general adjustment of NAVD 88 was completed in June 1991. All heights from the general adjustment were loaded into the NGS geodetic database in September 1991. This means that benchmarks included in the NAVD 88 Helmert blocking phase (approximately 80% of the total) have final NAVD 88 heights available for distribution to the public.
The remaining 20% of the benchmarks in “stable” areas were removed from the adjustment (denoted as “POSTed” benchmarks), because older data were inconsistent with newer data. NAVD 88 heights for these posted benchmarks will be determined from these older data during 1992-93. This task involves analyzing the data associated with the posted benchmarks to determine the best estimate of their NAVD 88 heights.
“POSTed” benchmarks in large crustal movement areas (e.g., southern Alaska, southern California, Phoenix, Houston, and southern Louisiana) will be published as special reports. This is a long-term task that started in January. It is important to note that some benchmarks in crustal-movement areas (i.e., benchmarks that were included in the NAVD 88 Helmert blocking phase) are available now. The heights of these benchmarks were usually based on the latest available data, but still may be influenced by crustal movement effects. In some areas, these benchmarks were not based on the latest available data, because this would have forced large distribution corrections into good, but older, adjacent leveling data.
In addition, there are approximately 500,000 USGS third-order benchmarks for which NGS does not yet have any data.
The NGS datasheet provides the date the station’s NAVD 88 orthometric height was adjusted so a user can determine if the station was part of the general adjustment of NAVD 88 or if the station was readjusted or incorporated in the NAVD 88 after the general adjustment. Station V 49 (PID = FA0151) is an example of a station that was involved in the general adjustment and published in 1991. The highlighted statement “The orthometric height was determined by differential leveling and adjusted by the NATIONAL GEODETIC SURVEY in June 1991” in the text portion of the datasheet indicates that this station’s adjusted height was established in the general adjustment of NAVD 88, as shown in the highlighted section in excerpt from “NGS datasheet for station V 49″ below.
Station Phaniel is an example of a station that was incorporated into NAVD 88 after the general adjustment. Phaniel’s datasheet has the following statement, highlighted below: “The orthometric height was determined by differential leveling and adjusted by the NATIONAL GEODETIC SURVEY in January 2005.”
So why is this important?
It is important to realize that just because the leveling data is newer than the rest of the leveling network around it, it doesn’t necessarily mean its absolute height value is more accurate or more reliable than the stations it was established from. The newer leveling data most likely is associated with an older leveling survey used in the general adjustment of NAVD 88. This older leveling data may have been affected by crustal movement and could be inconsistent with its neighbors 5-15 kilometers away. If proper procedures were adhered to, such as the FGCS geodetic leveling procedures, then the new leveling should have been connected to the NAVD 88 through a two- or three-mark leveling validation check leveling procedure, shown in the excerpt from “FGCS Specifications and Procedures to Incorporate Electronic Digital/Bar-Code Leveling Systems” below.
FGCS Specifications and Procedures to Incorporate Electronic Digital/Bar-Code Leveling Systems*
3.5 Geodetic Leveling
Geodetic leveling is a measurement system comprised of elevation differences observed between nearby rods. Geodetic leveling is used to extend vertical control.
Network Geometry
Order Class
First I
First II
Second I
Second II
Third
Bench mark spacing not more than (km)
3
3
3
3
3
Average bench mark spacing not more than (km)
1.6
1.6
1.6
3.0
3.0
Line length between networkcontrol points not more than (km)
300a
100a
50a
50a
25b
Minimum bench mark ties
6
6
4
4
4
aElectronic Digital/Bar-Code Leveling Systems, 25 km bElectronic Digital/Bar-Code Leveling Systems, 10 km
As specified in above table, new surveys are required to tie to existing network bench marks at the beginning and end of the leveling line. These network bench marks must have an order (and class) equivalent to or better than the intended order (and class) of the new survey.
First-order surveys are required to perform valid check connections to a minimum of six bench marks, three at each end. All other surveys require a minimum of four valid check connections, two at each end.
A valid “check connection” means that the observed elevation difference agrees with the published adjusted elevation difference within the tolerance limit of the new survey. Checking the elevation difference between two bench marks located on the same structure, or so close together that both may have been affected by the same localized disturbance, is not considered a proper check.
In addition, the survey is required to connect to any network control points within 3 km of its path. However, if the survey is run parallel to existing control, then the following table specifies the maximum spacing of extra connections between the survey and the existing control.
When using Electronic Digital/Bar-Code Leveling Systems for area projects, there must be at least 4 contiguous loops and the loop size must not exceed 25 km. (Note: This specification may be amended at a future date after sufficient data have been evaluated and it is proven that there are no significant uncorrected systematic errors remaining in Electronic Digital/Bar-Code Leveling Systems.)
* NGS’ analyses of the data will be the final determination if the data meet the desired FGCS order and class standards.
The validation check leveling procedure ensures that the new leveling is consistent with the local stations it’s connected to. However, if the local area around these monuments all moved together than the validation check leveling procedure may meet the allowable tolerances but the new heights could still be inconsistent with neighbors 5 to 15 kilometers away. Similarly, if the validation check leveling stations were involved in a large distribution correction in the NAVD 88, than, once again, the validation check leveling may meet the allowable tolerances but the new heights could still be inconsistent with neighbors 5-15 kilometers away. This is not to say that the older leveling or published heights of the stations are bad or incorrect; all it is ensuring is that the new leveling is consistent with the adjusted heights in the local area surrounding the new leveling project.
Another statement on the NGS datasheet that should be explained is “No vertical observational check was made to this station,” shown in the highlighted statement from the excerpt of Phaniel’s datasheet, below. This means that the station was determined on a leveling line that is known as a spur level line. This means that the leveling data were not involved in a loop. This is important because the lack of redundancy means that there is no check on the adjusted heights of these stations other than the checks performed during the double running procedure. The double-running procedure is very important but the procedure may not detect, reduce, and/or eliminate all systematic errors and/or blunders. The GNSS-derived values may be the first check on the published height of these stations. When performing GNSS-derived orthometric height adjustments the users should investigate all stations that seem to be inconsistent with its neighboring stations especially stations that their published datasheet contains the statement “No vertical observational check was made to this station” such as station Phaniel.
When analyzing GNSS projects, it is helpful to understand how the NAVD 88 height of the station was established and what year it was leveled. Figures 2 and 3 depict the original leveling network design used in the general adjustment of the NAVD 88 in the Rowan County, North Carolina, project area, and Figures 4 and 5 depict the current NAVD 88 leveling network design. Looking at Figures 2 and 3, it appears that the leveling network used in the general adjustment of NAVD 88 in Rowan County was fairly sparse and mostly consisted of leveling data observed in the 1930s and 1960s.
Figures 4 and 5 show the amount of leveling data incorporated into the NAVD 88 after the general adjustment. The red stars on Figure 4 are the stations that have been incorporated into the NAVD 88 since the general adjustment. Figure 5 depicts the dates of the leveling lines that were used to establish the new NAVD 88 heights. All of these new stations will have adjustment dates after June 1991. Having a different adjustment date than the general adjustment date of 1991 is not an issue, it’s just a way of informing the user that the station was incorporated into NAVD 88 and constrained to previously published NAVD 88 heights. The user should know the adjustment date of the control they are using in their GNSS project because the accumulated NAVD 88 distribution correction could be large especially between stations with different adjustment dates in areas with old leveling data and large loops.
Figure 2. Leveling Network Design Used in the General Adjustment of the North American Vertical Datum of 1988 (Green stations are stations established in the NAVD 88 and published in June 1991).Figure 3. Dates of the Original Leveling Network Design in the Vinicity of the Rowan County, North Carolina, Height Modernization Project.Figure 4. Leveling Network Design Incorporated into the General Adjustment of the North American Vertical Datum of 1988 (Red stars are stations that were incorporated in NAVD 88 after June 1991).Figure 5. Dates of the Current Leveling Network Design in the Vinicity of the Rowan County, North Carolina, Height Modernization Project.
As depicted in Figure 3, the original leveling data used in NAVD 88 in southern Rowan County, NC, was an east-west leveling line performed in 1935. It was connected at both ends of the line to leveling data performed in the 1970s. The validation check leveling procedure was performed and met the required tolerances. The loops that the 1935 leveling line was involved in are fairly large, around 175 kilometers. The leveling data involved in the loops consists of first- and second-order data. The allowable loop closure would have been based on the amount of leveling of each order and class involved in the loop. The allowable loop closure for the older second-order, class 0 leveling line would have been based on 8.4 mm times the square root of the length of loop in kilometers. In this case, a loop 175 kilometers would have an allowable closure of 111 mm. The allowable loop closure for first-order, class 2 leveling is 4 mm times the square root of the length of loop in kilometers. In this case, a loop 175 kilometers would have an allowable closure of 53 mm. Since this is based on a mixture of order and classes of leveling data, the allowable loop closure would have been somewhere in between.
For this column, I decided to estimate the NAVD 88 distribution correction between two benchmarks involved with the older leveling lines in southern Rowan County. The observed Helmert orthometric height difference between station V 49 and T 78 is -6.850 meters, and the Published NAVD 88 Helmert orthometric height difference from the NAVD 88 general adjustment is -6.891 meters. This means that the distribution correction between stations V 49 (FA0151) and T 78 (FA0295) is 0.041 meters (4.1 cm).
Figure 6 depicts the location of the stations and the leveling route used to estimate the NAVD 88 distribution correction. Since the leveling distance between these two stations is approximately 60 kilometers, the distribution correction is less than 1 mm per kilometer (0.7 mm/km). This is a very reasonable distribution correction because it only modifies each leveling section observation by about 1 mm per kilometer allowing users to check their local leveling projects. This, however, may be an issue with some GNSS surveys that extend over a large area were the leveling network consists of old leveling data with large loops. The GNSS-derived orthometric heights may be more accurate than the leveling-derived orthometric heights. As shown in Figure 6, stations V 49 and T 78 are involved in large loops and were established using older leveling data in the original NAVD 88 resulting in a distribution correction of 4.1 cm.
Figure 6. Example of an estimate of the NAVD 88 distribution correction between two stations established with old leveling data and large loops.
Station V 49 was used in this analysis because the station was occupied during the Rowan County GNSS project. The shortest leveling distance between station V 49 and T 78 was used to estimate the NAVD 88 distribution correction. Station T 78 was selected because it is the junction station for the leveling line that was used to incorporate station Buffalo 2 into the NAVD 88 in January 2005. Since T 78 was the junction station and its height changed 4.1 cm, 4.1 cm was applied to station Buffalo 2’s height to obtain its modified height. This is not the most rigorous way to estimate the effects of the distribution correction but it provides a quick method to determine an estimate of the NAVD 88 distribution correction between two stations.
Figure 7 is a plot that depicts the differences at station Buffalo 2 using the modified NAVD 88 height. The difference between the GNSS-derived orthometric adjusted height and the new NAVD 88 height decreased from 3.5 cm to -0.6 cm. This difference agrees to within 1 cm with the results of station V 49 (see Figure 7). It should be noted that one of the recommendations in the National Geodetic Survey’s NGS 59 document is to occupy valid NAVD 88 stations every 20 km. Following this procedure can help reduce the number of stations that need to be investigated due to NAVD 88 distribution corrections from the general adjustment.
Figure 7. Example of the possible effect of the NAVD 88 distribution correction on an adjusted GNSS-derived orthometric height.
Three stations were identified as potential outliers in Part 6 — Phaniel, Plaza, and Row 3. As mentioned in Part 5 (February 2016), station Phaniel has a large difference between the adjusted GNSS-derived orthometric height and the published NAVD 88 orthometric height value (-4.2 cm); indicating an issue with the ellipsoid height and/or orthometric height (see Figure 8). However, Phaniel’s published NAD 83 (2011) ellipsoid height and the Rowan County minimum-constraint adjusted height of Phaniel only differed by 0.8 cm. The comparison of adjusted ellipsoid heights and published ellipsoid heights for the Rowan County GNSS project were provided in Part 4 (December 2015). This is an indication that the GNSS-derived ellipsoid height of station Phaniel is not an issue and that the station hasn’t moved since the original GNSS survey and the 2015 Rowan County GNSS survey. It should be noted that the leveling project used to incorporate station Phaniel into NAVD 88 was performed in 2001 which was in between the two GNSS surveys.
Two other stations (Row 17 and Row 16) were leveled on the same leveling line as Phaniel and their adjusted GNSS-derived orthometric height and the published NAVD 88 orthometric height values agree to 1.6 cm and 1.7 cm respectively; this is an indication that the leveling data and GNSS data are consistent from the main level line to these two stations. Phaniel’s datasheet has the statement “No vertical observational check was made to this station,” indicating the station’s height was established on a spur leveling line and therefore has a lack of redundancy and reliability. Based on the information up to now, I would not recommend constraining station Phaniel in the final adjustment. Saying that, before it is superseded by the GNSS project, the benchmarks between Phaniel and Row 17 should be re-leveled to determine if a leveling error was made between these stations in 2001.
Figure 8. NAVD 88 leveling network design involving station Phaniel.
The geodetic data and information for station Plaza is listed below:
As described in Part 6 (April 2016), station Plaza and station Fifth have a large relative difference between the adjusted GNSS-derived orthometric height and the published NAVD 88 orthometric height value (-3.2 cm); (See Figure 9.);
Four other stations in the vicinity have small relative differences between the adjusted GNSS-derived orthometric heights and the published NAVD 88 orthometric heights values, 37 DRD (0.6 cm), Midtown (-0.1 cm), Midway (1.0 cm), and J 181 (1.1 cm) – indicating a problem with station Plaza;
Station Fifth and Plaza are only 400 meters apart, and their adjusted heights were established in two different adjustments: station Fifth was leveled in 2013 (adjustment date of March 2015) and station Plaza was leveled to in 1989 (adjustment date of September 1997) – indicating a potential inconsistency between adjustments;
Plaza’s datasheet states that “the station was recovered as described in 2012 except the area between the curb and sidewalk has been filled with concrete. Mark is now part of the sidewalk but does not appear to have been disturbed.”
Based on the available information to date, I would not recommend constraining the published height of station Plaza in the final adjustment. Once again, this station’s published height should not be superseded by the GNSS project until new leveling has been performed between station Fifth and Plaza.
Figure 9. NAVD 88 leveling network design involving station Plaza.
Figure 10 depicts the leveling network involving station Row 3. As described in Part 6 (April 2016), station Row 3 has a large difference between the adjusted GNSS-derived orthometric height and the published NAVD 88 orthometric height value, -3.8 cm (see Figure 10.). Except for station AE4540 (382 JAS), all of the differences between the adjusted GNSS-derived orthometric height and the published NAVD 88 orthometric height value at the other nearby stations are all less than 1.7 cm; as a matter of fact, most of the differences are less than +/- 0.5 cm.
I could not find any leveling data in NGS’ database involving station AE4540 (382 JAS). (See Figure 11.) As far as I could determine, this station was not leveled to by NGS and leveling data were not submitted to NGS for inclusion in the NAVD 88. You can retrieve all project identifiers for those projects with observations to or from a station using the stations’s PID. The station’s PID is provided on the NGS datasheet. The input and output for PID AE4540 is shown below. There are no identifiers listed under the sections labeled “Vert_Obs,” “Lev_Obs,” or “Level_Obs” indicating that this station does not have any leveling observations in NGS database.
Based on the available information so far, I would not recommend constraining the published heights of station Row 3 or 382 JAS (AE4540) since they will distort the adjusted heights of surrounding stations (see Part 6, Figure 10). If no supporting leveling data can be found for station 382 JAS then I would recommend superseding that station’s height with the GNSS-derived value. As for station Row 3, I wouldn’t recommend superseding the published height with the GNSS-derived height until a leveling check has been made between Row 3 (DG5673) and a nearby station such as station 384 JAS (FA0564).
I realize that by not constraining a station and not superseding the published height that an inconsistency between the leveled NAVD 88 height and the NAVD 88 GNSS-derived orthometric height may occur. This information needs to be noted in the project report with an explanation of why you made certain decisions in your final adjustment. The analysis and plots provided in these columns are the types of information that should be provided in the final report.
All of the analysis and recommendations have been based on using the latest scientific geoid model xGeoid15b. However, in practice, GNSS-derived orthometric heights are incorporated into the NAVD 88 using the latest hybrid geoid model GEOID12B. I recommend first performing the analysis using the scientific geoid model because the hybrid geoid model has been warped to be consistent with the published NAVD 88 values. This was described in detail in my Part 3 (October 2015). The analysis using the scientific geoid should be included in the report especially if the user finds significant differences between the results using the two different geoid models. Saying that, maintaining consistency between closely spaced stations is extremely important when incorporating data into an existing network. Based on the information so far and the results using GEOID12B, I would not recommend constraining the published NAVD 88 heights of stations Phaniel and Plaza in the final NAVD 88 GNSS-derived orthometric height adjustment. These two stations resulted in significant changes in relative adjusted heights when they were constrained. (See Part 6, April 2016.)
It was noted in Part 5 (February 2016) that ten of the 2015 GNSS Rowan County Height Modernization project’s stations have published NAVD 88 GNSS-derived orthometric heights. These station are important because they are on the edge of the network where there’s a void of published NAVD 88 leveling-derived orthometric heights. In the next column, we will look at these stations and the differences between their minimum-constraint least squares adjusted GNSS-derived orthometric heights and their published NAVD 88 GNSS-derived orthometric height.
These columns have provided a lot of routines and procedures for analyzing and estimating GNSS-derived orthometric heights. My intent was to provide the analyst with tools for documenting the results of the analysis and providing a basis for making recommendations associated with the GNSS project. A future column will address what information should be included in a project report.