Fundamental in the determination of GNSS solutions is resolving the correct number of full cycles of the carrier signal (so-called fixing ambiguities) in order to resolve the ambiguity differences between the base and the rover. Distances measured from GNSS receivers contain errors caused by inaccuracies in the satellite and receiver clocks, the satellite orbits, and by the ionosphere and troposphere. When a base station is used, these errors are nearly identical to both the rover and base station receivers when the baseline distance is short. By removing these common errors through RTK processing, centimeter-level accurate vectors can be calculated between the base station and the rover.
Multipath, the reflection of GNSS signals from nearby objects and structures, creates its own indirect measurements from the satellites to the GNSS receiver and is the most critical source of inaccuracy in precision GNSS applications. The worst case is when the receiver doesn’t see the direct signal at all, such as when satellite is behind a building but is still receiving the signal reflected off of the nearby structure. Such indirect signals are usually strong, unhelpful and misleading.
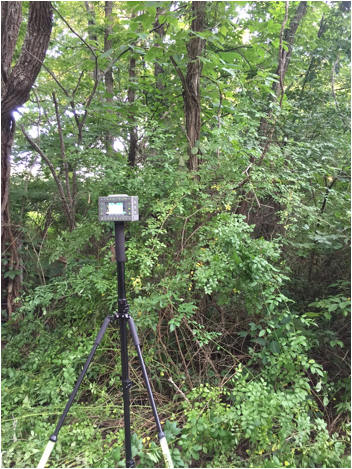
A TRIUMPH-LS collecting a point under tree canopy.
The other aspect impacting the veracity of a fixed solution is when there are weak GNSS signals. Frequently, weak signals are due to their penetration directly through tree canopy. While the TRIUMPH-LS can’t move the obstacles that are creating multipath out of the way, its sophisticated engineering is designed to handle even the weakest signals like no other system with its RTK Verification System (patent pending).
When located in difficult environments and under tree canopy, all GNSS receivers are prone to give bad fixed solutions that may appear to be acceptable if they are not verified. Existing methods to verify GNSS solutions include “dumping” the receiver, turning it upside down to cause the RTK engines to reset, and re-observing the point at a later time.
The TRIUMPH-LS automates these processes with its built-in software features of Verify and Validate. Verify automatically resets the RTK engines after every fixed epoch is collected in the first step of its process. Epochs are sorted by distance and placed into groups during the first step. Once a group has built up a set level of confidence, the RTK engines are allowed to collect the remaining epochs without resetting. If epochs fall too far away from the best selected group from the first step, they are rejected and the RTK engines are reset.
Validation is the final step of the process. With this feature enabled, the RTK engines will reset one final time at the end of the observation and collect 10 additional epochs. Allowing sufficient time between the first step and the final validation step will guarantee a bad solution is not allowed to be accepted. From extensive testing of these features in the worst of multipath environments, a bad solution has yet to be accepted when the Verify and Validate features are used and 120 epochs are collected.
After using a TRIUMPH-LS system, many land surveyors who have used other GNSS receivers in the past without preforming any type of verification are starting to realize that they may have accepted many bad fixed solutions over the years. If you are not using a receiver like the TRIUMPH-LS that has the ability to automatically reset the RTK engines and verify the results, it is essential that you manually “dump” the receiver or re-observe the point at a later time so that you don’t make this same mistake.
Trimble has launched its Trimble VRS Now correction service in New Mexico. The commercial subscription service provides surveyors, civil engineers and geospatial professionals in the region with instant access to real-time kinematic (RTK) GNSS corrections without the need for a base station.
Using both the GPS and GLONASS constellations, the Trimble service delivers centimeter-level RTK corrections customized for each GNSS receiver’s location anywhere in the network via cellular communications. The Trimble VRS Now service supplies accurate, reliable and easy-to-use GNSS positioning for a variety of applications including surveying, urban planning, urban and rural construction, environmental monitoring, resource and territory management, disaster prevention and relief and scientific research, Trimble said.
“As we continue to expand our VRS Now network infrastructure throughout the U.S., users in New Mexico now have increased reliability from both GPS and GLONASS corrections to enhance their work,” said Lisa Wetherbee, business area director of Trimble’s Positioning Services Division. “Our suite of correction services offers a variety of performance options, designed to meet the different requirements and budgets of our customers. VRS Now in New Mexico delivers centimeter-level accuracy to a wide range of industry professionals.”
Service in New Mexico is a continuation of Trimble’s focus on providing solutions that enable customers to increase productivity by simplifying access to high-precision positioning around the world. Similar VRS Now services are operating in Illinois, Indiana, Iowa, Nebraska, Colorado, Florida, Alabama, Mississippi, Texas, Oregon and parts of Europe and Australia.
Part 1 of this column appeared in the June Survey Scene newsletter.
Basic Procedures for Establishing Accurate GNSS-Derived Ellipsoid Heights
David B. Zilkoski
In my first newsletter column of this series, Part 1, I discussed the basic concepts of GNSS-derived heights. My article discussed the three types of heights involved in determining GNSS-derived orthometric heights: ellipsoid, geoid, and orthometric. I also mentioned that each of these heights has its own error sources that need to be detected, reduced or eliminated by following specific procedures or applying special models.
GNSS-derived ellipsoid heights are the basis for GNSS-derived orthometric heights, so it makes sense to make these ellipsoid heights as close to error free as possible. This article will discuss guidelines for detecting, reducing and eliminating error sources in ellipsoid heights. It will focus on guidelines for establishing accurate ellipsoid heights in a local geodetic network.
Based on the Federal Geographic Data Committee publication “Geospatial Positioning Accuracy Standards, Part 2: Standards for Geodetic Networks,” guidelines were developed by the National Geodetic Survey (NGS) for performing GNSS surveys that are intended to achieve ellipsoid height network accuracies of 5 cm at the 95 percent confidence level, as well asellipsoid height local accuracies of 2 cm and 5 cm, also at the 95 percent confidence level. These guidelines were developed in partnership with federal, state and local government agencies, academia and private surveyors, and are the result of processing various test data sets and having extensive discussions with various GNSS users groups. These guidelines, known as NGS 58, have been documented in a publication titled “Guidelines for Establishing GPS-derived Ellipsoid Heights (Standards: 2 cm 9and 5 cm), Version 4.3″ and can be downloaded from the NGS website. NGS is reevaluating the guidelines and, based on its research results, will update the document appropriately (NGS, Personnel Communication).
Guidelines have also been written to establish GNSS-derived orthometric heights that approach these same accuracies, 2 cm and 5 cm. The slight differences between the accuracies of GNSS-derived ellipsoid heights and GNSS-derived orthometric heights will be generally due to the accuracy of the geoid model and published orthometric heights used to evaluate the differences between the three height systems: ellipsoid, geoid and orthometric heights. The topic “procedures for estimating accurate GNSS-derived orthometric heights” will be addressed in a future newsletter in this series.
If users follow the NGS guidelines, they will reduce or eliminate errors in ellipsoid height or, at a minimum, they will detect problems or errors in data. If these problems or errors are detected and corrected before the project is completed, then they will not be problems to the end users.
Basic Procedures for Detecting, Reducing, and Eliminating Errors in GNSS Ellipsoid Heights
The basic concepts listed below are very simple, but they all need to be followed as prescribed.
First and probably one of the most important procedure is to repeat baselines on different days and at different times of the day. This helps to detect and reduce the effects of: multipath, differences in height values due to different satellite geometry, and the amount of time a user must occupy a station for a short baseline, for instance, 30 minutes of good, valid data over baselines less than 10 km. (Although, it should be noted that to obtain 30 minutes of good, valid data, the user may have to obtain 45 to 60 minutes of data.)
The observing scheme for all stations requires that all adjacent stations (base lines) be observed at least twice on two different days and at two different times of the day. The purpose is to ensure different atmospheric conditions (different days) and significantly different satellite geometry (different times) for the two baseline measurements.
Keep baseline lengths under 10 km. The closer the two stations are, the better chance that common errors will cancel or nearly cancel, such as unmodeled atmospheric errors. It helps to reduce the amount of time the user must occupy a station in order to collect enough good, valid data to correctly fix all the integers.
Use fixed height poles. This helps eliminate errors due to incorrectly measuring the height of the antenna above the mark. Of course, when listening to GNSS users, nobody has ever measured the height of the tripod wrong. But, it’s strange how that turns out to be the most common error when fixed-height poles are not used.
Antenna set-up is critical. Plumbing bubbles on the antenna pole of the fixed-height tripod must be shaded when plumbing is performed. Plumbing bubbles must be shaded for at least 3 minutes before checking and/or re-plumbing. The perpendicularity of the poles must be checked at the beginning of the project and any other time there is suspicion of a problem. The user should also ensure the antenna is properly seated in the mount.
Use a geodetic antenna with ground plane and/or choke ring. This helps reduce effects of local multipath.
Final processing shall consist of fixing all integers for each vector for all sessions except to some control sites. Users should be able to fix the integers over baselines that are less than 10 kilometers. If the integers cannot be fixed, there is probably something wrong with the data, such as bad multipath effects, missing data due to blockage, or interference. Baseline solutions with fixed integers prove to be more reliable, consistent and accurate.
Simultaneously observe baselines between neighboring stations. This helps to ensure that closely spaced stations (neighboring stations) will have the desired local accuracy and are the stations that most users will want to use to validate their classical leveling results.
Establish a high-accuracy 3-D fiducial network that encompasses the entire project. This network helps to detect and reduce the effects of remaining systematic errors in the local network observations. This also ensures that when two local networks are eventually connected, they will be consistent with each other. This is a very important aspect of establishing accurate GNSS-derived ellipsoid heights using the guidelines documented in NGS 58. The survey should be referenced to at least three existing Continuous Operating Reference Stations (CORS) [NOAA CORS or equivalent] near the project area. The survey should also consist of at least three control stations that are referenced to the three CORS and interspersed throughout the project. For these control stations, receivers should collect data continuously and simultaneously for at least three, 5-hour sessions on three different days at different times of the day during the project. As previously stated, NGS is reevaluating the guidelines and will update them based on the results of their research. Until NGS updates the guidelines, the user should continue to collect long data sets at these control stations, because they are extremely important to detecting potential errors in the stations established using short data observing sessions.
Evaluating the Quality of Published NAD 83 (2011) Ellipsoid Heights
A description of the National Adjustment of 2011 Project (Alignment of passive control with the latest realization of the North American Datum of 1983: NAD 83(2011/PA11/MA11) epoch 2010.00) is available online.
I’ve listed a few paragraphs (and highlighted a few statements) from the write-up that I believe are important to anyone using published NAD 83 (2011) ellipsoid heights as control stations.
As part of continuing efforts to improve the NSRS, on June 30, 2012, NGS completed the National Adjustment of 2011 Project. This project was a nationwide adjustment of NGS “passive” control (physical marks that can be occupied with survey equipment, such as brass disk bench marks) positioned using GNSS technology. The adjustment was constrained to current North American Datum of 1983 (NAD 83) latitude, longitude and ellipsoid heights of NGS Continuously Operating Reference Stations (CORS). The CORS network is an “active” control system consisting of permanently mounted GNSS antennas, and it is the geometric foundation of the NSRS. Constraining the adjustment to the CORS optimally aligned the GNSS passive control with the active control, providing a unified reference frame to serve the nation’s geometric positioning needs.
For the final constrained adjustments, the median network accuracy for all stations was 0.9 cm horizontal and 1.5 cm vertical (i.e., ellipsoid height) at the 95% confidence level. The median change in coordinates from the previous published values was about 2 cm horizontally and vertically. However, some station coordinates changed by more than 1 meter horizontally and 60 cm vertically. Although some of the large coordinate changes resulted from new data and adjustment strategies, most horizontal changes greater than about 6 cm occurred in geologically active areas and were likely due to tectonic motion.
Results of the 2011 national adjustment for 79,677 passive control marks are available on NGS Datasheets, including their network and local accuracies.Of these passive marks, 79,161 are referenced to the North America tectonic plate as the 2011 realization (including CONUS, Alaska and the Caribbean); 345 are referenced to the Pacific plate as the PA11 realization (the central Pacific, including Hawaii, American Samoa and the Marshall Islands); and 171 are referenced to the Mariana plate as the MA11 realization (the western Pacific, including Guam, Palau and the Commonwealth of the Northern Mariana Islands). Although the passive marks are referenced to three different tectonic plates, all refer to a common 2010.0 epoch date. With the completion of the national adjustment, all passive marks on NGS Datasheets with NAD 83(2011/PA11/MA11) epoch 2010.00 coordinates will be consistent with results obtained using CORS and the NGS Online Positioning User Service (OPUS). Note that 183 stations were excluded from the final national adjustments due to lack of enabled vector connections; where possible, these stations will be reconnected to the network in subsequent individual adjustments.
Other technical issues addressed in the project include:
1. appropriate down-weighting of the up component of GNSS vectors to account for subsidence in the northern Gulf Coast region of CONUS;
2. use of variable weighted (stochastic) constraints for CORS based on formal accuracy estimates derived from the NGS MYCS1;
3. scaling of GNSS vector error estimates for all projects to ensure consistent weighting of observations;
4. use of down-weighting (rather than removal) for vector rejections;
5. splitting the conterminous U.S. into a Primary and Secondary network, as mentioned above, such that vectors observed prior to about 1994 were assigned to the Secondary network. This allowed the Primary network to be adjusted separately without the problems associated with older observations (e.g., single frequency receivers, no antenna phase center models, poor orbit accuracy, incomplete satellite constellation, lack of CORS, etc.).
Each of these technical challenges (and others) was satisfactorily resolved, and completion of the National Adjustment of 2011 Project represents a significant step toward a more integrated, consistent, and accurate NSRS.
First, I’d like to commend NGS for performing the NAD 83 (2011) national adjustment; it was a great accomplishment by NGS. It provides users with a consistent, accurate set of geodetic coordinates (latitude, longitude and ellipsoid height) that should serve the nation’s positioning requirements for many years. Saying that, there are some issues that the user needs to consider when using published NAD 83 (2011) ellipsoid heights as constraints in GNSS network adjustments:
Generally, the NAD 83 (2011) network design was sufficient for determining accurate horizontal coordinates (latitude and longitude) but may not have been sufficient for establishing the vertical component (ellipsoid height) accurate enough for use as control stations in NGS Height Modernization Projects (see this webpage for more information on NGS’ Height Modernization Program) . Many of the earlier GNSS projects, prior to the publication of NGS 58, did not repeat baselines; stations were, however, usually occupied at least twice and observing sessions lasted for two hours or more. They were generally evaluated using loop closures and adjustment statistics, but loop analysis and adjustments do not always detect, reduce and/or eliminate all problems.
In addition, prior to NGS 58, not all closely spaced stations (neighboring stations) were simultaneously observed during the same session. In my opinion, the published formal errors may be too optimistic for some of these stations. These stations may be very precise but based on the survey field procedures performed prior to the publication of NGS 58, it is my opinion that the relative ellipsoid height accuracy for closely-spaced stations that were not simultaneously observed during the same session may not be as accurate as their listed median accuracy value.
Stations that were observed following the NGS 58 document are labeled as Height Modernization stations on the NGS datasheet and their ellipsoid height values should be good to the 2-cm level if they were involved in the same project.
It is important to understand the quality of published NAD 83 (2011) ellipsoid heights because your project’s GNSS-derived ellipsoid height values will be evaluated by them. The project’s control stations help to detect and reduce the effects of remaining systematic errors in the local network so they need to be very accurately determined.
Identifying good, valid published NAD 83 (2011) ellipsoid heights accurate enough to evaluate the results of a GNSS project isn’t an exact science, but there are ways to identify good candidates. I’ve listed three ways of using NGS published datasheets to help the user evaluate the quality of NAD 83 (2011) ellipsoid heights.
Identify stations that were established in Height Modernization Projects (that is, the stations were established following NGS 58 guidelines).
Analyze the network and local accuracy values to identify stations with accuracy values less than 2 cm.
Use local accuracy tables of stations to determine if closely spaced monuments (neighboring stations) were occupied during the same session.
The user can retrieve NGS datasheets in text form or as a shape file using NGS’ Datasheet retrieval program. Identifying stations involved in a NGS Height Modernization Project is simple because the datasheet adds a note stating that a particular station is a Height Modernization Survey Station. The user can assume these stations were determined following NGS 58 guidelines. An example of a station involved in a height modernization project is station CARGO, DJ5933 (see the datasheet below). The NGS datasheet also lists the station’s network and local accuracies. On the datasheet, the network accuracy value is listed below the coordinates (for instance, 1.39 cm for station CARGO). Below the network accuracy value, the user can obtain the local accuracy values by clicking on the following link in the datasheet: “Click here for local accuracies and other accuracy information.” You can obtain the full NGS datasheet for CARGO.
The NGS Data Sheet for Height Modernization Station CARGO (DJ5933) PROGRAM = datasheet95, VERSION = 8.71 National Geodetic Survey, Retrieval Date = JULY 12, 2015 DJ5933*********************************************************************** DJ5933 HT_MOD – This is a Height Modernization Survey Station. DJ5933 DESIGNATION – CARGO DJ5933 PID – DJ5933DJ5933 STATE/COUNTY- NC/NEW HANOVERDJ5933 COUNTRY – US DJ5933 USGS QUAD – WILMINGTON (1979)DJ5933DJ5933 *CURRENT SURVEY CONTROL DJ5933 ______________________________________________________________________ DJ5933* NAD 83(2011) POSITION- 34 12 27.89075(N) 077 57 16.40009(W) ADJUSTED DJ5933* NAD 83(2011) ELLIP HT- -34.732 (meters) (06/27/12) ADJUSTED DJ5933* NAD 83(2011) EPOCH – 2010.00 DJ5933* NAVD 88 ORTHO HEIGHT – 2.05 (meters) 6.7 (feet) GPS OBS DJ5933 ______________________________________________________________________ DJ5933 NAVD 88 orthometric height was determined with geoid model GEOID03 DJ5933 GEOID HEIGHT – -36.78 (meters) GEOID03DJ5933 GEOID HEIGHT – -36.80 (meters) GEOID12BDJ5933 NAD 83(2011) X – 1,101,934.174 (meters) COMPDJ5933 NAD 83(2011) Y – -5,164,049.037 (meters) COMPDJ5933 NAD 83(2011) Z – 3,565,508.167 (meters) COMPDJ5933 LAPLACE CORR – -5.30 (seconds) DEFLEC12B
DJ5933
DJ5933 Network accuracy estimates per FGDC Geospatial Positioning Accuracy
DJ5933 Standards:
DJ5933 FGDC (95% conf, cm) Standard deviation (cm) CorrNE
DJ5933 Click here for local accuracies and other accuracy information.
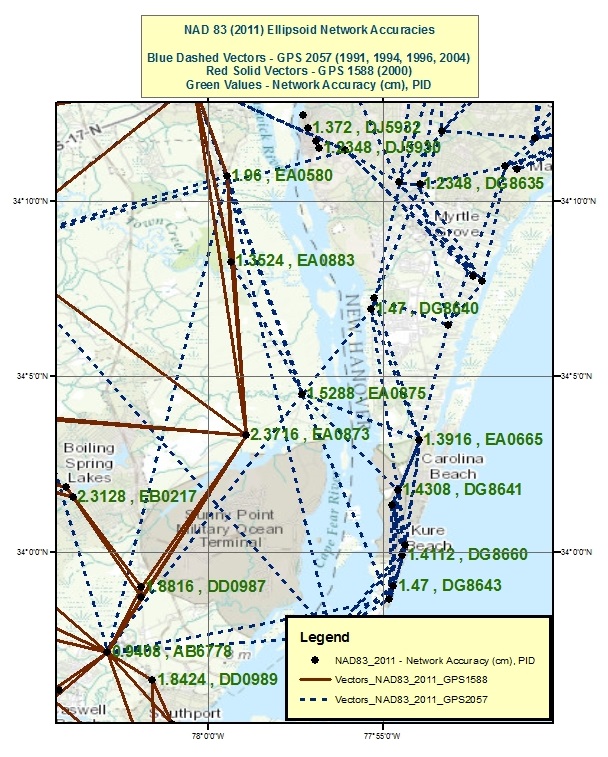
Local accuracies provided on the NGS datasheet can be used to determine if closely spaced stations were simultaneously observed during the same session. If two stations were simultaneously observed during the same session, they will have a local accuracy value listed in their table. Station TOWN CREEK (EA0883) is an example of a station that was simultaneously observed by BR 7 (EA0873) in one GNSS project and by LILIPUT (EA0875) in a different project. (Figure 1 depicts these stations and their NAD 83 (2011) network accuracy values.) Looking at the highlighted section of the tables below, station EA0883 is listed in the local accuracy tables for EA0873 and EA0875, so it was simultaneously observed during sessions with EA0873 and EA0875.
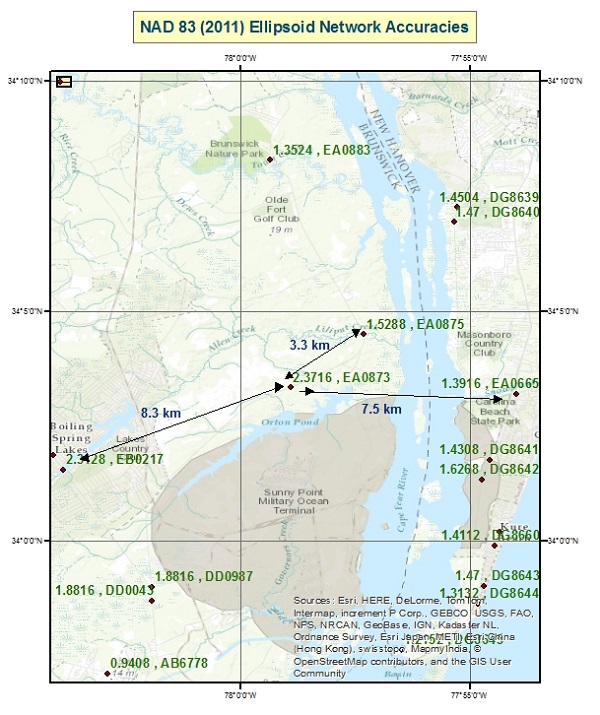
Saying that, we can also use the tables to show that EA0873 and EA0875 were not simultaneously observed during the same session. That is, EA0873 is not listed on EA0875 local accuracy table and EA0875 is not listed on EA0873 local accuracy table so they were not processed simultaneous in a session. Figure 2 depicts the two GNSS projects that include observations involving stations EA0873 and EA0875. The user can perform the same procedure to determine that stations EB0217 and EA0873, 8.3 km apart, were not simultaneously observed during the same session, and similarly EA0873 and EA0665, 7.5 km apart, were not simultaneously observed during the same project. Please note I am not suggesting that anything is wrong with these surveys; there may be good reasons why these stations were not simultaneously observed during the same project. I am only using it as an example in this column. Network and local accuracy values are good indicators of potentially “how good” a station is relative to its neighbor, but they should always be evaluated and investigated. My intent is to provide the user with tools for evaluating the quality of published NAD 83 (2011) ellipsoid heights. This is important because published coordinates are used to evaluate the adjustment results of new projects.
Local and Network Accuracy Data for NGS Datasheet – EA0873 Program lna_ret Version 2.7 Date April 6, 2015 National Geodetic Survey, Retrieval Date = JUNE 30, 2015 EA0873 ************************************************************ EA0873 ACCURACIES – Complete network and local accuracy information. EA0873 DESIGNATION – BR 7 EA0873 PID – EA0873 EA0873 EA0873 Horiz and Ellip are the horizontal and ellipsoid height accuracies EA0873 at the 95% confidence level per Federal Geographic Data Committee EA0873 Geospatial Positioning Accuracy Standards. SD_N, SD_E and SD_h are EA0873 the standard deviations (one sigma) of the coordinates (NETWORK) or EA0873 of the difference in the coordinates (LOCAL) in latitude, longitude EA0873 and ellipsoid height. CorrNE is the (unitless) correlation EA0873 coefficient between the latitude and longitude components of either EA0873 the coordinate (NETWORK) or coordinate difference (LOCAL). Dist is EA0873 the three-dimensional straight-line slope distance, in km, between EA0873 station EA0873 and the corresponding local station. Local stations EA0873 are stations processed simultaneously in a session regardless of EA0873 distance. EA0873EA0873 Accuracy and standard deviation values are given in cm.EA0873EA0873 Type/PID Horiz Ellip Dist(km) SD_N SD_E SD_h CorrNEEA0873 ——————————————————————-
Local and Network Accuracy Data for NGS Datasheets – EA0875 Program lna_ret Version 2.7 Date April 6, 2015National Geodetic Survey, Retrieval Date = JUNE 30, 2015 EA0875 ********************************************************** EA0875 ACCURACIES – Complete network and local accuracy information. EA0875 DESIGNATION – LILIPUT EA0875 PID – EA0875 EA0875 EA0875 Horiz and Ellip are the horizontal and ellipsoid height accuracies EA0875 at the 95% confidence level per Federal Geographic Data Committee EA0875 Geospatial Positioning Accuracy Standards. SD_N, SD_E and SD_h are EA0875 the standard deviations (one sigma) of the coordinates (NETWORK) or EA0875 of the difference in the coordinates (LOCAL) in latitude, longitude EA0875 and ellipsoid height. CorrNE is the (unitless) correlation EA0875 coefficient between the latitude and longitude components of either EA0875 the coordinate (NETWORK) or coordinate difference (LOCAL). Dist is EA0875 the three-dimensional straight-line slope distance, in km, between EA0875 station EA0875 and the corresponding local station. Local stations EA0875 are stations processed simultaneously in a session regardless ofEA0875 distance.EA0875EA0875 Accuracy and standard deviation values are given in cm.EA0875EA0875 Type/PID Horiz Ellip Dist(km) SD_N SD_E SD_h CorrNE
I haven’t discussed all procedures documented in NGS 58 here. There are other minor, but very important, procedures that the user must follow, such as use of precise ephemerides, taking a rubbing of the mark; the reader is referred to NOAA Technical Memorandum NOS NGS-58, “Guidelines for Establishing GPS-derived Ellipsoid Heights (Standards: 2 cm and 5 cm), Version 4.3,” for more details.
This column discussed procedures that need to be followed to detect, reduce and eliminate error sources to estimate accurate GNSS-derived ellipsoid heights. Analysis of the quality of project data should be based on repeatability of measurements, adjustment residuals and analysis of loop closures. Please be aware that repeatability and loop closures do not always disclose all problems, and that is why it is important to adhere to the procedures outlined in NGS’ publications.
It is important to understand geoid models when estimating GNSS-derived orthometric heights. The user should understand the differences between NGS’ scientific gravimetric geoid model and hybrid geoid models, and why it is important to use both types of geoid models in an analysis. As I mentioned in Part 1, the latest NGS hybrid geoid model, Geoid12B, is made consistent with the published NAVD 88 heights. This means you will be consistent with NAVD 88 when using GEOID12B to estimate GNSS-derived orthometric heights. However, this doesn’t guarantee that your GNSS-derived orthometric heights are accurate. NGS’ new Beta experimental geoid height model xGEOID14B is not distorted to fit the published NAVD 88 heights so it is useful for identifying valid NAVD 88 benchmarks. In my next column, I’ll address how to use these geoid models and published NAD 83 (2011) ellipsoid heights to evaluate potential issues with published NAVD 88 heights.
Figure 1. NAD 83 (2011) Ellipsoid Network Accuracies – units cm (Network accuracies were obtained from NGS datasheets).Figure 2. NAD 83 (2011) Network Design for Stations EA0873 and EA0875. [Note: GNSS Vectors for GNSS projects GPS 1588 and GPS 2057 were provided by NGS].
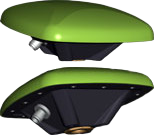
The GrAnt by JAVAD GNSS is a versatile high-performance antenna.
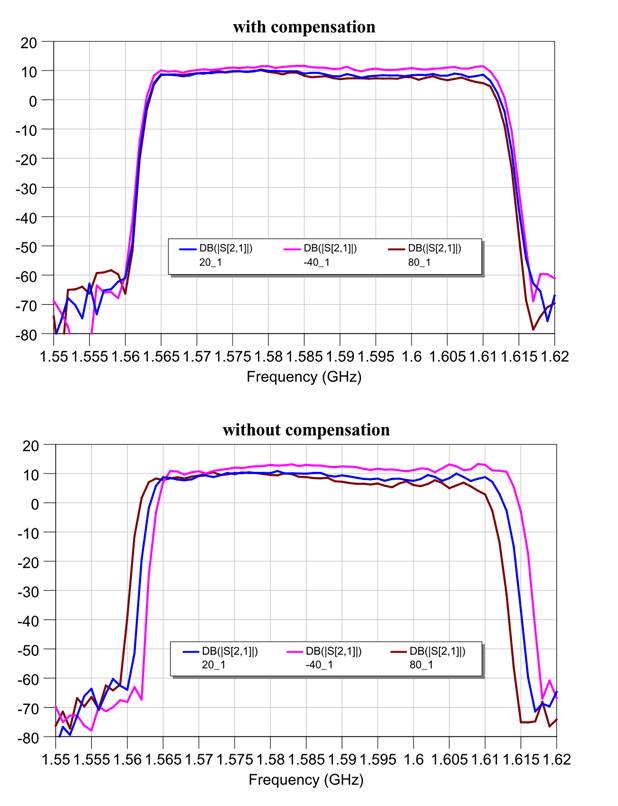
With J-shield — the JAVAD GNSS filter that protects GPS L1, Galileo L1 and GLONASS L1 bands — the GrAnt antenna can track GPS, GLONASS, Galileo, BeiDou, WAAS, EGNOS, MSAS, GAGAN and QZSS signals. J-shield brings in all the useful signals intact and rejects out-of-band signals with the slope of about 12 dB/MHz. Similarly, the filter protects GPS L2, GPS L5, GLONASS L2, GLONASS L3 and Galileo L5, and has slope of about 9 dB/MHz. The filters have been extensively tested with five different innovative tests that prove that the filters also improve the performance of GNSS receivers.
The GrAnt antenna can be mounted on flat surfaces with four screws or mounted on standard poles (5/8-11 or 1-14 inch thread). The antenna cable can be connected via the standard TNC (N-type optional) connector on its side or routed through the center of the antenna for ultimate protection in harsh environments.
An optional ground plane can be purchased to increase multipath mitigation.
The top-level model, the GrAnt-G5T, supports a wider band to accommodate additional signals, with frequencies of 1555-1610 MHz and 1164-1300 MHz. Full signal capability of the GrAnt-G5T is:
Drifting tabular icebergs viewed from the Amundsen. (Photo courtesy of Greg McCullough, University of Manitoba)
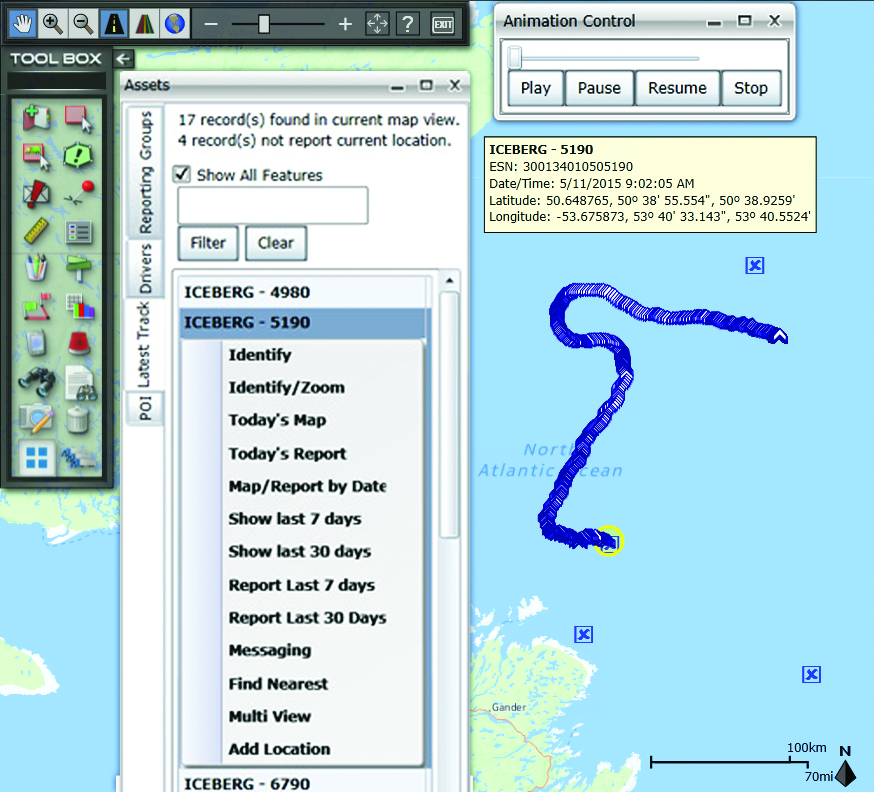
A Canadian expedition team used GeoDecisions’ GeoILS platform to help track icebergs during a voyage to better understand how icebergs drift. An intelligent location server using the Esri ArcGIS platform, GeoILS enables users to monitor and locate assets and facilitate quick and coordinated responses.
GeoDecisions, an information technology company specializing in geospatial solutions, partnered with Solara Remote Data Delivery Incorporated, Canada’s Carleton University and Esri during the project.
The FT2000IB Solara tracker. (Photo by Tom Tessier)
Led by University of Manitoba Scientist David Barber, the crew of Canadian Coast Guard icebreaker Amundsen sailed off the coast of Newfoundland and Labrador to research ice hazard mitigation, the effects of climate change, and polar region technology requirements. GeoILS location intelligence helped crew members visualize, analyze, and leverage project-pertinent data.
“During the expedition, researchers and scientists used GeoILS to assess drifting through sensor monitors attached to the icebergs,” said Brian Smith, vice president of commercial solutions with GeoDecisions. “In addition to reporting and notifications, GeoILS provided the project team with maps that were tailored by selecting desired iceberg information and the geographic area of interest based on user-defined criteria.”
GeoDecisions’ data portal was used with Iridium Solara tracking devices during the iceberg research project. Two icebergs were outfitted with FT2000IB Solara trackers, explained Derek Mueller, assistant professor and physical geography program supervisor with Carleton University.
THE GROUND control point and beacon. (Photo by Derek Mueller)
For each iceberg, two beacons were attached for redundancy and to determine the iceberg’s rotation. Holes were drilled and stakes inserted, then GeoDecisions Platform Tracks Icebergs the trackers attached to the stakes.
The trackers were also used as ground control points for photogrammetry, specifically the structure from motion ranging imaging technique.
“GeoILS and the satellite tracking beacons worked very well during this project,” Mueller said. “Thanks to our partners’ efforts, we now have a great new suite of tools for examining our data.”
“We are excited to provide tools to scientists who are gaining critical insights into the behavior of icebergs and global climate change,” said Tom Tessier, president of Solara Remote Data Delivery Incorporated.
The last tracker stopped transmitting on June 13. “The others ended earlier, likely because the iceberg rolled or broke up,” Mueller said.
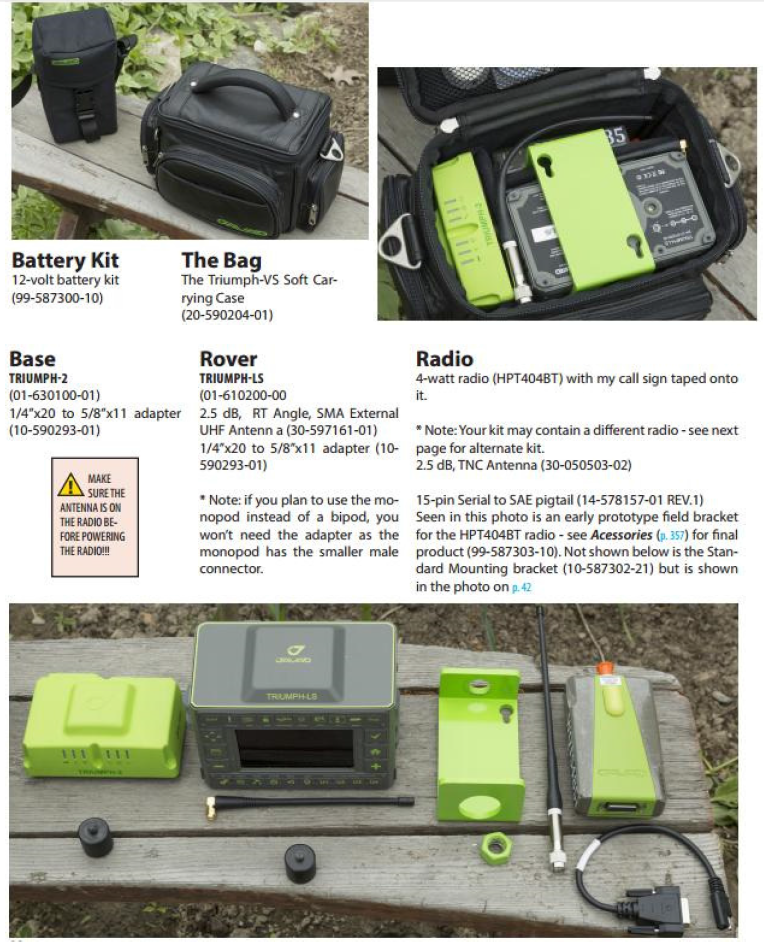
I follow the surveyor connect message board and have seen some general discussion of the form factor of the Javad Triumph LS. I wanted to go into a little more detail on the form factor and portability of a couple of the receivers in the Javad GNSS lineup.
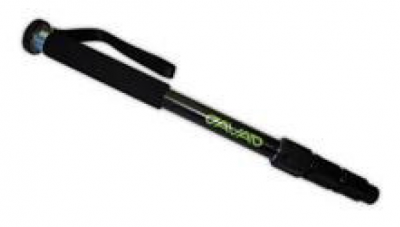
Most surveyors that have been using RTK GPS equipment have been trained to keep their rod height at 2 meters to reduce error in rod height adjustment and to be able to get above general multipath hardships. This is not required with the Javad Triumph LS. The advanced multipath reduction of the Triumph LS gives the surveyor the flexibility to have the receiver anywhere from just over 1-foot high to as high as your pole may reach. The Triumph LS comes standard with a collapsible monopod pictured here.
With the Triumph LS being an advanced GNSS receiver and data-collection system all in one, you may ask. “But what if I have to raise the pole above an obstruction to get a shot?” The Triumph LS is equipped with an audible tone and time-delayed shot setting, an internal level, an internal compass and a flashing LED light on the bottom of the receiver that all work together to allow the surveyor to collect points on objects with the receiver high above the surveyor’s head (out of sight). The LS is also equipped with a proximity sensor that will allow you to take a shot even if you cannot reach the receiver’s screen. For instance, you are out in a swamp and you can reach out and get the pole generally level (with internal tilt compensation turned on), but you cannot reach up and start collecting the shot. Wave your hand or a lath in front of the LS, and it will start recording your shot. So no matter your height or the height of the obstructions, you can still get the shot that you need.
The form factor of the LS, while it is much different than what we are used to using, works extremely well. The LS rover paired with a Triumph 2 base is one of the most portable systems on the market as well. The Triumph LS, Triumph 2, 4-watt external UHF radio and UHF power cable all fit into a small camera bag.
This is the system that I personally use on a regular basis. I find that the ability to collapse the monopod allows me to easily use both hands while riding on a four-wheeler along with the ability to easily pack up the system on the four-wheeler to set up the base in more remote locations. With nearly two years of using this system, the form factor has not once been an issue. Quite the contrary — the form factor makes it much easier to navigate dense brush and have more control over the equipment.
For more information on Javad’s J-Field software, the Triumph LS or other Javad GNSS solutions, please feel free to visit www.javad.com, email [email protected] or call 1-888-550-5301 or 1-408-770-1770.
A Mountaineering Survey Team Determines K2’s Actual Height
Surveying the world’s highest peaks is a daunting task. One international survey team set out to measure the Himalaya’s K2 peak, the second highest in the world after Mount Everest.
In 2004, 50 years after an Italian team led by Ardito Desio first summited, a team tried to measure K2 with GNSS surveying equipment, but the attempt to bring the GNSS receiver to the top failed when a climber fell.
For the most recent attempt, a Pakasti-Italian team took along a rugged industrial survey system 60 years after the first summiting, in June–August 2014.
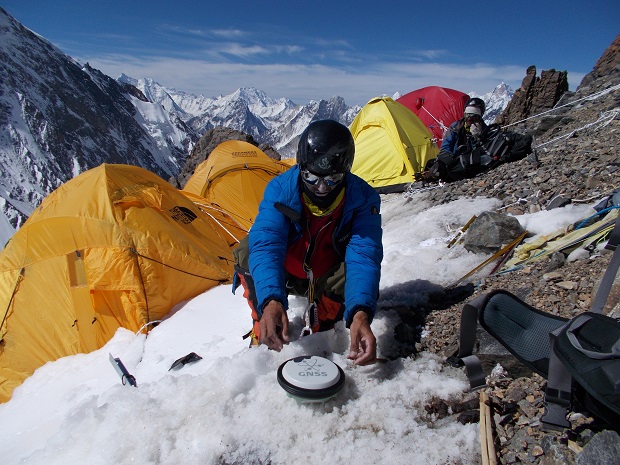
The team performed measurements at five different climbing campsites and on the K2 summit, using GNSS technology to collect the most accurate measurements ever made of K2.
The measurements were accomplished by Pakistan’s Rehmat Ullah Baigh and Italy’s Michele Cucchi, who set up the receiver at each stop and allowed it to remain for approximately 20 minutes to collect the latitude, longitude and altitude of each point from the available satellites.
Setting up camp also meant setting up a GNSS receiver to gather data.
One reference receiver was permanently positioned by team technical leader Maurizio Gallo close to the K2 Base Camp at the Gilkey Puchot Memorial, which is dedicated to climbers who died on K2. A second reference receiver was placed in Skardu, a final stop before heading up the mountains. At Skardu, computer expert Fida Hassain from Central Karakorum National Park helped install and process the transmitted data along with researcher Aamir Asghar and Giorgio Poretti, professor at the University of Trieste. The coordinated network of two permanent GNSS stations allowed data from the summit to be processed with excellent precision and is still in operation today.
After the climb, the data was downloaded from the receivers and analyzed. The GNSS survey results lowered K2’s height from its previous altitude of 8,610.34 meters (28,248.03 feet) to 8,609.02 meters (28,244.75 feet) — 1.5 meters (3.3 feet) shorter than previously believed.
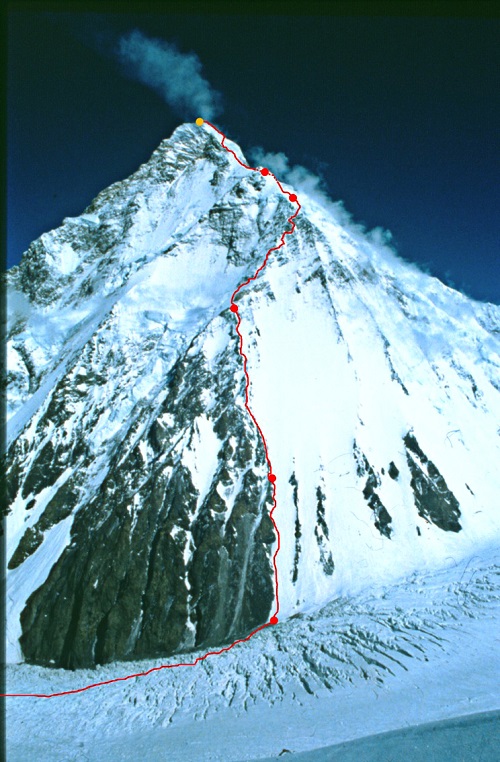
The route to K2’s summit.
Yet the biggest surprise was at K2’s Camp Four on the Abruzzi Spur, where expeditions on this route begin their final ascent to the summit. Previous measurements stated that the route began at 7,900 meters (25,920 feet). The new data collected proves that the route starts at 7,747.029 meters (25,416.667 feet), making the climb 150 meters (492 feet) longer than previously recorded. This is a challenging difference for K2 climbers, who at this point are struggling for weeks with the weakening effects of altitude sickness
and the stress of staying focused.
The team also plans to climb Mount Everest, where a reference station is located very close to the EVK2CNR’s Pyramid International Laboratory on the Nepali side of Mount Everest.
Manufacturer
The survey team used the Leica Viva GS14 GNSS receiver and two GX1230+ reference receivers and antennae provided by LeicaGeosystems. Leica Geosystems used the opportunity to test its equipment’s portability, resistance to very low temperatures and rugged use on rough tracks.
Adapted from an article by Katherine Lehmuller and Marco Mozzon in the Reporter (#72), the Leica Geosystems customer magazine, and other sources.
A team of four climbers has returned from the highest point in North America, Mount McKinley in Alaska, with new GPS survey data to determine a more precise height of the mountain’s summit. The data collected will update the commonly accepted elevation of McKinley’s peak, 20,320 feet. The last survey was completed in 1953.
The USGS, along with NOAA’s National Geodetic Survey (NGS), and the University of Alaska Fairbanks (UAF), are the primary partners supporting the survey. The survey party included three mountaineers from CompassData, a subcontractor for Dewberry and a scientist from UAF’s Geophysical Institute.
Using modern GPS survey equipment and techniques, the partners will be able to report the summit elevation with a much higher level of accuracy and confidence than has been possible in the past. It is anticipated the newly surveyed elevation will be announced in late August.
The Leica Geosystems ZenoCollector2 comes with Esri Collector for ArcGIS.
Esri Collector for ArcGIS, a configurable mobile app for collecting and editing data in the field, has combined with the Zeno 20, Leica Geosystems’ ultra-rugged Android-based professional-grade handheld, in a new solution called ZenoCollector. ZenoCollector uses Collector for ArcGIS as its main user interface and comes bundled with an ArcGIS Online organizational subscription for one year.
“Esri and Leica Geosystems recognize that enterprises may have particular field data collection challenges that smartphones can’t ideally meet,” said Esri president Jack Dangermond. “We’re excited to combine Collector for ArcGIS with Leica Geosystems’ industry-standard surveying units to create a more rugged and accurate solution for the more exacting needs of organizations.”
ArcGIS Online connects ZenoCollector to the ArcGIS platform, automatically syncing field changes to enterprise information and giving everyone access to the latest data gathered in the field. Collector for ArcGIS also supports offline data collection. Any updates will be synchronized with the map once the user is reconnected.
“We’re excited to raise mobile data collection solutions to the next level of precision and interoperability through rigorous connectivity between our survey-grade Leica Zeno series and Esri’s GIS solutions,” said Hexagon Geosystems President Juergen Dold. “This industry collaboration between Leica Geosystems and Esri is another joint commitment to make it easier for professionals around the world to capture, manage, and share their data, regardless if they’re in the office or the field, without sacrificing precision or interoperability.”
Although Collector for ArcGIS is most often used on smartphones, field crews may need higher precision that only a dedicated survey device can deliver. ZenoCollector contains a professional-grade GNSS receiver that provides significantly higher position accuracies than GPS receivers on smartphones and other handheld GIS devices on the market.
Leica’s Zeno series devices are also waterproof, even with the latch open, suiting the requirements of organizations operating in wet environments that would stress the tolerances of consumer-grade mobile devices.
Septentrio, a designer and manufacturer of GNSS receivers, has launched a new software suite called PinPoint-GIS, which is designed to make GIS data collection and visualization straightforward. Septentrio’s PinPoint-GIS provides several methods of data collection, based on a standard web browser hosted on the Altus APS-NR2 and a mobile app integrated with Esri’s ArcGIS or other GIS mapping systems.
Users of PinPoint-GIS benefit from bringing the data-collection process into their familiar GIS environment, Septentrio said. Data collected with Altus and Septentrio receivers is directly available in the user’s GIS application. This data is processed into the database without any intermediary steps, greatly reducing the time and complexity of the collection process for the user. This allows the user to focus on the project objectives by easily customizing and updating maps instead of losing time on the mechanics of data collection and transmission.
Altus APS-NR2 and GeoPod are well known for providing consistent and accurate data. Thanks to PinPoint-GIS, this data becomes seamlessly integrated with the GIS database. The data becomes easily accessible to the field worker though existing hardware such as commercial and ruggedized mobile devices, regardless of their operating system.
“By introducing PinPoint-GIS, Septentrio is committed to making accurate and reliable GIS collection as simple and cost effective as possible. Once installed Pinpoint GIS works without user involvement to place high quality positions into the users existing GIS data collection tools by using the three components of the software,” said Gustavo Lopez, PinPoint-GIS product manager. “Thanks to PinPoint-GIS, Septentrio provides a seamless interface for capturing data in the field, customizing maps, access to data and user functionality. More field workers can get greater productivity from their existing GIS tools.”
Septentrio will be presenting PinPoint-GIS at Esri AEC Summit, held at the Manchester Grand Hyatt July 18-21, and at the Esri User Conference, held July 20-24. Both events take place in San Diego, Calif.
Esri President Jack Dangermond will deliver the keynote speech at Esri UC.
More than 16,000 people from 120 countries around the world are expected to converge in San Diego to discuss the power of maps and applying geography at the 2015 Esri User Conference (Esri UC). The Esri UC and related events will take place from July 18–24, featuring a variety of speakers from a presidential candidate to global first responders. Attendees will share ideas and best practices for improving our world through maps.
“We have millions of users around the globe who do amazing things with our technology every day,” said Esri president Jack Dangermond. “The User Conference is our opportunity to recognize their important work, learn from them, and empower them with even better tools and techniques to continue their mission.”
Other featured speakers will include operations staff from Hartsfield-Jackson Atlanta International Airport, executives from JPMorgan Chase, the director of Strategic Cooperation at the International Centre for Integrated Mountain Development (ICIMOD), and the president and CEO of the National Geographic Society. Former Maryland governor Martin O’Malley headlines a list of innovators from across every industry who will demonstrate how geospatial technology can make government smarter, combat global health challenges, ensure public safety, and drive greater revenues for businesses.
With a full week of activities, the 2015 Esri User Conference is shaping up to be the biggest yet.
Starting Off the Week with a Bang. Before the Esri UC even kicks off, a series of concurrent events related to business; education; national security; architecture, engineering, and construction (AEC ); and 3D mapping will take place July 18 and 19 in and around the San Diego Convention Center. These focused events will give attendees a deeper dive into various functional areas and equip them with an action plan to immediately invigorate their own organizations.
Real Stories from Real People. Throughout the week, more than 1,000 users will deliver presentations detailing how GIS helps their organizations in a number of ways. Whether they’re onstage for Monday’s Plenary Session or leading one of the nearly 300 moderated paper sessions, speakers will share lessons learned and best practices that can help their peers succeed.
Celebrating 100 Years of Mapping. The National Geographic Society will be on hand to continue celebrating the organization’s 100 years of making maps. A chronicle of the history of maps and the American presidency, from future President Dwight Eisenhower carrying maps into battle during World War II to President Barack Obama receiving official presidential maps in the White House, will present the art and science of where. Gary E. Knell, president and CEO of the National Geographic Society, will also speak at the Plenary Session about the importance of geography in science, technology, engineering, and mathematics (STEM) education.
Innovation on Display. From hundreds of expert-led technical workshops to the expansive GIS Solutions EXPO featuring more than 300 technology companies and start-ups, attendees will immerse themselves in the latest and greatest in mapping and spatial analysis. Attendees will find a range of demos, talks, and resources about hot topics—big data, 3D visualization, unmanned aerial vehicles (UAVs), and more.
The Esri UC and related events will span seven days and offer opportunities for both technologists and managers to understand how geography can be applied to every organization’s challenge to drive better outcomes. For more information, visit esri.com/uc.
By Denis Parrot Guest Columnist, Survey Scene newsletter
I recently read an article by David Doyle entitled “Why Doesn’t my Centimeter Match Your Centimeter?” (May Survey Scene), which painted an interesting portrait of the widespread use of GNSS-based data collection systems. Nowadays, almost everyone can claim to have surveys with centimeter or sub-meter accuracy anywhere in the world, which before was achievable only by a few rare specialists. In many cases, the positions do not always fall at the right place when they are integrated into geographical information systems (GIS). Unfortunately, it is often at this stage that we call on a specialist! The key is in the reference system, also known as datum.
Even if it can become relatively complex when it comes to details, the concept of a reference system when using the GNSS system is essentially identical to conventional surveying techniques. A surveyor always used a reference station for his survey using his theodolite. He stringently maintained his control point network on the territory being surveyed. All his surveys were in reference to his control network (points that are part of a series of controlled polygons). If certain polygons were not well linked to the rest of the network, integration with centimeter precision into the computer-assisted design program (or his geographical information system [GIS]) would be problematic, or even impossible, for the lots linked to the erroneous polygons. And this is exactly what happens with the GNSS system; if the reference is overlooked, GIS integration becomes a real problem.
Without realizing it, GNSS users also use a reference network. If they work in RTK (differential positioning), they use either a VRS (Virtual Reference System) or a station network that sends corrections. In general, these two systems are based on a national reference system (geocentric or not). Users can also use a portable base that they install themselves as needed. When they enter a coordinate into this portable station, they become responsible for the reference system used. During post-processing, the problem remains the same. A position must be entered for the base station and the reference must be known (i.e., the datum).
Example of positions that do not fall at the right place when they are integrated into a geographical information system (GIS).
If they use satellite-based augmentation systems (SBAS), such as the private Omnistar, Veripos or StarFire systems, these systems are generally referenced by a geocentric system (which nowadays includes a temporal drift) defined by international bodies (IGN in France, which maintains, along with several research centers, the International Terrestrial Reference Frame (ITRF)). Today, this method of positioning is known as PPP or precise point positioning.
These different GNSS positioning methods, therefore, do not use the same reference! Each may provide highly accurate coordinates. However, these coordinates are only accurate with regard to their reference. Although this concept may seem very simple, in reality the increasingly common use of these systems by non-specialists often produces strange results.
Below are a few examples of uses that may lead to confusion with reference systems, in terms of “compared with what?”:
A farmer who carries out micro-topography to analyze his fields is pleasantly surprised by the level of altimetric precision he can achieve (within a few cm), using a “single-frequency” receiver. However, when he tries to juxtapose two fields, he may discover an altimetric deviation of up to 2 meters. The reason for this is quite simple: he systematically used local base stations with average coordinates taken in the field as the base coordinates. Normally, he uses one base per field. By not taking into account the consistency of the coordinates for the base stations, without realizing it, this farmer was creating independent references for each of his fields. It is obvious that if the analysis had been done individually on each field, he would not have seen any problem. It is when the two juxtaposed fields are integrated that problems arise.
Photo courtesy of Effigis.
In Quebec, a surveyor uses a Department of Energy and Natural Resources station as a source for RTK differential corrections. This system is referenced to the NAD83 SCRS coordinates system. When he tries to integrate his survey points using the conventional method, which are based on the original NAD83 coordinates system, he will notice inconsistencies of a few to several centimeters. These two coordinate systems (NAD83 ≠ NAD83SCRS) may have inconsistencies of several centimeters from each other.
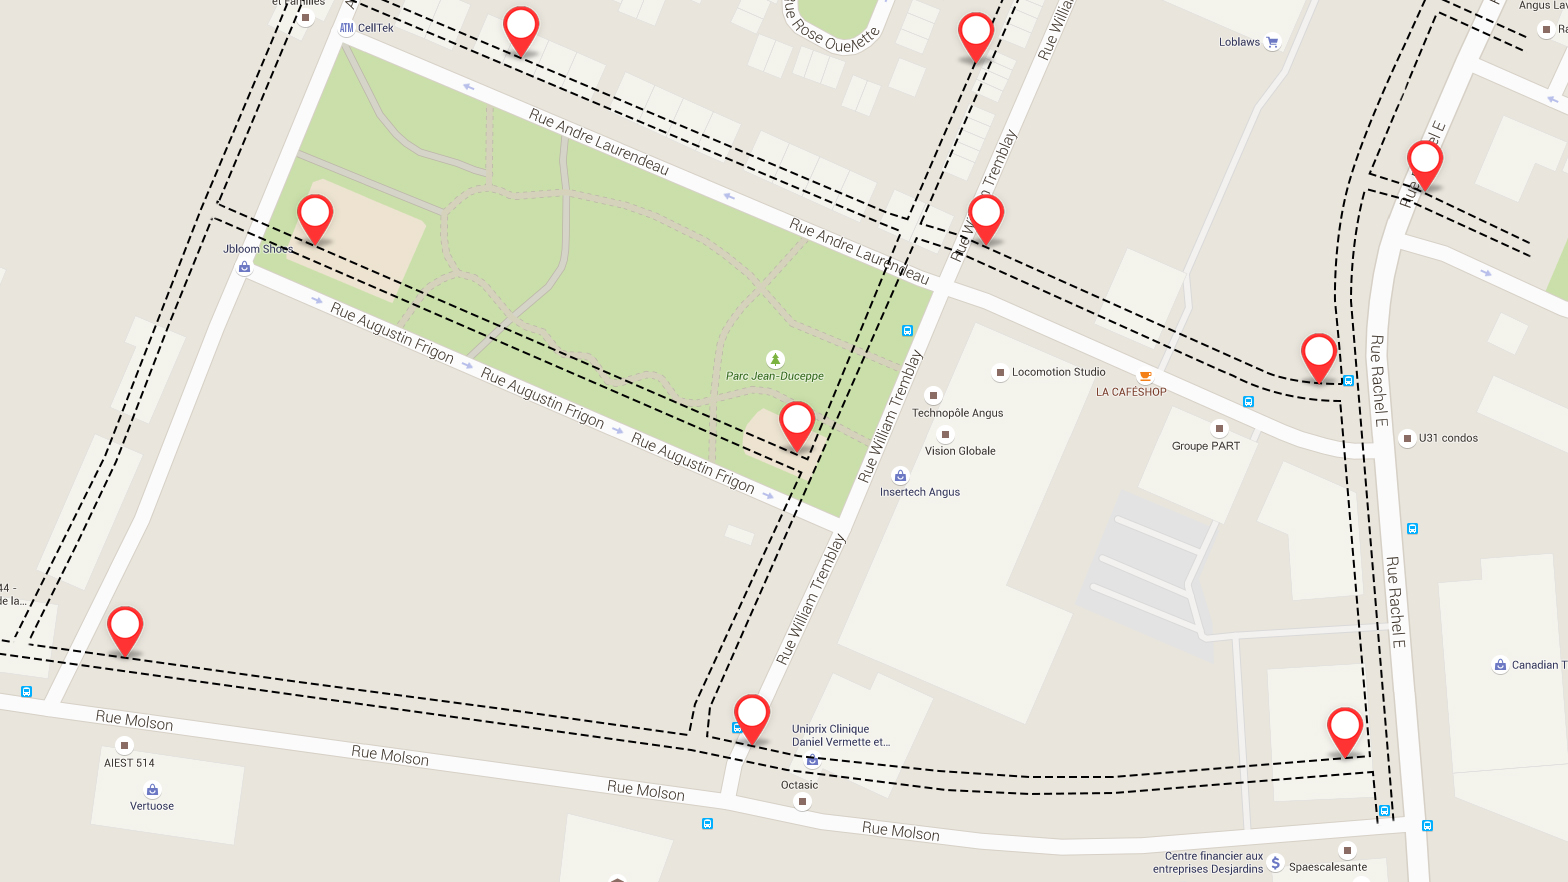
In Canada, an agronomist surveys the position of trees in the city using a portable GNSS system with an SBAS corrections system. Once the survey has been completed and he integrates the position of the trees into the city’s GIS, these all seem to be off by +/- 1.5 m. The SBAS reference systems are all geocentric (within +/- several cm) compared with the NAD83 SCRS system, which is positioned +/- 1.5 m from the Earth’s center!
These three examples illustrate the type of error commonly found in the “reference system” category. The issue here is not GNSS system performance, since we are assuming that the positions obtained are accurate versus the chosen reference. Neither does the issue concern the variations between different reference systems, or the methods or precision of transformations between one reference system and another (this topic is very broad).
Lastly, we should find the answer to the question “But compared with what?” in what we commonly call “metadata.” Regarding GNSS position, this is information related to creating positions: the reference system used, statistics regarding the position estimate, date, different dilution of precision (DOP) values, type of GNSS signal used, etc.
For your next delivery, simply mention “Precise, but compared with what?” or deliver your positions along with full metadata!
Denis Parrot earned a degree in surveying and mapping from Université Laval in 1981, and began his career working in those fields around the world for five years. He then completed graduate studies in Fredericton, New Brunswick, where he earned a master’s in satellite geodesy. With a passion for his area of expertise, Parrot has been involved since 1991 in a host of projects that employ geospatial information to meet the specific needs of various markets and users. He is currently president at Effigis and responsible for the OnPOZ Product division, including the commercial aspect and R&D activities.
This column originally appeared as a blog at the Effigis Geo Solutions website, and is shared with permission.