Using data from satellites to predict and resond to climate-related disasters is considered in a new white paper.
The EU Agency for the Space Programme (EUSPA) and the European Insurance and Occupational Pensions Authority (EIOPA) published the joint white paper.
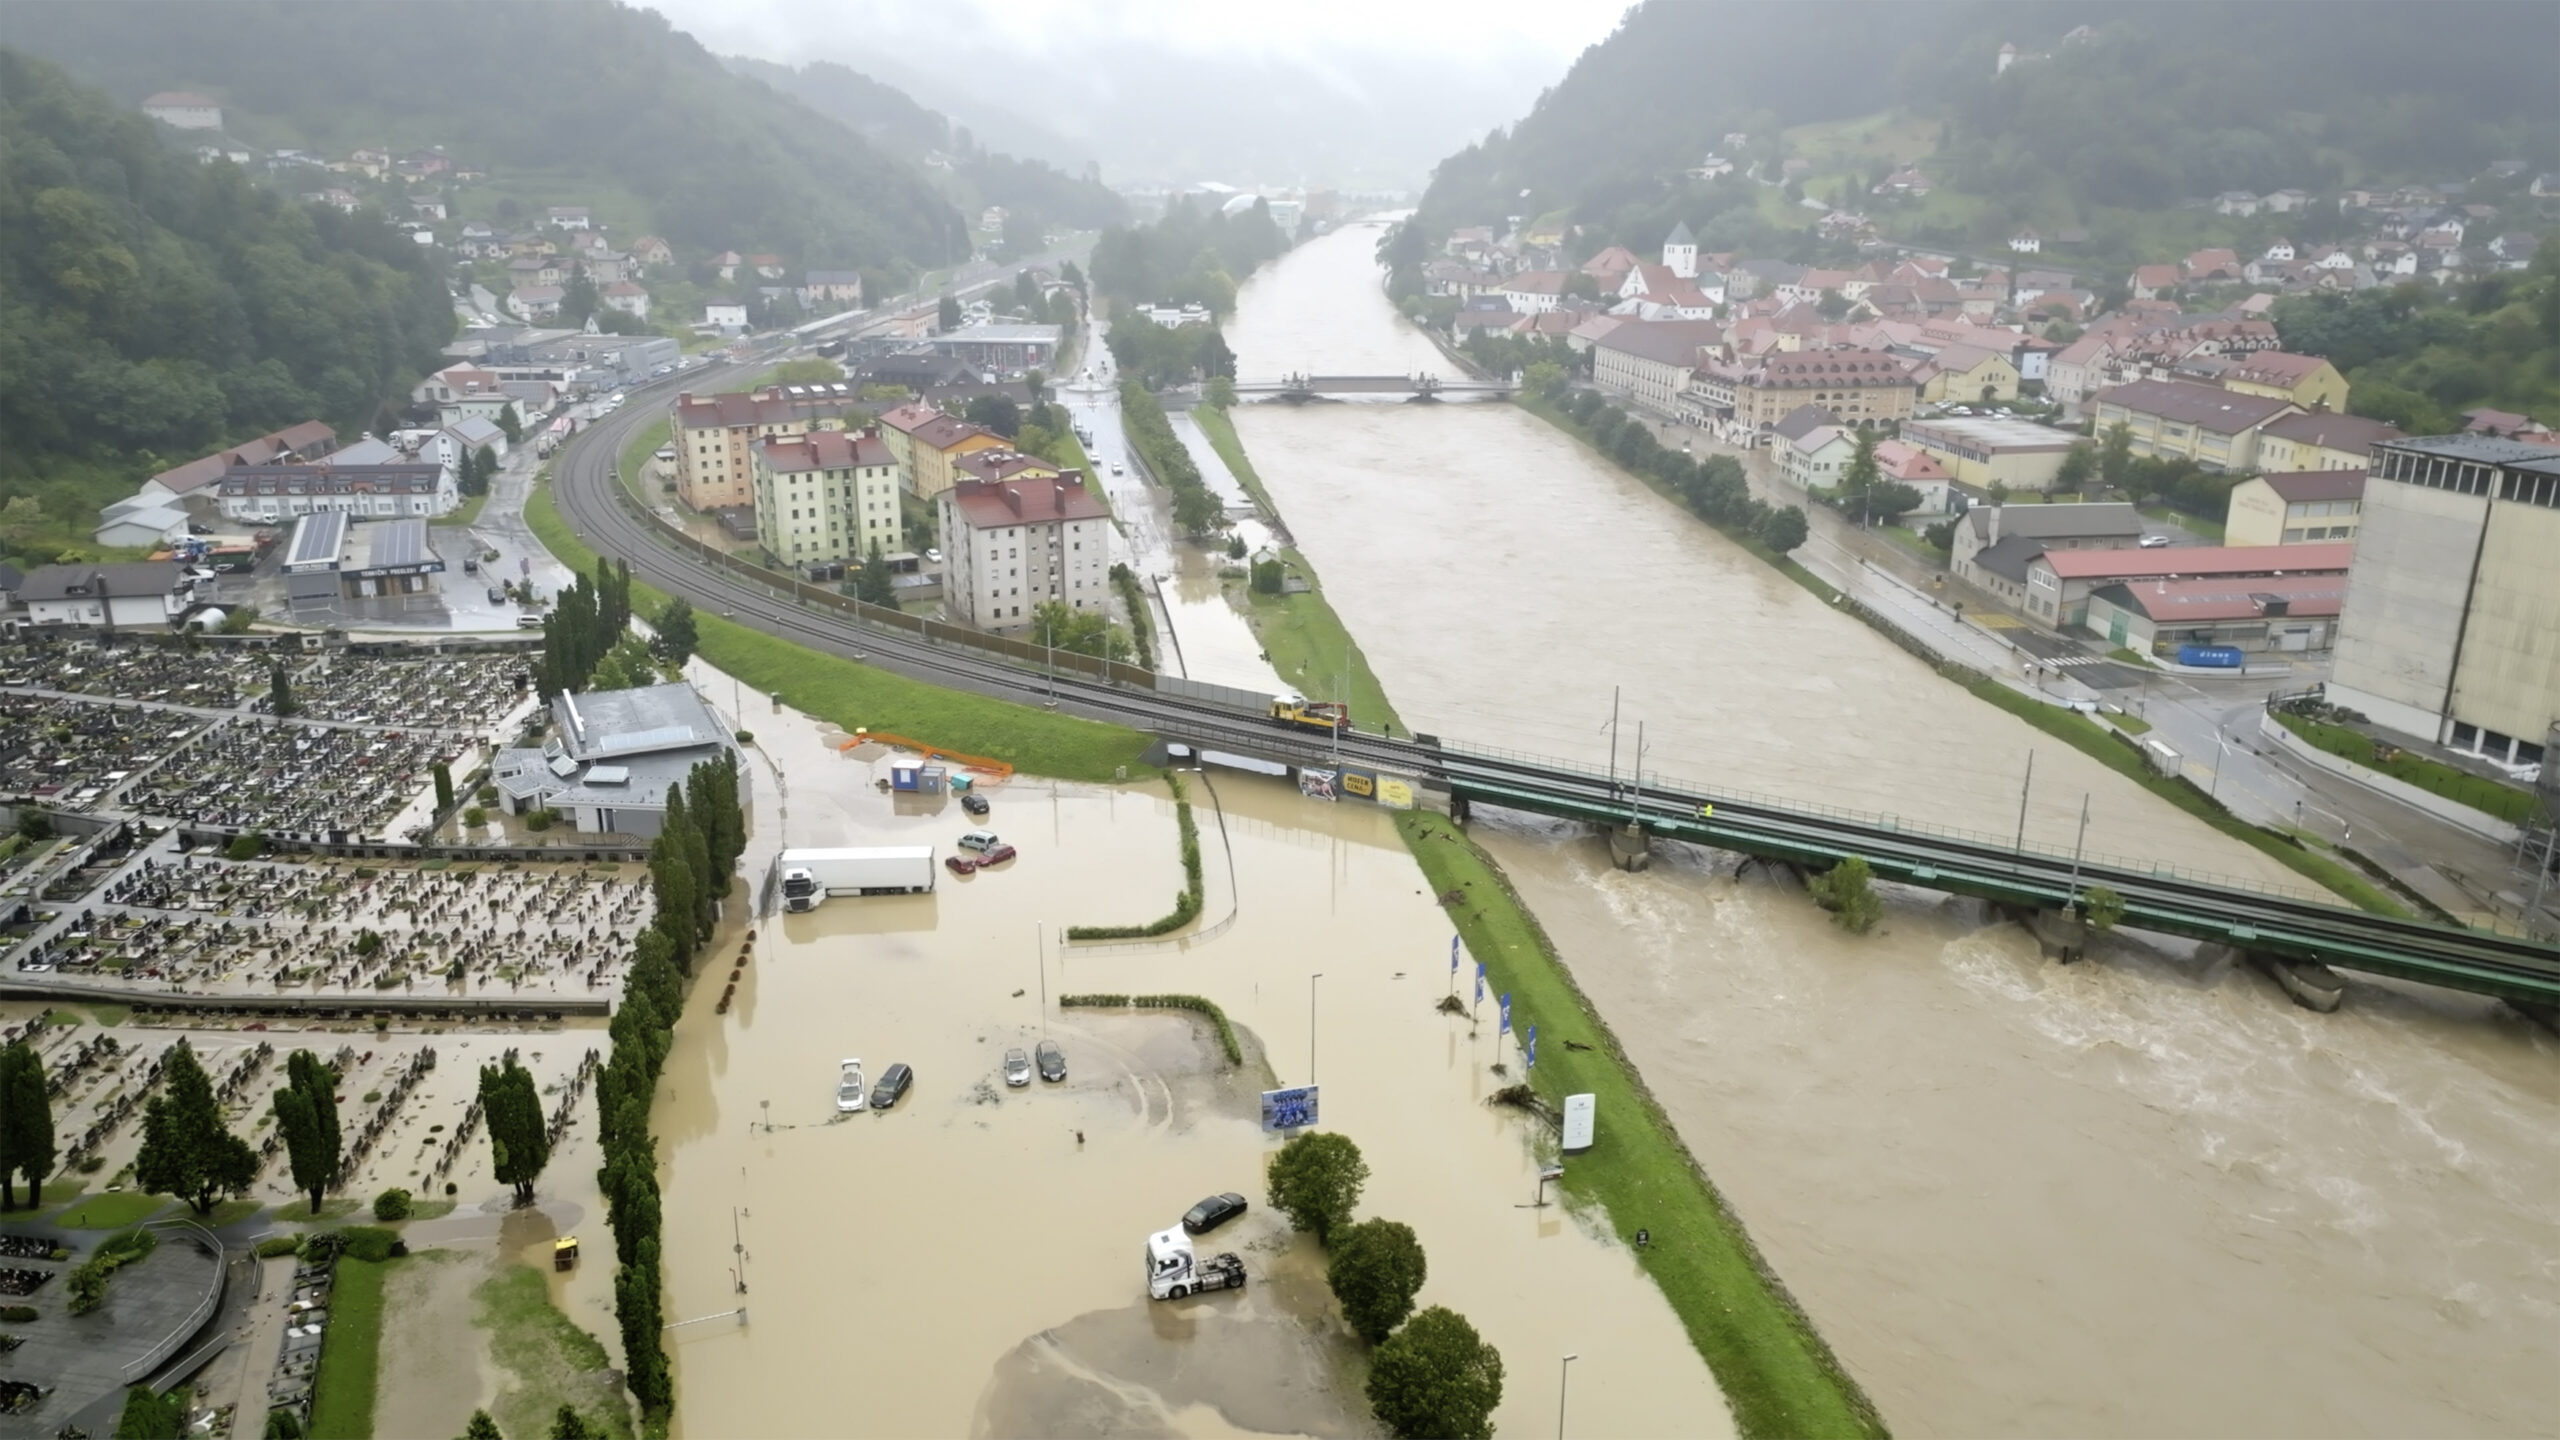
It explores how Earth observation (EO) data could be harnessed to enhance the supervision of natural catastrophes and assess the impact of extreme weather events on Europe’s insurance sector.
As Europe faces escalating climate-related disasters and rising economic losses related to them, the need for more effective risk management and greater resilience against natural catastrophes is paramount — not least through the deployment of innovative solutions.
The white paper is the result of a joint pilot project between EIOPA and EUSPA — highlights the benefits of using open-access Earth observation data from Copernicus to improve the tracking and management of natural hazards.
The project demonstrates that satellite-based EO data offers independent, objective and near real-time geospatial insights that can meaningfully improve risk assessment and risk management practices for insurers, communities and supervisors.
Earth observation technology — especially the open, traceable data that Copernicus provides — can sharpen risk identification, reinforce scenario design and accelerate loss estimates in the aftermath of shocks. Financial supervisors can leverage the technology to:
rapidly identify affected areas and exposed insurance undertakings: Satellite imagery makes it possible to map disaster-affected areas (for example, the extent and trajectory of floods) as events unfold. This granular geospatial data can be matched with Solvency II regulatory reporting to estimate the potential impact of natural catastrophe events on individual insurers (micro-prudential perspective);
estimate overall loss-magnitudes early on by scaling up the micro-level analysis to the sector as a whole (macro-level perspective); and
improve benchmarking, model validation and scenario and stress test design by providing objective, data-driven reference points against which model outputs and reported or calculated losses can be compared.
The collaboration between EIOPA and EUSPA showcases the value of innovation in addressing the challenges posed by climate-related disasters: when used effectively, Earth observation data can contribute to a more resilient and sustainable insurance sector — one that better protects European citizens and businesses from the damaging effects of a warming climate.
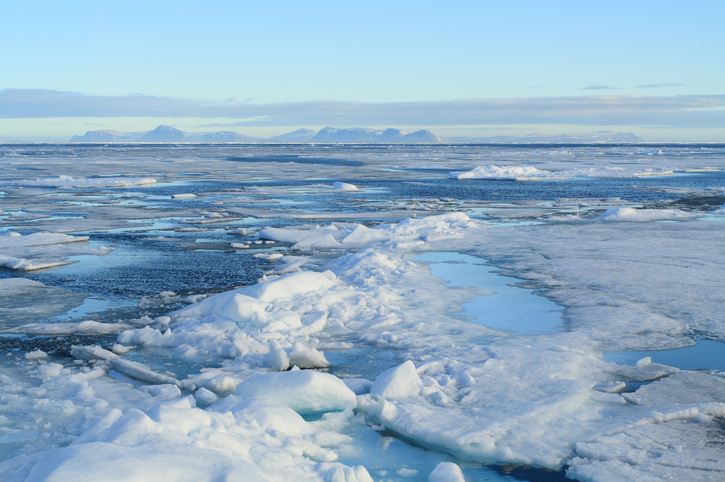
In recent years, scientists have shown that detecting changes in navigation signals from GPS and Galileo after they bounce off Earth’s surface (GNSS reflectometry, or GNSS-R) can deliver valuable information on sea ice. Now research drawing on data from Spire Global has enabled the generation of Arctic-wide sea ice maps, marking a major step forward for the emerging technique.
Spire Global‘s sea ice freeboard maps use data captured by Spire’s GNSS-reflectometry multipurpose listening constellation.
The research — enabled by the Third Party Missions (TPM) programme of the European Space Agency (ESA) — suggests that harnessing reflected navigation signals could become an important complement to established ice-monitoring altimetry missions.
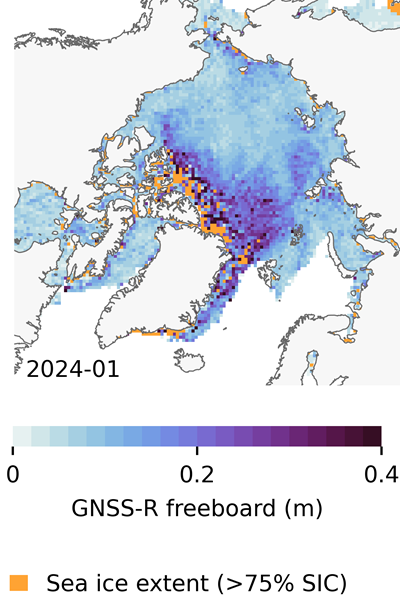
The study leveraged Spire’s GNSS-R data to retrieve sea ice freeboard measurements across an entire winter season. The results show strong alignment with established altimetry datasets, including the ESA’s CryoSat mission, validating the complementary role of commercial satellite data alongside government missions.
Arctic-wide sea ice freeboard map for January 2024. (Credit: ESA)
The study was led by Felix Müller at the Technical University of Munich (DGFI-TUM) and Robert Ricker at the Norwegian Research Centre, experts in GNSS-R.
“The primary purpose of signals emitted from GNSS is to fix the location of a device at any point on Earth,” Müller explained. “However, when these signals bounce off Earth’s surface, their properties change. By analyzing these changes, we can infer information about the characteristics of Earth’s surface.”
“Previous research has shown that this technique works well experimentally,” Ricker added. “Using the Spire constellation, we aimed to demonstrate whether it would hold up on a larger scale by generating an Arctic-wide map of sea ice freeboard, which is a measure of how far ice protrudes above the waterline.”
Spire’s GNSS-R constellation
Spire’s constellation was first used to sample the atmosphere for weather forecasting. Then scientists began exploring other applications. Spire started collecting reflected signals arriving at shallow angles using a technique called grazing-angle GNSS-R. This method is particularly well suited for ice monitoring.
The research team analyzed data detected over the Arctic Ocean and surrounding seas between October 2023 and July 2024. The data was obtained via the TPM program, through which ESA disseminates data from a range of commercial and institutional partners on a free basis for research and development purposes.
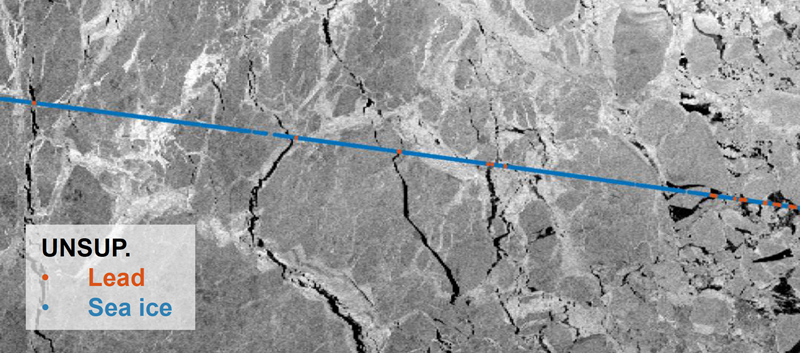
The team focused on one of the most critical challenges in sea ice altimetry: reliably identifying narrow openings in the ice pack, known as leads. These openings are reference points for determining sea surface height and, ultimately, sea ice freeboard.
In turn, sea ice freeboard can be used to infer sea ice thickness — an essential parameter for tracking climate change, estimating sea level, and modeling ocean and weather patterns.
Identifying leads in sea ice with GNSS-R data. (Credit: ESA)
Classifying surface properties
“In the initial phase of the project, we used two complementary methods to identify surface properties based on GNSS-R data, with the aim of identifying leads,” Müller said.
The first — known as the adaptive threshold technique — involved measuring the power of the reflected navigation signal to classify surface type as either water or ice. This method allows rapid processing of the entire GNSS-R dataset, while remaining robust to changes in signal conditions.
The second method — known as unsupervised clustering — offers a more complex approach to classifying surface conditions. In addition to signal power, it considers multiple other signal features that tease out more nuanced information on surface type, including identifying thin or refrozen ice.
Both methods were compared with co-located CryoSat surface-type classifications and Sentinel-1 imagery, confirming that the GNSS-R classifications were largely comparable against conventional satellite products.
Mapping sea ice freeboard
“Building on this classification work, we then took the research to the next step by producing Arctic-wide sea ice freeboard maps from GNSS-R data,” Ricker said.
The team corrected ice surface height measurements generated from GNSS-R data for tidal variations, sea surface height, and atmospheric delays, which is standard practice in altimetry. A refined algorithm then identified where leads in the ice were likely to occur, with the lowest points in these areas revealing estimated sea surface height. Sea surface height estimates were then subtracted from ice surface heights to retrieve freeboard. Using this approach, monthly gridded freeboard products were generated for the full winter season.
The team reported that the GNSS-R datasets showed strong agreement with CryoSat freeboard datasets across much of the Arctic, confirming that GNSS-R can reproduce large-scale patterns previously observed by dedicated altimetry missions. Independent validation against upward-looking sonar measurements in the Beaufort Sea further supported the accuracy of the retrieved freeboard values.
However, as expected, the GNSS-R estimates became less reliable during spring, when surface melt alters reflection characteristics. This limitation is consistent with earlier GNSS-R and radar altimetry studies and remains an active area of research.
The contribution of commercial data
While GNSS signals have long been used for positioning, this research highlights how reflected signal analysis can extend their value into large-scale Earth observation applications, delivering persistent coverage independent of sunlight or weather conditions, said Theresa Condor, Spire Global CEO.
“Advances in miniaturization, digital signal processing, and machine learning have fundamentally changed what’s possible in RF sensing,” Condor said. “Commercial constellations can now deliver persistent, high-quality RF data that complements traditional government systems with greater flexibility and cost efficiency.
“As environmental monitoring requirements intensify, we’re seeing agencies increasingly integrate commercially sourced RF datasets into operational architectures, reflecting the continued maturation of this market and the growing role of commercial infrastructure in government missions.”
“By producing analysis-ready gridded datasets, this work marks an important milestone in the progress of grazing angle GNSS-R from an experimental method to a reliable technique for mapping Arctic sea ice freeboard at scale,” said Matthieu Talpe, Remote Sensing Product Engineer, Spire Global. “In doing so, it strengthens the case for the grazing angle GNSS-R technique employed by the Spire constellation as a valuable complement to existing ESA and partner missions, helping to close observational gaps in one of Earth’s most rapidly changing regions.”
The European Space Agency’s first Scout mission, HydroGNSS, was launched Nov. 28, marking a significant step in advancing global understanding of water availability and the effects of climate change on Earth’s water cycle.
The two twin HydroGNSS satellites were carried into orbit at 19:44 CET aboard a SpaceX Falcon 9 rocket, as part of the Transporter-15 rideshare flight from the Vandenberg Space Force Base in California.
Less than 90 minutes after liftoff, the two satellites separated from the rocket. Then, at 22:45 CET, Surrey Satellite Technology Ltd. (SSTL) in the UK confirmed that they had received signals, indicating that both satellites were safely in orbit around Earth.
How GNSS reflectometry helps
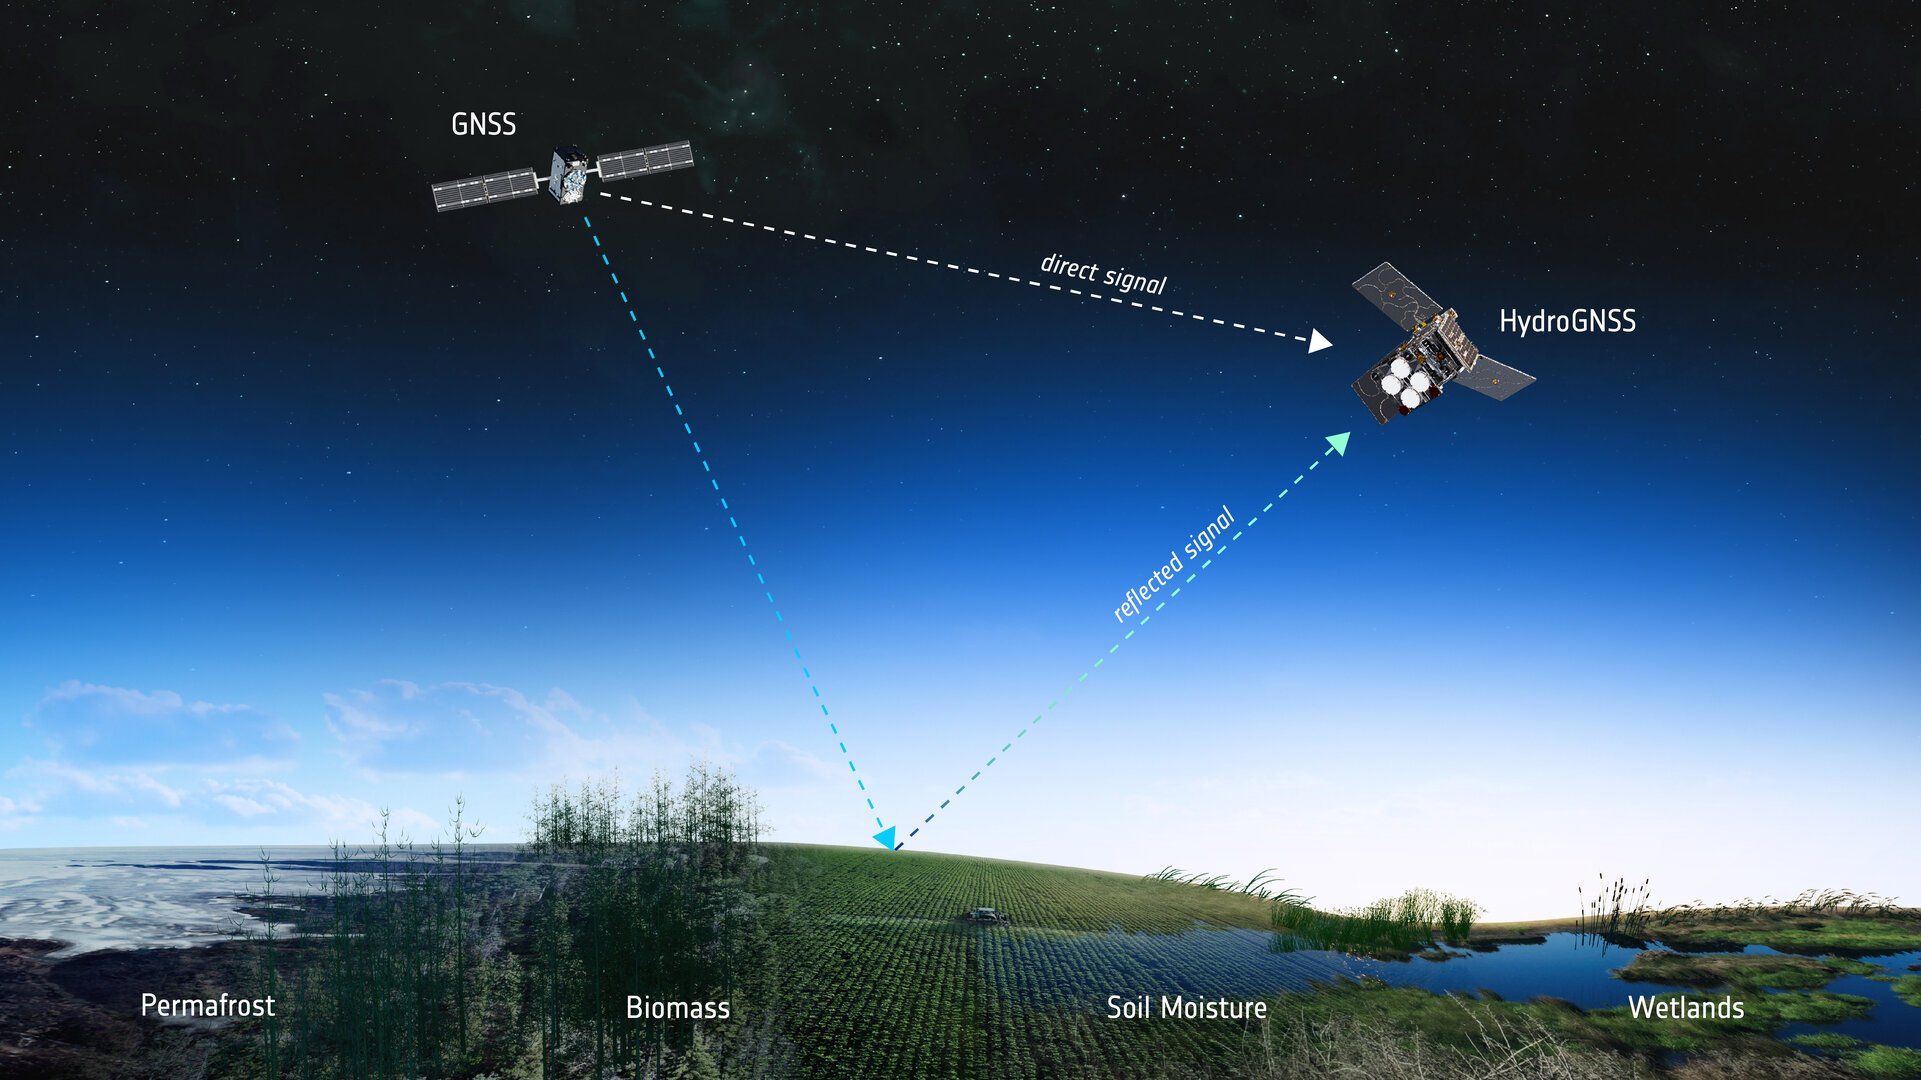
Both satellites use GNSS reflectometry to scout for water by capturing L-band signals from navigation systems such as GPS and Galileo. These navigation satellites transmit L-band microwave signals that change when they are reflected off Earth’s surface.
The HydroGNSS satellites then compare these reflected signals with the signals the satellites receive directly from the GNSS satellites to reveal valuable information about the properties related to the water cycle, and more.
To do this, each HydroGNSS satellite carries a delay doppler mapping receiver and two antennas. A zenith antenna tracks direct GNSS signals and a nadir antenna collects reflected signals and processes them into delay Doppler maps.
Using this technique, the two small satellites, which orbit Earth 180 degrees apart, will measure soil moisture, freeze-thaw state, inundation and above-ground biomass.
Understanding the water cycle
The data will not only be vital for advancing our understanding of Earth’s water cycle, but also for supporting applications such as flood prediction and agricultural planning.
Also, by observing the extent of inundation and areas of wetland, HydroGNSS will help reveal wetlands – important ecosystems that can act as significant sources of methane – often hidden beneath forest canopies.
Information on freeze–thaw states will provide insight into the surface radiation balance, energy and carbon exchanges with the atmosphere, and the behaviour of subsurface permafrost in high latitudes.
Meanwhile, data on above-ground biomass will contribute to estimates of forest carbon stocks and their role in the global carbon cycle.
More Scouts to come
The Scout satellite missions harness small, smart satellites to shrink proven technologies or test bold new ways of observing the planet. Each mission races from concept to launch in three years, on a lean budget of €35 million that covers everything from design and construction to in-orbit operations.
“As the first of ESA’s Scout missions to launch, HydroGNSS marks an important milestone for this new family of rapid, low-cost Earth observation missions, and we extend our thanks to the mission’s prime contractor, SSTL,” said Simonetta Cheli, ESA’s director of Earth Observation Programmes. “The launch also represents a key step in the evolution of our FutureEO programme, where the Scouts embody a fast, agile, innovative and cost-efficient approach – complementing our larger Earth Explorer research missions.
“We now look forward to seeing how HydroGNSS will employ GNSS reflectometry to deliver valuable insights into key hydrological variables that shape Earth’s water cycle,” Cheli said.
ESA’s prime contractor for the HydroGNSS mission is SSTL in the UK. SSTL is also responsible for operating the satellites in orbit and for distributing the data. The mission is also thanks to partial funding from the UK Space Agency.
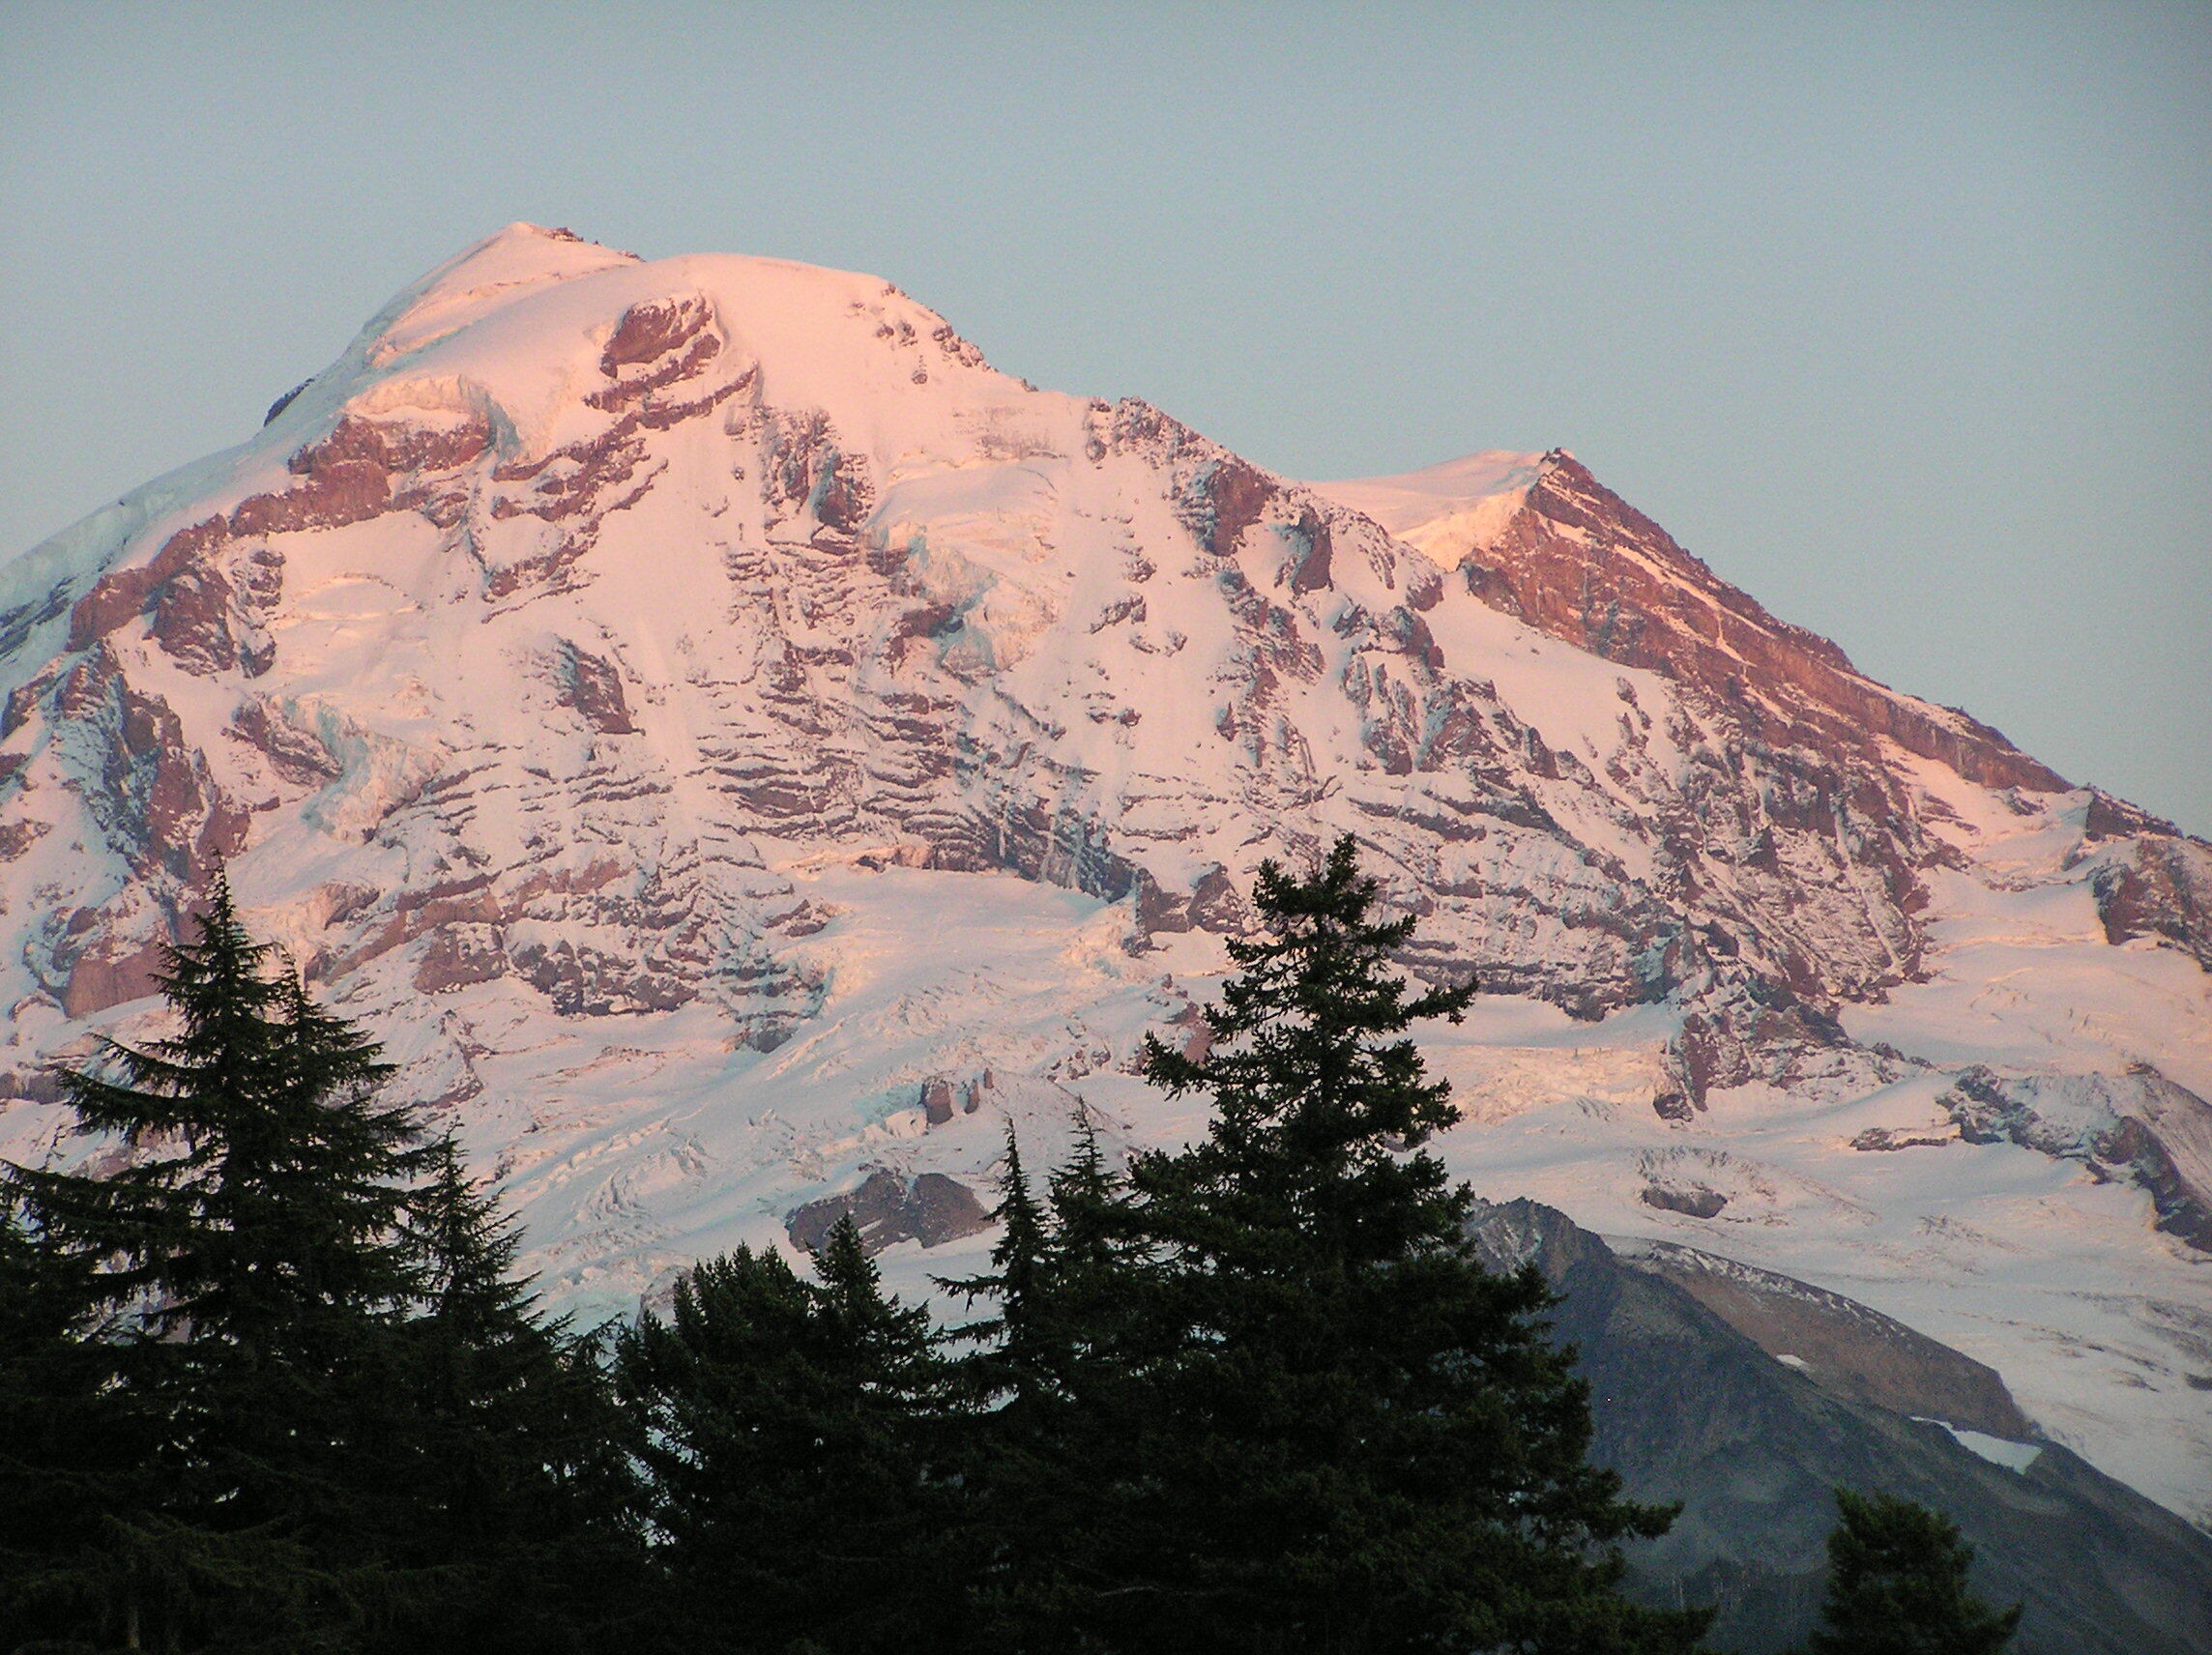
Climate change is altering summits of the tallest ice-capped mountains in the contiguous United States.
A new study by Scott Hotaling from the Quinney College of Agriculture and Natural Resources and Eric Gilbertson from Seattle University used differential GNSS measurements, satellite data, laser measurements and historical photographs to document the ways ice-capped summits in the Western United States are being affected by climate change.
For the last century, there have been five ice-capped summits in the contiguous United States, all in Washington State. The researchers measured the current elevations of the summits and compared their findings to historical surveys and photographs to assess whether their elevations have changed and whether their ice caps are still intact.
For Mount Rainier, Columbia Crest is no longer its highest point. The new summit is now rock on the mountain’s southwest rim roughly 133 meters away. All five of the historically ice-capped summits have shrunk since 1980, with four of the five shrinking by at least 6 meters (20 feet) from loss of snow and ice.
As of 2024, only two of the five summits still had perennial ice as their highest point. Free-air temperatures for the ice-capped summits indicate significant late summer warming of 2.75°C since 1950 and increases in summer melt days, with most of the change occurring since the late 1990s.
“Given the synchronous trends, we offer climate-induced loss of summit ice as the most likely explanation for the observed changes to ice-capped summits in the western United States,” the researchers write in their study.
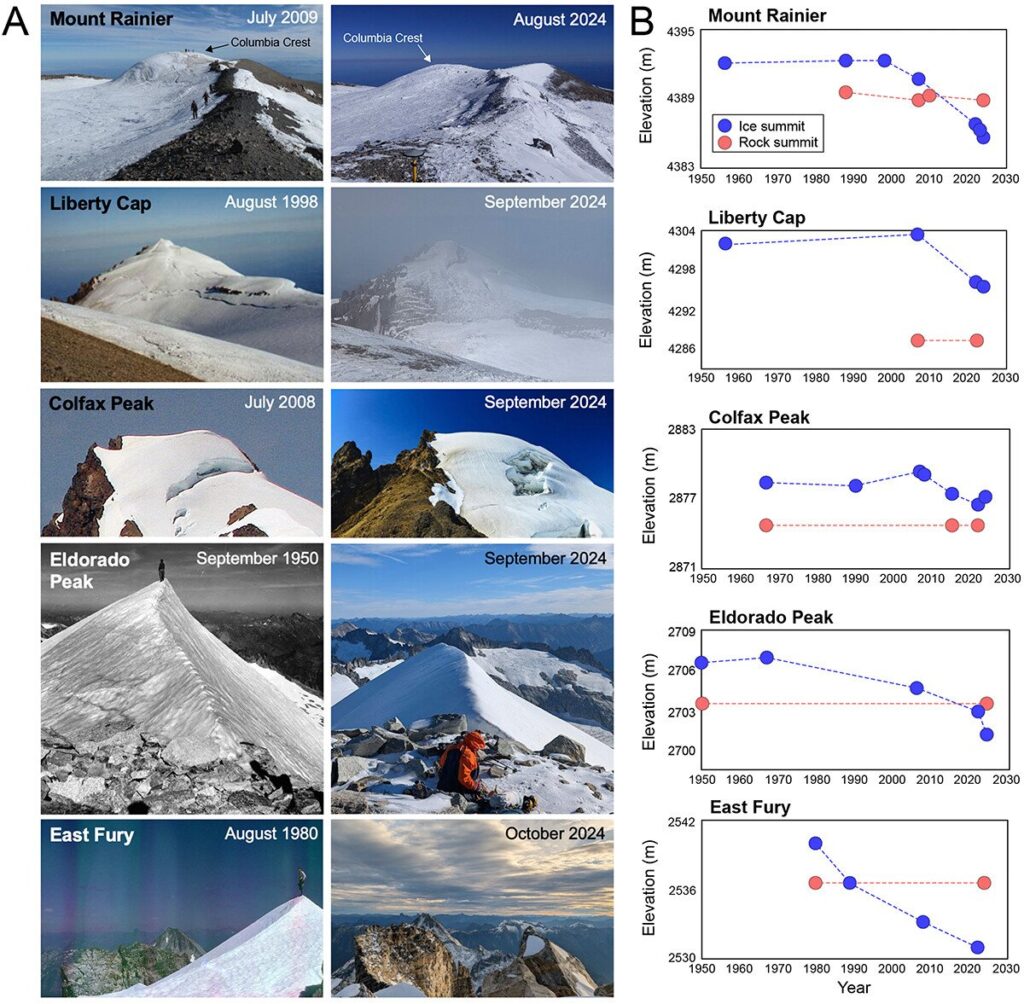
(A) Historical (left) and contemporary (right) photographs for each ice-capped summit included in this study. (B) Elevation over time for each ice-capped summit (blue) and the nearest rocky summit (red). (Image: Study authors)
The main GNSS survey tool used was a Spectra ProMark 220 dGNSS equipped with an Ashtech antenna. GNSS measurements of the ice-capped summits hads an accuracy of ±0.03 meters. For each dGNSS survey, the researchers recorded a 1-hour measurement on the ice-capped summit. If a nearby rock summit was at a similar elevation to the ice-capped summit, a 1-hour measurement was also recorded for it.
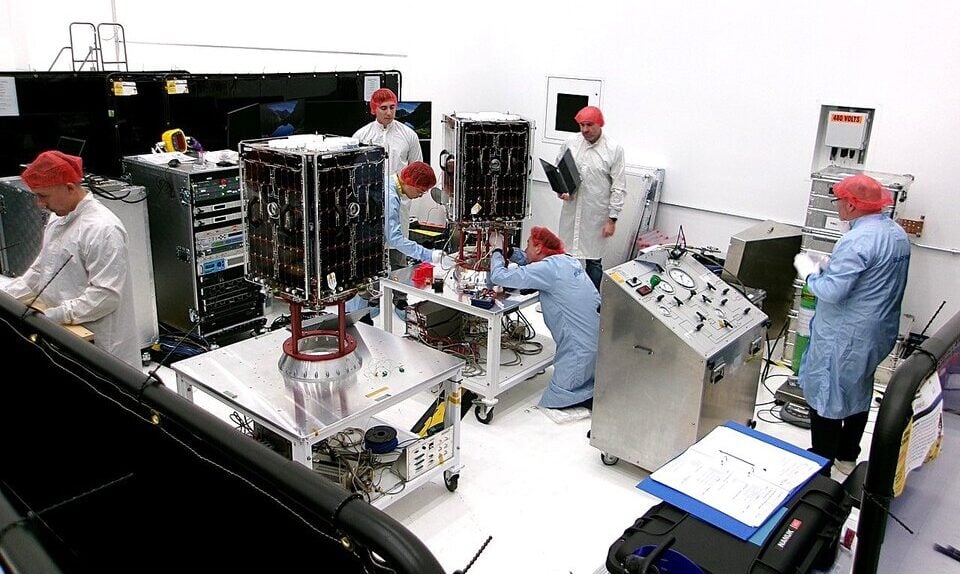
Two European Space Agency (ESA) microsatellites will soon be launched to study climate variables linked to water using GNSS reflectometry. The twin HydroGNSS satellites arrived at Vandenberg Space Force Base in California at the end of September, from where they will be launched later this month.
The HydroGNSS twins are the European Space Agency’s first Scout venture, part of the agency’s Earth Observation FutureEO programme. Scout missions are designed to deliver cutting-edge science quickly and affordably, complementing ESA’s larger Earth Explorer missions.
The identical microsatellites will launch from Vandenberg aboard a SpaceX Falcon 9 rocket, sharing their Transporter-15 ride into orbit with several other small satellites.
Since their arrival, the HydroGNSS satellites have undergone a series of final checks — including testing, propellant loading, battery charging and integration with their launch adapter. Both satellites are now ready for closing of the rocket fairing.
Once in orbit, the two satellites will travel 180 degrees apart around Earth to maximize coverage.
The mission focuses on four crucial variables, all recognized as “essential climate variables” or closely related to them: soil moisture, freeze–thaw state over permafrost, inundation and above-ground biomass. These data are vital for improving our understanding of Earth’s water cycle, including wetlands, permafrost dynamics and forest carbon storage. The data will aid in agricultural planning, flood prediction, and others areas.
HydroGNSS satellites will use GNSS reflectometry to measure key hydrological climate variables, including soil moisture, freeze–thaw state over permafrost, inundation and wetlands, and above-ground biomass. (Image: ESA)
Navigation satellites such as GPS and Galileo transmit L-band microwave signals that change when reflected off Earth’s surface. HydroGNSS will compare these reflected signals with the direct GNSS signals to extract valuable information about geophysical parameters related to the water cycle.
New Space missions. Inspired by the principles of New Space, the Scout programme emphasises agility and innovation — using small satellites to miniaturise proven technologies or demonstrate entirely new ways of observing Earth.
Each Scout mission must move from kick-off to launch within just three years and under a budget of €35 million, covering everything from satellite development to in-orbit commissioning. The resulting data are provided as a service to the scientific community and ESA, helping accelerate our understanding of the planet.
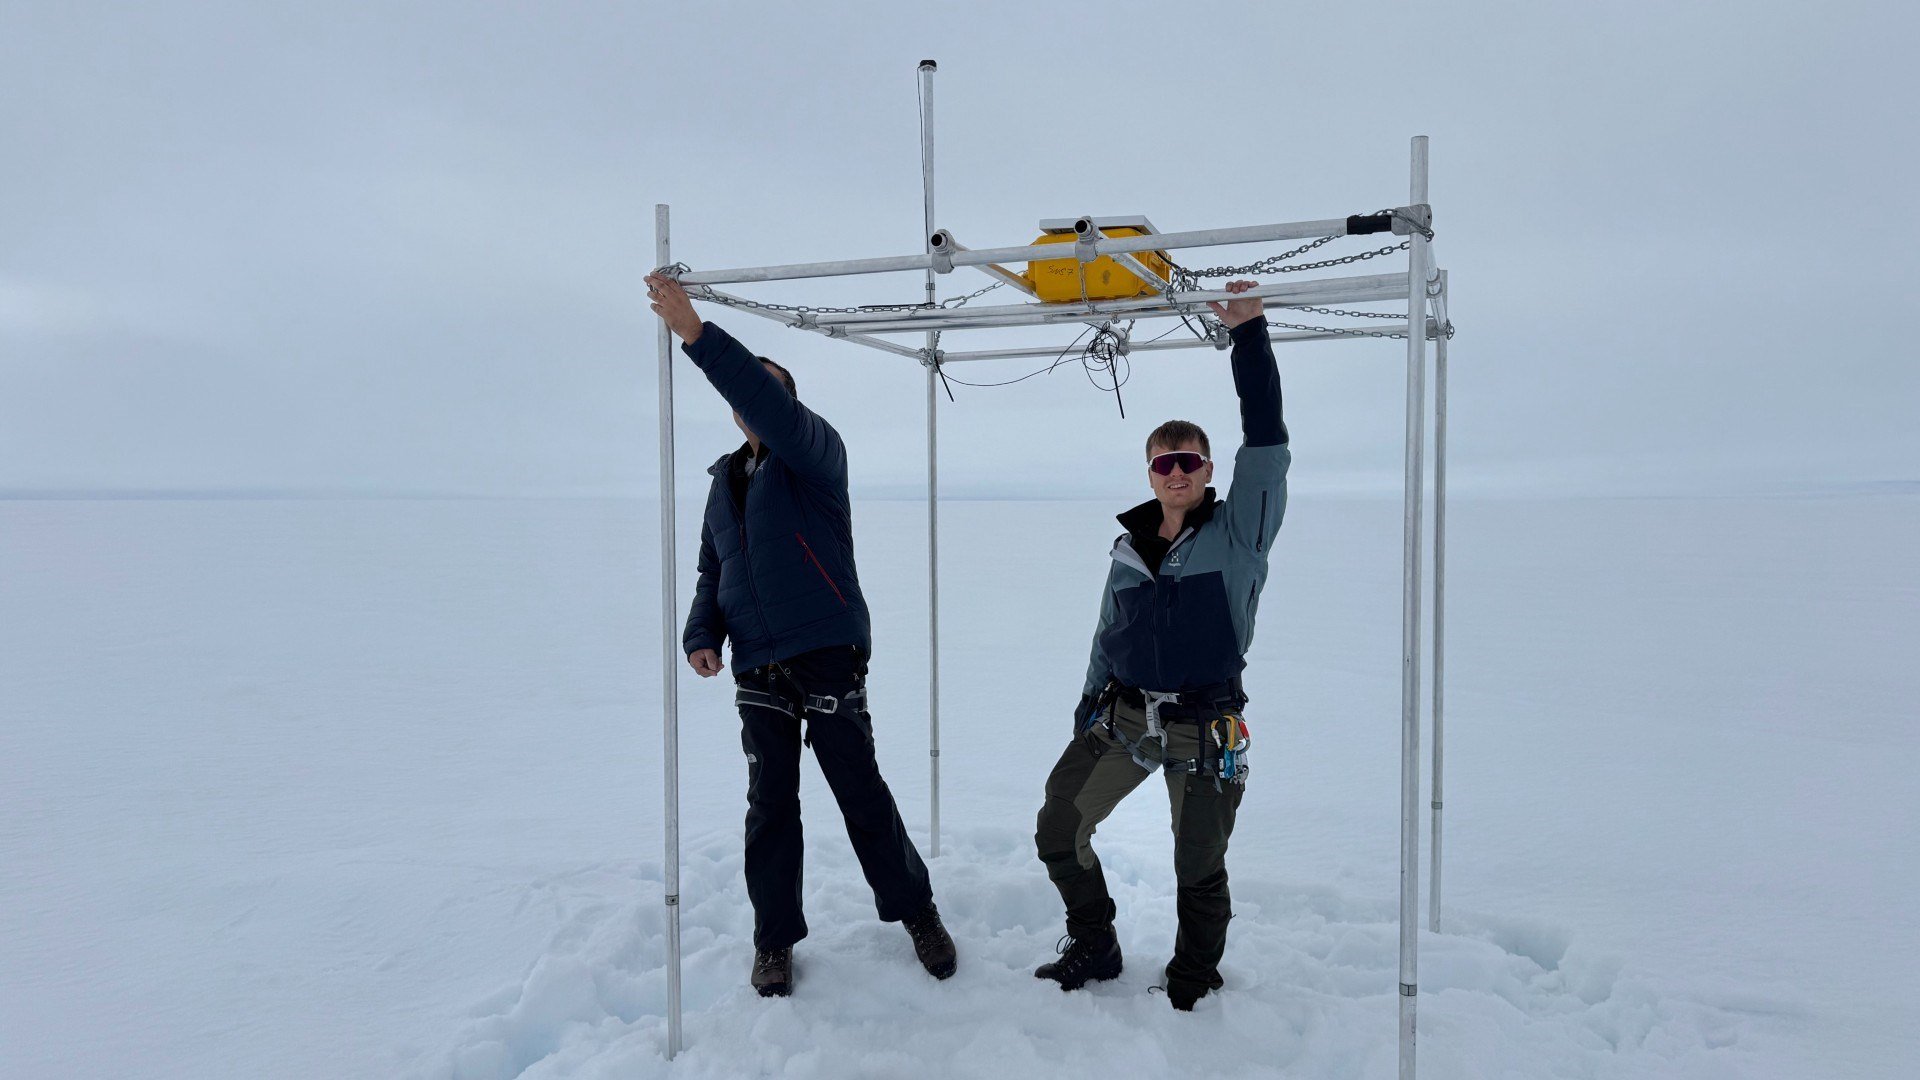
Greenland is being twisted, compressed and stretched, according to researchers in the Department of Space Research and Space Technology of the Technical University of Denmark (DTU Space). As a result, the entire island has shifted northwest over the past 20 years by about 2 centimeters per year.
GNSS data shows plate tectonics and movements in the bedrock caused by the melting of large ice sheets, reducing pressure on the subsurface. The pressure is easing both because large amounts of ice have melted in Greenland in recent years, and because the bedrock is still affected by the enormous ice masses that have melted since the peak of the last Ice Age around 20,000 years ago.
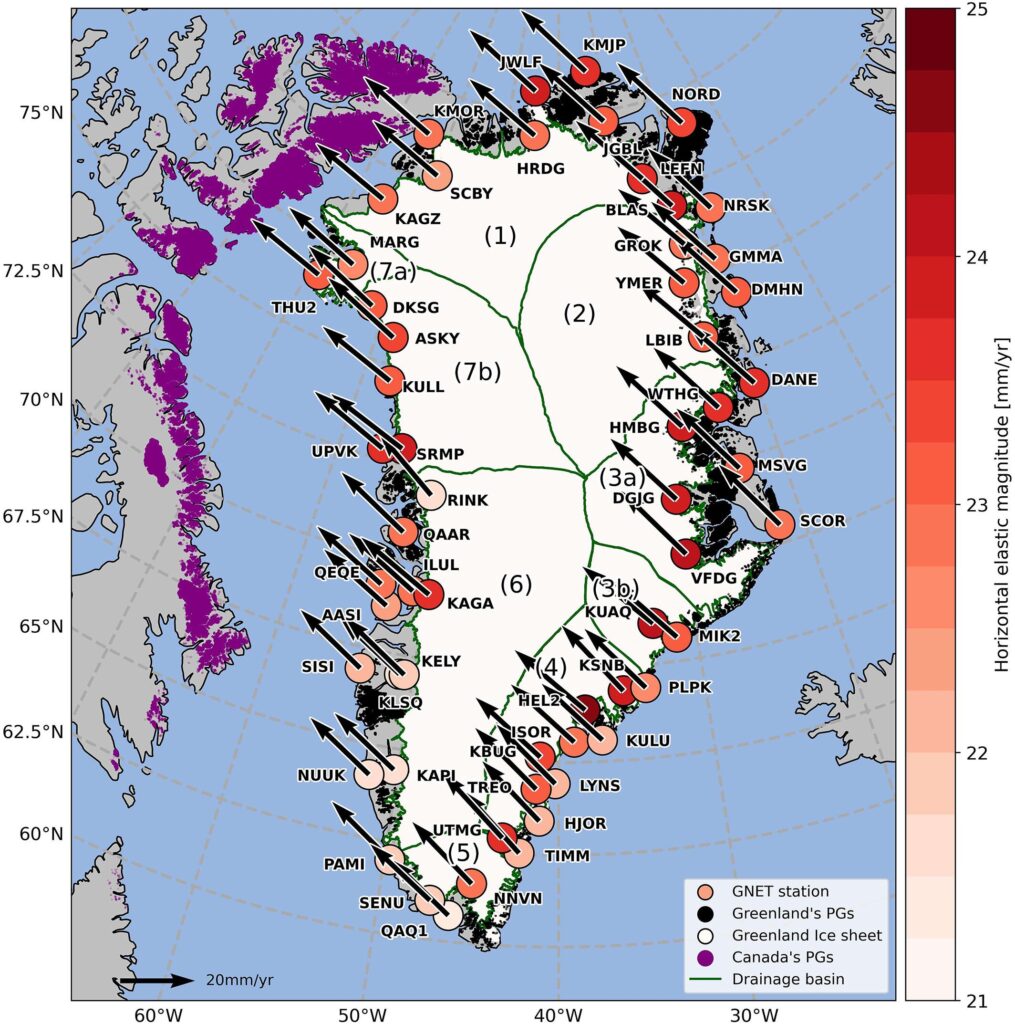
Horizontal land motion observed by the 58 GNET stations used in this study, processed in the IGS14 reference frame. Their location is shown by the colored circles together with their labels. The boundaries of Greenland’s drainage basins are shown in green with numbers (1) to (7b). The Greenland Ice Sheet (GrIS) is represented in white and peripheral glaciers in Greenland (GrPG) and Arctic Canada (CanPG) are highlighted in black and purple respectively. (Image: Study authors)
The new measurements are based on 58 GNSS stations placed around Greenland. They measure Greenland’s overall position, elevation changes in the bedrock, and how the island is shrinking and stretching. The movements are causing Greenland to both expand and contract horizontally. The effect is that Greenland’s area is currently being “stretched out” and becoming slightly larger in some regions, while others are being “pulled together.”
”Overall, this means Greenland is becoming slightly smaller, but that could change in the future with the accelerating melt we’re seeing now,” said DTU Space postdoc researcher Danjal Longfors Berg, lead author of the article in the Journal of Geophysical Research.
It is the first time the horizontal movements have been described in such detail.
”We have created a model that shows movements over a very long timescale from about 26,000 years ago to the present. At the same time, we have used very precise measurements from the past 20 years, which we use to analyze the current movements. This means we can now measure the movements very accurately,” Berg said.
Important for surveying and navigation
The new research provides useful information about what happens when climate change hits the Arctic with accelerating speed, as is the case in these years.
”It’s important to understand the movements of landmasses. They are of course interesting for geoscience. But they are also crucial for surveying and navigation, since even the fixed reference points in Greenland are slowly shifting,” Berg said.
The GNSS stations are owned by the Climate Data Authority under the Ministry of Climate, Energy and Utilities. They are used for research purposes and operated in collaboration with DTU Space. The research is conducted under the DTU Space research center Center for Ice-Sheet and Sea-Level Predictions (CISP).
Canadian scientists recently led their first Antarctic research expedition, using Montreal-made Arrow Gold+ GNSS technology for precise location data in remote and challenging conditions. The mission, which departed in early March 2025 aboard HMCS Margaret Brooke, included experts from multiple Canadian universities and government agencies. Researchers conducted water, sediment, air, and sea-ice sampling to study climate change, glacial retreat and pollution such as mercury and microplastics.
The month-long journey around the South Shetland Islands and the northern Antarctic Peninsula yielded surveys of coastal and oceanic sites. The crew relied on a small, unmanned surface vessel (USV) carrying various equipment for bathymetric surveys including an onboard computer, IMU and multibeam sonar.
In order to find the USV’s precise position in an environment with no land-based RTK infrastructure, the team relied on the Arrow Gold+ GNSS receiver, designed and manufactured by Canadian-based Eos Positioning Systems. The Arrow Gold+ utilized Galileo High Accuracy Service (GalHAS), a free satellite-based PPP correction available worldwide from the European Union’s Galileo Programme.
“There aren’t any RTK networks in Antarctica,” said Kevin Wilcox, Ocean Mapping Group research scientist, who piloted the USV. “That sent us looking for the Arrow Gold+ and GalHAS corrections. When we found these, we realized we had a possible solution.”
While using GalHAS corrections, the Arrow Gold+ provided estimated accuracies of about 10 cm horizontal and 15 vertical to 20 vertical.
“The vertical accuracy was especially important for our bathymetric work,” Wilcox said. “Any vertical error would directly add error to our depth.”
Sites surveyed include Admiralty Bay, Livingston Island and Deception Island, which includes an active, flooded volcano caldera. The resulting, high-accuracy maps will support further scientific and oceanographic research, environmental monitoring, and improvements to marine charts.
By adding high-accuracy locations with an average accuracy of 10 cm to 20 cm horizontal and vertical, the team was able to accurately georeference and further refine the detail of the bathymetry for their map inside the underwater Deception Island caldera. (Photo: Eos Positioning Systems)
IBM, a global technology provider, has released its latest geospatial artificial intelligence (AI) initiative to address climate change. These efforts involve collaborations across various regions and uses advanced AI models designed for geospatial applications.
Central to these initiatives is IBM’s geospatial foundation model, developed jointly with NASA. These models aim to generate environmental insights and solutions related to climate change. Unlike traditional AI models, these use a vast amount of climate-relevant data to accelerate the analysis of various environmental aspects that are affected by climate change.
“AI foundation models utilizing geospatial data can be a game-changer, allowing us to better understand and address climate-related events with unprecedented speed and efficiency,” said Alessandro Curioni, IBM fellow and vice president of Accelerated Discovery.
Analyzing urban heat islands in UAE
IBM and the Mohamed Bin Zayed University of Artificial Intelligence (MBZUAI) have partnered to map urban heat islands in Abu Dhabi using a fine-tuned version of IBM’s geospatial foundation model. The goal of the project is to understand the impact of local landscapes on temperature anomalies, the company said. The initial results show a decrease in heat island effects, which can provide valuable insights for future urban design strategies.
Reforestation and water sustainability in Kenya
In partnership with Kenya’s Special Envoy for Climate Change, Ali Mohamed, IBM is supporting the National Tree Growing and Restoration Campaign. The initiative aims to plant 15 billion trees by 2032, particularly in critical water tower areas affected by deforestation. IBM’s geospatial model powers a digital platform to track tree planting activities, aiding local efforts in restoring forests and measuring carbon sequestration impact.
Elevating climate resiliency in the UK
In collaboration with the Science and Technology Facilities Council (STFC) and Royal HaskoningDHV, IBM is developing AI-driven tools for climate risk assessment in the UK. These tools will focus on assessing weather impacts on aviation operations, the company said. Additionally, the TreesAI research project aims to map areas suitable for tree planting to mitigate surface water flooding and offer urban developers a digital planning platform.
IBM extends collaboration with NASA for weather forecasting
IBM and NASA have partnered to develop an AI foundation model dedicated to weather and climate applications. The collaboration aims to enhance the accuracy and speed of weather forecasting, predict wildfire conditions and understand meteorological phenomena. IBM researchers will work closely with NASA to train and validate this model, IBM said.
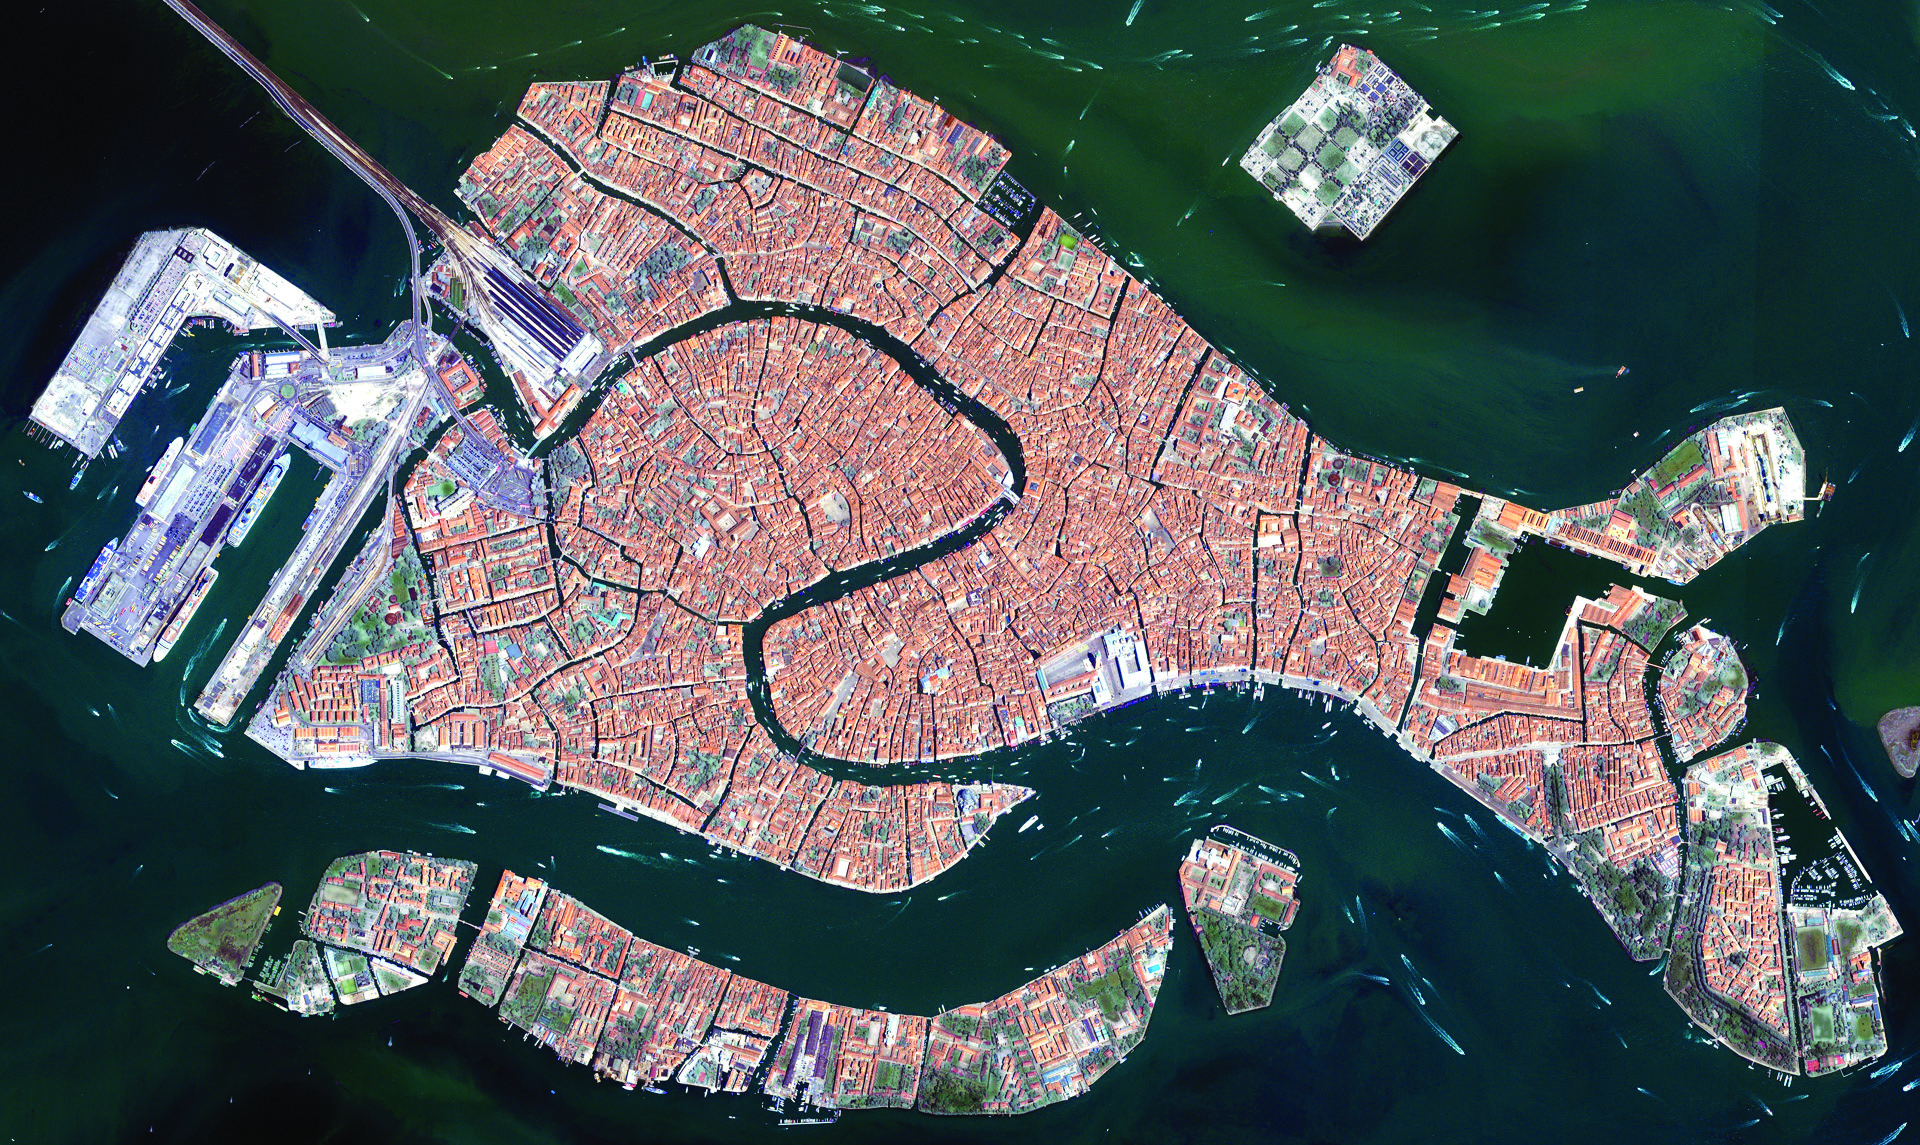
Venice arose after the fall of the Roman Empire. The city holds 450 palaces, more than 400 bridges and is home to the notable St. Mark’s Basilica. It is also known for its many canals, which are full of gondolas the way the streets of other cities are full of taxis or rickshaws. (Image: Freeartist/iStock/Getty Images Plus/Getty Images)
It is hard to believe that Italy’s “floating city” could be underwater soon.
The average rate of relative sea-level rise is 2.5 mm/year, per the European Geosciences Union’s journal Natural Hazards and Earth System Sciences. This photo of Venice from the European Space Agency (ESA) was taken in 2008 by Ikonos-2, a commercial satellite (Image: ESA)
Predictions for the future of the city vary, but most scientists agree that the sea level is rising due to climate change. Natural Hazards and Earth System Sciences, an interdisciplinary journal of the European Geosciences Union, published a report in 2021 suggesting the average sea level could be between 17 cm and 120 cm higher in Venice by 2100.
Venice was built in the middle of a shallow lagoon in the Adriatic Sea. Therefore, it has always been at risk of flooding or “acqua alta,” meaning high water. There is evidence of severe flooding dating back to around the 8th century.
The Venetian lagoon is more than 500 km2 in total, but has an average depth of only 1 m, according to Royal Museums-Greenwich. High tides and severe storms have a devastating impact on the wetland environment on which Venice is built.
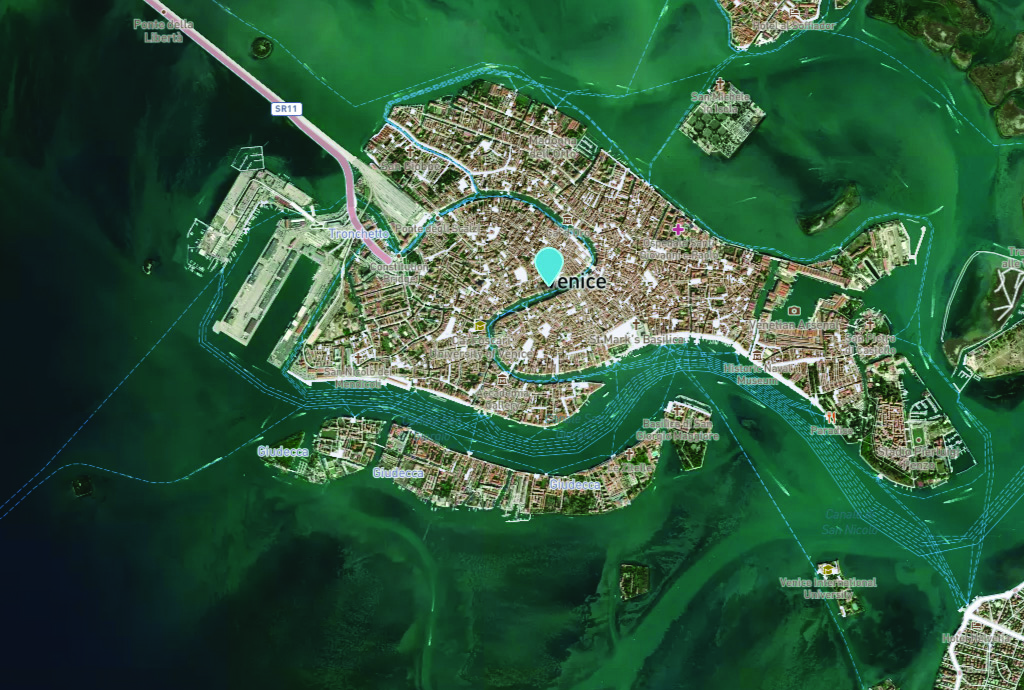
Compared to the image of Venice in 2008, this U.S. Geological Survey (USGS) satellite image of Venice from May 2023 shows the rise in sea level within the past 15 years. (Image: USGS)
In November 2019, Venice experienced the second-worst flooding event in almost 100 years. The tide reached 187 cm (6.1 ft) above sea level, covering 80% of the city in water, reported the BBC.
City records show there have been 324 intense high-water events since 1872 and more than half of those have been in the past 30 years. Among the many and vast consequences of human-caused climate change may be the end of one of the world’s most beautiful cities.
Trimble is committing to reduce greenhouse gas emissions in line with the ambitious goals of the Paris Agreement and a net-zero future to keep global temperature increase to 1.5° C.
“Taking decisive climate action is essential to protect our planet and communities for future generations,” said Rob Painter, president and CEO, Trimble. “It also demonstrates Trimble’s commitment to our purpose — to transform the way the world works as well as transform the way ‘we’ work.”
“For decades, Trimble solutions have contributed to reducing greenhouse gas emissions and combating climate change,” Painter said. “The nature of Trimble’s technologies, which connect the physical and digital worlds, provides efficiencies and promotes sustainability in our end markets such as construction, agriculture, forestry, utilities and transportation. Our leadership team is committed to further reducing our carbon footprint as well as continuing to develop solutions that enable our customers to reduce their climate impacts — it is an important lever in our Connect and Scale strategy. Trimble is dedicated to do its part to help protect and build a better world.”
Trimble’s science-based targets accelerate decarbonization across its value chain, and include the following commitments:
reduce absolute scope 1 and 2 greenhouse gas emissions by 50 percent by 2030 from a 2019 base year
achieve 100 percent annual sourcing of renewable electricity by 2025
reduce absolute scope 3 greenhouse gas emissions from fuel and energy-related activities, business travel and upstream transportation and distribution by 50 percent by 2030 from a 2019 base year
commit to partner with 70 percent of its suppliers by emissions covering purchased goods and services and capital goods to set science-based targets by 2026.
“Setting ambitious yet achievable climate targets is part of our commitment to reducing Trimble’s carbon footprint,” said Leah Lambertson, senior vice president and head of Sustainability, Trimble. “Embedding our climate action goals into Trimble’s operational choices will help ensure that our decision making and growth plans are consistent with our low-carbon vision. Today’s commitments are important steps in our journey to delivering growth in a responsible and sustainable way to achieve a net-zero future.”
Trimble’s 2021 Sustainability Report
Trimble also announced the release of its 2021 Sustainability Report. Built around the company’s mission of transforming the way the world works, the report describes how Trimble is helping to create a better future for the planet and the communities it serves.
The report summarizes its initiatives and performance across environmental, social and governance (ESG) topics, highlighting the company’s sustainability approach; end-user industry solutions; community philanthropy through its Trimble Foundation Fund; employee engagement and development as well as diversity, equity and inclusion (DEI) initiatives; and governance.
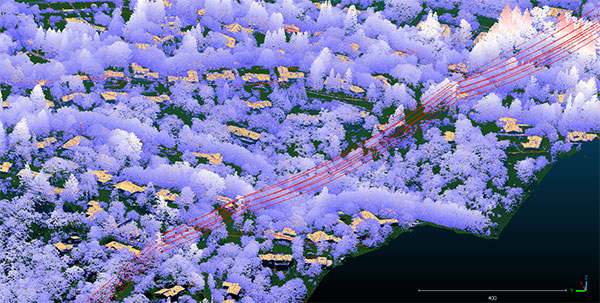
Teren, a climate resilience analytics company, has expanded its Premium 4D Content program for regions across the United States, including the Gulf Coast, Midwest, Rocky Mountains and West Coast.
Teren acquires and quickly processes high-fidelity lidar data, making it available via its content library, and delivers analytics with actionable insights to energy and engineering firms.
“Climate change is causing drought, flooding, landslides and wildfires across the country – significantly impacting asset owners and project developers. As a result, the market demand for high-fidelity, temporal data to identify, prioritize, and monitor climate-related risk is higher than ever,” said Toby Kraft, Teren CEO.
Teren is amassing a content library of remotely-sensed 3D (spatial) data across the United States. That data is updated on regular intervals to monitor changes over time providing a unique 4D (temporal) view. This 4D data library feeds analytics that identify risk, inform mitigation, and strengthen asset resilience. While remotely-sensed data has traditionally been sourced on a project-by-project basis, Teren offers its data and analytics as a subscription service. This model drives down the costs for clients and stakeholders, helping to maximize the speed of delivery, return on investment, and data value.
“In our flagship content region, Appalachia, our customers tap into our 4D content library to identify and monitor the terrain and surface conditions surrounding their assets — primarily aiming to identify and mitigate landslides before they become catastrophic incidents,” Kraft said. “We’re expanding the program nationwide to meet the growing demand for terrain monitoring and climate resilience analytics around events such as erosion, flooding, wildfires and more.”
Teren’s solution saved clients in Appalachia an estimated $152 million annually, preventing 24 failures per year due to landslides. While landslides are not as pervasive across the United States, companies can apply the data and analytics suite for the following:
Gulf Coast: inundation, subsidence, land movement
Midwest: erosion, flooding, subsidence
Rock Mountains: landslides, flooding, wildfire
West Coast: wildfires, land movement, flooding.
Traditionally used by the energy sector, Teren’s data has also proven to be highly valuable to state and federal agencies, insurers and civil engineers. Teren expects to see increased variability across clients and use cases as the content region expands.
To learn more about Teren or to request a demo, visit www.teren4d.com.
Work supports climate change research, the 2020 Juneau landslide, and effects of the Exxon-Valdez oil spill
NV5 Geospatial marks its 65th year helping Alaska solve environmental and geospatial challenges, with new hydrospatial projects with the National Oceanic and Atmospheric Administration (NOAA), U.S. Geological Survey (USGS), Alaska Railroad Corporation, Alaska Department of Natural Resources, U.S. Fish and Wildlife Service and the U.S. Department of Agriculture.
“As climate change intensifies, so do the challenges that Alaska and its citizens face,” said Adam McCullough, NV5 Geospatial’s Alaska program manager. “From mapping the coastlines, to collecting lidar and imagery data to better understand geohazards and landslide risks, to mapping rivers, lakes and other surface water features, we are involved in critical projects across the state. We are proud to work side by side with national, state and local governments and agencies, as well as private corporations to facilitate climate-change informed decision making over the state’s valuable, unique resources.”
The following six projects provide a sampling of the work in which NV5 Geospatial has participated across the state:
Revillagigedo Topobathymetric Lidar and Imagery Mapping – NV5 Geospatial is working alongside state and federal partners on a multi-year program to map Alaska’s 66,000 miles of complex coastline. This work is part of a larger national shoreline mapping project being undertaken by NOAA to gather baseline data to update nautical charts, manage coastal resources, and define U.S. territorial limits.
The data collected also can support maritime trade and transportation, as well as wave and wind energy site selection. The data supports coastal resiliency efforts that include modeling sea-level change, storm surge, coastal flooding and pollution trajectories, as well as analysis and monitoring of critical habitats, developing land and marine GIS base layers.
The Alaska Railroad Corporation (AARC) Lidar Acquisition for Geohazards – AARC engaged Michael Baker and NV5 Geospatial to collect high-resolution topographic lidar and imagery data for analysis of geohazards, hydrology, engineering and landscape ecology across portions of its vast rail network in Alaska. NV5 leveraged its advanced combined low-altitude sensor solution (CLASS) mounted to a helicopter to simultaneously collect lidar, ortho-imagery and oblique images along the rail line that enables researchers to evaluate landslide and hydrological risks in areas of concern.
USGS 3DEP Juneau Landslide Lidar Study – In the aftermath of unprecedented rain events in Southeast Alaska in December 2020, the City and Borough of Juneau, along with Alaska Electrical Light & Power, partnered with the USGS to acquire and process 3DEP-compliant airborne topographic lidar data covering the Juneau landslide impact area. The USGS contracted NV5 Geospatial to perform the lidar survey that included acquiring extremely accurate lidar to USGS’s highest quality level specification.
The lidar data will support planning and landslide assessment to enable the reinforcement of critical infrastructure resources in the area. Project stakeholders are able to use this data along with existing lidar collected by NV5 Geospatial in 2013 to study how the landscape is changing in precise detail.
Alaska 3D Hydrography Program (3DHP) – The USGS, in partnership with state, local, and tribal governments and others, has embarked on a multi-year effort to enhance the mapping of rivers, lakes and other surface water features for the entire state of Alaska. Supporting that initiative, NV5 Geospatial has been repeatedly contracted by USGS to develop improved hydrography, covering 62,934 square miles to date.
NV5 Geospatial is leveraging the recently completed statewide interferometric synthetic aperture radar (IfSAR) coverage as the elevation data source to define drainages, impoundments and other hydrographic features in greater detail and accuracy. Once completed, the enhanced map data will be used to inform navigable waterways; conduct flood analysis; and delineate wetlands, fish habitat, recreational opportunities, coastal resiliency and more.
Exxon-Valdez Oil Spill, National Wetlands Inventory and National Hydrography Dataset – The U.S. Fish and Wildlife Service is leveraging grant funds to map wetlands and hydrography for areas affected by the 1989 Exxon Valdez oil spill. These areas include Kodiak Island, Afognak Island and the shorelines of Shelikof Strait in Alaska. Wetlands data are used by natural resource managers to promote the understanding, conservation and restoration of wetlands, while the hydrographic data supports scientific studies, cartography and natural-resource management associated with inland surface water features.
U.S. Department of Agriculture Aerial Orthoimagery Term Contract – NV5 Geospatial was awarded a large multi-year term contract to support aerial orthoimagery in Alaska. The contract has been used to acquire tens of thousands of square miles of high-resolution orthoimagery covering some of the nation’s largest national forests including Tongass and Chugach, as well as agricultural lands significant to the Natural Resource Conservation Service. These areas are in areas with some of the most challenging weather and terrain anywhere in North America and require aircraft on persistent standby to take advantage of the brief windows of opportunity to collect high-quality imagery.