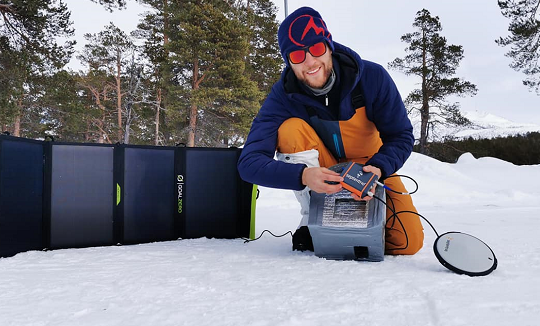
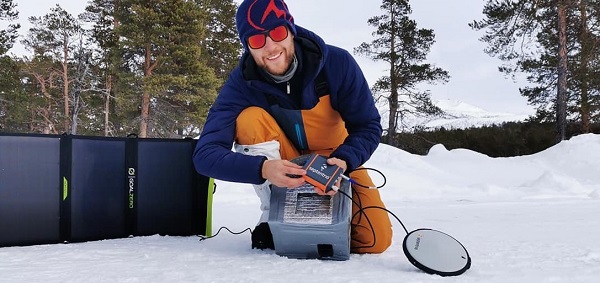
Two Belgian adventurers are crossing Greenland on a triathlon including ski, kayak and a vertical rock climb. On the ride, they are using Septentrio’s AsteRx-SB receiver, collecting valuable data for climate research in collaboration with the Royal Observatory of Belgium.
The data will help build a precise elevation profile of the Greenland Ice Sheet as well as to calibrate existing elevation models, which are based on satellite altimetry. In addition, the multi-frequency capability of the AsteRx-SB receiver will enable monitoring of ionospheric activity as well as Galileo signals at high latitudes.
“The AsteRx-SB receiver provides accurate and reliable positioning data even in the world’s harshest environments,” said Nicolas Bergeot of the Time-Ionosphere section, Royal Observatory. Data collected will help research of arctic ice caps, ionospheric activity and other topics.
The expedition is called Nanok, which is an Inuit word for polar bear. Adventurers Gilles Denis and Nathan Goffart started the triathlon with a 600-km ski with a pulk sled along the Arctic Circle. The second part of the triathlon is a 1,000-km sea kayak along the Greenland east coast, and finally a 1-km vertical rock climb.
Gilles Denis shows the AsteRx-SB receiver and the PolaNt-x MF antenna that are accompanying the explorers for the entire journey, so that data can be collected at various locations along the way. The receiver is powered by solar panels. (Photo: Nanok Expedition)
The INTERGEO Expo & Conference focuses on innovations for a smarter world. INTERGEO 2022 will take place October 18-20 in Essen, Germany.
Topics including the importance of geoinformation for internal security, monitoring for disaster control and prevention, open data, digital twins alongside their use in construction and housing, mobility, sustainability and climate change, BIM and engineering applications with UAV, laser scanning and monitoring will be discussed during the 2022 event.
Additionally, the outdoor area of Messe Essen will show live demonstrations of the latest UAV applications in surveying, agriculture, construction, security and many more.
According to INTERGEO organizers, 300 international companies are already registered at the Expo, from innovative young start-ups to international key players such as Autodesk, Esri Inc., Hexagon, Trimble, Topcon and many more. The organizers expect around 500 exhibitors by October.
“All the international key players in the industry will be there.There was no doubt about it – they all want to get back to their customers, to visitors, to the live atmosphere and the power of meetings”, says Prof. Dr-Ing. Hansjörg Kutterer, President of the organiser DVW e.V., Association for Geodesy, Geoinformation and Land Management.
For those who are unable to attend the event in Germany, there will be some opportunities to participate in the Expo remotely.
Up close and personal
Digital Twins will receive their big break at the Conference 2022. Their use in building information modeling, smart planning and construction as well as mobility will be the focus of the event. Digital twins will be used to further development of urban data platforms in the context of smart cities and their variety of applications, as well as the use of smart city solutions in terms of innovation and sustainability and a basis for predictions and scenarios in the event of disasters.
The main topics in 2022 are Digital Twins and their value creation, 4D geodata and Geospatial IoT, potentials of remote sensing, BIM 4.0, industrial surveying, measurement systems and robotics, smart cities and mobility in the context of climate change and sustainability, mobile mapping, web services and GeoIT in disaster relief, spatial reference and positioning, earth observation and Galileo.
Hansjörg Kutterer points out the high innovative power of the industry: “We are experiencing high dynamics in segments such as mobility, environment and sustainability, climate protection and urbanization. Geo-IT has positioned itself as a solution provider for these topics. Problem-solving without Geo-IT is unthinkable in these subject areas. Come to Essen on the 18th to 20th of October and visit Intergeo Expo and Conference.”
How to attend
Tickets for INTERGEO are now available. An early-bird registration rate is available until August 31. Tickets can be found at https://www.intergeo.de/en/tickets.
Registration for new exhibitors is open as well. All information, such as application procedures and funding amounts, can be found on the INTERGEO website at www.intergeo.de/en/.
The 216-page report is designed to help anyone who seeks to make EU space technologies part of their business plan, develop new space downstream applications, and see a tangible return on investment.
More than ever society relies on innovative solutions to deal with the big data paradigm, respond to and mitigate climate change, natural and man-made disasters, curb the spread of diseases and strengthen a global supply chain that underpins our daily lives.
Download report here.
Earth observation and GNSS data is becoming increasingly important to innovative solutions for climate change, disaster and disease response, and global supply chain management. Dozens of applications are emerging or already in use by citizens, businesses, governments, industry, international organizations, NGOs, and researchers around the world.
The report provides analytical information on the dynamic GNSS and EO markets. In 2021, GNSS and EO downstream markets generated more than €200 billion in revenues and are set to reach almost half a trillion over the next decade.
The report also offers in-depth analyses of global trends and developments through illustrated examples and use cases. Using advanced econometric models, it also offers market evolution forecasts of GNSS shipments or EO revenues spanning to 2031.
Green Investments
EUSPA is committed to helping the EU deliver on the Green Deal agenda and the fight against climate change, starting with embedding space data and services into professional activities. According to EUSPA, accelerating Europe’s engagement in space is pivotal to enabling the green transition and reaching climate neutrality by 2050.
The report emphasises how users of EO and GNSS contribute to compliance, monitoring and efficiency of green investments, benefiting companies, regulators and society as a whole. It focuses on concrete examples across the 17 identified market segments.
For instance, Galileo can provide smart power grids with robust timing and synchronization down to a nanosecond, improving their performance. In another example, EU space plays a role in green energy, as Copernicus helps optimize performance of tidal power generators by providing tidal current prediction systems.
Key Report Findings
Global GNSS- and EO-enabled revenues crossed €200 billion in 2021 and are set to reach almost €500 billion over the next decade.
The global installed base of GNSS devices in use will reach more than 10 billion units in 2031.
The market for Earth observation applications is boosted by a large pool of value-added services (85% of global revenue).
The European EO industry is dominated by SMEs and start-ups; from a supply perspective, European companies hold more than 41% of the global EO market.
The downstream space application market accompanied by the EU Space Programme will continue growing and thereby effectively contributing to European policies (such as the European Green Deal and EU’s Digital Decade), as well as global policies (such as the United Nation’s Sustainable Development Goals and the Paris Agreement) in combination with other technologies.
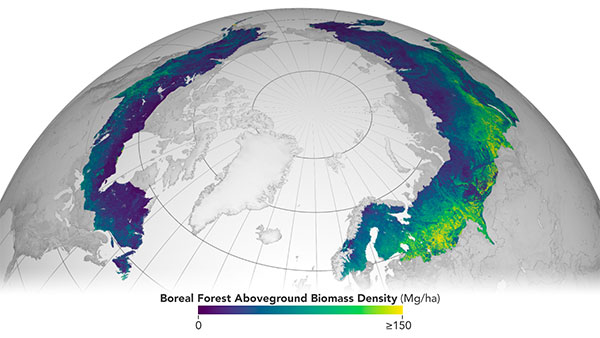
The European Space Agency (ESA) and National Aeronautics and Space Administration (NASA) have publicly released a globally harmonized assessment of aboveground biomass — information vital for managing global climate change.
The Multi-mission Algorithm and Analysis Platform (MAAP) provides seamless access to aboveground biomass information from both NASA and ESA Earth observation data. The open-science tool is now fully operational and accessible online.
Circumboreal forest biomass density mapped at high spatial resolution (30 m) with NASA’s ICESat-2, the joint NASA/USGS Landsat-8 and ESA Copernicus Digital Elevation Model (DEM) data. This provisional product is representative of 2020 conditions and is an open-source science product created on the NASA-ESA MAAP platform that will be validated in the coming months. (Image: NASA/ESA)
MAAP is the culmination of a two-year NASA and ESA effort and reflects the cooperation between the two agencies under the NASA and ESA Joint Program and Planning Group (JPPG) Joint Working Group (WG) on Ground Segment and Operations.
The MAAP platform enables international scientists and researchers to collaboratively develop algorithms and code as well as analyze and visualize large datasets acquired from sources including satellite instruments, the International Space Station, and airborne and ground campaigns. The large data and high-performance computing required for MAAP, along with a shared code repository and catalog, are stored and managed in the cloud. MAAP capabilities are supported and shared between NASA and ESA.
“Biomass is the first ESA mission with open-source algorithms,” said Clement Albinet, ESA’s Biomass data quality manager. “Thanks to that, the community will be able to access all the source code, the test data and all the documentation, and will be able to contribute in a collaborative way to the improvement of the biomass products. MAAP will allow scientists to easily work with large datasets at a global scale and to finally focus on science.”
The initial application of MAAP focuses on aboveground biomass to help determine the size and carbon content of Earth’s forests. These data are vital for informing our understanding and forecasting of climate change, including regular updates to the Intergovernmental Panel on Climate Change (IPCC).
While biomass is the first application of MAAP, it can be adapted for collaborative exploration across the breadth of science data and scientific disciplines available through NASA, ESA and similar research agencies.
MAAP includes data from missions such as NASA’s Global Ecosystem Dynamics Investigation (GEDI) and the joint NASA/ESA AfriSAR campaign, and will eventually support data from upcoming NASA and ESA missions such as the joint NASA/Indian Space Research Organization SAR (NISAR) and ESA’s Biomass mission.
Several projects are producing continental to global biomass maps for 2020, including ESA’s Climate Change Initiative Biomass and JPSs global map, both at 100 m, as well as NASA’s GEDI 1-km map. GEDI, the Global Ecosystem Dynamics Investigation, is a spaceborne laser instrument that measures the structure of Earth’s forests in high resolution and three dimensions.
The world’s Earth observation biomass community is undertaking an exercise on MAAP aimed at resolving discrepancies between those products and producing harmonized estimates of biomass and uncertainty at a policy-relevant, jurisdictional-level scale.
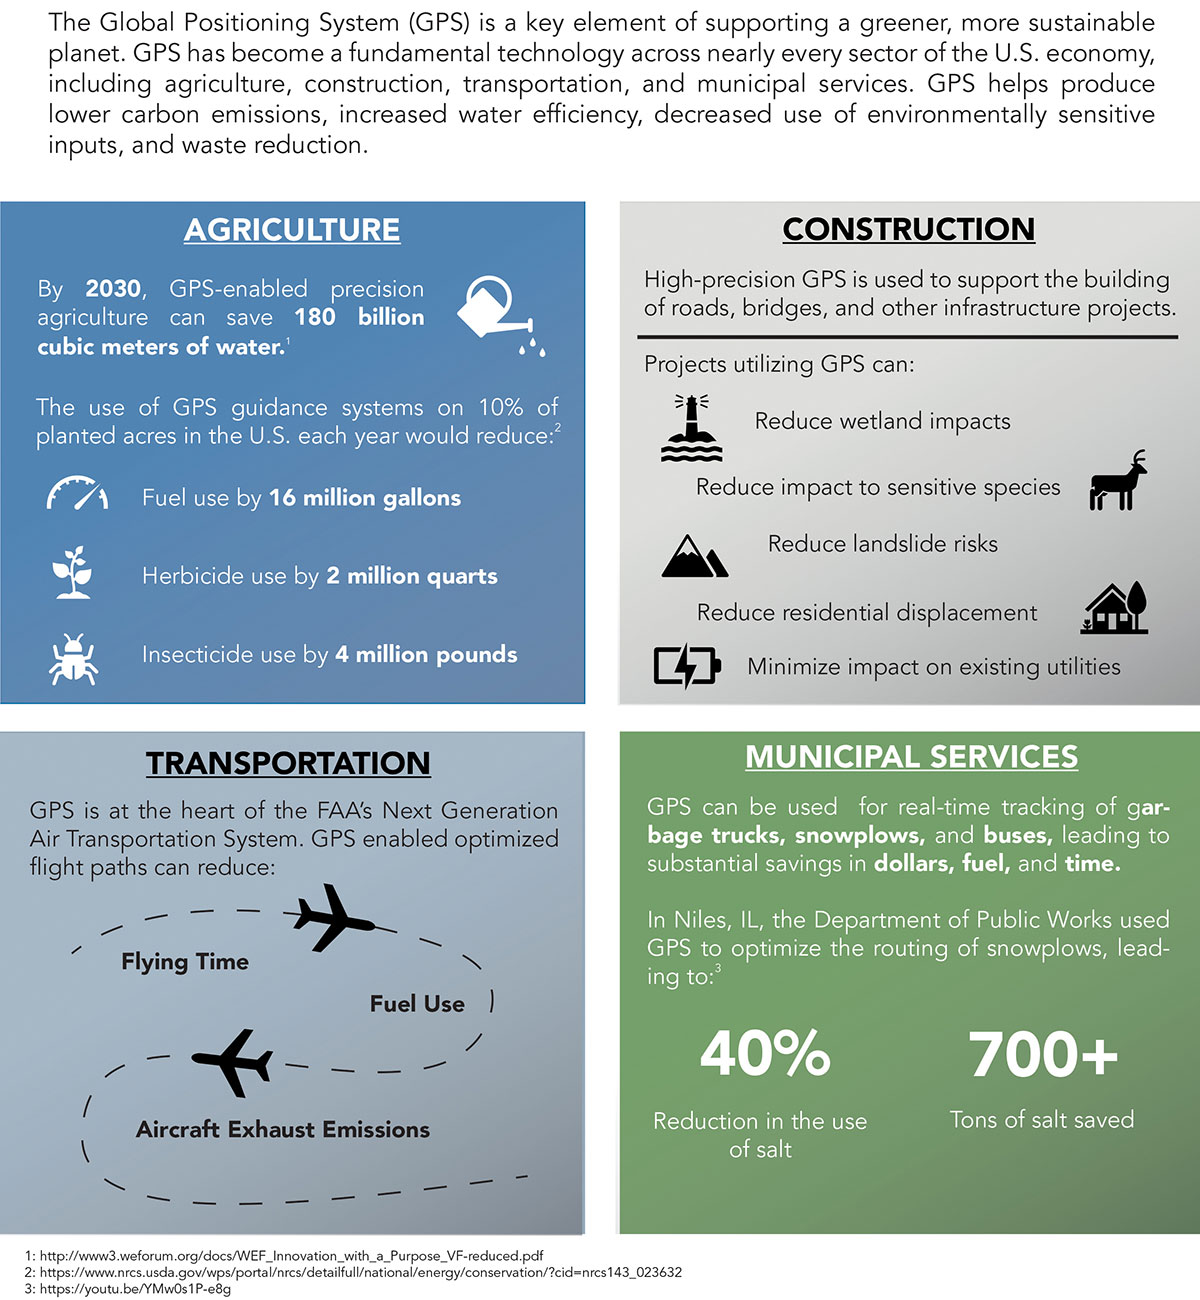
Can GPS support a greener, more sustainable planet? The answer is an emphatic “yes,” and it is already doing so today.
GPS has become a fundamental technology across nearly every sector of the U.S. economy, including agriculture, transportation, construction and municipal services. In each of these industries, the use of GPS has produced substantial environmental benefits, such as lowered carbon emissions, increased water efficiency, decreased use of environmentally sensitive inputs, and reduced waste.
Agriculture
Let’s take a closer look at how GPS is protecting our nation’s critical environmental resources. We begin with agriculture where it is estimated that the absence of GPS during peak planting season could result in an economic loss of more than $15 billion, according to a National Institute of Standards and Technology report.
During the past two decades, GPS has transformed American farming, enabling increased crop yields, cost efficiencies, and environmental sustainability through the precise application of seed, water, fertilizers and pesticides and the efficient use of fuel. In sum, precision agriculture lets farmers do more with less wasted seed, less fertilizer, less fuel, less pesticide, and more crop yield.
GPS Innovation Alliance (GPSIA) founding member Deere & Company reports that precision agriculture technologies can have a huge impact on resource efficiency and sustainability. By 2030, GPS-enabled precision agriculture implemented globally could save 180 billion cubic meters of water, says the World Economic Forum.
Similarly, according to the U.S. Department of Agriculture’s Natural Resources Conservation Service (NRCS), if “[GPS] guidance systems were used on 10 percent of the planted acres in the United States, fuel use would be cut by 16 million gallons, herbicide use by two million quarts, and insecticide use by four million pounds per year.” For a single Midwest row crop farmer, with 6,500 acres using precision agriculture techniques, Deere & Company estimates that more than 1,600 gallons of fuel could be saved, and more than 400,000 kg CO2 equivalent emissions could be avoided, over the course of a production cycle — the equivalent of nearly a million (992,000) passenger car miles driven per year.
Infographic: GPS Innovation Alliance
Construction
Construction is another industry that has been revolutionized by GPS. Today, high-precision GPS is used to support the building of roads, bridges and other significant infrastructure projects. In 2019, testimony before the U.S. House Small Business Committee, an executive of GPSIA founding member Trimble described several examples of how digital construction technologies, including GPS, can more efficiently plan and execute complex construction projects.
In one such example from Southern California, the improvements “reduced the wetland impact by 58 acres; reduced the impact to sensitive species; reduced landslide risk; reduced residential displacement; and minimized the impact on existing utilities (resulting in few utility relocations to undisturbed areas).”
GPS receivers are also embedded in many bulldozers, excavators and graders, resulting in reduced waste and lower fuel consumption. They can reduce greenhouse gas emissions, with an estimate from Trimble suggesting that the use of machine control technologies can cut more than one billion pounds of CO2 usage per year.
NextGen Air
GPS is also at the heart of the Next Generation Air Transportation System, or NextGen, of the Federal Aviation Administration (FAA). Capt. Sully Sullenberger, during a 2020 GPSIA-sponsored event, described air traffic control modernization as depending “massively on the ubiquity and reliability of GPS.”
Along with the safety benefits of knowing the precise location of an aircraft, GPS enables optimized flight paths that the FAA says can reduce “flying time, fuel use, and aircraft exhaust emissions.” These efficiencies have already resulted in $1.2 billion in fuel savings, according to the FAA.
During a 2010 test flight over Puget Sound, Washington, Alaska Airlines found that the use of GPS-aided flight procedures reduced emissions by 35% compared to a conventional landing. Other airlines have also quantified these benefits, finding substantial savings in fuel consumption simply by cutting a single minute from each flight.
Weather and Disaster Forecasts
No one can argue the fact that weather events like hurricanes, floods and droughts have a huge impact on the environment and public safety. According to the National Oceanographic and Atmospheric Administration (NOAA), in 2020 such events cost $95 billion in damages. You may not realize, however, that NOAA uses GPS signals to support three-dimensional meteorology, space weather and geophysical applications throughout the United States.
Even NOAA’s Geostationary Operational Environmental Satellites (GOES) use GPS signals to enhance their ability to provide the data we all receive in each morning’s TV weather forecast, improving weather predictions and our own storm situational awareness. GPSIA member Lockheed Martin manufactures both the GOES-R series of weather satellites and the U.S. Space Force’s more powerful, next-generation GPS III satellites that are now being launched to modernize the GPS constellation.
Municipalities
Lastly, we examine the environmental benefits for municipalities that use GPS for key government services, including the real-time tracking of garbage trucks, snowplows and buses. Throughout the country, towns and cities have seen substantial savings in dollars, fuel and time from implementing GPS-enabled technologies.
In Niles, Illinois, for example, the Department of Public Works partnered with GPSIA founding member Garmin to optimize the routing of snowplows. Using GPS technology, drivers reduced the use of salt by as much as 40%, resulting in more than 700 tons saved. In 2020, in recognition of its innovative use of GPS, the department received the Management Innovation Award from the American Public Works Association. Similarly, GPSIA member CalAmp found that GPS use for vehicle tracking can result in fuel savings of $90 per vehicle per month.
Ensuring GPS
Ensuring these environmental benefits can continue to be realized requires that the spectrum used by GPS be protected from harmful interference. It will also depend on continued funding by Congress to modernize the GPS constellation and ground control. Additionally, as Congress considers a major infrastructure bill, including funding for states and localities, we would encourage projects to make use of GPS and other innovative technologies that can drive down costs, reduce carbon emissions, and eliminate waste — including advanced digital-construction management systems that use GPS data to reduce project costs and speed project delivery.
GPS has changed our everyday lives for the better, and as our dependence on this technology continues to grow, so will its impact on environmental sustainability efforts.
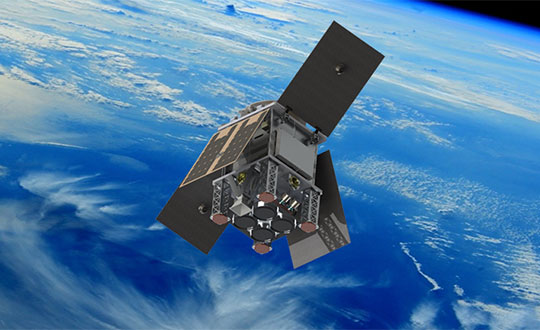
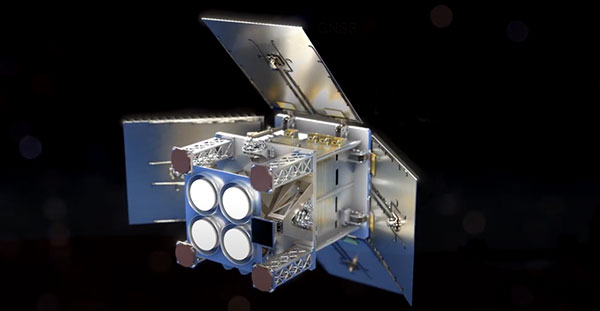
The small satellite will measure climate variables using GNSS Reflectometry
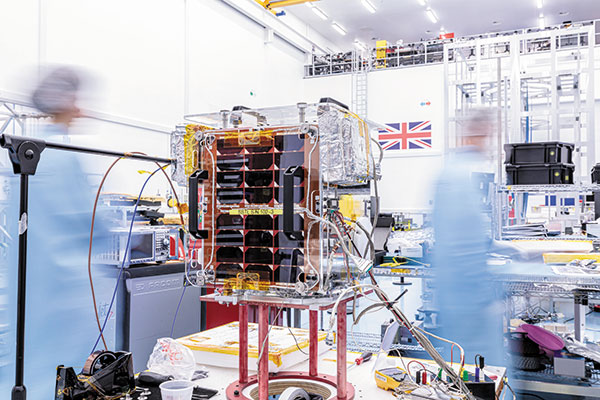
The European Space Agency (ESA) has selected HydroGNSS from Surrey Satellite Technology Ltd. (SSTL) for its second Scout Earth Observation small satellite mission. HydroGNSS is a 40-kg satellite that will be built and operated by SSTL.
ESA selected the first ESA Scout satellite, ESP-MACCS, in December 2020. ESP-MACCS focuses on understanding and quantifying processes in the upper atmosphere over the tropics — processes that play an important role in the overall evolution of the atmosphere.
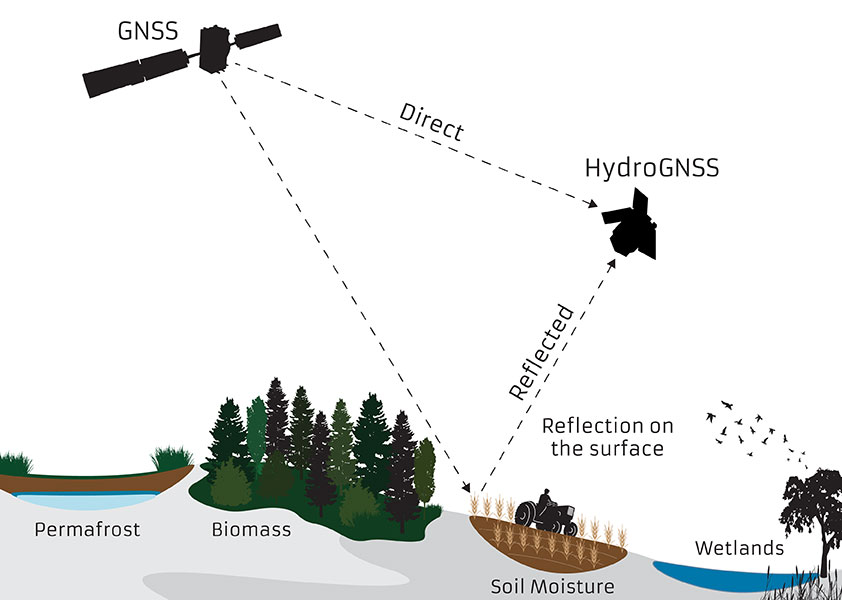
HydroGNSS will take measurements of key hydrological climate variables, including soil moisture, freeze thaw state over permafrost, inundation and wetlands, and aboveground biomass, using GNSS reflectometry. It will complement missions such as ESA’s SMOS and Biomass, Copernicus Sentinel-1 and NASA’s SMAP.
Both small satellites are expected to be the first in a series of ESA Scout missions demonstrating how small satellites on a budget of less than €30 million and a three-year schedule can play an important role in Earth observation, and be scaled up for future missions.
Knowledge of these variables helps scientists understand climate change and contributes towards weather modelling, ecology mapping, agricultural planning and flood preparedness.
“SSTL pioneered GNSS reflectometry, providing the payloads on TechDemoSat-1 and the NASA CYGNSS mission for measuring ocean wind speeds, and I am delighted that we will now launch the first satellite mission specifically addressing hydrological measurements using this innovative technique,” said Phil Brownnett, SSTL managing director.
Previously, addressing hydrological variables such as these has required sizable and higher cost satellites with large aperture antennas, but GNSS reflectometry uses existing signals from GNSS as radar signal sources. These signals are reflected off the land, ice and ocean and can be collected by a low power receiver on a small satellite in low Earth orbit, and used to yield important geophysical measurements.
Image: SSTL
SSTL is working closely with partners to tackle the scientific and technological challenges involved. Partners include Sapienza, Tor Vergata and IFAC-CNR in Italy; FMI in Finland; IEC/IEEC in Spain; and NOC and the University of Nottingham in the United Kingdom (UK),
“The decision to implement HydroGNSS after ESP-MACCS demonstrates that the Earth observation community is very interested in the concept of Scout missions. We are confident that this interest will further flourish when we see the first data in 2024,” said Toni Tolker-Nielsen, ESA’s acting director of Earth Observation Programmes.
As well as the already established GNSS-Reflectometry measurements, new techniques will be explored on HydroGNSS, including use of Galileo signals, dual polarization, dual frequency and recovery of coherently reflected components. These new measurements are expected to improve the separation, resolution and quality of the climate variables under observation.
The HydroGNSS mission exemplifies the UK’s innovation in climate change research, according to SSTL. The 26th United Nations Climate Change Conference takes place in the UK Nov. 1-12.
Image: SSTL
“The UK is leading the way in using space to tackle climate change, with Earth Observation satellites providing some of the most important data to monitor our environment as we build back greener,” said Science Minister Amanda Solloway. “Using a UK satellite just the size of a microwave oven, this pioneering mission will build on the UK’s expertise in space research by measuring changes in the Earth’s water, providing crucial information to address climate change, improve farming and support wider disaster management.”
HydroGNSS paves the way for an affordable future constellation that can offer measurements with a temporal-spatial resolution not accessible to traditional remote-sensing satellites, thus offering new capacity to monitor very dynamic phenomena and helping to fill the gaps in our monitoring of the Earth’s vital signs for the future.
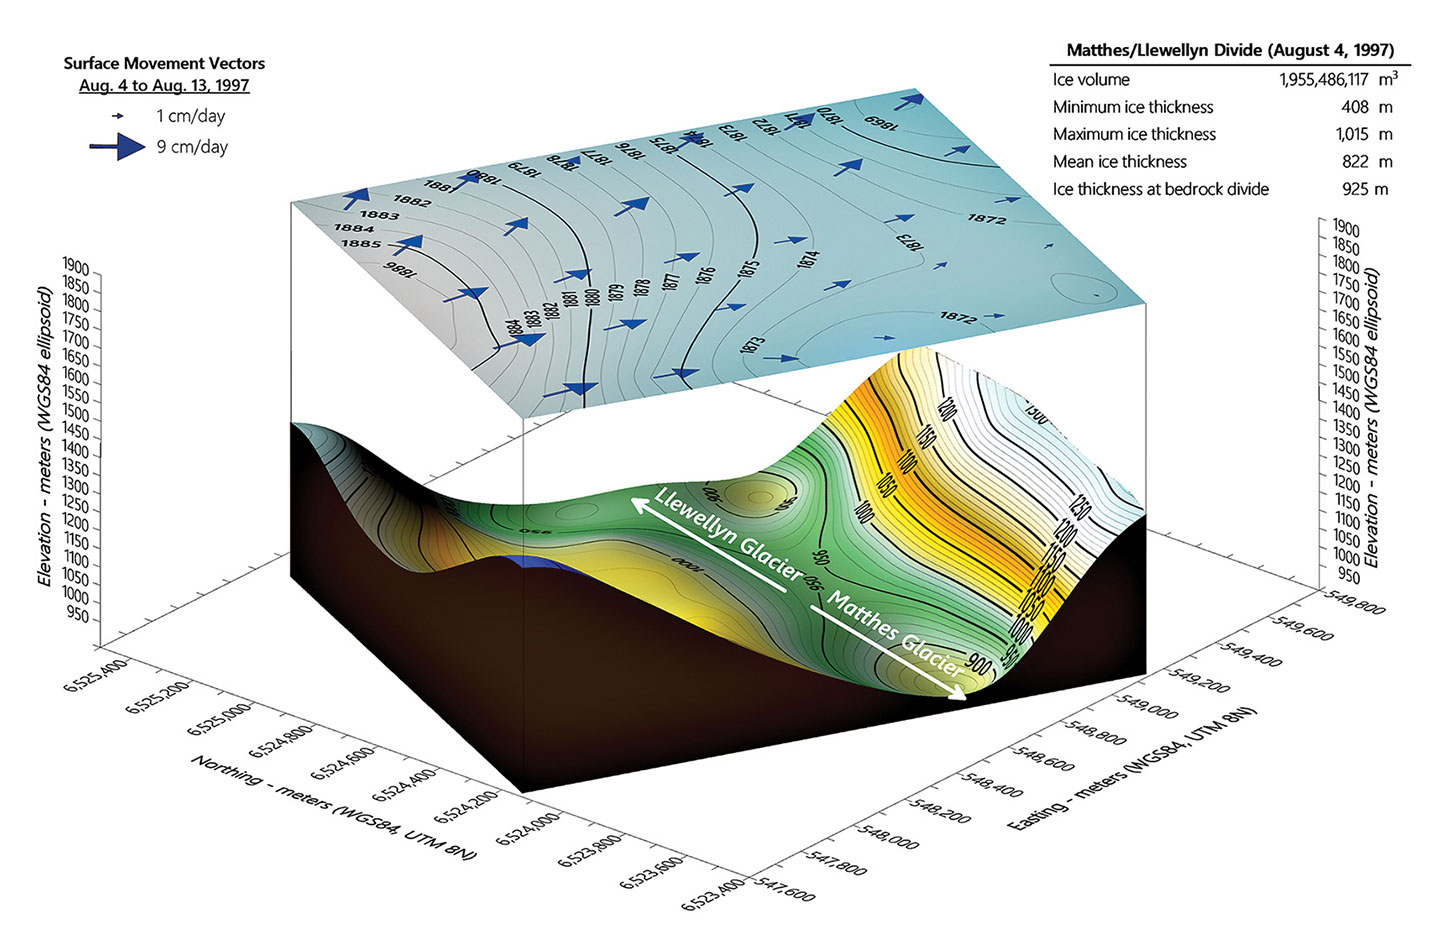
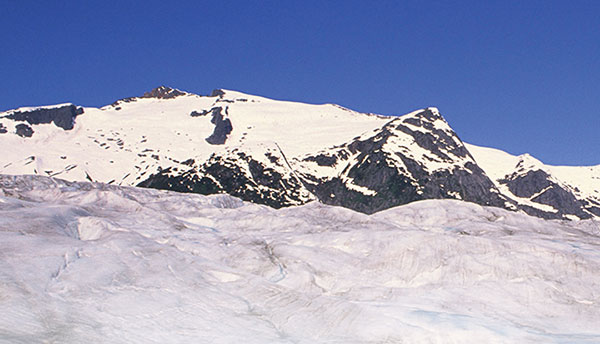
The Juneau Icefield Research Program (JIRP) calculates that thinning of Alaska’s Taku Glacier has increased from an average rate of 0.5 meter to 2 meters per year over the past two decades. Annual mapping by JIRP reveals the glacier’s thickness has varied from one year to the next, likely due to snow accumulation variability, but the overall current trend shows an annual net loss of ice.
“Taku is losing enough meltwater every day to fill an NFL stadium,” said Seth Campbell, JIRP director of Academics & Research.
At more than 800 square kilometers, Taku Glacier is the largest in the massive Juneau Icefield, making it vital to the study of climate change.
JIRP monitors the complex kinematics and mass balance of the Juneau Icefield — changes to ice velocity, snow accumulation and surface melting — to estimate whether the glacier is advancing or retreating over time. The team maps yearly GPS field measurements in Golden Software’s Grapher and Surfer modeling packages.
Image: JIRP/Golden Software
Straddling the Alaska-Canada border, the receding icefield plays multiple important roles in local ecosystems. For British Columbia, it provides fresh water, but for the Gulf of Alaska, increasing glacier meltwater can potentially harm the marine ecosystem and valuable fisheries.
JIRP research dates from 1946; the introduction of GPS in 1993 contributed significantly to annual summer fieldwork. Volunteers capture more than 1,000 GPS measurements at designated transect locations on the icefield each year to record glacial velocity and surface elevation changes.
Using Grapher, the team plots GPS “Z” elevation values across transects in 2D to generate thickness profiles. The scientists also input GPS field points for multiple transects from multiple years into the Surfer 3D surface mapping package to gain a sense of overall glacier volume change.
The primary revelation from the JIRP work has been a greater understanding of how and where the glaciers are changing, according to Scott McGee, JIRP Geomatics Program Lead. Until recently, glacial melt was assumed to occur mostly at lower elevations of the icefield, where temperatures are generally higher. However, McGee and the JIRP team have routinely discovered thinning occurring at all elevations of the icefield, including at the highest elevations of 1,900 meters.
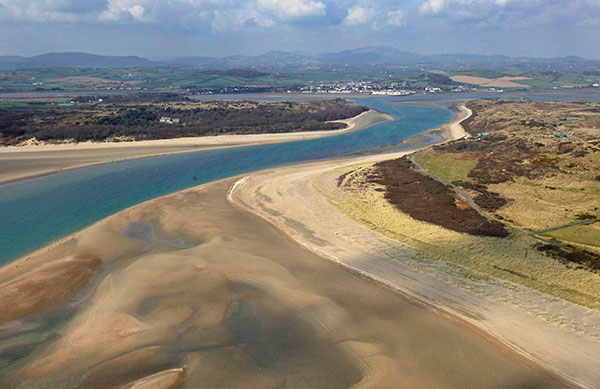
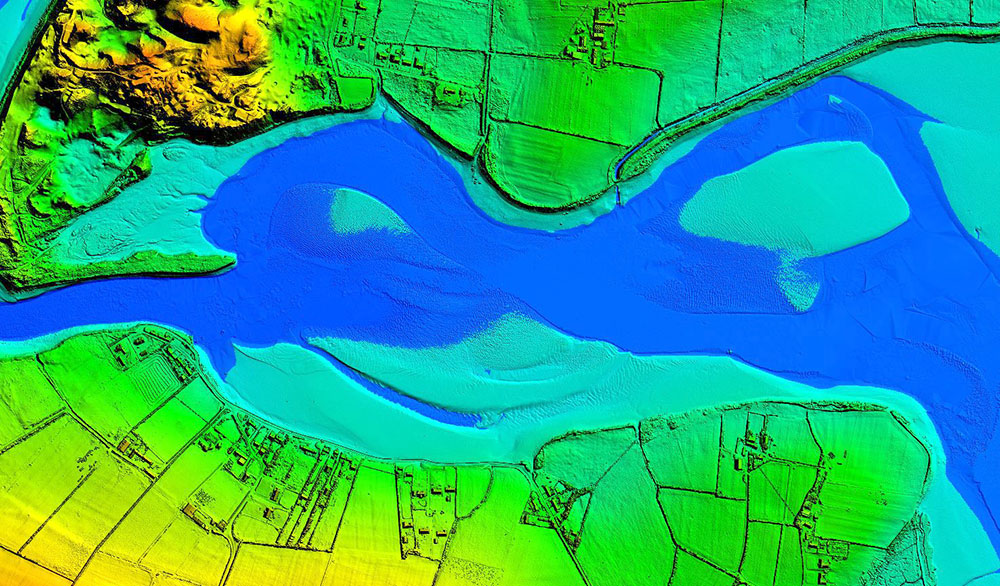
Dundrum Bay on the coast of Northern Ireland is captured by a mapping airplane in a project to document climate change effects. (Photo: DAERA/Bluesky)
Bluesky International will use aircraft-mounted lidar sensors and laser scanners to create a highly detailed 3D map of the whole of the Northern Ireland coastline.
Working on behalf of the Department of Agriculture, Environment and Rural Affairs (DAERA), the lidar survey will be used to create the first complete baseline. The baseline will underpin recording of coastal change and help identify the rate at which the coastline is changing as a result of climate change.
In addition to the lidar data Bluesky will simultaneously capture high detailed aerial photography which will be processed to produce to a fully orthorectified, 10-centimeter-resolution database.
The Bluesky data will form part of the wider Northern Ireland 3-dimensional coastal survey. The survey will extending into the marine environment with a satellite-derived bathymetric survey and a pilot bathymetric lidar survey. Together, the surveys will inform the development of future coastal management policies.
“The Northern Ireland coast is a hugely valuable resource which is currently facing increasing pressure from climate change,” said Joanne Hanna, senior scientific officer within the Marine and Fisheries Division of DAERA. “Sea-level rise, in combination with an increase in extreme storm events, is resulting in greater energy impacting our coastlines, altering coastal processes and accelerating change.
“Despite the importance and the value of this coastline, the nature and scale of the issues arising from coastal change and sea-level rise are currently not known and there is limited and insufficient baseline data available,” Hanna said. “The coastal lidar survey carried out by Bluesky will provide scientifically robust baseline data which will enable decision makers and coastal managers to make informed decisions and devise solutions and appropriate management to the problems currently facing our coastline.”
Bluesky will undertake the specialist survey using a fixed wing manned aircraft and will fly the 763 kilometres of Northern Ireland coastline capturing height measurements of both the underlying terrain and any surface features at a resolution of better than 16 points per metre. This data will be used to create highly accurate 3D digital terrain and surface models (DTM, DSM) with a spacing of up 25 centimetres.
The Bluesky datasets will be supplied ready for use in a range of geographical information system (GIS), desktop mapping and other specialist software packages and will be compatible with other DAERA datasets including Ordnance Survey mapping.
Just a couple of pieces of drone news this month — who would imagine flying a fixed-wing drone into the plume of a volcano? And some new advances in tethered drone capability.
Global warming/climate change — a collection of words which can sometimes lead to disputes, disagreements and dismay. These words can fill people with enthusiasm for change and in others have them just shaking heads. I saw a video some time ago made by an eminent scientist who claimed that all the efforts made by humans to pollute over the centuries and the efforts being made now to help the atmosphere, were insignificant when all the junk kicked out on a daily basis by volcanoes around the world was taken into account.
Nevertheless, it’s for sure that the climate is changing — by human hand or by nature — some people are still seeking a scientific basis to establish if it can somehow be remedied — a greener approach which could stop or limit our ability to go on polluting the only world we have, or at least some version of curbing what we are doing to make things worse.
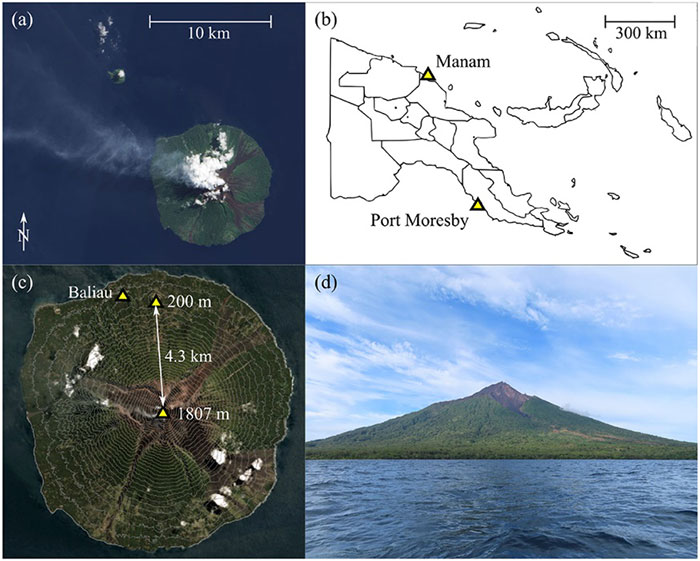
So it was exciting for me to see recent reports of an expedition from last year in Papua New Guinea where an international group used drones in an attempt to measure carbon dioxide, sulfur dioxide and hydrogen sulfide coming out of the active Manam volcano. The objective appeared to be direct sampling of the volcano plume to determine content, not just for measurement alone but perhaps also eventually maybe monitoring changes in gas content to forecast future eruptions.
A series of significant eruptions last took place 2004-2006, and again in 2014, but since then Manam has continued to be explosively active all the way up to the present day. It’s possible to climb almost 6,000 feet to the upper dome, but for more efficient regular monitoring the expedition wanted to demonstrate that a fixed wing drone, operated from a village 2.7 miles away, almost at sea level, would work better. Satellite data on emissions is also available, but apparently no predictions of CO2 content has so far been possible, so land based survey and direct sampling might greatly improve understanding.
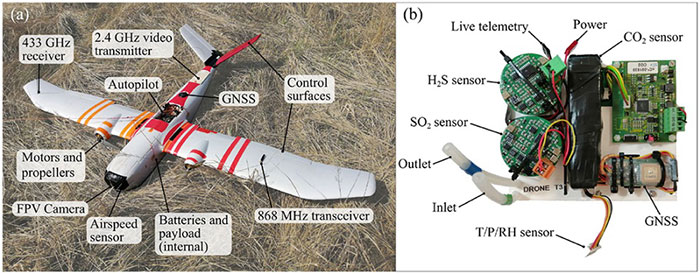
Hand launched, with an internal parachute system for recovery, the Titan UAV, which can lift a payload of around 2 pounds to an altitude of 7,500 feet and has a range of more than six miles. For the trip to the volcano, two 4k cameras provided forward and rear views, oversized electric motors were installed to provide more thrust and onboard data capture allowed for subsequent analysis of the vehicle dynamics as well as the gas content of the environment. Live data was also transmitted real-time to the operator and monitoring crew and was also stored for later review. The autopilot on the drone is capable of automatic GPS waypoint navigation and manual flight mode may be engaged by the operator. The drone carries GNSS, barometric altitude, airspeed indication and IMU sensors.
The automatically flown flight path up 5,300 feet to one of the two volcanic outlets on the mountain followed a zig-zag path to a point offset from the smoking caldera, and if the drone failed to then turn and intercept the plume automatically, it was manually maneuvered in level flight into the smoke column. Plume intercept was interpreted as a steep increase in sulphur dioxide concentration, and at the same time there were increases forces on the drone, at times up to 2.5 g, with roll deviations up to 25 degrees and significant uplift. Not unsurprising rock and roll given the energy being released by the volcano.
After each plume intercept the drone then left the area and descended in a spiral to the launch site, being recovered by manual parachute release. Two flights were successful, yielding lots of data for analysis, but there was an upset while in the plume on the third flight and the vehicle was lost, thought to be related to pulsating increases in the velocity of gas released by magma in the crater and what looked like a 7-g increase in forces on the vehicle. The plume was figured to be between 1800 ft and 2,500 feet wide, using the length of time spent in the smoke column and the speed being flown.
The flights were all conducted under Beyond Visual Line of Sight (BVLOS) conditions as agreed by the local air control agency and significant drone design improvements and flight techniques for subsequent ‘volcano operations’ were recommended. Gas emissions were measured at 3,450 to 4,360 tons/day CO2 and 4,840 to 5,880 tons/day SO2 — so lots of carbon pollution from one of the earth’s most active volcanos, one of around 500 worldwide.
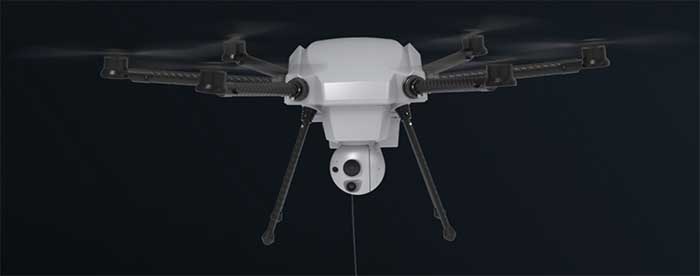
Tethered drones offer advantages for some specific applications such as longer flight times for surveillance. Recent outings by Elistair tethered drone systems have included crowd monitoring and TV coverage for Super Bowl in Atlanta, Ryder Cup golf near Paris France, traffic monitoring in Lyon France, TV coverage for the Alpine World Ski Championships in Sweden, Paris Le Bourget airport approach light monitoring, Trinidad carnival crowd monitoring, Kentucky festival crowd monitoring and communications relay, fire control exercises in Greece, New Year’s crowd monitoring in Vienna and crowd monitoring at Madrid’s soccer stadium.
The Orion 2 tethered drone (Photo: Elistair)
But endurance is a key element for longer term surveillance, so Elistair has come out with Orion 2 which has extended the previous 8-12 hours operations envelop all the way out to 24 hours — and added IP54 dust and water rating, so weather shouldn’t interrupt service.
The tether now extends up to 330 feet so the drone can see out further and it can now also lift a 4.5-pound payload such as a combined ISR (intelligence, surveillance and reconnaissance) and telecom platform. While streaming georeferenced electro-optical and infrared video, 4G/5G communications nodes may also be brought online at the same time.
So an insight into what it takes to fly a drone into active volcano emissions to move us further towards understanding climate change, and improvements in tethered drone endurance. Doubt many of would expect a drone to survive the extreme turbulence created by the energy released from a volcano, or would even try to do so, but one group has been successful and found a new way to monitor activity and measure bad stuff being pumped into the atmosphere. And if we can hover a multi-rotor drone in the air for 24 hours at about 300 feet, who knows what new applications will soon come out of it.
The successful demo consolidates concept designs for a proposed land-sensing ESA Scout mission, HydroGNSS
Surrey Satellite Technology Ltd. (SSTL) has successfully demonstrated GNSS reflectometry (GNSS-R) from its 18-kg DoT-1 satellite. SSTL has pioneered the new field of GNSS-R with successful payloads on board TechDemoSat-1 and the CYGNSS constellation, and is continuing to develop the technology and data analysis in pursuit of this new science.
SSTL’s DoT-1 satellite was launched in 2019. (Photo: SSTL)
The GNSS-R payload onboard the DoT-1 satellite is incorporated within a new small-form-factor Core Avionics module integral to all SSTL’s future satellite platforms. This innovation paves the way for any SSTL satellite that can accommodate a nadir pointing antenna to become part of a GNSS-R small-sat constellation.
GNSS reflectometry is an Earth-observation technique that uses GNSS signals as L-band radar sources, allowing the satellite to take measurements of ocean wind speeds, polar ice and hydrological land parameters, at a higher spatial resolution and an order of magnitude lower cost than other methods.
“GNSS-R is a powerful new science that can contribute valuable data to help monitor changes in our global climate, and I am really pleased with the success of our DoT-1 demonstration.,” said Phil Brownnett, managing director of SSTL. “We now have an advanced instrument design and deep expertise in this new field, and I am hopeful that SSTL’s HydroGNSS concept will progress to a full mission to support the global climate-control challenge.”
HydroGNSS mission
The GNSS-R technology demonstration from SSTL’s DoT-1 satellite is also an important stepping stone for a proposed European Space Agency (ESA) Scout Mission Concept called HydroGNSS, which comprises two 40-kg satellites that collect data continually in near-polar orbits, taking hydrological measurements over the whole globe.
The HydroGNSS mission concept makes advanced use of new GNSS reflectometry techniques such as Galileo signals, dual polarization, and coherent signal acquisition to measure four Essential Climate Variables (ECVs) over land: soil moisture, inundation, permafrost freeze/thaw, and biomass. HydroGNSS has been down-selected by ESA for a concept study; the finally selected Scout mission will commence in 2021.
The below animated video illustrates the HydroGNSS mission.
SSTL’s GNSS-R instrument collects and processes measurements into a “delay Doppler map” (DDM) that can be corrected and inverted into Level 2 products such as ocean wind speed, as has already been successfully demonstrated by the SSTL GNSS-R instruments onboard the TechDemoSat-1 and CYGNSS missions.
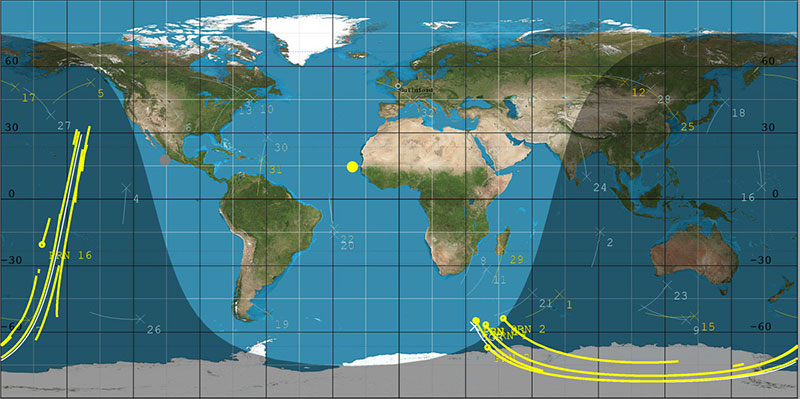
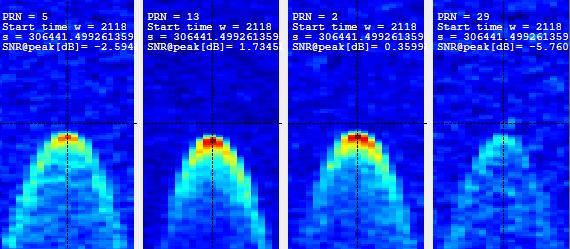
The plot below shows results from data gathered by the DoT-1 satellite on Aug. 12, and shows simultaneous DDMs from four separate GPS satellites. As this is a forward scattering technique, the stronger signals with redder peaks indicate a calmer ocean with lower wind speeds. Approximately 40 minutes of data were collected from the Pacific to the Antarctic to the Southern Ocean.
DoT-1 sub-satellite track (white) and GPS reflection tracks (yellow) collected during 40 minute data operation. (Image: SSTL)Four Delay Doppler Maps (DDMs) collected by DoT-1 that show signal reflections from four GPS satellites. (Image: SSTL)
Soil moisture measurements
Data from the SSTL GNSS-R instruments onboard the CYGNSS mission have demonstrated the potential for soil moisture measurement by GNSS reflectometry, and preliminary work shows that GNSS-R also has good sensitivity for freeze/thaw sensing in the active zone of permafrost. Unseasonal changes in the permafrost cycles could potentially release larger quantities of methane, which risks exacerbating global climate change.
GNSS-R can also be used to assess biomass, a measure of forest density which acts as a vital sink for removing carbon dioxide from the atmosphere. In addition to longer term climate observations, soil moisture and inundation measurements from GNSS reflectometry can provide important information for short-term operational purposes, for example, towards Numerical Weather Prediction and flood warnings following rainfall events.
The development of SSTL’s new GNSS-R instrument was funded in part by the European Space Agency.
NASA is partnering with the New Zealand Ministry of Business, Innovation and Employment, New Zealand Space Agency, Air New Zealand and the University of Auckland to install next-generation GNSS reflectometry receivers on passenger aircraft to collect environmental science data over New Zealand.
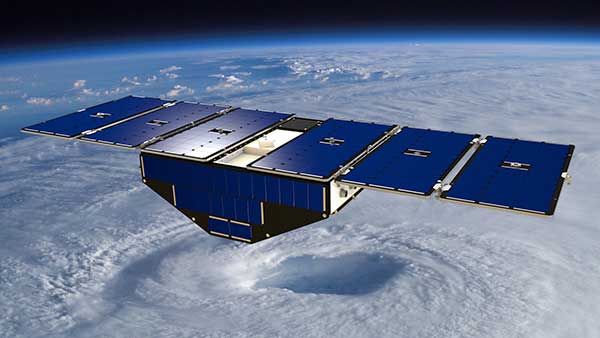
The program is part of NASA’s Cyclone Global Navigation Satellite System (CYGNSS) mission, a constellation of eight small satellites launched in 2016 that use GPS satellite signals that reflect off Earth’s surface to collect science data.
The CYGNSS satellites orbit above the tropics and their primary mission is to use GPS signals to measure wind speed over the ocean by examining GPS signal reflections off choppy versus calm water. This allows researchers to gain new insight into wind speed over the ocean and will allow them to better understand hurricanes and tropical cyclones.
Measurements over land
In addition to its primary over-water research capabilities, scientists have discovered that the CYGNSS technology is also capable of collecting valuable measurements over land, including of soil moisture, flooding, and wetland and coastal environments.
“Partnering with New Zealand offers NASA and the CYGNSS team a unique opportunity to develop these secondary capabilities over land. Taken together over time, they’ll also have an important story to tell about the long-term impacts of climate change to these landscapes,” said Gail Skofronick-Jackson, CYGNSS program scientist at NASA Headquarters, Washington.
The CYGNSS team, led by principal investigator Chris Ruf at the University of Michigan in Ann Arbor, has developed a next-generation GNSS reflectivity receiver with support from NASA’s Earth Science Technology Office. These receivers will be installed in late 2020 on one of Air New Zealand’s Q300 domestic aircraft.
Artist’s concept of one of the eight CYGNSS satellites in orbit. (Image: NASA/University of Michigan)
Aircraft overlap satellite path
As the aircraft traverses New Zealand, it will collect data from the land below, some of which will overlap with the flight paths of the CYGNSS satellites.
This overlap, which will have frequent data observations from regular commercial flights, will provide the CYGNSS team a wealth of data to use to validate and improve the CYNGSS satellite observations, said Ruf.
In addition, the varied New Zealand terrain will provide comparison points with data collected in similar terrains in other parts of the world.
“As a result of this partnership, both Air New Zealand engineers and researchers across New Zealand will now have the opportunity to work with NASA on a world-leading environmental science mission,” said Peter Crabtree, general manager of Science, Innovation and International at New Zealand’s Ministry of Business, Innovation and Employment.
Science Payload Operation Centre
The University of Auckland will host the Science Payload Operation Centre, which will begin operations and data collection in late 2020.
“Over time, the data that will be collected by these receivers could form one of New Zealand’s largest bodies of long-term environmental data, and as such it represents a wide range of research opportunities,” said radar systems engineer and project lead Delwyn Moller of the University of Auckland.
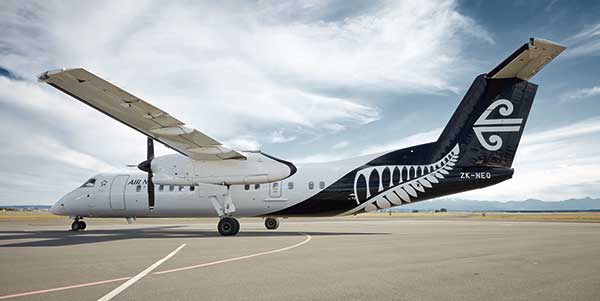
Air New Zealand will be the first passenger airline to partner with NASA to collect data for a science mission. Air New Zealand has 23 Q300s in its fleet, and if the approach is successful, the airline will explore introducing the technology more widely.
An Air New Zealand Bombadier Q300. (Photo: Air New Zealand/NASA)
“As an airline, we’re already seeing the impact of climate change, with flights impacted by volatile weather and storms. Climate change is our biggest sustainability challenge, so it’s incredible we can use our daily operations to enable this world-leading science,” said Air New Zealand Chief Operational Integrity and Standards Officer Captain David Morgan.
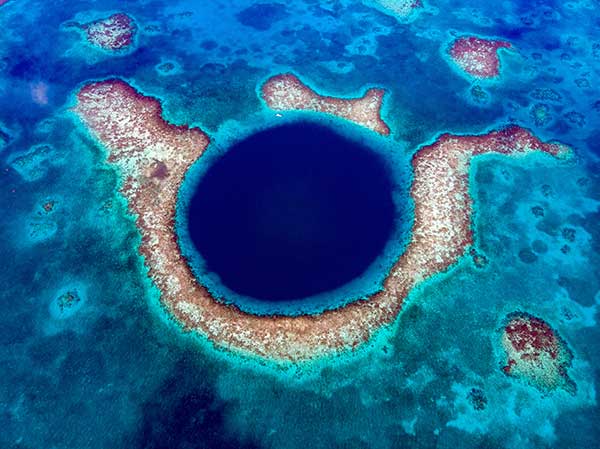
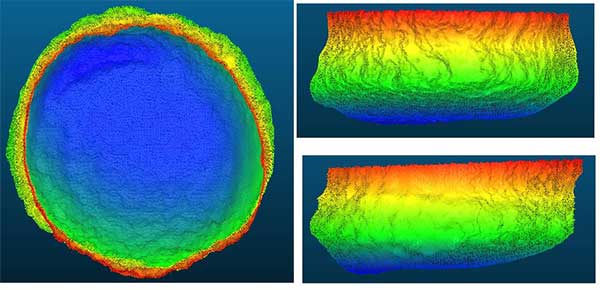
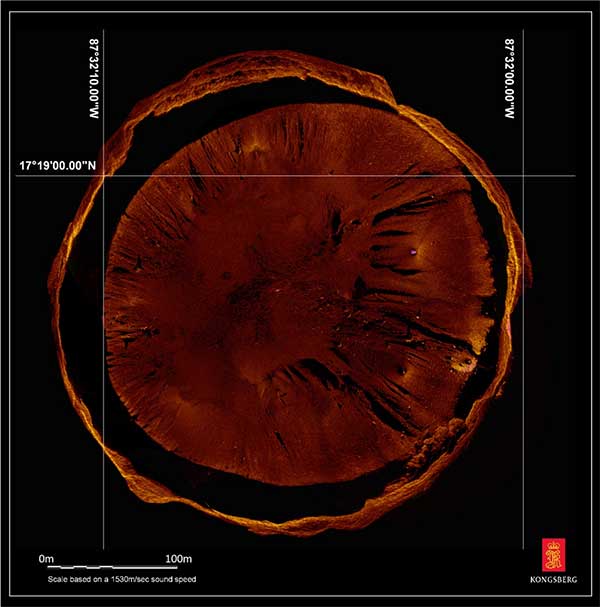
A sonar survey, camera and sensor data of the world’s largest marine sinkhole is shining light on sea level and climate change over 100,000 years.
From Nov. 27 to Dec. 13, 2018, the Blue Hole Belize Expedition mapped the sinkhole. Led by Aquatica Submarines, the team of scientists, explorers and film makers included Virgin ’s Sir Richard Branson and Fabien Cousteau, grandson of the conservationist Jacques Cousteau.
Kongsberg used both surface and submarine-mounted sonar equipment.
Sonar expert Mark Atherton from Kongsberg’s Canadian subsidiary Kongsberg Mesotech was a key member of the science-based sonar and scientific data collection team. Atherton operated the sonars aboard the Research Vessel Brooks McCall, contributing to an invaluable high-resolution map of the entire sinkhole.
“By understanding the geological history and geometric structure at the Blue Hole we can contribute new data to the global scientific community studying sinkholes and cenotes,” he said.
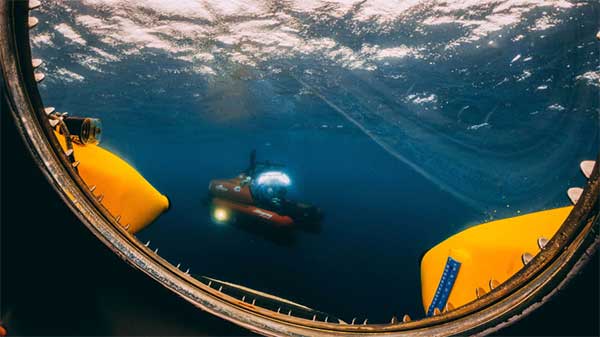
Photo: Aquatica Submarines
Aquatica Submarine’s Stingray 500 submarine was used for sonar surveying, filming and dives. The team conducted more than 20 dives into the large sinkhole, taking videos and 3D images during each trip. They also completed a two-hour live broadcast featured on The Discovery Channel.
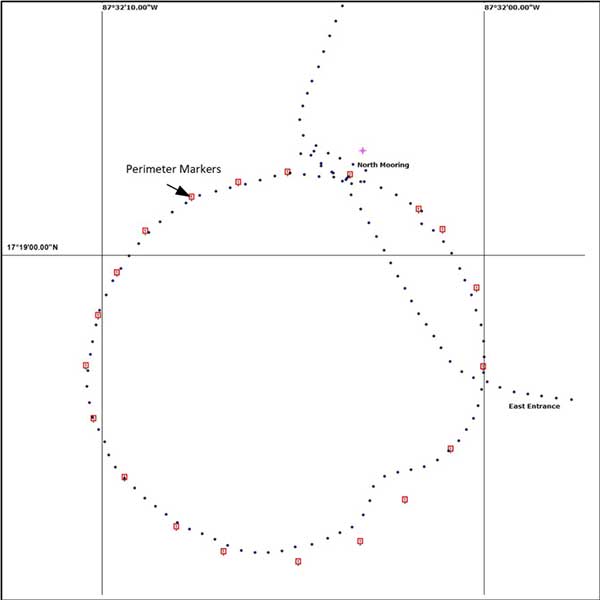
A key outcome of the Expedition is creation of a complete 3D sonar map of the Blue Hole. The sonar map is enhanced with other passive submarine-collected environmental data. Once processed and collated, the data will be shared with the Government of Belize and the larger global scientific community as a legacy from the expedition.
Perimeter Markers: Using an SBG Systems Ellipse receiver positioned directly over suspended tripods, positions were locked in the MS1000 processing software the instant each tripod touched bottom. With no current within the Blue Hole and the tripod and sonar weighing 21.7 kg, there was no issue with offset position differences between the vessel and the tripod hanging plumb during deployment. (Image: Mark Atherton/Kongsburg)Processed Scan Data: A dual-axis sonar (DAS) system collected point-cloud data to create a 3D representation of the Blue Hole. The unit was pole-mounted on the survey vessel with the GPS and motion reference unit directly over the scanner’s head. (Image: Mark Atherton/Kongsburg)Mosaic: GPS tripod position and target matching on overlapping scans were used to align the 50-, 75- and 100-meter-range data collected at 21 drop locations. This mosaic is a very close approximation of the bottom of the Blue Hole. (Image: Mark Atherton/Kongsburg)