1. Dat Collection Software Intuitive workflows require minimal training
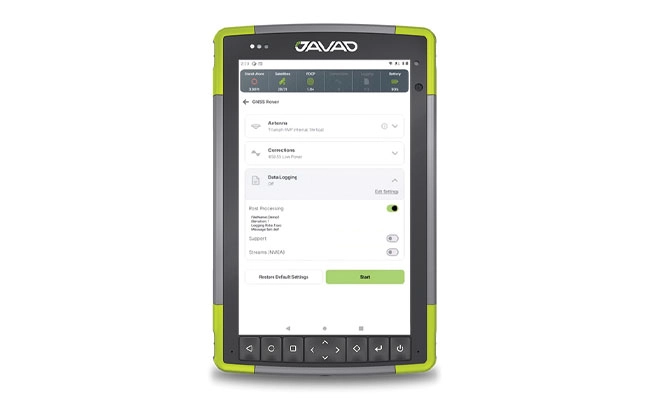
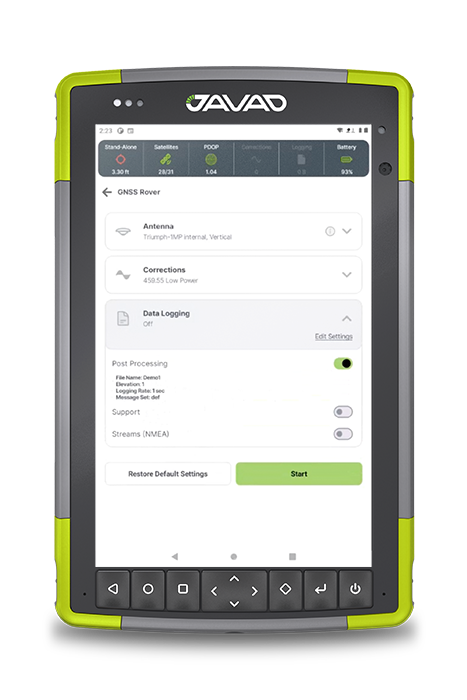
JAVAD Data Collector (JDC) is designed to run seamlessly on any Android device and interface seamlessly with JAVAD GNSS smart antennas. JDC features simple, intuitive workflows that require minimal training, making it accessible for users of all skill levels. The software includes a Signal Bar for a quick view of receiver status, ensuring users can easily monitor their equipment’s performance. Its easy navigation allows users to move through the software efficiently. It is designed to streamline operations of customers ranging from individual surveyors to large surveying firms, making it easier to deploy and manage receivers across teams of any size with minimal training. JDC is available for download through the company website. JAVAD GNSS, javad.com
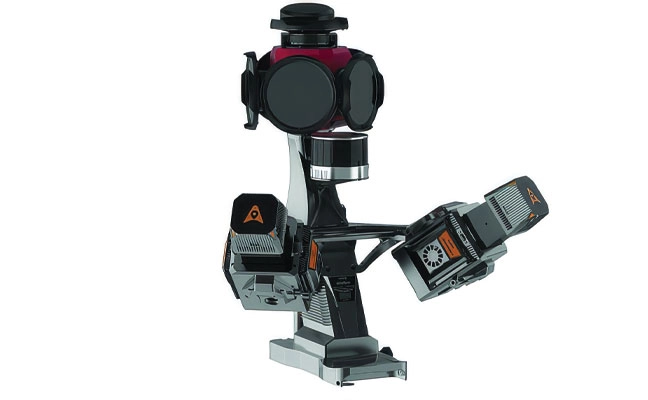
2. Mobile Mapping System Lidar collects 2 million points per second
Photo: CHC NAVIGATION
The AU20 MMS is a vehicle-mounted mobile mapping system designed for accurate and efficient collection of 3D spatial data. It combines high-performance lidar technology, versatile sensor support and intelligent data processing to provide a practical and flexible solution for professionals in road surveying, asset management and infrastructure documentation. Its lidar system uses fourth-generation real-time waveform processing to achieve a scan rate of 2 million points per second and 200 revolutions per second, producing point cloud data with 5 mm accuracy and 3 mm precision. This level of detail allows for the identification of fine surface characteristics and features, supporting comprehensive asset inventories and condition assessments. The system’s long-range, multi-cycle laser technology enables high-density data capture up to 250 m in vehicle-mounted applications. CHC Navigation, CHCNAV.com
Javad GNSS has released its latest data collection software, Javad Data Collector (JDC). Designed to run seamlessly on any Android device, JDC interfaces effortlessly with the company’s modern line of smart antennas.
JDC features simple, intuitive workflows that require minimal training, making it accessible for users of all skill levels. The software includes a Signal Bar for a quick view of receiver status, ensuring users can easily monitor their equipment’s performance. Additionally, JDC offers easy navigation, allowing users to move through the software with efficiency.
“Our goal with JDC was to create a tool that not only meets but exceeds the needs of our diverse clientele,” said Gary Walker, executive vice president, JAVAD GNSS. “We understand the demands of the full spectrum ranging from the individual surveyor to larger surveying firms, construction and engineering firms, as well as government entities. JDC is designed to streamline their operations, making it easier to deploy and manage receivers across teams of any size with minimal training.”
JDC is available for download through the company’s official website. Customers can evaluate the full functionality of JDC with limited point storage and may request a license when ready to integrate it into their workflow.
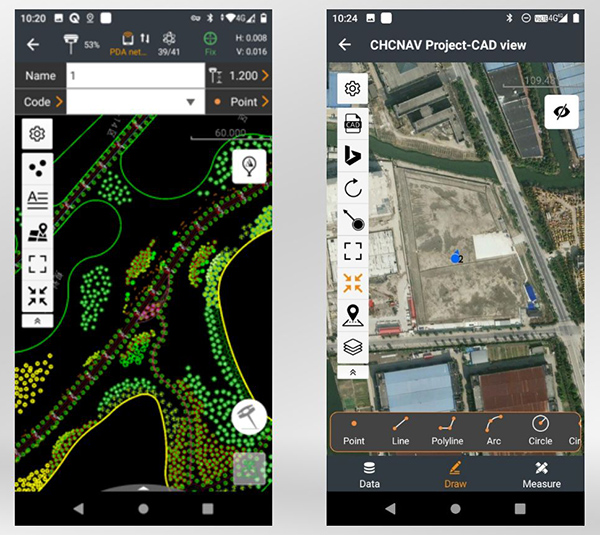
CHC Navigation has released LandStar8, a field surveying and mapping application for Android devices. LandStar8 is designed to be flexible and user-friendly for surveying and mapping tasks.
LandStar8 is versatile, modular and customizable for topographic tasks such as surveying, stake out, cadastral, mapping and geographic information systems (GIS). Building on the legacy of LandStar7, the new LandStar8 provides features such as a refined user interface, streamlined workflows, faster operation, and integrated cloud services.
“With LandStar8, we want to provide our users with unprecedented field experience,” said Rachel Wang, product manager of CHC Navigation’s Surveying and Engineering Division. “LandStar8’s modular design allows users to customize the interface according to their usage habits, making it easier and more efficient for field crews to work.”
Cloud connectivity is built in, for backup, data storage or remote technical support.
LandStar 8 has a simple and intuitive layout with large map windows and sharp graphics. Users can hide features they rarely use and display only those they need.
On LandStar8, users can copy coordinate settings, control and staking points from another handheld controller by scanning a QR code. Projects can be edited and sorted by history and attributes. Custom coordinate systems, geoid models and coding libraries can be updated at any time by using resource packages. LandStar8 also features a terrain calibration wizard designed specifically for non-expert users.
A proprietary MetaCAD graphics engine opens DWG and DXF base maps faster and with smoother rendering. DXF files up to 200 MB can be opened in less than 10 seconds. LandStar8 also supports opening external reference files, automatically recognizes CAD length units, and allows editing of CAD base maps directly in the field.
LandStar8 is designed around a comprehensive cloud-based architecture that supports project backup, collaborative work and data storage. Its remote support capabilities help the office helpdesk resolve user problems and provide personalized technical assistance. A “share code” feature allows users to transfer project data between desktop computers and field controllers or among field controllers quickly to further boost work efficiency.
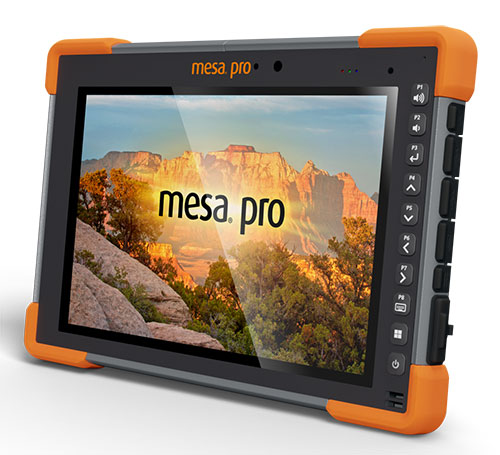
The new device will ship in the fourth quarter of this year and is available for pre-order
Juniper Systems is entering the 10-inch rugged tablet market with the launch of its Mesa Pro rugged tablet. The Mesa Pro features 11th Generation Intel Core processors, a Windows 11 operating system, device customization options, a large sunlight-readable display and “Juniper Rugged” company design.
“We are excited to be entering the 10-inch rugged tablet segment for the first time,” said Darren Hellstern, the Mesa Pro product manager at Juniper Systems. “Mesa Pro offers powerful processing, a rugged design meant for any environment, and is a versatile workstation that can be used in the office or the field.”
Standard Mesa Pro units come equipped with an 11th Gen Intel Core i5 processor and 16 GB of LPDDR4x RAM. Core i7 and Celeron versions of the device are also available.
Each Mesa Pro configuration offers powerful performance and allows users to select a level of computing performance that best fits their needs while having options that meet their budgets.
“It was important for us to offer performance tiers,” said Hellstern. “This is the first time we have offered various performance levels in one of our devices. The needs that our customers and users have varies greatly. From running CAD programs, viewing construction plans, mapping and mounted-vehicle solutions, we feel that we have an offering with Mesa Pro that fits the processing need of the user. We are also available to help users determine what level of performance they need.”
Mesa Pro joins the current Mesa family of 7-inch devices and helps Juniper Systems achieve its mission of providing powerful rugged computing and data-collection devices to mobile field workers everywhere. The Mesa 3 runs on either Windows or Android operating systems. The Mesa family started in 2010 with the launch of the Mesa Rugged Notepad.
“Mesa devices have served our customers for over a decade,” said Hellstern. “We are proud to add Mesa Pro to that list of incredible devices and offer more options to our customers and users around the world.”
Juniper Systems is now accepting pre-orders for the Mesa Pro.
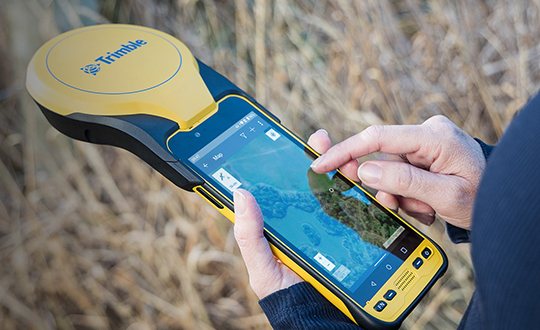
Trimble has announced a new high-performance data collector for its Mapping and Geographic Information Systems (GIS) portfolio — the Trimble TDC650 handheld. Built for GIS data collection, inspection and asset management activities, the TDC650 provides users a rugged solution with scalable high-accuracy GNSS positioning for professional field workflows.
The TDC650 is fully integrated with today’s demanding GIS data environment, powered by the Trimble Software Development Kit (SDK) that enables precision GNSS positioning for apps such as Esri ArcGIS Field Maps and Trimble TerraFlex software. The TDC650 is also a scalable solution that allows customers to choose their desired accuracy down to the centimeter-level to meet needs and budget requirements.
“This is an ideal tool for customers tasked with modernizing critical utilities including electric, gas and telecommunications networks,” said Gareth Gibson, marketing director, Trimble Mapping and GIS. “The precision, quality and data integration workflows needed to map the physical world to a digital one in these projects requires a modern data-collection platform like the TDC650.”
City, state and local governments and utilities will benefit from this solution, which is part of the larger Trimble Public Sector ecosystem that includes Cityworks software for stormwater inspections and Trimble Unity for monitoring municipal water pressure and hazards. As GIS data continues to grow more complex, Trimble helps simplify, visualize and make sense of the data so customers can make better decisions in managing their communities’ assets.
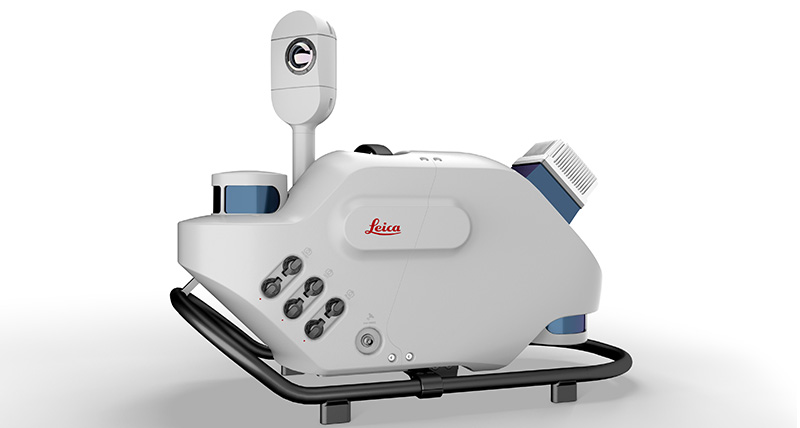
Leica Geosystems, part of Hexagon, has introduced Leica Pegasus TRK, a reality-capture mobile-mapping system that features artificial intelligence (AI), autonomous workflows and intuitive interfaces.
The Pegasus TRK features an AI-enhanced camera and automatic camera calibration. To comply with privacy regulations, its AI can identify and blur identifiers, such as people and vehicles, in real time.
Features include advanced dynamic laser scanning and an expandable imagery system for recording, measuring and visualizing environments. It also increases productivity with automated, intelligent workflows.
Light enough to be operated by one person, the Pegasus TRK is user-friendly, able to be used by professionals new to the technology. Its reliable, high-quality deliverables serve the needs of technical experts in various industries, including surveying, transportation and utilities.
The Pegasus TRK solution enables long-range mobile mapping for applications in asset management; road construction; rail and critical infrastructure; oil, gas and electricity industries and more. The system also is suitable for creating high-definition base maps for autonomous vehicles.
The Pegasus TRK connects with the new powerful Leica Pegasus FIELD software for fully autonomous and secure data collection and route planning in the field. It also connects with Leica Cyclone Pegasus OFFICE for seamless input into post-processing and publishing workflows.
“The Pegasus TRK solution is the most efficient mobile mapping product we’ve tried so far,” said Raymon Somford, CEO and owner of Rise3D. “It is lightweight and easy to use, guiding our team through the process of data collection. Its sensors that trigger automatically avoid missing details. We can achieve quality images regardless of the conditions, making mobile mapping almost effortless.”
“The Pegasus TRK solution offers flexibility, true-to-life image clarity and best-in-class accuracy while making mobile mapping more accessible and easier than ever before,” said Christian Schäfer, business director, Mobile Mapping at Leica Geosystems. “There is a growing demand for more autonomy. This solution raises the bar in data collection with automated route planning, guidance and collection processes that increase efficiency, improve data quality and reduce project costs.”
The Pegasus TRK will be a featured Tech Highlight at Hexagon’s flagship digital-reality solutions conference HxGN Live Global in Las Vegas, which takes place June 20-23.
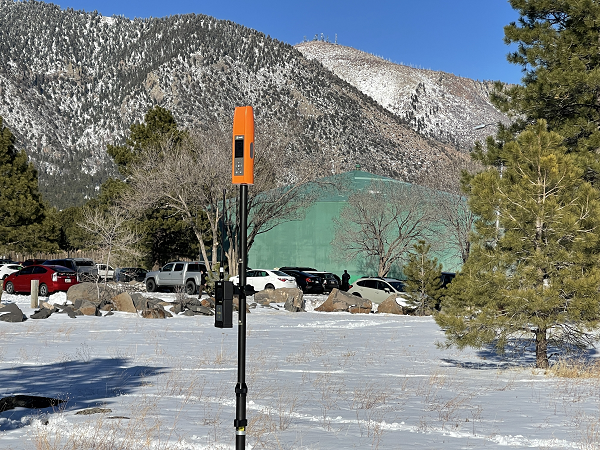
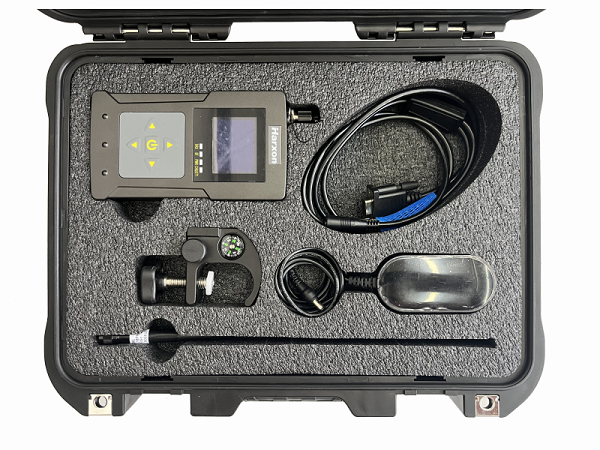
Bad Elf has introduced a base/rover feature built upon its Bad Elf Flex GNSS receiver. The new base/rover feature brings affordable centimeter-level accuracy to surveyors and geospatial professionals working anywhere in the world.
The solution consists of two Flex GNSS receivers and two UHF radios, allowing customers to perform high-accuracy field data collection in areas where traditional real-time kinematic (RTK) corrections or cellular coverage is not available. Existing Flex customers can upgrade by adding Flex radio kits.
Bad Elf designed the base/rover feature with emphasis on accuracy, affordability and versatility. The Bad Elf Flex enables reliable data collection either as a standalone receiver or paired with apps on iOS or Android phones and tablets. A checklist-based workflow ensures consistent results and eliminates many common issues associated with setup and deployment of a base/rover solution.
Photo: Bad Elf
“The Bad Elf app walks the user through these steps and more, and it doesn’t let the project proceed until each checklist is complete,” said Larry Fox, vice president of Marketing and Business Development at Bad Elf. “The automated checklists simplify every process, so that geospatial professionals and surveyors of every experience level get reliable results.”
The base feature requires only one Flex Extreme and a radio kit. Customers may choose to use either Standard or Extreme Flex with a radio kit for rovers. Using Flex Standard and one daily token provides access to the rover feature.
Bad Elf’s flexible hardware-as-a-service model provides a mechanism for customers to further reduce the capital cost of a complete base/rover system. In addition, customers can deploy multiple rovers in either configuration for larger projects.
“For about one-third of the purchase price of competing products available today, our base/rover feature makes survey-grade one-centimeter accuracy a reality worldwide,” said Fox. “And our pay-as-you-go Flex Token model dramatically reduces operating expenses by allowing users to activate — and pay for — just the service levels needed on a given day.”
Complete base/rover kits are available immediately, along with à la carte options for existing Flex customers. The Flex base/rover solution is compliant with FCC operating standards in the United States. Bad Elf provides customers with complete instructions for acquiring a radio operator license and call-sign designation.
The surveying profession is intrinsically involved with many functions of today’s communities and environment. When we take a closer look at the roles we play, the surveyor is usually found in the middle. Here are a few examples.
For new developments and infrastructure, surveying takes place after a client decides to begin a project. Site data must be collected, drafted and presented to the client, engineers and architects for design.
Upon completion of the engineering design, the surveyor provides layout services for the construction company to build the structure.
Once the improvements are completed, the surveyor provides surveys as well as record drawings for confirmation of construction to satisfy government agencies and financial backers.
In a property dispute, the surveyor becomes the center of attention — our professional opinion determines the correct location of the subject boundary.
This responsibility also extends to the geospatial sectors within the surveying profession. Data collection is a critical step to creating and maintaining efficient geographic information system (GIS) databases that correctly depict existing infrastructure and parcel boundary layers. With the surveyor at the center of many of these duties and tasks, no wonder that we sometimes feel we have a bullseye on our backs.
Knowing how to compute the center is an important aspect of the surveyor’s duty.
However, the word center takes on a different connotation when it comes to data and objects. Properly identifying the center of specific sets of data or objects is important when working with construction information and geospatial data. Properly measuring and marking the center of an installation has its challenges, so knowing how to compute the center is an important aspect of the surveyor’s duty.
Why is the center of an object important?
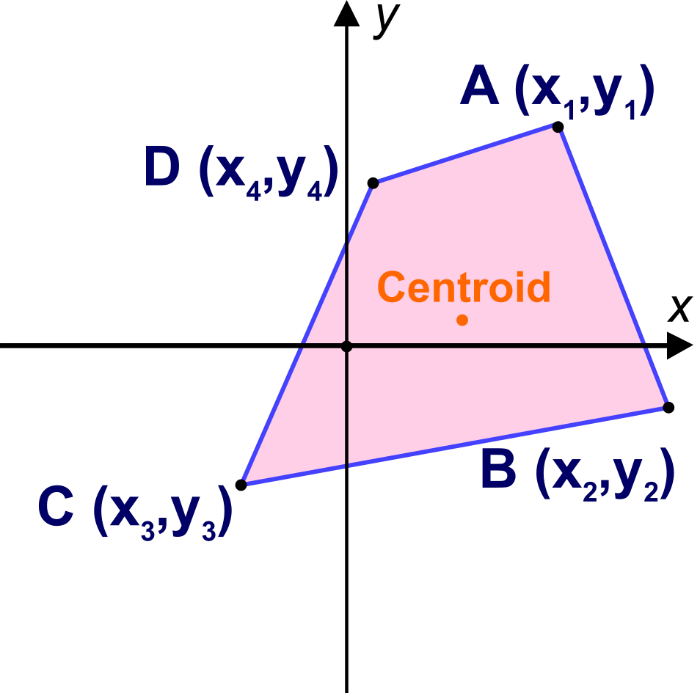
Every object that is definable in a two-dimensional space has a physical center. Whether the object is a regular or irregular polygon in plane geometry, there are various methods for determining its center.
Figure: Tim Burch
These figures are easy to understand and simple to solve. More complex figures require more calculations, including coordinate geometry.
Figure: Tim Burch
These examples of regular and irregular polygons have something in common: all are based upon two-dimensional space, which is flat. But what happens if we need to determine the center of a shape that does not fall on a 2D surface? What if the data being reviewed for a center resides on a spherical surface and contains diverging axes?
As surveyors, we break our work down to smaller coordinate systems to work around the fact that our data resides on a spherical surface, but some datasets require the information to remain as latitude and longitude. One dataset is population counts, otherwise known as the census.
The U.S. Census and the ‘center of population’
The U.S. Census Bureau has been at work since early colonial times. This excerpt from the bureau website explains its purpose and foundation.
The U.S. Constitution requires only that the decennial census be a population count. Since the first census in 1790, however, the need for useful information about the United States’ population and economy became increasingly evident.
The decennial census steadily expanded throughout the nineteenth century. By the turn of the century, the demographic, agricultural, and economic segments of the decennial census collected information on hundreds of topics. The work of processing these data kept the temporary Census Office open for almost all the decades following the 1880 and 1890 censuses.
Recognizing the growing complexity of the decennial census, Congress enacted legislation creating a permanent Census Office within the Department of the Interior on March 6, 1902. On July 1, 1902, the U.S. Census Bureau officially “opened its doors” under the leadership of William Rush Merriam.
Counting the citizens of the United States was one thing, but mapping them was another. Once the final count was completed and mapped, the information was used to determine a unique location: the center of population. Here is more from the Census Bureau on the calculation basis:
The concept of the center of population as used by the U.S. Census Bureau is that of a balance point. The center of population is the point at which an imaginary, weightless, rigid, and flat (no elevation effects) surface representation of the 50 states (or 48 conterminous states for calculations made prior to 1960) and the District of Columbia would balance if weights of identical size were placed on it so that each weight represented the location of one person.
More specifically, this calculation is called the mean center of population.
This sounds like an easy exercise for a room of mathematicians and mappers, right? On the contrary, my fellow geospatialists!
How do they determine the center of population?
Computing the center of population for the United States would be much easier if we existed on a two-dimensional plane, as previously discussed. Since we don’t, however, it requires a much more difficult method of calculation to get us closer to a real-world solution:
To avoid unduly complex factors in the computations, the mathematical formulae used were those that would be precise for a true sphere. On such a sphere, the north-south distances between parallels of latitude are identical and distances in degrees may be used as units of distance. On the other hand, distances between meridians on longitude lines are not constant but decrease from the equator toward the poles. However, if the length of one degree along the equator is used as the unit of measurement, then the length in degrees of an east-west line at any other latitude can be adjusted to the measurement standard by multiplying by the cosine of the latitude.
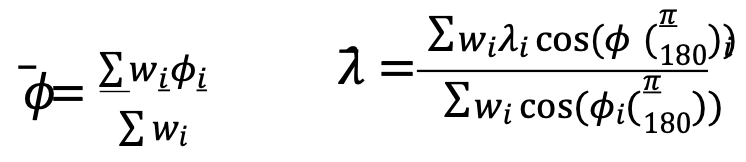
The center of population computed by the Census Bureau is the point whose latitude (𝜙) and longitude (λ) satisfy the equations:
where 𝜙𝑖, 𝜆𝑖 and 𝑤𝑖 are the latitude, longitude and population attached to the basic small units of area used in the computation.
Stated in less mathematical form, the latitude of the center of population was determined by multiplying the population of each unit of area by the latitude of its population center, then adding all these products and dividing this total by the total population of the United States. The result is the latitude of the population center.
East-west distances were measured, or computed, in substantially the same manner, but with the inclusion of a correction for latitude. For these distances, a degree of longitude at the equator was the unit of measurement. East-west distances along the equator could be measured in degrees, but any east-west degree distance north of the equator — where all the United States is located — had to be adjusted to recognize the convergence of meridians toward the poles. This adjustment required that each east-west distance, stated in degrees of longitude, be multiplied by the cosine of the latitude. This mathematical relationship is precise for a sphere and a very close approximation for the earth.
The computation required that the longitude of each of the thousands of selected points be multiplied by the cosine of the latitude of the point and by the population associated with the point. These products were added and divided by the sum of the products for the same thousands of points, each of which was obtained by multiplying the cosine of the latitude of a point by the appropriate population figure. The result was the longitude of the center of population.
(Courtesy of the Geography Division, U.S. Census Bureau, published November 2021)
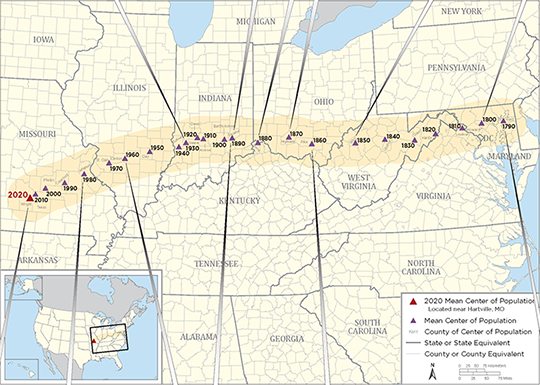
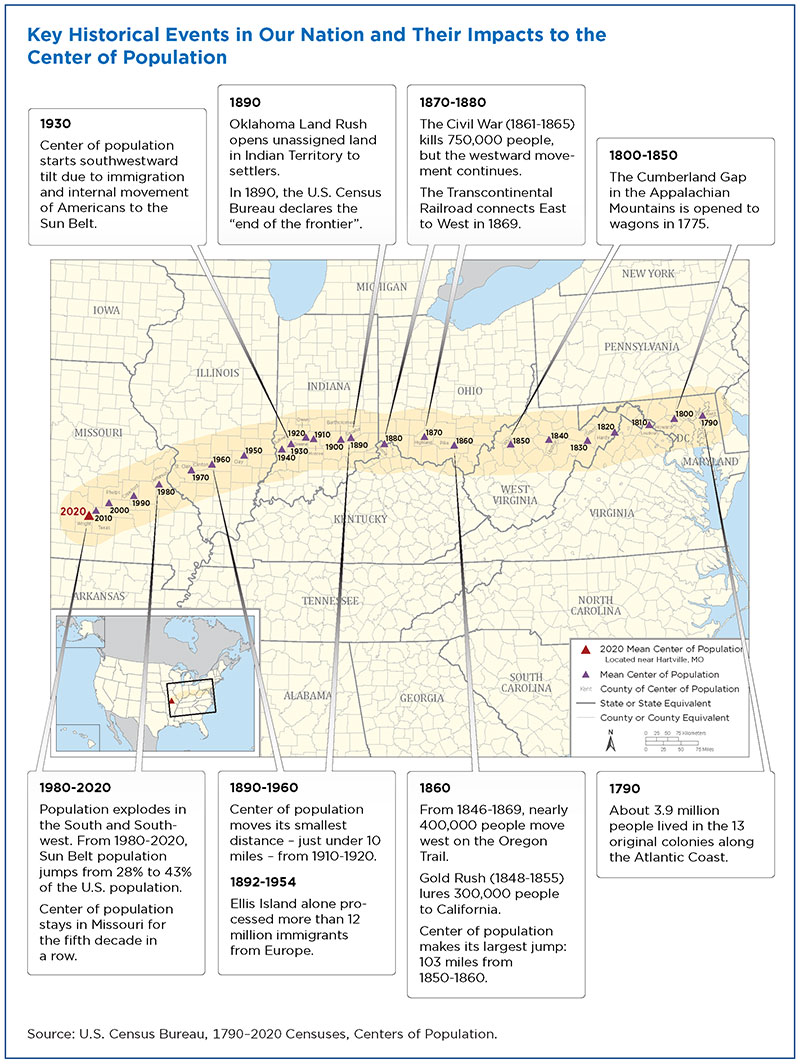
Here is a graphic from the U.S. Census identifying significant historical events along with the westward movement of the center of population:
Image: U.S. Census Bureau
Here are the locations with corresponding latitude/longitude for the centers from 1790 to 2020:
Mean Center of Population of the United States, 1790–2020
Census year
North latitude
West longitude
Approximate location
United States
2020
37.415725
92.346525
Wright County, MO, 14.6 miles northeast of Hartville.
2010
37.517534
92.173096
Texas County, MO, 2.7 miles northeast of Plato.
2000
37.69699
91.80957
Phelps County, MO, 2.8 miles east of Edgar Springs.
1990
37.87222
91.21528
Crawford County, MO, 9.7 miles southeast of Steelville.
1980
38.13694
90.57389
Jefferson County, MO, 1/4 mile west of DeSoto.
1970
38.46306
89.70611
St. Clair County, IL, 5 miles east-southeast of Mascoutah.
1960
38.59944
89.20972
Clinton County, IL, 6-1/2 miles northwest of Centralia.
1950
38.80417
88.36889
Clay County, IL, 3 miles northeast of Louisville.
Conterminous United States
1950
38.83917
88.15917
Richland County, IL, 8 miles north-northwest of Olney.
1940
38.94833
87.37639
Sullivan County, IN, 2 miles southeast by east of Carlisle.
1930
39.06250
87.13500
Greene County, IN, 3 miles northeast of Linton.
1920
39.17250
86.72083
Owen County, IN, 8 miles south-southeast of Spencer.
1910
39.17000
86.53889
Monroe County, IN, in the city of Bloomington.
1900
39.16000
85.81500
Bartholomew County, IN, 6 miles southeast of Columbus.
1890
39.19889
85.54806
Decatur County, IN, 20 miles east of Columbus.
1880
39.06889
84.66111
Boone County, KY, 8 miles west by south of Cincinnati, OH.
1870
39.20000
83.59500
Highland County, OH, 48 miles east by north of Cincinnati.
1860
39.00667
82.81333
Pike County, OH, 20 miles south by east of Chillicothe.
1850
38.98333
81.31667
Wirt County, WV, 23 miles southeast of Parkersburg.
1840
39.03333
80.30000
Upshur County, WV, 16 miles south of Clarksburg. Upshur County was formed from parts of Barbour, Lewis, and Randolph Counties in 1851.
1830
38.96500
79.28167
Grant County, WV, 19 miles west-southwest of Morefield. Grant County was formed from part of Hardy County in 1866.
1820
39.09500
78.55000
Hardy County, WV, 16 miles east of Moorefield.
1810
39.19167
77.62000
Loudoun County, VA, 40 miles northwest by west of Washington, DC.
1800
39.26833
76.94167
Howard County, MD, 18 miles west of Baltimore. Howard County was formed from part of Anne Arundel County in 1851.
1790
39.27500
76.18667
Kent County, MD, 23 miles east of Baltimore.
Data: U.S. Census Bureau
Not to be confused with the geographic center…
The geographic center of area is the point at which the surface of the United States would balance if it were a plane of uniform weight per unit of area. That point, approximately 44.967° north latitude and 103.767° west longitude, is located west of Castle Rock in Butte County, South Dakota, as it has been since Alaska and Hawaii became states.
The geographic center of the conterminous United States (48 states and the District of Columbia) is located near Lebanon in Smith County, Kansas, at approximately 39.833º north latitude and 98.583º west longitude.
The center of population as geospatial data
The plotting of the center of population makes for an interesting study of westward expansion in early U.S. history. Once the contiguous 48 states were founded, plotting the center shifts to regional changes . The truly interesting part of these calculations and plotting for the past several centuries falls into an area of expertise called geospatial data.
While some liberties were taken early on using large, populated areas as one data point, we now can count literally every person and their geospatial location. However, it needs to be recognized that early efforts to count our population and track its center every 10 years meets the criteria for being called geospatial data. They just didn’t yet know what that meant.
Speaking of surveyors…
Here are several events and initiatives happening this month, an important month for surveyors.
2022 National Surveyors Week
National Surveyors Week was established by the National Society of Professional Surveyors as an annual event to bring public recognition to the surveying profession and the vital services surveyors provide to the advancement and betterment of human welfare.
During this week, thousands of professional surveyors throughout the country will take part in local activities designed to introduce a new generation to the profession and highlight the use of technology in their day-to-day work.
Global Surveyors’ Day 2022 will be held Monday, March 21. This annual event is a way to globally recognize groundbreakers, pioneers, individuals and the industry that has shaped our history and continues to be of great value to our communities.
2022 Global Surveyor of the Year
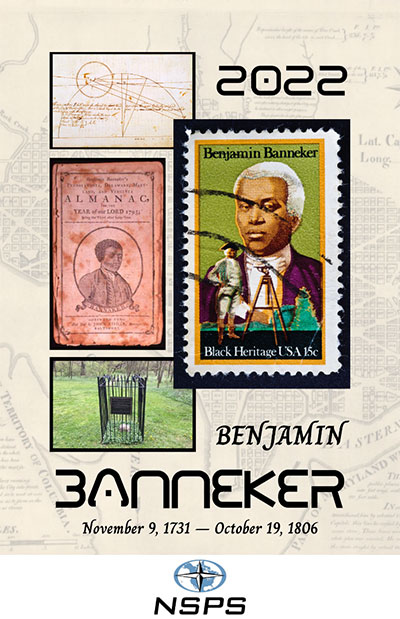
Image: NSPS
As part of the Global Survey Day and National Surveyors Week, every year on March 21 a professional surveying association is tasked with choosing a Global Surveyor of the Year. For 2022, the National Society of Professional Surveyors has been selected to choose a person with a historical surveying background for this prestigious honor. After thorough consideration, NSPS has chosen Benjamin Banneker (1731–1806) for 2022 Global Surveyor of the Year.
The selection was brought before the NSPS Board of Directors during our Spring 2021 meeting and passed by a majority vote. While Banneker’s career as a surveyor was limited in time and experience, his additional contributions to math, science, astronomy and publication of a groundbreaking almanac have earned him a significant place in American history.
We also selected Banneker because of his ability to overcome the adversity of being a free Black man in early colonial America. Through much self-teaching, he was able to excel at the contributions previously listed in a period when Blacks were not accepted for their educational abilities.
The selection committee chose Banneker over the three presidents who are famously chiseled on Mount Rushmore and Henry David Thoreau, an author who also surveyed to fund his writing career. The committee felt that Banneker’s contributions not just to the surveying profession made him deserving of this honor, but considered his total body of work created when Black men were not generally accepted as capable human beings. Our world needs more people like Benjamin Banneker and would be a better place because of them.
No time like the present to promote our geospatial professions
Surveying and geospatial careers are more important than ever, so examples like the center of population help depict applications that us these skills. Please consider promoting our wonderful professions during these events and throughout the year. The profession you promote may provide an opportunity to bring new faces and ideas to our ranks very soon.
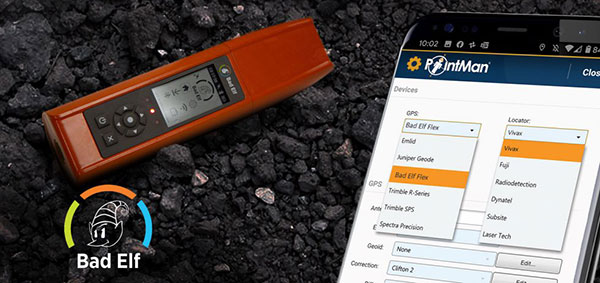
Mapping company ProStar Holdings Inc. and survey device company Bad Elf have partnered to produce a solution designed to gather the precise location of surface and subsurface utility data.
PointMan combined with Bad Elf is designed to quickly and precisely, locate, identify and display critical surface and subsurface utility data.
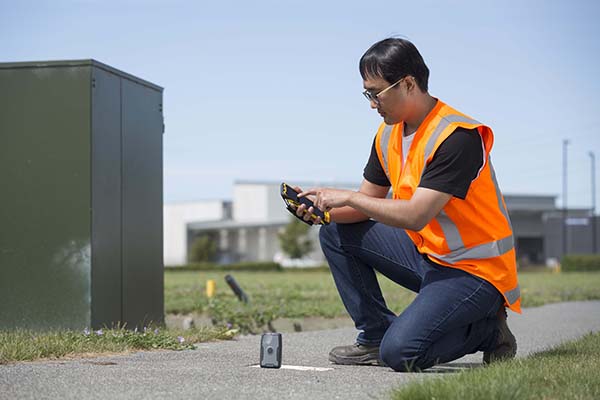
Bad Elf’s survey-grade GPS/GNSS receiver combined with ProStar’s flagship mobile-mapping solution, PointMan, now provides a powerful and user friendly solution for any industry requiring precision mapping including subsurface utility engineering (SUE) and utility locating professionals.
“The Bad Elf Flex was quickly configured by ProStar and performed flawlessly with the PointMan app. We found that consistent high accuracy was easy to maintain while collecting data,” said Larry Fox, vice president of marketing and business development at Bad Elf. “The depth of collection tools and export facilities exceeded our expectations. Given the seamless integration with Bad Elf Flex, PointMan demonstrated it’s a top-tier app for utility management, and expands our ability to provide best in class solutions to our users worldwide.”
“Equipment manufacturers like Bad Elf and their distribution networks are an important component of our sales and marketing strategy,” said Page Tucker, CEO and founder of ProStar. “Our goal is to continue to work with leading equipment manufacturers around the world to provide the most comprehensive, modern, and low-cost data collection solutions.”
ProStar’s flagship product, PointMan, is natively cloud and mobile, offered as a Software as a Solution (SaaS). ProStar’s solutions are being adopted by some of the largest entities in North America, including Fortune 500 construction firms, the largest subsurface utilities engineering (SUE) firms, and government agencies.
ProStar’s strategic partnerships are with geospatial technology and data-collection equipment manufactures and their dealer networks, including Trimble, Juniper Systems, Vivax-Metrotech, Radiodetection, Bad Elf and Subsite Electronics.
Helping the guard: For the Kentucky Air National Guard, Sibole surveyed for paint lines on the taxiway for C-130 aircraft. (Photo: Matt Sibole)
Like Adam Plumley, Matt Sibole is also a solo surveyor and a Javad GNSS advocate. Based in Kentucky, Sibole tackles up to 140 jobs a year, which he would be unable to do using only a total station or a robotic station. Instead, he relies on the accuracy of GNSS.
He particularly relies on J-Field, the Javad GNSS data-collection software. When using the software’s “Boundary Profile” feature, he can get a fix, then re-initialize and get another fix that he can then compare in real time to the previous fix.
“J-Field keeps all fixes in memory to compare to each other, until you get a group of fixes that agree with each other to verify which fix is the correct fix,” Sibole explained. “We all know that a fix is not necessarily the ‘right’ fix. Javad’s J-Field program will give the user the confidence to know in real time that the shot is correct.”
“J-Field also has a relative accuracy calculator built in to verify that I meet minimum standards in the field before I leave the site,” Sibole said.
TDC’s Freeance field applications leverages Trimble GNSS for accurate, streamlined data collection
TDC Group has joined Trimble’s GIS (geographic information system) Business Partner Program. As part of the program, TDC has implemented the Trimble Precision SDK (software developer kit) to integrate high-accuracy positioning capabilities in its Freeance mobile software applications running on tablets and smartphones using Trimble GNSS receivers.
Freeance provides field crews with simple yet powerful and configurable location-based mobile apps to manage data collection and inspection activities across utility and public works organizations. By adding the Trimble R1 and R2 receivers to Freeance workflows, users are empowered with real-time access to high-quality, reliable data.
The Trimble R1 receiver will be accessible with TDC’s Freeance software. (Photo: Trimble)
“Trimble recognizes the value our GIS software partners bring to our customers by delivering targeted, industry-specific solutions,” said Stephanie Michaud, strategic marketing manager, Trimble Survey & Mapping Field Solutions. “We’re very pleased to collaborate with TDC and leverage their domain expertise, and to integrate Trimble technology into the Freeance solution for the utilities and public works markets. As a direct result of this relationship, Freeance users can now work with the confidence of knowing their field workflows are precision-enabled with Trimble GIS technology.”
“We’re excited about the integration of high-accuracy Trimble GNSS receivers with Freeance software that enables organizations to add sub-meter or better accuracy to mobile workflow activities using smartphones and tablets,” said Matthew Reddington, CEO of TDC Group. “Adding high-accuracy positioning to field workflows by means of simple mobile apps paired with Trimble GNSS increases the quality and uses of data captured during field operations.”
The scale and speed of the COVID-19 crisis has left policymakers searching for new tools to address an unprecedented challenge. Everything from faster testing to new treatments to more supplies for frontline providers is needed, and smart deployment of these resources requires an ability to track infections that is not yet available for a problem of the scale of COVID-19.
The recent economic stimulus package passed by Congress — the Coronavirus Aid, Relief, and Economic Security Act (“CARES Act”) – looks to fund this kind of tracking. Among its many priorities, the CARES Act appropriates half a billion dollars to the Centers for Disease Control and Prevention (CDC) for modernization of its public health data surveillance capabilities, and specifically directs the CDC to report to Congress on the development of a “public health surveillance and data collection system for coronavirus within 30 days.”
The legislation does not give much in the way of additional direction to the CDC, meaning that the CDC is likely to think expansively and look for proven models in other highly developed public health systems.
Disease surveillance efforts around the world have taken a variety of approaches, in many cases informed by experience in battling prior pandemics. Public health systems in places such as South Korea, Singapore and China were built on the lessons of the outbreak of Severe Acute Respiratory Syndrome (SARS) and similar conditions over the past several years.
Location-based tracking using GPS provides greater insight and precision than, for example, asking an infected patient to remember and re-trace his or her steps.
Among many other elements, these systems frequently employ GPS-enabled smartphone apps both to gather information and to target alerts to local populations. Location-based tracking using GPS provides greater insight and precision than, for example, asking an infected patient to remember and re-trace his or her steps.
As discussions of similar solutions have begun in the United States, privacy advocates have rightly pointed out the risks inherent in systems that necessarily gather and communicate health information and pair that information with location-based information provided by GPS. But both legally and practically, there need not be an exclusive choice between health information privacy and using GPS and other technology to gather and provide information about COVID-19.
On the legal front, HIPAA broadly exempts disclosures of protected health information for public health activities, allowing disclosures to public health authorities without first obtaining patient consent. Similarly, HIPAA permits data to be de-identified — subject to recognized standards laid out in regulations and guidance — and thereafter shared and used for research purposes, including public health research and similar purposes.
Legal avenues certainly exist to permit significant information sharing about COVID-19 in order to help protect public health.
Furthermore, federal authorities tasked with enforcing HIPAA have already signaled in guidance that they will take a flexible approach to enforcement in order to meet the exigencies of the crisis. Thus, while it is true that HIPAA has not been applied directly to a public health emergency on the scale of COVID-19, legal avenues certainly exist to permit significant information sharing about COVID-19 in order to help protect public health.
On the practical front, HIPAA also points the way to sensible decision-making that balances privacy interests with the needs of the crisis. First, de-identification provides a significant opportunity to share data in a way that is protective of privacy. Second, we should not assume that widespread participation — both in information gathering and information dissemination — must be involuntary in order to be widely adopted.
Smartphones users can — and should — be given a choice before enabling tracking features on their devices, just as they can and should be informed in a transparent way about what data would and would not be shared. HIPAA establishes a “minimum necessary” standard that should provide the guiding principle here: no more information should be shared than is necessary to accomplish the intended objective.
As we search quickly for tools to enable the kind of tracking that we have not undertaken before, we should be careful not to construct a false dilemma between privacy and efficacy — the two go hand in hand. Strong and transparent privacy protections are both possible and necessary to secure the public buy-in that is necessary to make public health surveillance work.
Jeremy Meisinger is a Boston-based attorney at Foley Hoag LLP.