Proper management of large volumes of fluid has become a necessity as hydraulic fracturing has increased throughout North America. Creating the most effective fluid handling solution involves environmental, cost and project timeline considerations.
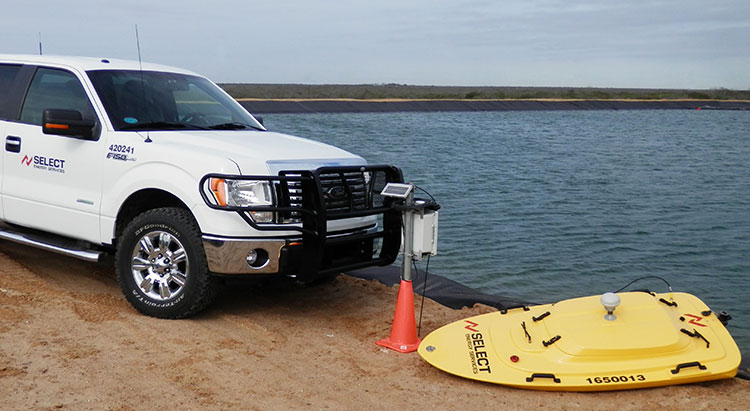
Select Energy Services, LLC, has launched AquaView, a suite of services that efficiently monitor water at various stages of the project through real-time, wireless technology. AquaView’s instant monitoring capabilities allow Select to respond immediately to on-site issues before emergencies arise.
AquaView capabilities include pit and reservoir hydrographic surveys utilizing SONAR remote control and GPS real-time data; data delivered to a secure portal offering current and historical data; real-time water quality reporting; and mapping and geographic information systems (GIS) support. The system can transmit the data with enabled access through computers, smartphones, tablets and text messages.
“This new technology is changing the way our industry does business,” said John Schmitz, Select Energy Services CEO. “AquaView will reduce down time and assist in the maintenance of completion schedules, essentially removing the need for traditional water tracking and measurement systems.”
Select’s team is capable of water transfer, containment assembly, water fill and complete removal or disposal.
Photo: TrimbleTrimble has introduced the Trimble MX2 mobile spatial imaging data capture system. The MX2 extends the capabilities of geospatial professionals, allowing them to safely and effectively address complex projects by collecting spatial data from a mobile scanning platform, the company said. The Trimble MX2 provides a versatile and complimentary addition to Trimble’s family of mobile data capture systems.
Designed for mapping, surveying and engineering environments, the MX2 is rugged, lightweight and portable. It is also easily deployed and redeployed on projects similar to conventional surveying equipment. A precise laser scanner, along with an embedded Trimble-Applanix GNSS/Inertial positioning system, allows geospatial professionals to create the point cloud accuracies necessary for many spatial imaging projects. Accompanied by Trimble Trident software to capture, process and analyze point data, the MX2 offers a ready-to-use workflow for surveyors and professionals in mapping, engineering, planning, oil and gas, utilities, mining, environmental, public safety and more. The system is available in single and dual-laser versions.
In conjunction with the MX2 system, Trimble also announced new features for its Trident Software 6.0. The software developed for rapid transformation of point clouds and imagery into geospatial intelligence has been significantly enhanced to provide a scalable software suite for a wide range of users. Additions include the incorporation of direct trajectory import and the Trimble Coordinate System Manager. The Trimble Trident software suite is ideal for the analysis of mobile laser scanner data and geo-referenced imagery.
“The Trimble MX2 provides survey companies with the opportunity to enter the world of mobile scanning at a time when it is becoming a desired service within their solution portfolios,” said Katherine Sandford, general manager of Trimble’s Imaging Division. “The MX2 offers a simple and highly productive mobile data collection capability and a 3D point cloud workflow for a wide range of users.”
The Sierra Club announced that the California Supreme Court ruled in a unanimous decision that geographic information systems (GIS) data must be provided to the public for a nominal fee under the Public Records Act. The decision has broad application, confirming that information not exempt from disclosure under the Act must be provided to the public for a nominal charge, regardless of whether it is kept in paper form or as electronic data. The Court also affirmed the public’s civil right under the California Constitution of access to government information, holding that it can be used as a tiebreaker in case such as this, where the public right of access is disputed.
According to the announcement, the case started in 2007, when the Sierra Club requested from Orange County a copy of its GIS parcel database, containing the location and layout of each legal parcel of land in the county. At that time, Orange County licensed copies of the parcel database to private companies and public agencies for $375,000. The county also required licensees to sign non-disclosure agreements preventing further distribution. The county supported its GIS operation in part with licensing revenues from the sale of parcel data and argued that this revenue stream would dry up if the county was required to provide copies of the data to the public for a nominal fee under the Public Records Act.
The Sierra Club sued in 2009. Orange County argued that the parcel database is “computer software,” as that term is used in the Public Records Act, because it is part of a “computer mapping system.” Under the Act, software is not a public record, and software includes “computer mapping systems.” The Orange County Superior Court agreed with Orange County, denying the Sierra Club’s request to compel the county to provide the parcel database under the Act. The Sierra Club appealed and lost on appeal in the Fourth District Court of Appeal, in Santa Ana, Orange County, California.
In September, 2011, the California Supreme Court agreed to review the case. Amici curiae filed briefs on behalf of the Sierra Club, including the Media and Open Government coalition, representing newspapers such as the Los Angeles Times and the Orange County Register, a coalition of companies that provide value-added services based on electronic public records, the Stanford Environmental Law Clinic, the Electronic Frontier Foundation, a group of academic researchers at UCLA, Jack Cohen, and a coalition of GIS professionals.
Attorney Sabrina Venskus, the Sierra Club’s lead counsel, argued the case in the California Supreme Court in early May. Today, the Court ruled that the lower courts got it wrong. The Court’s seven justices decided unanimously in favor of the Sierra Club, ordering that the County be compelled to provide the Sierra Club with a copy of its parcel database for the cost of producing the physical copy. Orange County will now join the other 49 out of 58 California counties that provide their parcel data to the public for a nominal charge.
The Sierra Club reported that the Angeles Chapter’s GIS Committee will use the data to make maps for its conservation campaigns. GIS Parcel data previously obtained from Los Angeles County under the Public Records Act was used to map land parcels in the Verdugo Mountains in the cities of Los Angeles, Glendale and Burbank, color-coding each parcel as to whether it was publicly or privately owned. This allowed a task force including the Sierra Club and agencies from the three cities to prioritize the acquisition of open space in the Verdugos. The club continually produces GIS maps in support of its conservation campaigns, and will put the Orange County data to good use in fighting for the environment.
The Supreme Court decision focused on GIS parcel data, but its holding applies to all types of computer mapping data. GIS data is becoming increasingly important as state and local agencies continue to incorporate it into their operations. Some agencies have requirements that all street addresses in their databases be geocoded, i.e. converted into latitude and longitude, i.e. GIS data. Applications go beyond purely environmental issues. For example, public health agencies use computer mapping technology to track the spread of infectious diseases. Following today’s decision, all this information will be available to the public, who can use it for their own purposes, at a nominal charge.
Attorney Sabrina Venskus stated: “This is great day for California’s citizens: the public will now have appropriate access to important government mapping data – government records which are only used and useful in electronic format – and taxpayers won’t be required to pay for data they already effectively paid for with their tax dollars when the County compiled and organized those records in the first instance.”
Though the information at issue in the case was GIS data, the decision affirms a previous Supreme Court holding that electronic databases are subject to the Public Records Act disclosure requirements when they contain data that’s not exempt under the Act. This is important because agencies increasingly keep their records in databases. “The move from paper to electronic recordkeeping shouldn’t affect the public’s right to the information,” says Dean Wallraff, another lawyer representing the Sierra Club in the case.
Ms. Venskus added: “It is extraordinarily gratifying that the Supreme Court ruled unanimously in favor of my client after having litigated this case for almost five years and suffering through two losses in the lower courts. Yet Mr. Wallraff and I felt so strongly about the public having access to this important information, and that Orange County was in violation of the law, we forged ahead despite the fact we took this case on contingency and ran the risk of working thousands of hours with no compensation. Everyone’s hard work, including amici curiae’s has been vindicated on this day.”
“In an ever-changing environment, it would be ideal if the U.S Geological Survey had a presence in every corner of the nation. While we may not be able to cover every inch of the landscape, we can greatly enhance our scope with your help,” the USGS continues.
The USGS has a variety of citizen science efforts where people can report what’s happening in their own backyards. It’s seeking information on events such as earthquakes, landslides, new construction, and climate. “If you live in Alaska, we want you to tell us if you experience a volcanic ash fall and even collect a sample,” the USGS said.
The information gets aggregated and disseminated through a variety of tools geared toward making this information easily accessible so it can be put to use. Using , there are interactive online systems where people can report what it was like during an earthquake, and then see all the reports for that event mapped out for the affected area.
“Through your contribution, not only will your observations build a much larger and more complete database, but you will also become a virtual member of the USGS scientific team!” the USGS said.
Map of tweets containing the word “terremoto” (Italian for “earthquake”) collected in the two minutes following a magnitude 6.0 earthquake in Northern Italy on May 5, 2012. The red star shows the location of the earthquake. The tweets are concentrated in the epicentral area but discussion of the earthquake has already spread beyond the impacted region. This shows the speed that USGS Tweet Earthquake Dispatch (TED) collects tweets to provide insight into potential earthquake events. Image Credit: USGS.
The valuable role of crowd-sourcing data is outlined in a 2013 report by the Woodrow Wilson International Center for Scholars, authored in collaboration with the USGS. The report highlights success stories from the USGS’ Tweet Earthquake Dispatch (@USGSted) program, Did You Feel It? and related USGS activities. For example, although there was an exceedingly swift international aid response to the massive 2008 earthquake in Wenchuan, China, the first reports of the event outside of the impacted area came from citizens, and information spread through the use of social networking tools such as Twitter. Similarly, 148,000 individuals used Did You Feel It? to describe their experience of a magnitude 5.8 earthquake that occurred in Virginia on August 23, 2011. Because large-magnitude earthquakes are fairly rare along the East Coast, there were only a handful of seismometers installed nearby to record the event. Thus, much of the preliminary data regarding this earthquake came from the DYFI? system.
These are the ways USGS gathers information from the public:
Improving Earthquake Monitoring
Did You Feel It? (DYFI?) is an online crowd-sourcing system developed by the USGS for the public to provide first-hand accounts of earthquakes they experience. As one of the longest standing and most successful examples of citizen-based science to date, it has garnered more than 2,790,000 total responses since its launch in 1997.
Through this program, users are able to document the shaking level they experienced and find out what was felt elsewhere. Specifically, USGS scientists aggregate results by zip code (domestically) and by city (globally) to show reported shaking intensity. Those reports also augment shaking data from sensors and are incorporated in ShakeMaps used for emergency response. To document a seismic encounter, visit the DYFI? home page and fill out a brief questionnaire.
Tweeting and Shaking
Many regions around the world have only a scant number of seismometers, complicating the rapid detection and characterization of earthquakes. To enhance earthquake monitoring, Twitter has proven to be an advantageous source for USGS scientists to receive rapid firsthand accounts of potential events.
The USGS Tweet Earthquake Dispatch (TED) program rapidly detects possible earthquakes when a large number of public tweets mention “earthquake” or its equivalent in several languages. These tweet-based detections often come prior to sensor alerts in sparsely instrumented regions. USGS analysts at the National Earthquake Information Center (NEIC) receive these indicators and then turn to more accurate earthquake sensors and instrumental data for confirmation and quantitative assessment. For earthquakes with a magnitude 5.5 or greater, the USGS sends out notifications via the Twitter account @USGSted to people around the world.
Did You See It? Watch Out for Landslides
In an average year, landslides can cost the United States up to $2 billion in damage. Now, scientists at the USGS are asking the public to help track landslides to better understand how to protect lives and property. This is being done through the system, Did You Feel It? This program allows respondents to report detailed accounts of observed landslides, including photographs. To make your contribution, visit the DYSI? webpage and click on the Report a Landslide tab.
Ascending eruption cloud from Redoubt Volcano as viewed to the west from the Kenai Peninsula. Photo Credit: R.J. Clucas, USGS.
Is Ash Falling? Helping Monitor Volcanic Eruptions
This tool will help AVO scientists build a more complete record of the amount, duration, and extent of ash fall. Getting first-hand accounts of ash fall will also help refine computer models of ash cloud movement and interpretation of satellite imagery. Citizens are also encouraged to collect ash samples and send them to AVO. With your help, volcano scientists can greatly expand their sampling of ash deposits.
The National Map Corps
Citizen volunteers are also making significant additions to The National Map (TNM), a web-based geospatial visualization platform. The public is encouraged to collect data on manmade structures such as schools, hospitals, post offices, police stations, and other buildings. The project started in 2012 in Colorado and has expanded to 35 states. A recognition program has also been created where badges can be earned based on the number of data points a volunteer contributes. This effort is through The National Map Corps (TNMCorps) Volunteered Geographic Information project, which partners with organizations such as 4-H and GISCorps.
Observing Nature’s Calendar
As the seasons come and go, temperatures fluctuate, leaves emerge and change colors, and animals migrate. The USA National Phenology Network gives you this opportunity through its program Nature’s Notebook. Volunteers are collecting observations of these seasonal changes—referred to as phenology—to help scientists better understand subjects including climate change, invasive species, agricultural production, impacts of frosts and freezes, and the timing of pests and diseases.
SAP AG today announced it has joined forces with Esri to more deeply integrate Esri’s geographic information system (GIS) solutions with platforms and enterprise applications from SAP. The move is expected to improve business efficiency and decision-making for SAP customers. The announcement was made at the 2013 Esri International User Conference, being held July 8-12 in San Diego.
enrich SAP Business Suite applications with geographic content.
rapidly process spatial, location and enterprise data using SAP HANA in real time.
visualize geographic information in maps, graphs and charts using tools from the SAP BusinessObjects portfolio.
deliver applications to field workers that effectively process geospatial and business data using SAP Mobile Platform.
“SAP plans to provide real-time high-performance processing of spatial data with SAP HANA, a single platform for transactions, analytics and big data,” said Steve Lucas, executive vice president and general manager, Analytics, Database and Platform, SAP. “By integrating with the Esri ArcGIS platform across SAP HANA, SAP BusinessObjects BI platform and SAP Mobile Platform, and by enriching SAP Business Suite applications with spatial content, we want to enable customers to combine the added dimension of location information with enterprise data, in real time. This will give businesses a new level of immediacy in their decision-making capabilities and will increase their competitive advantage.”
SAP plans to expand the SAP HANA platform with the introduction of spatial data processing capabilities that combine location data with enterprise data to enrich and enhance real-time business applications. Furthermore, Esri and SAP intend to optimize connectivity between Esri ArcGIS and SAP HANA via Query Layers, which will allow Esri ArcGIS users to push spatial processing into SAP HANA, unleashing high-performing and real-time capabilities.
SAP plans to enable customers and independent software vendors (ISVs) to consume, process and analyze spatial, transactional and text data within one unified platform for predictive, location-based solutions based on big data. In addition, the company intends to offer SAP HANA customers a native application development platform, including geo-content and location services, to quickly develop and deploy spatially-based solutions. SAP HANA is an open platform allowing BI tools, as well as customer, partner and SAP applications, to leverage the breadth and depth of real-time, spatial processing capabilities.
The SAP BusinessObjects BI suite and SAP applications share a common HTML5 visualization platform and software development kit (SDK). The SDK is planned to enable organizations to extend their visualizations with 50 pre-built chart types, geographic maps and advanced visualizations. SAP is enhancing the SDK to include the Esri API for Javascript. SAP aims to help customers leverage existing Esri ArcGIS server and licensed online Esri maps inside BI tools from the SAP BusinessObjects portfolio. SAP Lumira™ software is planned to be the first SAP product to offer the embedded Esri API.
SAP plans to add new integration using the SDK for SAP Mobile Platform to extend companies’ geospatial data from ESRI ArcGIS systems to mobile field employees. Similar to desktop systems, SAP Mobile Platform is planned to enable application users to manipulate interactive maps and to obtain extremely detailed information on the geographic region in question. By tying into SAP Business Suite, mobile apps like SAP Work Manager and SAP CRM Service Manager are intended to effectively combine business process information like work orders, parts inventory levels and historical asset information with geospatial data to give mobile users an extremely rich, multi-system work environment. For instance, SAP plans to enable mobile users to efficiently find jobs and assets nearby, filter for equipment by location and view work orders from a map. Such use cases can serve to completely eliminate paper data entry and the hunt for the right information.
“Esri ArcGIS is the leading platform for organizations implementing a location analytics strategy through the geo-enablement of their enterprise business systems,” said Chris Cappelli, director, Sales, Esri. “By working with SAP to integrate ArcGIS across SAP HANA, analytic solutions and SAP Mobile Platform, intends that customers can easily leverage Esri within their SAP landscape.”
LizardTech, a provider of software solutions for managing and distributing geospatial content, announced the launch of GeoExpress9 at this week’s Esri International User Conference in San Diego, California, where the company is also a Platinum Imagery Sponsor and exhibitor in booth number 1704.
GeoExpress enables geospatial professionals to compress and manipulate satellite and aerial imagery and the latest version features a significant performance improvement from previous versions, LizardTech said. The latest version is four times faster than before with support for spanning multiple jobs across multiple cores. This increase in speed enables users to complete projects faster than ever before within the application.
This release also introduces Intelligent Encoding, with the software automatically reconfiguring itself for optimal performance. GeoExpress 9 automatically chooses to Encode, Optimize or Update based on the encoding operations that the user chooses, which results in high performance with minimal training, LizardTech said.
In addition, Jon Skiffington, LizardTech’s director of product management, will introduce GeoExpress 9 to the Esri attendees by giving a Demo Theater presentation titled “LizardTech – What’s New with MrSID and GeoExpress” on Wednesday, 1:30 p.m. – 2:30 p.m. at the Imagery Island Exhibit in Exhibit Hall C.
“This is going to be an exciting week for LizardTech,” said Skiffington. “We’re launching the latest version of our flagship product, GeoExpress with its new features, faster performance and updated user interface. We look forward to showing our customers the new features and receiving feedback from our users and partners.”
LizardTech will also host product demonstrations in its booth to showcase the new features of GeoExpress 9. These presentations will be held on Tuesday and Wednesday at 10 a.m., 1 p.m. and 3 p.m., with a final presentation held on Thursday at 10 a.m. Product demonstrations of Express Server software for high-performance delivery and publication and LiDAR Compressor software, which turns giant point cloud datasets into efficient MrSID files will also be available.
DigitalGlobe announced that ArcGIS Online users will now have access to DigitalGlobe’s Premium Services. Revealed today at the plenary address during the Esri User Conference, the new offering brings expanded geospatial products and solutions to select users of ArcGIS Online on a subscription basis.
According to the announcement, DigitalGlobe’s Global Basemap, FirstLook, and Multispectral Premium Services can now be seamlessly integrated into the workflow of ArcGIS users, allowing them to access the most current imagery and information available directly from the source!
“Accessing high resolution imagery with ArcGIS has taken a giant leap forward,” said Lawrie Jordan, Esri director of imagery. “The new DigitalGlobe Premium Services enable everyone to benefit from quick and easy access to one of the best collections of high resolution imagery through ArcGIS Online.”
“The Premium Services partnership will serve as the next era in the expansion of our relationship with Esri,” said Bert Turner, senior vice president, sales at DigitalGlobe. “We’re excited to work with Esri, the GIS market leader, to bring users of ArcGIS Online some of the most advanced imagery services available today.”
The Global Basemap Premium Service provides some of the best available natural color and panchromatic imagery. This imagery is available as a cached tile service with vast coverage of the U.S. and Canada. This service will be regularly updated to reflect new, high quality imagery from DigitalGlobe.
The FirstLook Premium Service is a disaster and crisis monitoring service populated with imagery when a qualifying event occurs, such as a natural disaster, manmade crisis, political instability, or human interest occurrence. Through this service, users have access to near real-time post-event imagery as well as pre-event imagery for comparison.
The Multispectral Premium Service offers access to rich, full resolution multispectral content through an ArcGIS Online interface running on a highly scalable cloud architecture. The service and the content it hosts can be tailored to the client’s specific project needs. Users who require highly detailed imagery for image analytics, geodatabase updates, and surface change analysis can work with DigitalGlobe experts to maximize the value of the subscription.
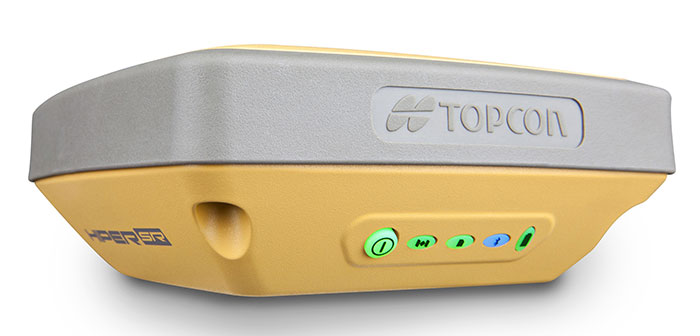
The HiPer SR for GIS is a compact, integrated GNSS receiver with sub-meter accuracy. Additional, scalable options are available via OAF (Options Authorization File) upgrades, delivering accuracy levels of sub-decimeter and centimeter without the need for additional hardware, Topcon said.
The HiPer SR for GIS can be paired with a Topcon controller and eGIS software, or used with Topcon’s eGPS utility software to use with a third-party device and application such as ArcPad or ArcGIS mobile running on a Windows tablet or mobile device.
“The HiPer SR for GIS brings the very finest in Topcon GNSS technology into a compact and rugged housing,” Jason Hooten, TPS sales manager for GIS, said. “Superior tracking and positioning is provided by the HiPer SR’s Vanguard receiver technology with advanced Fence Antenna.”
“GIS field work is changing as more field workers are using various types of collection devices like smartphones, tablets, and laptops in addition to the traditional data collectors. Unfortunately, the GPS in these devices are not accurate enough for locating buried assets or doing initial inventory collection. The HiPer SR provides this accuracy regardless of job site demands,” Hooten said.
Photo: Topcon Positioning Systems
“The new HiPer SR is an adaptable device that can be used to locate utilities within an inch one day and the next provide sub-meter accuracy for an environmental study. This device provides accurate positioning to different applications as needed. The HiPer SR is small in size, but giant in performance and flexibility.”
Geospatial Solutions Editor Eric Gakstatter, who is also a contributing editor to GPS World magazine, will be attending the 2013 Esri Survey Summit and Esri International User Conference, providing continuous new and analysis for the duration of both conferences. The conferences are being held this week in San Diego, California.
On Tuesday at 1:30 p.m. in Room 24A of the San Diego Convention Center, Gakstatter will deliver a presentation entitled “High-Precision GPS/GNSS on your Smartphone, Handheld and Tablet,” discussing trends and new product innovations for sub-meter and centimeter mapping on smartphone, handheld and tablet devices, including Windows Mobile, Android and iOS (Apple) devices.
Steve Copley, GPS World and Geospatial Solutions associate publisher, shared images of the event on his Twitter account. A few of them are below.
HERE, a Nokia business, announced that it is bringing its real-time traffic information to Esri, a market leader in Geographic Information System (GIS) mapping software used by enterprise and government fleet management companies around the world. With HERE Traffic, Esri will enhance its web and cloud location platform with more precise location data for intelligent routing. Fleet operators will be able to better manage problems as they occur in real time, re-routing fleets when traffic unexpectedly hits, and providing alerts when pickup or delivery delays occur.
With congestion in the top 100 highway bottlenecks getting worse, real time traffic information helps fleets avoid traffic hotspots so that they get can get to their destinations faster and more safely.
“For 10 years, Esri and HERE have had the shared goal of enhancing safety and increasing the efficiency of fleet operations by offering the most accurate transportation information on more roads than any other provider across the world,” said Chris Cappelli, Director of Sales at Esri. “Launching real-time traffic from HERE on Esri’s platform for our ArcGIS Online and ArcGIS for Transportation Analytics software products will offer a deeper level of logistic and analytic capabilities for enterprise and government fleet companies.”
According to the announcement, real-time traffic is one of the services that HERE delivers based on the data it gathers from a wealth of sources including, the world’s largest compilation of both commercial and consumer probe data, the world’s largest fixed proprietary sensor network, event-based data collected from government and commercial sources, and billions of historical traffic records.
“Dependable real-time traffic information is crucial to improving fleet operations strategy today and for the long-term,” said Roy Kolstad, Vice President for Mobile, Web and Enterprise in North America at HERE. “Our traffic offering will complement HERE map content, which Esri has been using for a decade. Through this combination of traffic and map content, Esri will be able to offer a richer location-based analytics offering that will help businesses make more informed decisions.”
HERE reports that the freshness of that data enables HERE Traffic to provide a more accurate picture of traffic conditions. HERE currently processes 20 billion real-time GPS probe points a month, with almost half of all the data less than 1 minute old and more than three-quarters less than 5 minutes old.
“Traffic data is the single most important telematics application,” said Roger C. Lanctot, Associate Director in the Global Automotive Practice for Strategy Analytics. “Whether for fleets or consumers, traffic data is essential to determining the fastest or most efficient route and HERE’s expanding relationships on the enterprise side are significant. Traffic information is core to maximizing uptime and essential for alternative fuel vehicles such as EVs.”
Geospatial Solutions Editor Eric Gakstatter, who is also a contributing editor to GPS World magazine, will be attending the 2013 Esri Survey Summit and Esri International User Conference, providing continuous new and analysis for the duration of both conferences. The conferences are being held this week in San Diego, California.
On Tuesday at 1:30 p.m. in Room 24A of the San Diego Convention Center, Gakstatter will deliver a presentation entitled “High-Precision GPS/GNSS on your Smartphone, Handheld and Tablet,” discussing trends and new product innovations for sub-meter and centimeter mapping on smartphone, handheld and tablet devices, including Windows Mobile, Android and iOS (Apple) devices.
Steve Copley, GPS World and Geospatial Solutions associate publisher and account executive, shared images of the event on his Twitter account. Here are a few of them:
![Trimble-MX2-Spatial-Imaging-System[1].jpg Photo: Trimble](https://stage.globalpositioningnews.com/wp-content/uploads/2013/07/Trimble-MX2-Spatial-Imaging-System1.jpg.jpg)