Check out the KlearView360° system collecting inspection information. (Photo: NCTech)
Korec and NCTech launched KlearView360°, a streamlined, hosted system designed for the identification of assets, defects or changes within images collected by vehicle or backpack.
According to the companies, KlearView360° makes vehicle-mounted asset inspection accessible to local authorities and many others. KlearView360° combines NCTech’s iSTAR Pulsar+ high resolution camera with Korec’s K-Portal cloud-based hosting solution for live progress monitoring.
KlearView360°, which is accessible through a standard web browser, enables work management instructions to be communicated to mobile workers for issue resolution via Korec’s K-Mobile data capture software.
“Historically these types of solutions have been very expensive, but the KlearView360° integration with the iSTAR Pulsar+ means that we can put vehicle mounted inspection into the hands of local authorities, highways engineers and consultants, utilities and many more in an affordable and effective way,” said Richard Gauchwin, business area manager at Korec.
KlearView360° also offers a cost-effective and simple way to add the iSTAR Pulsar’s high resolution 360-degree imagery to existing GIS datasets hosted within ArcGIS or QGIS via K-Portal’s dynamic link, and provides rapid video playback to review driven routes, the companies added.
Concept3D named the winners of its “Most Innovative Map” awards, which recognize higher education institutions for unique applications of the Concept3D platform.
The five award categories included Best Data Feed Integration, Best Campus Safety Initiative, Best Admissions Integration, Most Digitally Accessible Campus Map and Best Interior Mapping. In addition, honorable mentions were given for the Best Virtual Tour, Best Green Initiative, Most Prepared Initiative and Best Use of Webcams.
Here are the award winners:
• Penn State University won the Best Data Feed Integration Award for its interactive campus maps for the main University Park campus and 21 of the Commonwealth Campuses.
• Boise State University won the Best Campus Safety Initiative Award for its commitment to safety and security with the integration of a new toggle-on Night Map feature, a 3D map overlay that makes it easy for students, staff and visitors to find preferred, well-lit night routes, as well as resources including emergency phones.
• Occidental College won the Best Admissions Implementation Award for integrating a new feature — the “Locate Your Admissions Counselor” option — to the platform to help students around the country find the right point of contact for the Los Angeles-based campus.
• Texas A&M University won the Most Digitally Accessible Campus Map award for integrating a new wheelchair accessible wayfinding feature into its interactive campus map, which helps identify the most efficient and easiest routes for those using a wheelchair.
• Finally, the University of Colorado, Boulder won the Best Interior Mapping Award for adding a new feature that gives map users the ability to view the building interiors, floor by floor.
In addition, the University of Texas, Arlington received a Best Virtual Tour honorable mention; Skidmore University received a Best Green Initiative honorable mention; the University of Denver received a Most Prepared Initiative honorable mention and Michigan Tech University received a Best Use of Webcams honorable mention.
“It was quite a challenge to pare it down to the final award winners because there are so many unique applications happening in the higher education space, where interactive campus maps can be used for a wide variety of uses and by different departments,” said Gordon Boyes, CEO of Concept3D. “It’s really exciting to see how the higher education professionals are able to use the technology to serve their communities and to note how the awards reflect higher education trends that we’re seeing across the board, from greater digital accessibility to IoT.”
Our nation’s sewers are under critical examination now more than any other time in history. The act of collecting sewage and stormwater, transporting it to the treatment system, and processing waste is no doubt a feat of science and engineering that we take for granted in the developed world.
Sewer infrastructure is a critical public asset whose importance in modern life cannot be overestimated, and to keep things running properly takes round-the-clock maintenance and operations. It’s only when the system fails or floods that we fully appreciate our dependence on it.
At last count, there are at least 16,000 publicly owned wastewater treatment systems (also called Publicly Owned Treatment Works, or POTWs) in the United States, providing sewer service for more than 245 million people. Additionally, about 860 communities have combined sewer systems (CSS) that serve about 40 million people.
These CSS capture both sewage and stormwater before the combined mixture is treated and either reused, recycled or discharged to the environment. In wet weather events, untreated waste and stormwater can escape capture due to overfilled combined storm sewers, known as combined sewer overflow (CSO). These CSO events can spill sewage into rivers and streams, creating a major source of water pollution across the country.
To make matters even more complicated, the effects of climate change and increased rainfall in some areas have created new challenges to our nation’s sewer infrastructure.
Additionally, federal and state regulations like those for municipal separate storm sewer systems (MS4) that discharge untreated runoff into the environment have added new demands of our publicly owned entities that manage these systems.
A map of the continental U.S. depicting POTWs, from the EPA Facility Registry Service’s Wastewater Treatment Plants Dataset. (Image: CivicMapper)
The impact of sewer overflow is especially felt in the eastern United States where the combination of aging infrastructure and increasingly frequent and severe rainfall events have presented significant challenges in the capture, handling and treatment of sewage.
With some eastern cities receiving record rainfall in the past few years, it’s now more important than ever to understand our sewer infrastructure, including: where it is, who is responsible for it, when it was installed, how it is networked, and what are its defining characteristics. These data are essential for performing maintenance, for planning growth, and for undertaking new construction projects. The need for better understanding, visualizations, and communication of sewer data assets is a perfect use case for Geographic Information Systems.
The Case for Mapping Sewer Networks
There are many moving parts to a sewer network. Representing each manhole, sewer line, pump station, inlet, and outlet within a unified map requires expertise in the art and science of mapping. Spatial data from a breadth of sources like engineering drawings, as-builts, CAD datasets, spreadsheets, field surveys, sewer cameras, flow meters, and aerial imaging have traditionally been the go-to datasets for constraining the topology, attributes, and capacities of sewer networks. Additionally, new kinds of data procured from emerging geospatially-enabled technologies like subsurface robotic pipe inspections and simultaneous localization and mapping (SLAM) provide a glimpse of where sewer map data will come from in the future. For POTWs and their stakeholders, information from both old and new sources can synergistically come together in a GIS as part of a greater asset management program.
Creating a unified map of sewer infrastructure from many data sources requires time and effort to construct proper geospatial data topology, correct directionality, and accurate attributes. These undertakings are greatly supported by the development of data models, workflows, tool sets, metadata, and documentation that will make it easier for workers to maintain sewer data now and in the future. The added bonus of developing these data for use in a GIS is a highly valuable and functional data asset that can be used to inform operational and business processes at every level of the organization.
An organization’s data represents the outcomes of some of the mostly costly investments and operational endeavors undertaken by that entity. When big or important projects are completed, it is the data collected during the work that lives on after staff turnover and retirements. With respect to mapping sewers, many POTWs already have much of the data they need to put into a mapping system, whether it be in a CAD file, on paper, or living in a spreadsheet. GIS liberates these data so that it becomes a living product and enables them to be leveraged in powerful ways and across multiple operational areas.
Implementing a sewer GIS increases the return on investment of data, creates a platform for data sharing across other systems, and sets the stage for innovation and efficiency improvements.
While creating and maintaining a sewer GIS might sound like a big-ticket item, modern mapping tools are making it more cost effective than ever before. Competitively priced software licensing, open-source GIS technologies, cloud computing, and in-browser processing can lower the costs of geospatial application development. Further, establishing geospatial data pipelines and application programming interfaces (APIs) can reduce the time needed to condition data before they are ingested into mapping systems and across multiple software platforms.
Taking sewer GIS to the next level with network tracing
One of the most exciting applications of a sewer GIS is the capability to perform network tracing. These traces can show the locations and direction of wastewater flow from any point within the system and are commonly performed by POTW engineering personnel. The ability to perform a sewer network trace within a GIS is valuable for several reasons.
An example of a network trace map. (Image: CivicMapper)
The trace helps operators and engineers better visualize the contributing sources to main sewers that collect wastewater from the many lateral and branch sewers that service buildings, businesses, and homes. Enabling this capability in a GIS environment makes it more accessible to other personnel, and especially those working on site. Allowing POTW easier access to network tracing through a GIS helps teams across the organization stay informed on what addresses are connected to which sewer mains, facilitating better communication and collaboration on maintenance and expansion projects.
The network trace can operate upstream to locate which buildings might be contributing to problems downstream. From any manhole or service location, the sources of industrial or commercial waste violations or exceedances can be better identified through upstream sewer tracing. The ability to query any point along the sewer network and constrain the sewershed from that point saves time and resources of field personnel when diagnosing problems and finding solutions.
Sewer systems are vital, publicly funded resources yet most people know very little about the way their homes and businesses connect to this system. Inviting the public to view a unified and continuous map that represents their sewer network is a great learning resource and facilitates increased awareness and familiarity with the work of the POTW.
Once such example is the Flush-It web application. This app allows the public to interact with an engaging map that shows the path their flush takes on its way to the treatment facility. The tool was built on open source geospatial technology and uses a unified, topologically correct sewer data set as the backbone of the network trace. Applications like these are also great for educating students on the importance of science and engineering on daily life.
The Flush-It web application, built on a sewer network GIS dataset. (Image: CivicMapper)
The process of building a GIS of networked sewer map from a set of historic and disparate set of data sources might seem daunting for many POTWs, but the benefits of doing so profoundly outweigh the headaches.
This type of mapping system saves time and money in the long run by ensuring that the best and most current data are shared across multiple operational units and opens up new pathways for innovation and outreach.
As cities continue facing the complications of aging infrastructure and a changing climate, there is no better time than the present to modernize sewer data and use this amazing data resource to both protect communities and equip them with the information needed to tackle future challenges.
Emily Constantine Mercurio is the CEO and co-founder of CivicMapper. Emily grew up in Pennsylvania’s coal country, and at a young age became interested in geoscience, maps, and the interplay of nature and human activity. Her career has centered on creating innovative, data-driven, and tangible solutions to support decisions at the intersection of our natural and built environments. She leverages more than 25 years of experience with Earth science data and geospatial technologies for leading the development of CivicMapper’s products and services. Emily has a Ph.D. in Geology and is a licensed professional geologist.
Duncan Guthrie (left) of 1Spatial and Peter Russell of Neueda. (Photo: 1Spatial)
1Spatial has formed a strategic partnership with international technology company Neueda. 1Spatial and Neueda will jointly provide digital solutions that enable customers to transform and improve the way they do business.
1Spatial is a software solutions provider and global expert in managing location and geospatial data.
Neueda provides digital transformation services to customers in the private sector, public sector and capital markets across the globe. Headquartered in Belfast, Neueda has bases in Dublin, London, Malaga and New York.
As a software solutions provider and global experts in managing location and geospatial data, 1Spatial will complement Neueda’s services by provisioning geospatial digital services that support customer transformation and improvement projects.
“We are excited to announce this partnership with Neueda and really look forward to working together with their highly talented specialists,” said Duncan Guthrie, managing director, 1Spatial. “We both have a similar approach with our customers and always ensure we deliver the best solutions to meet their business needs. Through this partnership we look forward to delivering success for our customers and helping them unlock the value of their spatial data.”
“We are delighted to formally partner with 1Spatial and look forward to working with a global leader in geospatial data,” said Peter Russell, managing director, Enterprise Services, Neueda. “Neueda sees data as a key enabler to true digital transformation and geospatial data is certainly a key challenge for many of our customers. We hope this partnership will also allow us to develop joint propositions to break into new markets.”
Phase One Industrial, a provider of medium-format metric cameras and imaging solutions for aerial applications, has signed an agreement with AI-Survey GmbH, a developer of UAS survey packages, services and tailor-made solutions.
Together, the companies’ high-end products are opening up opportunities in drone-based high-accuracy mapping and inspection markets, the companies said.
Under this agreement, AI-Survey will support Phase One Industrial’s iXM range of cameras in the UAV market for high-accuracy mapping and inspection. AI-Survey offers fast and efficient, simple and reliable UAS solutions tailored for geodesists with millimetre imaging results.
“Our cameras exemplify AI-Survey’s mission to optimize, increase efficiency and inspire UAV mapping and inspection missions,”said Dov Kalinski, CEO, Phase One Industrial. “As an industry leader, we are confident that they will help our strategic efforts to evolve the industry through innovative solutions using Phase One Industrial technology.”
“We have developed long-term relationships and collaborations with many global technology partners, like Phase One Industrial,” said Carsten Rudolph, managing director, AI-Survey explains. “As an independent solutions provider, with such a large international network at our disposal, we are free to offer the best possible solutions to meet our customer needs and achieve their required accuracies. With Phase One iXM cameras, we now have the best global sensor for UAV mapping available, we believe.”
URISA’s GIS Hall of Fame honors persons and organizations that have made significant and original contributions to the development and application of GIS concepts, tools or resources, or to the GIS profession.
URISA is inviting nominations for 2020 inductees.
Anyone may nominate a person or organization for induction to URISA’s GIS Hall of Fame. To make a nomination, submit a written statement to URISA describing:
The nominee’s achievements, emphasizing significant and original contributions to the development or application of GIS concepts, tools, or resources, or to the GIS profession; and
The significance of the nominee’s contributions, in terms of their enduring impact on the GIS field or profession, and their social benefit.
Hall of Fame laureates are expected to exemplify vision, leadership, perseverance, community-mindedness, professional involvement, and ethical behavior.
Nominations are due on or before May 11. The 2020 URISA GIS Hall of Fame celebration will take place during GIS-Pro 2020 in Baltimore, Maryland.
Visit the URISA website for details about the nominations criteria and process, and to review the path-breaking accomplishments of previous inductees.
The development of augmented reality as a tool to manage and visualize hidden infrastructure assets has taken a major step forward following the announcement of a partnership between two technology companies.
MGISS, a U.K. geospatial specialist, has partnered with Canada-based vGIS to transform traditional GIS, BIM and CAD data into stunning augmented-reality visualizations.
Augmented reality provides an interactive experience of an environment where objects that reside in the real world, such as underground pipes, are displayed and enhanced with additional intelligence such as attribute information and maintenance records.
A specialist in the use of geospatial technology in the utility, infrastructure and environment sectors, MGISS said it understands the demands for improved spatial data quality and the requirement to communicate complex, asset dense, 3D environments in an easy-to-consume way.
Photo: MGISS
By combining authoritative survey-grade positions and associated data with consumer-grade hardware MGISS enables users of vGIS to access augmented reality visualizations from any suitable smart device.
vGIS is the leading augmented and mixed reality visualization technology for GIS data. Using the vGIS system, field personnel can see an augmented view that includes holographic infrastructure objects, improving environmental assessments and increasing situational awareness.
“Initiatives such as digital twinning and the expectation of ‘business as usual’ operations require the capture and representation of increasing complex real-world environments. Asset owners and operators face a number of challenges and opportunities including the need to improve safety, reduce risk and ensure what lies beneath our feet meets future infrastructure needs,” said Mike Darracott, managing director and founder of MGISS.
“vGIS truly understand the needs and the challenges facing these sectors. In fact, vGIS goes further than any other Augmented Reality solution by providing a full range of 3D spatial data capabilities; all within a platform that works with existing enterprise systems and data structures,” added Darracott.
“Value is often hidden deep within the structure of data. By helping people ‘see’ data in more intuitive ways, they gain new insights and can subsequently do more with that information. That’s been the core operating philosophy of vGIS,” said Alec Pestov, founder and CEO of Canada based vGIS. “To achieve this we are building an ecosystem bringing together top experts to work jointly towards a common goal. MGISS possesses deep expertise in the spatial services and solutions sector and we are looking forward to joining forces to deliver augmented and mixed reality visualizations in the UK.”
Carlson Software has released its Scan2K Laser Scanner, a versatile, fast, easy-to-use solution for the creation of accurate 3D survey data up to a range of 2K (2,000) meters. Carlson introduced the product at the Pennsylvania Society of Land Surveyors’ 2020 Conference.
Carlson’s Bradley Husack, Special Projects Engineer, and Michael Hyman, Regional Director with the Scan2K at the Pennsylvania Society of Land Surveyors’ conference. (Photo: Carlson)
Built with surveyors in mind, the Scan2K is at home in the field with its weather-proof housing, user-friendly sunlight-visible touch screen interface with simple, menu-driven operations for quickly collecting and georeferencing point cloud data. With an integrated high-resolution camera, inclinometers, a compass, and an L1 GNSS receiver, the Scan2K can be deployed in many environments and orientations, including mobile operations.
Carlson’s partner on the Scan2K project is Teledyne Optech, a world leader in 3D survey systems. Carlson will be the exclusive global distributor of the OEM Scan2K solution.
“The Scan2K addresses the diverse range of applications for a laser scanner in the surveying and mining industries,” said Bradley Husack, a Special Projects Engineer at Carlson. “Carlson is bringing to market an all-in-one solution that now leads the market in versatility, speed, and value.”
The Carlson Scan2K has a simple, sunlight-visible touchscreen interface. (Photo: Carlson)
Beyond its impressive 2,000 meter range, the Scan2K also has short- and medium-range modes, as well as the capability to record over 500,000 points per second, all within the chosen scanning target window.
Additionally, each laser pulse from the Scan2K records up to four returns, providing the capability to record the first return for a blocking object (such as a leaf) as well as the last return for an object behind it (such as a wall), and the versatility to exclude one or the other.
The Carlson Scan2K comes bundled with ATLAScan software, a powerful yet simple solution for registering the point cloud, as well as Carlson Point Cloud Advanced for feature extraction into Carlson’s suite of CAD office products.
The Scan2K comes ready to be equipped with an additional external camera, an external GNSS receiver, or for mobile operation.
Whether on a tripod, a vehicle, or another moving platform, the performance offered by the Scan2K easily makes it a versatile terrestrial laser scanner for the market.
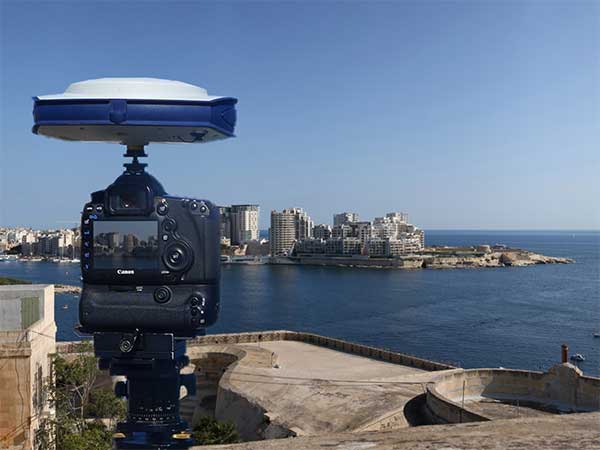
Verified photomontages for UNESCO World Heritage sites achieves accuracy with Spectra Geospatial SP80
Verified photomontage is an important planning tool to envision how proposed surrounding development plans would affect UNESCO World Heritage sites. Verified photomontage demands the best accuracy for the best visualization to determine what a development may look like to a person standing at the photographic viewpoint.
For MS Environmental (MSE), selected to provide verified photomontage for multiple UNESCO World Heritage sites, including in the UK Royal Botanical Gardens at Kew and the City of Bath, the Spectra Geospatial SP80 GNSS receiver enabled the highest quality visualization.
“The one-centimeter accuracy delivered by the SP80 is essential,” said Mike Spence, a verified photomontage specialist and founder of MSE. “The highest level of accuracy in the relationship between the actual camera location and the 3D model camera gives confidence in the visualization. In addition, The SP80 offers both simplicity and a robust design though it’s taken a few knocks over the years, it gives us the confidence we can use the equipment anywhere in the world and get the best results.”
At Kew Gardens, MSE was commissioned to produce accurate visualizations of views from within the UNESCO World Heritage Site. There was concern about development proposals for tall tower blocks in west London and how these might affect historic views from Kew Gardens.
The work culminated in a public inquiry, where evidence was presented that showed how views would change as a result of the proposed development. “Without the level of accuracy provided by the SP80 together with a transparent technical methodology it would have been unclear precisely how these historic views would change,” Mike Spence said.
At the UNESCO World Heritage City of Bath, the Bath and North East Somerset Council commissioned MSE to produce technical photography from strategic views around the World Heritage City to show how development proposals would affect strategic views across the city.
Earlier this year, a drone pilot and two data scientists from PrecisionHawk traveled to the Philippines for a unique mission — to fly drones equipped with lidar sensors over a dense rainforest to map ancient trade paths. The aim was to find buried treasure left by the Japanese during World War II.
PrecisionHawk was approached by the producers of a new History Channel show to help them navigate the Filipino rainforests. Through the combination of air and ground sensors, including a DJI M600 UAV equipped with a Riegl miniVUX lidar sensor and a Sony a6000 camera, PrecisionHawk staff produced a colorized 3D map of the forest.
The History Channel aired the series premiere of “Lost Gold of World War II” on March 19, 2019; all eight episodes are now available for streaming. The second episode features visuals generated by PrecisionHawk, as well as interviews with the drone pilot and data scientists.
Course takes learners on a deep dive into concepts and applications
Esri logo
Esri will offer a new massive open online course (MOOC) on spatial data science early this year. The no-cost course, which will run for six weeks on Esri’s Training website, includes full access to ArcGIS Pro, ArcGIS Online and ArcGIS Notebooks software.
Spatial Data Science: The New Frontier in Analytics opens on Feb. 26 and provides a comprehensive introduction to how incorporating location enhances traditional data science workflows.
“Spatial data science builds on foundational data science techniques and adds the spatial perspective that really makes a huge difference in the outcomes of an analysis,” said Lauren Bennett, software development lead on Esri’s spatial analysis and data science team.
The course includes video presentations by Esri experts, discussion forums, and hands-on software exercises. Participants will discover how including spatial data and spatial analysis tools and techniques can dramatically improve predictive modeling, uncover previously hidden patterns, and solve problems.
“At its core, spatial data science is about solving problems,” Bennett continued, “using spatial algorithms, taking the latest and greatest techniques (statistics, machine learning, deep learning) and all the tried and true, more traditional techniques to turn data into information.”
Each section of the course will focus on a specific topic and application of spatial data science. From data engineering and visualization to suitability modeling, pattern detection, space-time pattern mining, and object detection with deep learning, participants will explore a wide range of scenarios using realistic data and powerful ArcGIS tools.
While many practitioners emphasize craft when sharing results, course authors champion the notion that successful analysts and data scientists must be able to effectively communicate the impact of their work with leaders and colleagues. For this reason, the final section of the course will explore the use of ArcGIS StoryMaps to craft visually appealing and information-rich narratives that resonate.
Spatial Data Science: The New Frontier in Analytics is open to learners worldwide. All that’s needed to attend is an Esri account, which is free and easy to create at accounts.esri.com.
Participants with a background in statistics, data science and Python are encouraged to attend, but anyone interested in exploring technology hot topics and learning the latest analytical capabilities of ArcGIS software will benefit as well. A certificate of completion will be awarded to all participants who finish the course.
Hexagon AB has introduced HxDR, a new cloud-based, digital reality visualization platform, at CES 2020.
HxDR creates accurate digital representations of the real world through the seamless combination of reality capture data from airborne, ground and mobile sensors. Users can then leverage the complete, accurate and precise replicas to visualise and share their 3D design projects and models within a real-world context.
CES 2020, the massive annual consumer electronics show, is taking place Jan. 7-10 in Las Vegas. HxDR will be demonstrated at CES 2020, in Hexagon’s pavilion CP-15.
Airborne imagery and laser scans, indoor and outdoor terrestrial scan data and mobile mapping data can be seamlessly combined using HxDR. Users can drag and drop their reality capture files into HxDR and the automated meshing function does the rest. Or, they can license real-world replicas from Hexagon’s 3.6-petabyte collection of towns, cities and landscapes.
HxDR is specifically designed to help a myriad of professionals make more informed decisions. For instance, architects can share 3D building designs with project stakeholders within accurate digital replicas of real-world locations.
Media and entertainment professionals can remotely scout production locations as well as leverage HxDR to streamline production workflows. City officials can leverage HxDR in their smart city platforms for urban planning and development.
“HxDR enables customers to create their own Smart Digital Realities, addressing the growing need for simple-to-create yet highly sophisticated and accurate visualizations of reality capture data that boost project efficiencies and cost savings,” said Hexagon President and CEO Ola Rollén.
“We’re uniquely positioned to deliver this innovative platform due to the vast library of data captured from our world-leading sensor and visualisation services portfolio — a portfolio we continually enhance through R&D and strategic acquisitions such as Technodigit, Luciad, MyVR, and the newly-acquired Melown Technologies,” Rollén siad. “Moving forward, we anticipate HxDR will play a critical role in the formation of smart city and smart nation platforms that will increasingly reflect the needs of citizens today and in the future.”