Tag: GIS

  • GNSS & Surveying 2017: The year in review

    GNSS & Surveying 2017: The year in review

    Another year gone by

    As another holiday season passes us by, it is customary to look back at the year and recall the trends, new products and services, and breakthroughs we experienced with the GNSS environment and its effect on the professional surveyor. While 2017 was not filled with groundbreaking instruments and programming, it did provide a good look at what are going to be trends and gamechangers for the near future. From new innovations on GNSS receivers, new UAV platforms, and geospatial advances, it was also a year that saw location spoofing of shipping vessels, trade relations among super powers being tested, and more opportunities to put satellites into orbit from the private sector. Let us look back at what the surveying community experienced with the GNSS industry:

    The constellation scorecard

    GNSS continued to expand to all reaches of the globe with enlargement of existing constellations along with introductions of several new ones, (see GPS World magazine “The Almanac,” December 2017). The European satellite system, Galileo, has led the expansion with four (4) new vehicles. This joint venture of the European Commission and the European Space Agency was declared operational at the end of 2016 and looks to keep increasing its coverage in the coming years. For surveyors, this means additional redundancy for our positional data. More confirming redundancy translates into increased confidence in our work product.

    Next in numbers of vehicles being sent to space is the Japanese effort named Quasi-Zenith Satellite System (QZSS) and operated by the Japan Aerospace Exploration Agency (JAXA). While their first bird was sent up in 2010, this was the breakout year with three (3) more satellites installed this past year. It is anticipated that the constellation will be operation in 2018 and we can expect most of the GNSS manufacturers to include the positional data from QZSS if they haven’t already built in this capability.

    Coming in next are the Chinese with their regional-based system called BeiDou with two (2) more satellites installed in 2017. Their current program is scheduled to have several more vehicles included in the constellation and provide worldwide positional coverage by 2020. With the rapid expansion of China as a world leader, we can anticipate more GNSS developers to work closely with BeiDou as the system becomes more effective on the global stage.

    The other world leader, Russia, continues their expansion of GLONASS with the installation of one (1) new satellite in 2017 with plans to upgrade several existing vehicles in the coming years. The inclusion of GLONASS signal reception by survey-grade GNSS receivers has greatly increased the redundancy of data collection, (as mentioned with Galileo). It has also expanded our timeframes in which we can work with reliable positional solutions, thus keeping our downtime to a minimum.

    The United States is by no means bringing up the rear in GNSS constellation development but 2017 was a transitional year for the program. A new government administration has led to revisiting our national budget, with the Department of Defense looking to prosper under preliminary plans. While the schedule for constellation expansion have been in place for several years, the installation of Block III satellites has become a higher priority. These satellites will provide higher positional accuracy than previously experienced without any correction signal utilized. This will help the surveyor with better positional accuracies in shorter timeframes and looking forward to its expanded capability.

    Once these constellations are operational (with more to come), the ability to record positional locations and attribute data will be greater than ever. A potential challenge to these satellite constellations, however, is the ever-growing fear of potential conflicts between the United States and several countries, including North Korea, Syria, Iran, and Russia. The threat of nuclear war with North Korea could result in our GPS network being shut down to civilians or blocked by an electromagnetic pulse weapon. Cold War tactics with Russia could lead to spoofing or blocking of GLONASS signals that many of our GNSS receivers have become reliant upon. There are alternatives being developed in case our GPS goes away (see “The Day GPS Went Away,” September 2017) but we are several years from having a true secondary option. We will need to keep our fingers crossed we can maintain peace across the globe but do not look forward when something happens and takes our GNSS ability away.

    Data mining and the surveyor

    One thing that has emerged from 2017 has been the importance of data; where it is housed, how we use it, and what it can tell us about our future endeavors. GNSS has revolutionized the data mining industry with the surveying industry being right in the middle of the fray. Prior articles were published about geolocation (see Geolocation and the surveyor: Looking back to the future) so the rapid expansion of the data collection into most business environments shouldn’t surprise most readers, especially if one reads technical sources like GPS World magazine. The surveying community has watched and experienced the astronomical growth of this data collection in various arenas, none of which was more obvious than the “Geospatial 4.0” initiative at Intergeo 2017 in Berlin, Germany. While summarizing to readers on a trip through the annual conference in the last article (Intergeo 2017: A surveyor’s perspective), it was also here that a bigger picture was coming into focus regarding data and its effect on our world.


    While doing homework for this article, the term “Geospatial 4.0” was coined for the 2015 Intergeo conference in Stuttgart, Germany. This term was developed by the conference team regarding the advancing developments in the data world that incorporate geolocation, time, and unlimited information attributes, all while stored in a central location “in the cloud.” This environmental condition exists for most us already, as it is estimated there are three to four billion smartphone users worldwide. The data that is being collected every day is a small part of how our lives and relative actions have become digital snapshots to assist those charged with forecasting and planning of our future cities and environments. Much of this data is being used to advance the places where we live through an initiative called “Smart Cities.” Installation of data collection sensors and control systems in various applications monitor and store information to help make necessary changes to the existing systems. The organizations and municipalities behind this effort are attempting to create better work and home environments with increased efficiency and sustainability.

    The professional surveying community plays a big part in the continuing development of geospatial world around us. Our job is not only to collect data for a boundary survey, topographical information for an engineering design, or provide layout assistance for construction; we are also historians in establishing the current positions of required information at a specific point in time. The world around us can move quickly, so providing the precise moment in time when data is collected is sometimes just as important as the location itself. Our role as surveyors becomes even more important as the increased development and implementation of geographical information systems (GIS) emerges within more public and private entities. Where the surveyor previously shunned being included within the collection process and framework of GIS, our profession has become quite efficient at the data acquisition and database maintenance necessary for geospatial success.

    The surveyor’s friend in the technical world of geodesy, the geodesist, has not always been an accepted member of the GIS world, either. Once seen as mathematicians stuck in laboratories calculating “perfect world geometric solutions,” the geodesist carries a significant amount of beneficial information to the realm of geospatial data. It has been through their data collection and research that has brought our shifting continents to light and the simple fact our land-based coordinate systems must be modified to change positions as time rolls along. The common theme here is that spatial data comes down to several distinct factors: position, navigation, and time.

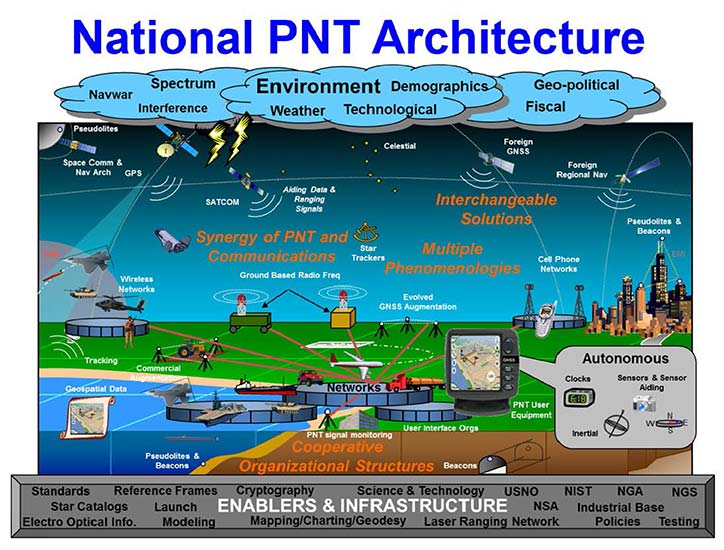
    PNT (not just another dull government acronym…)

    Another big step forward taken in 2017 was the continued implementation of positioning, navigation, and timing, otherwise known as PNT. These three bits of information provide the geographic basis of collected data for any GIS or other environmental study. According to the U.S. Department of Transportation website, here is the definition of PNT:

    “…a combination of three distinct, constituent capabilities:

    Positioning, the ability to accurately and precisely determine one’s location and orientation two-dimensionally (or three-dimensionally when required) referenced to a standard geodetic system (such as World Geodetic System 1984, or WGS84);

    Navigation, the ability to determine current and desired position (relative or absolute) and apply corrections to course, orientation, and speed to attain a desired position anywhere around the world, from sub-surface to surface and from surface to space; and

    Timing, the ability to acquire and maintain accurate and precise time from a standard (Coordinated Universal Time, or UTC), anywhere in the world and within user-defined timeliness parameters. Timing also includes time transfer.”

    (Source: https://www.transportation.gov/pnt/what-positioning-navigation-and-timing-pnt)

    The basis for PNT can be used for any data collection. From fixed monuments utilized by surveyors to any municipal utility installation, the use of PNT now becomes an important part of the GIS database, if not for anything more than simple tracking. By establishing the location of any entity at any given time and comparing its position to an earlier collection, we can determine the navigation of that entity. A good example of PNT and our daily interaction is the satellite navigation systems installed in our phones and vehicles. When we utilize our favorite mapping program on our phone or in our car, we are implementing a PNT system to show us where we are, how fast we are going and help determine how soon we will be getting where we are going. This wonderful practice is being made possible by GNSS data collection and computer processors turning the positional data into useful information.

    Surveyors are doing the same thing by the data collection they are performing every day. Any data that is collected by a modern survey instrument is being tagged with two of the main components of PNT; position and time. When the same entity is collected again later, its navigational information can be determined if needed as well. This type of data collection is becoming more apparent with laser scanning and lidar point clouds, as this data can be revisited to determine how much entities within the project area has changed. I foresee a time in the not-to-distant future where much of the Earth is scanned for historical purposes and can be analyzed by future generations for changes. A surveyor could benefit greatly by knowing where a water feature (rivers, creeks, streams, and lake and ocean shores) existed at a specific point in time and how much it has changed over time. Many land boundaries are based upon these water features as natural delineators, so knowing how much title area has changed with the natural movement of a waterway would be very beneficial to the surveyor and how land boundary disputes are handles. Same could be said of buildings and other improvements within developed areas, too. By establishing geospatial data on physical improvements, it could greatly help the surveyor determine historical and future land boundaries by their known location.

    The simple fact is that our ability to collect, analyze and retain geospatial information has never been greater than now and only gets better over time. The surveyor now has similar tools to other sciences and technologies, so now is an appropriate time as any to truly embrace geospatial data collection.

    UAV’s continuing growth

    One market that continues growing at rapid pace is the unmanned aerial vehicle (UAV) sector. 2017 brought more aircraft innovations and expansion of sensors available for a multitude of data collection purposes. This greatly expanding segment of specialized equipment was quite evident at Intergeo 2017, where over 150 UAV vendors were provided their own space solely for the exhibiting as well as an outside arena for demonstrations. While there are other UAV trade shows that rival in the size, the Intergeo show brings the best vehicles, software and ideas for geospatial data collection and imagery directly to the surveyor’s hands.

    Other innovations that are taking shape in the UAV world include larger multi-rotor aircraft with increased payloads, vertical takeoff and landing (VTOL) platforms, and a plethora of sensors designed specifically for UAV use. These modules include various methods of lidar for high accuracy scanning, hyperspectral cameras for analyzing plant characteristics, infrared scanners for heat detection, along with camera possibilities that are endless. The main reason to highlight these high-tech applications is simple; these technologies consist of location-based data collection. The surveyor, known professionally as the expert measurer, should make themselves more aware of the rapidly expanding ability to collect data of varying types new to the land surveying field but still relies heavily on accurate and precise measurement methods. The UAV, while still new to many surveyors, is becoming a standard measuring tool in our world. These latest sensors are a result of applying emerging technology for non-traditional surveying clients directly into our wheelhouse. The professional surveyor successfully adapted to new methods and instruments when electronic distance meters, GNSS receivers and laser scanners were introduced, so our profession needs to step up again and take note of what data collection methods and challenges are out there.

    Wingtra One in the air. (Photo: Wingtra)

    Staying on the subject of surveyors and the UAV, one of the next breakthroughs will be the introduction of affordable aircraft with RTK capability. There are currently several manufacturers of survey-grade UAV aircraft but these are sold at higher price point that is considered out of reach for the typical surveyor. Many have relied on less expensive models in conjunction with their existing RTK receivers to collect physical points or features for use with post-processing software. While not resulting in immediate data for project review, the end product of the post-processed method is quite good and at much lower cost of entry. However, there are times and places where ground control is not available or accessible so flights with photos or scans are not possible. The mainstream UAV manufacturers are taking note of the need for RTK capability and beginning to introduce models with this positional feature, so maybe the tide is turning to lowering the price point for this technology as well. Here is another place the surveyor will need to enter the UAV arena as the long-time RTK expert and utilize the latest technology for expanded data collection purposes. To my fellow surveyors: you’ve been warned, so be ready to get your checkbook out in order to stay competitive.

    Survey-grade GNSS receivers

    While 2017 wasn’t a breakout year for radically new GNSS technology, it did see its share of minor yet significant improvements. Along with the expansion of existing constellations and preparation for new ones, the technology behind the microprocessor within the GNSS receiver continues to allow for miniaturization and increased speed and accuracy. Several manufacturers are producing survey-grade receivers capable of acquiring hundreds of GNSS signals yet fit in the palm of your hand. Batteries, like most technologies using it, continues to decrease in size yet gain in power-up time. This rapidly shrinking footprint of the GNSS receiver is allowing for placement in more devices and places so the surveyor will need to take advantage of these gains to assist with providing positional and data collection expertise.

    A sector of the positioning market that will see rapid increases is the smartphone division. Coupled with the growing GNSS constellations with increasing accuracy signals and more sophisticated computing power programmed specifically for positioning, we will see more smartphones being used for data collection purposes. Google has made significant strides in the customization of the Android operating system to allow for the processing of raw GNSS data to provide positional accuracies beyond the normal smartphone capability. It is safe to say that Apple is likely working on the same type of application for the iOS operating system, so we could see another battle for smartphone supremacy be waged on a highly technical front that surveyors can readily use for their profession.

    Another advancement in GNSS technology that will see more in 2018 and beyond will be the use of the inertial measurement unit (IMU) in conjunction with receivers and sensors. Several manufacturers have incorporated IMU’s into their measuring devices to augment the data being collected. The application that has surveyor’s attention is a GNSS receiver with an IMU to record the measurement correlation of the pole tip to the center of the antenna. The IMU has also been configured on various vehicles built for mobile data collection to measure velocities and acceleration to assist with reducing errors within the GNSS measurements by environmental factors. As GNSS receivers continue to evolve and reduce in size, it will also allow for further inclusion of an IMU to help with reduce data errors. Surveyors should take note of these advancements and be prepared to upgrade their equipment and knowledge to stay current with emerging technology and data collection accuracies.

    VectorNav’s new Tactical Series includes the VN-110 IMU/AHRS, the VN-210 GPS/INS and the VN-310 dual-antenna GPS/INS.

    Into 2018 and beyond…

    Some of the items worth watching in the immediate future include:

    Autonomous travel

    From Elon Musk’s Tesla projects to the Uber/Volvo collaboration with driverless vehicles, autonomous travel will dominate tech news for the next few years. Because these vehicles rely heavily on GNSS positioning in conjunction with road-reading sensors, the focus on the GNSS constellations will stay very much in front of the tech and political worlds. Another portion of the driverless equation is the effective mapping of the roadway system, which come right back into the realm of the surveyor. While we see various mapping vehicles (Google, Apple, and others) out and about digitizing our roadways, the surveyor is the professional entity that is relied upon for the location establishment for existing and future rights-of-way. Our inclusion in mapping these byways is critical to minimizing harm to the public for potential accidents and disasters.

    Lightsquared 2.0

    The battle over bandwidth several years ago seemed to end with the FCC denying the implementation of ground-based signal amplification by an upstart firm known as Lightsquared. Now with the new administration at the FCC and an atmosphere of deregulation, the firm has rebranded itself as Ligado and is back to try again. Hopefully the same coalition that helped defeat the prior attempt will be back, but with the new ideology running the FCC, all bets are off. The surveyor without GNSS capability (as previous discussed) will mostly be rendered lifeless without it.

    Internet of Things (IoT)

    Also fighting for bandwidth is a new generation of sensors and monitors being used for a multitude of products and procedures. This movement toward automation is proving to be useful in many environments but is beginning to tax an already overworked data stream. These components are more appropriate in mostly urban areas where broadband coverage is most effective but their implementation in rural America is starting to drive a greater need for more data availability in harder to get places. This push to get more broadband into rural areas will be a wonderful opportunity for those surveyors to complete their projects with similar effectiveness their counterparts in the urban areas already utilize. But the move by the FCC to repeal net neutrality poses a significant threat to that opportunity and equality, so we must wait and see how this plays out as well.

    Final thoughts…

    While covering a lot of ground here, the main thread is to emphasize the important link between the professional surveyor and the use of GNSS equipment and procedures. Prior to most of the emerging technology, the surveyor was relied solely for boundary determination and not much else. As engineering design became more reliant on detailed topographic surveys, the surveyor increased their responsibility to provide that vital information. As measuring and positional determination has become more complex, the surveyor has adapted to technology and provided that expertise in their duty to protect the public’s interest. Our world is getting more complex every day and we rely on specialized professions for a multitude of tasks. The surveyor can and should be relied upon for tasks discussed herein but making sure both the surveyor and the public knows that is a big key to success. Accurate positioning and reliable measurements requires someone with the knowledge of the subject and technology and the professional surveyor is that someone. To my fellow practitioners; stay involved, advance your education, and continue to be professional.

  • A look at LocationTech open source geospatial solutions

    LocationTech open source project provides core technology for geospatial big-data analytic solutions.

    LocationTech has released five open source projects that provide core technology used to build geospatial big data analytics solutions.

    A working group of the not-for-profit Eclipse Foundation, the LocationTech community builds software for geospatial technology. The Eclipse Foundation enables collaboration on open source software. Besides geospatial technology, the foundation’s 300-plus open source projects include tools for software developers, system engineers and scientific research.

    LocationTech provides technology for the $500 billion in worldwide geospatial industry. Its projects can be used to efficiently process satellite images, analyze maps for the agriculture industry, visualize smart-city sensor data, and in many other geospatial use cases.

    The LocationTech community has grown to include nine open source projects, 18 member organizations and more than 100 developers.Collaborating geospatial organizations include Boundless, Red Hat, Radiant Solutions, IBM and Oracle.

    “Geospatial big data analytics technology is becoming more and more important across all industries, such as agriculture, transportation, and government,” said Mike Milinkovich, executive director of the Eclipse Foundation. “LocationTech is delivering on the promise of providing key technology for companies that enable large-scale analytics of geospatial data. Having an open source community, like LocationTech, that accelerates adoption and innovation of geospatial technology will have a significant impact on the entire industry.”

    The new project releases include the following:

    GeoWave is a software library that connects the scalability of distributed computing frameworks and key-value stores with modern geospatial software to store, retrieve, and analyze massive geospatial datasets. GeoWave takes multidimensional data, such as spatial or spatial-temporal, and indexes it into a key-value store such as Apache Accumulo or Apache HBase. These distributed storage technologies, in addition to complementary distributing processing frameworks such as Apache Hadoop and Apache Spark, have proven capabilities to unlock the potential of massive datasets across a variety of domains.

    GeoGig 1.2 is a tool for geospatial data versioning. It enables users to leverage versioning of their geospatial data and to enable replication and synchronization workflows, in addition to supporting end-to-end data management workflows. The new GeoGig 1.2 release improves the collaborative version workflow by improving cloning and push/pull performance and provides an updated Web API to align with the latest version of GeoServer.

    GeoGig-sample-W

    GeoTrellis 1.2 is a geographic data processing Scala library designed to work with large geospatial raster datasets. The tool provides developers with a set of utilities to help create useful, high performing web services that load and manipulate raster data (data normally used to represent satellite or aerial images). The new release includes a number of optimizations and new features including distributed computation support for viewshed and Euclidean distance through Apache Spark.

    GeoTrellis-example-W

    GeoMesa 1.3.5 is a distributed, spatio-temporal database built on a number of distributed cloud data storage systems, including Apache Accumulo, Apache HBase, Apache Cassandra, and Apache Kafka. The suite of tools brings spatial-temporal data, real-time IoT, and sensor workloads to the cloud. GeoMesa’s novel indexing schema enables efficient queries resulting in rapid access to large data stores for any client application.

    GeoMesa-taxi-casestudy

    Java Topology Suite (JTS) 1.15 is a Java library for vector geometry providing spatial data types, spatial relationships and spatial operations. JTS is an established open source project that recently moved to the LocationTech community. New technical features for JTS 1.15 include K-Nearest Neighbor search for STR-Tree, improved handling of Quadtree queries, support for GeometryCollection, and a new JTSTestRunner command-line application. This initial LocationTech release the project is changing from LGPL to a dual license of Eclipse Distribution License (EDL) / Eclipse Public License (EPL) . This license change opens up JTS to a wider range of organizations and applications.

    “LocationTech is becoming the critical nexus for organizations looking to develop and deploy geospatial Big Data solutions,” says Eddie Pickle, Managing Director of Open Source Programs at Radiant Solutions.

    “The latest release of GeoGig to LocationTech represents a huge leap forward. Not only does it support versioning workflows for traditional geospatial data, but it is now optimized for spatio-temporal analysis of big data and streaming datasets from IoT sensors,” says Anthony Calamito, Chief Geospatial Officer and Vice President of Products

    The LocationTech Working Group is also organizing the annual FOSS4G NA conference May 14-16, 2018, in St. Louis, Missouri, followed by a Community Day on May 17. Members of the LocationTech community will be speaking and showcasing their open source projects at this conference.

    The vision of the LocationTech community is to be the leading provider of core technology for geospatial big data analytics. The five projects being released reflect the growing investment towards achieving this vision.

  • Aeronyde to develop infrastructure for autonomous flying cars

    Aeronyde has received $4.7 million in seed financing to develop its end-to-end infrastructure for self-flying vehicles.

    Aeronyde is an aerial systems company aimed at enabling safe autonomous urban flight. The company is working to integrate artificial intelligence and augmented reality into a full-service system for the safe and secure operation of commercial drones.

    The investment was led by Korean electronics manufacturing giant JASTech Co. Ltd, best known for flexible OLED/QLED display. Aeronyde is applying the strategic investment to the development of hardware and systems software for autonomous fleet management.

    “In the 21st century, drones will shape global transportation and distribution and redefine the urban landscape, however we’re not there yet,” said Edgar Muñoz, CEO of Aeronyde. “Adoption of unmanned aerial vehicles (UAV) platforms depends wholeheartedly on the public’s acceptance of the technology. As an industry, we must ensure public safety is addressed prior to the commercial unmanned aerial system (UAS) industry boom. This is what Aeronyde is working on.”

    Through data collection and partnerships with national, state and private stakeholders, Aeronyde aims to deliver a turnkey UAV service for emergency responders, disaster relief and commercial transportation and logistics in urban areas.

    “The market is growing rapidly as more countries are looking at developing UAS regulations,” said Jason Chung, Chairman of JASTech. “We are excited to invest in Aeronyde, a leader in this revolution, as they innovate UAS technology. Aeronyde is helping to build the future of Autonomous Aerial Systems with software and hardware that ensure the responsible management of drones in urban environments.”

    Other Partnerships

    The Aeronyde team is also working with U.S. regulators and international associations to define standards and protocols for the safe implementation of commercial drone technology. Key partnerships include:

    • IBM Watson: Aeronyde is conducting rigorous testing, working with IBM Watson to run millions of flight simulations, and collecting data on the security of the system.
    • Leading technology, systems and regulatory partners: Unifly, the Police Foundation, iSENSYS and the Global UTM Association (GUTMA), a consortium of public and private entities working on unmanned traffic management (UTM) technology.

    The Aeronyde system provides flexible infrastructure for aerial logistics, transportation and data collection including:

    • real-time data analysis to contextually apply sequencing, tasking, local environment, and weather.
    • machine learning to build situational awareness.
    • live flight and testing in Aeronyde research and development centers.

    The end-to-end Aeronyde hardware and software system includes:

    • autonomous flying vehicles and processors
    • airspace and flight path management
    • unmanned traffic management (UTM)
    • user interface and training programs
  • Bentley publishes 'Plain Language BIM' book

    Plain_Language_BIM_coverPlain Language BIM is now available as both a print publication and as an eBook for Kindle and iOS devices from Bentley Institute Press.

    Bentley Institute Press is the publisher of a broad array of textbooks and professional reference works dedicated to building information management (BIM) advancements in the architectural, engineering, construction, operations, geospatial and educational communities.

    Plain Language BIM is by Iain Miskimmin, a BIM Advancement Academy expert.

    “Current industry thinking in the digital world moves at a fast-changing pace,” Miskimmin said,. “But the lessons we have learned in the BIM Advancement Academy and that we share with you in this book, are an excellent starting point for any individual or organization wishing to grasp both the high-level reasoning and the details of BIM.”

    Because BIM improves the ability to manage, produce and consume asset information throughout the lifecycle (design, construction, operations, and maintenance) of infrastructure assets, an increasing number of governments around the world are mandating BIM Level 2 standards and deliverables for publicly funded projects.

    Successfully implementing a BIM strategy can result in considerable cost savings, improved performance and better project outcomes. Plain Language BIM is beneficial for beginners and for those with experience with BIM strategies to ensure all professionals are thoroughly prepared to be part of industry efforts focused on advancing BIM.

    Plain Language BIM condenses years of experience and lessons learned from Bentley Institute’s BIM Advancement Academy. It guides the reader through the many complexities of BIM methodology by providing a plain language understanding of the concepts and building blocks required to deliver an effective strategy.

    It demonstrates why gathering data about the asset is vital to the BIM process, and why trustworthy and reliable information, delivered in an understandable and consumable manner, is essential for effective decision making— upgrading, augmenting, replacing, decommissioning, or leaving assets as they are.

    Plain Language BIM also explores three elements in creating good BIM practices: people, process and technology. It explains how the combination of these elements plays a crucial role in the lifecycle of an asset and in delivering better outcomes.

    The book also examines the Eight Pillars of BIM Wisdom that ensure best practices and world-class BIM vision.

    Like all the titles in the Bentley Institute Press portfolio, Plain Language BIM aims to deliver continuous learning to help both students and practitioners in infrastructure professions increase their expertise and improve their workflow efficiencies.

    Plain Language BIM is available as a printed book, and also as an eBook from Amazon and from iTunes.

    Miskimmin has spent the better part of two decades working in support of the infrastructure and construction industries, helping to deliver the first BIM projects in the UK. Since 2012, he has run the Crossrail/Bentley Information Academy and the BIM Advancement Academy in London. This position has allowed him to interact with more than 4,000 industry people from all over the globe to capture their thoughts and experiences about BIM technology, including some about the biggest infrastructure projects in the world. He was worked closely with the UK BIM Task Group and leads the Infrastructure Asset Data Dictionary for the UK (IADD4UK) initiative.

  • Velodyne LiDAR, Paracosm team up to capture environments in 3D

    Paracosm's PX-80 handheld 3D scanner has Velodyne lidar inside. (Photo: Paracosm)
    Paracosm’s PX-80 handheld 3D scanner has Velodyne lidar inside. (Photo: Paracosm)

    Paracosm’s PX-80 mobile 3D scanner leverages lightweight, powerful VLP-16 Puck for fast and accurate surveying of indoor and outdoor areas.

    Velodyne LiDAR Inc., which makes 3D vision systems for autonomous vehicles, and Paracosm, a division of Occipital, have integrated Velodyne’s VLP-16 Puck lidar sensors into Paracosm’s PX-80 handheld 3D scanner.

    The PX-80 3D scanner is commonly used for geospatial, construction and industrial applications to survey a wide array of spaces from large office buildings to thick forests.

    Paracosm’s PX-80 uses Velodyne’s VLP-16 Puck and its own proprietary SLAM technology — itself a fusion of lidar, color imagery and inertial measurement unit (IMU) data — to produce detailed three-dimensional documentation of complex environments and geometries in minutes.

    The resulting point clouds come in full color with corresponding spherical imagery that can provide virtual tours along with accurate 3D measurements. With the lightweight VLP-16 lidar sensor from Velodyne, Paracosm is able to offer a handheld scanner with unprecedented accuracy, range and detail.

    “When we first began our 3D mapping journey, we wanted to be able to capture huge environments as fast as possible, but were limited by the range and accuracy of available sensors,” said Amir Rubin, president of Paracosm. “After searching far and wide for a better solution, we found that the VLP-16 was the best combination of size, accuracy, and functionality to fit our needs.”

    “Paracosm has proven its ability to expand the application of lidar into handheld use cases, allowing the PX-80 to become one of the most accurate and versatile mobile 3D scanners on the market,” said Mike Jellen, president and chief commercial officer, Velodyne LiDAR. “We are thrilled to partner with Paracosm for their development of the PX-80 and look forward to working with them as they expand their footprint.”

    As the VLP-16 is the smallest commercially available sensor in Velodyne’s lidar portfolio, it is the easiest to embed in other products. “The performance of the VLP-16 is unrivaled in the marketplace. We remain deeply impressed with the range, acquisition rate, noise levels and accuracy it provides in such a compact form factor,” said Gannon Wilder, who leads business development in the Paracosm division.

    Both Velodyne LiDAR and Paracosm will be at the Consumer Electronics show (CES) providing product demonstrations. Velodyne LiDAR will be at Booth #3525 in the North Hall of the Las Vegas Convention Center, while Paracosm will be at Booth #21029 in South Hall 1.

  • OGC seeks sponsors for Phase 2 of Future Cities Pilot Project

    The Open Geospatial Consortium (OGC) is seeking interested sponsors to define the challenges for Phase 2 of its Future Cities Pilot Project.

    As the operation and planning of cities increasingly relies on 3D geo-information in their processes, and apply Building Information Models (BIM) paradigms to their information management approach, efficient information flow in both directions between geospatial systems (GIS) and the architecture/engineering/construction (AEC) systems becomes increasingly important. This requires data to be interoperable, which requires common — and ideally open — standards.

    Completed in 2017, the Future City Pilot, Phase 1 (FCP1) demonstrated that interoperability between CityGML and BIM Industry Foundation Classes (IFC) works well in practice, and showed clear benefits in three use cases: urban planning; social care; and flood modelling. However, to achieve success, a significant amount of manual intervention needed to be employed.

    Phase 2 of the Future City Pilot (FCP2) aims to improve the automation of the flow of data, as well as address a number of related interoperability challenges, including:

    • Comparing data conversion with data linking approaches;
    • Looking at tools that consume both CityGML and BIM structured data;
    • Data structures that support the seamless integration of GIS data and BIM data;
    • Linking real-time sensor information with 3D City Models encoded as CityGML;
    • Security models to protect the sensor readings, including Single-Sign On (SSO) methodologies to protect parts of the 3D City Model;
    • Understanding where and how we must capture location and time information: the ability to correlate location in different coordinate reference systems (CRS) such as local, regional, global, and understand if, and how, the integrity of the location data has changed through that process (Survey4BIM use case); and
    • Data linking to facilitate asset management over dispersed geographies.

    Below is a video summary of FCP1.

    The Engineering Reports documenting the main outcomes of FCP1 are available.

    • Sponsorship of the Future City Pilot will provide the following benefits to sponsoring organisations:
    • Assess and affect market direction based on sponsor needs;
    • Visibility as global leader in information technology critical to deploying smarter cities;
    • Amplification of funding by multiple sponsors’ to solve common/similar problems;
    • Leveraging effort up to 3.5 times based on participant in-kind;
    • Accelerated process – workable interface specifications in 4-6 months;
    • Follow-on procurements using standards-based architecture proven in the pilot;
    • These Innovation Program pilots help feed into the consensus standards process of OGC’s Standard Program; and
    • Leading the way to safer and more efficient cities.

    There are three main deliverables resulting from an OGC pilot:

    • Testing of running software from several organizations to ensure interoperability of the independently developed implementations based on open standards;
    • Demonstration of policy-oriented scenarios with the deployed code. These scenarios show the previously unavailable capability from a non-technical point of view;
    • Documentation of the results of the architecture, testing, and demonstration. The reports may then become the basis of procurement activities of the operational system.

    The scope of this pilot as currently planned will include the demonstration of a common architecture and data model in multiple cities. The number of cities used for the demonstration will depend upon the sponsor requirements.

    If you want an innovative solution to your organisation’s Geospatial & BIM data interoperability problem, OGC urges you to contact Bart De Lathouwer, director of OGC’s Innovation Program.

  • Esri maps highlight net neutrality implications

    Esri-net-neutrality-O

    With discussions about net neutrality intensifying, Esri has created a suite of interactive maps to illustrate the current state of internet access and behavior across the United States.

    From analyzing predominant internet connection types to highlighting the communities that have already been left behind in the digital divide, these maps provide critical context for understanding how and where potential changes to net neutrality will impact Americans.

    All maps were created using Esri’s Market Potential and Updated Demographics data.

    The State of Internet Access

    The map below shows where U.S. citizens currently have the greatest access to high-speed internet and explores which type of connection (cable, fiber optic or DSL) is most common in each community.

    What Do Americans Do Online?

    Discover where Americans are most likely to engage in the type of high-bandwidth, high-visibility behaviors (such as streaming movies or playing games online) that would be most impacted by potential changes to net neutrality. The map also shows where adults are most likely to spend 10+ hours a day online.

    High-Speed Internet Deserts

    The map below shows the 10 ZIP Codes in the U.S .where adults have the lowest access to high-speed internet.

    Access Addicts

    Tour the 10 ZIP Codes in the U.S. where the highest percentage of adults spend at least 10 hours a day online.

  • Esri publishes textbook on how to use ArcGIS Pro

    esri-publishes-a-textbook-on-how-to-use-arcgis-pro-WEsri has released GIS Tutorial 1 for ArcGIS Pro: A Platform Workbook, which teaches all the elements of creating and managing data; designing maps; performing spatial analysis; creating 3D scenes; and sharing projects using ArcGIS Pro, Esri’s professional desktop geographic information system (GIS) application.

    The textbook primarily focuses on working with ArcGIS Pro but also offers instruction on using ArcGIS Online and apps such as Collector for ArcGIS, Esri Story Maps, and Operations Dashboard for ArcGIS. The book teaches students how to do the following:

    • Use, design, and share maps
    • Work with file geodatabases, spatial data, and geoprocessing tools plus learn digitizing skills and geocoding
    • Conduct spatial analysis using tools such as ArcGIS Network Analyst; work with raster datasets; and use 3D GIS technology to create scenes, buildings, and bridges
    • Manage operational systems using GIS, and complete a real-world project that provides hands-on experience in setting up and managing graffiti mapping and graffiti removal systems

    Designed for use in a university classroom setting, this workbook includes step-by-step instructions, On Your Own exercises, and in-depth assignments. Instructors can access teaching materials. Self-learners will find this textbook to be an excellent introduction in how to use ArcGIS Pro. Each tutorial includes easy-to follow, step-by-step instructions.

    GIS Tutorial 1 for ArcGIS Pro: A Platform Workbook was written by Wilpen L. Gorr and Kristen S. Kurland, the authors of other highly regarded tutorials including GIS Tutorial 1: Basic Workbook, GIS Tutorial for Health and GIS Tutorial for Crime Analysis.

    Gorr is a professor of public policy and management information systems at the School of Public Policy and Management, H. John Heinz III College, Carnegie Mellon University, where he teaches and researches GIS applications.

    Kurland is a professor of architecture, information systems, and public policy at Carnegie Mellon University’s H. John Heinz III College and School of Architecture. There, she teaches GIS, computer-aided design (CAD), building information modeling (BIM), 3D visualization, and infrastructure management.

    GIS Tutorial 1 for ArcGIS Pro: A Platform Workbook is available in print (ISBN: 9781589484665, 480 pages, US$99.99) and as an e-book (ISBN: 9781589484931, 480 pages, US$99.99). The print and e-book editions of the book can be obtained from online retailers worldwide, at esri.com/esripress, or by calling 1-800-447-9778.

    Outside the United States, visit esri.com/esripressorders for complete ordering options, or visit esri.com/distributors to contact your local Esri distributor. Interested retailers can contact Esri Press book distributor Ingram Publisher Services.

  • "Scariest commute of my life": California wildfires erupt

    Two fires erupted Monday in Southern California, fueled by strong Santa Ana winds. The Thomas fire in Ventura County started Monday night and has burned 45,000 acres and destroyed more than 150 structures. The Creek fire is burning near Sylmar and has prompted officials to evacuate more than 8,000 homes.

    Now a dramatic new wildfire erupted in Los Angeles early Wednesday. Flames exploded before dawn on the steep slopes of the Sepulveda Pass, which carries heavily traveled Interstate 405 through the Santa Monica Mountains where ridgetops are covered with expensive homes, including Bel Air. It is also the site of the Getty Center arts complex.

    More than a third of Ventura, California, residents have been forced from their homes. About 38,000 of the coastal city’s 100,000 residents have been evacuated since the fires started Monday night.

    Esri is providing this interactive map to keep up-to-date on events around the fires.

  • USGS map locates lava flows before an eruption

    lava inundation zones: In this USGS map, colors depict 3 of 18 lava Inundation zones for Mauna Loa. Yellow indicates the volcano’s Northeast Rift Zone, an area along which lava could erupt. The extent of the 1984 eruption and lava flow is superimposed on the map (red).

    New U.S. Geological Survey (USGS) maps show areas that could be affected by Mauna Loa lava flows — information critical for response planning. Each zone identifies a segment of the volcano that could erupt lava and send flows downslope.

    Hawaii-laval-maunaloa-map-WThe volcano has erupted 33 times since 1843. Typically, eruptions began in the summit caldera, with a curtain of fire (a 1- to 2-kilometer line of lava fountains).

    Using detailed geologic mapping and modeling of how a fluid (in this case, lava) responds to surface topography, the USGS Hawaiian Volcano Observatory constructed nine maps depicting 18 inundation zones on Mauna Loa, Island of Hawai’i.

    Colored regions on these maps show areas on the volcano’s flank that could potentially be covered by flows from future Mauna Loa eruptions. These eruptions could originate from the volcano’s summit, rift zones or radial vents. It’s likely, however, that only part of a zone would be covered in a single eruption.

    When a Mauna Loa eruption starts, the maps can help decision makers quickly identify communities, infrastructure and roads between possible vent locations and the coast, facilitating more efficient and effective allocation of response resources, the USGS said. The public can also use the maps to consider where lava flows might go once an eruption starts.

    A pamphlet about the maps is available here.

    lava flow glow: Had the Mauna Loa inundation maps been available in April 1984, when the volcano last erupted, the maps could have been used to determine that the northern portion of Hilo was the most likely area to be impacted by the main lava flow. (Photo: David Little)
  • Esri joins with Airbus on global intelligence enterprise agreement

    Esri has entered into an enterprise agreement with the intelligence program line of Airbus Defence and Space. With this new agreement in place, the core GIS will be expanded to meet Airbus’s pivotal mission of using creativity and innovation to address the massive economic, social, and environmental challenges our planet faces.

    The enterprise agreement is global in nature and includes all Airbus Defence and Space intelligence affiliates. The agreement also includes several addendums to cover the complete use of Esri’s ArcGIS platform by Airbus Defence and Space.

    Airbus Defence and Space has used Esri technology as part of its GIS for 26 years.

    “The potential of this agreement can be expected to reach far beyond today’s use of the Airbus Defence and Space core geographic information systems,” says Greg Buckman, head of Airbus Defence and Space’s intelligence business activities in North America. “Enterprise-wide access to the ArcGIS platform will provide new and faster spatial analytical functionality through web services to support key Airbus initiatives. This bears the potential for significant cost savings and speed to market while enhancing crucial cross-domain functionality on a global basis.”

    “Esri shares in this vision and looks forward to supporting Airbus Defence and Space through the deployment of ArcGIS Enterprise,” said Lawrie Jordan, Esri’s director of imagery and remote sensing. “Having a complete GIS platform is vital to organizations such as Airbus Defence and Space that operate on a global scale and for whom geographic awareness is crucial.”

    To learn more about how Esri helps the intelligence community make the most of location data with The Science of Where, visit go.esri.com/arcgis-intel.

  • Geologist uses lidar to monitor Greenland Glacier ice loss

    A Riegl VZ-6000 laser scanner, operating at 1064 um wavelength, serves as the backbone of the ATLAS system.
    A Riegl VZ-6000 laser scanner, operating at 1064 um wavelength, serves as the backbone of the ATLAS system.

    Leigh Stearns, a geologist with the University of Kansas, is working with a Riegl VZ-6000 ultra long range terrestrial laser scanner, incorporated into an ATLAS (Autonomous Terrestrial Laser Scanning) system, to monitor rates of ice loss on the Helheim Glacier, a tidewater glacier undergoing large-scale changes due to global climate change.

    “Lidar is an emerging technology for the earth sciences because it produces an incredibly detailed 3-D view of features,” said the KU researcher. “Repeat lidar scanning reveals small-scale changes with very high precision. These systems are now used to measure how bridges are sagging, how tectonic faults propagate and now how glaciers flow. The ATLAS systems are unique because they’re designed to scan the glacier terminus every six hours, year-round. That’s not a trivial task when there’s no sunlight in the winter, winds are high and it’s very cold.”

    The VZ-6000 high speed, high-resolution terrestrial 3D laser scanner offers an extremely long measurement range of more than 6000 meters for topographic (static) applications. Due to its laser wavelength, it is exceptionally well suited for measuring snowy and icy terrain in glacier mapping and monitoring applications in mountainous regions.

    Learn more about the project at the University of Kansas website.