The seventh China Satellite Navigation Conference (CSNC) met in May in Changsha, capital of Hunan province in south-central China. Chairman Mao attended high school and teaching college here, and the city has many monuments and stories about his younger days.
This was the seventh different host city for CSNC, as the China Satellite Navigation Office (CSNO) spreads the prestigious conference among various provinces.
The 2016 conference was every bit as big as last year’s in terms of number of attendees, papers presented, exhibit hall space and booths (77 exhibitors). I co-chaired the joint CSNC-Institute of Navigation (ION) panel with Dr. Jun Su. The session was well attended by both local Chinese experts and international visitors.
The collaboration between these two large GNSS technical organizations is an excellent trend as both benefit from the cross-fertilization. This September, there will also be a joint CSNC-ION panel at ION GNSS+ in Portland.
Industry Boom. The domestic Chinese satellite navigation industry is thriving, based on the growing availability of Beidou signals combined with the baseline GPS constellation. Government projects for a wide range of applications provide ample markets for domestic suppliers to build a solid business.
In general, however, the high-volume cellular handset market is still the domain of the traditional global suppliers, not only because of their experience with high-volume applications, but also the trend toward handset vendors requiring a complete platform solution including modem.
CSNC shows that startup companies seven years ago have grown into large, vertically integrated higher end suppliers, opening the low-cost, general purpose market sector for new entrants.
I noticed a corresponding cyclic trend in the domestic industry, which is similar to the way the GNSS business evolved in other regions. The initial entrants, who were small startups seven years ago, have become relatively large, vertically integrated companies supplying higher end, higher value systems. Most of these are in the agriculture, fleet tracking and survey industry, and many of them are now publicly traded companies. This has opened up the low-cost, more general-purpose portion of the market for new entrants.
Several of those new companies were founded by people who have left their initial startups on acquisition to start again. Although this industry is somewhat geographically isolated market-wise (they service mostly domestic customers), the parallels to way the GPS market developed 15 years ago in the United States are absolutely uncanny.
Perhaps in an industry based on cyclical orbits of satellites, it shouldn’t come as a big surprise that there is an overarching cyclical trend in the way markets develop around the world. I look forward to attending CSNC 2017 as it returns to Shanghai, site of the second CSNC in 2011.
The report provides a basic overview of the GNSS industry, including definitions, classifications, applications and industry chain structure. Development policies and plans are discussed as well as manufacturing processes and cost structures.
The report states the global GNSS market size and the segment markets by regions, types, applications and companies.
The GNSS market analysis is provided for major regions, including the U.S., Europe, China and Japan. For each region, market size and end users are analyzed as well as segment markets by types, applications and companies.
The report focuses on global major leading industry players with information such as company profiles, product picture and specifications, sales, market share and contact information. GNSS industry development trends and marketing channels also are analyzed. The feasibility of new investment projects and overall research conclusions also are discussed.
The report also provides major statistics on the state of the industry.
SBG Systems has moved its United States headquarters office from Chicago, Illinois, to Huntington Beach, California.
SBG Systems is a supplier of miniature, high-performance and innovative motion sensing solutions. SBG Systems headquarters are based in Rueil-Malmaison, France.
Its California office has an additional 10,000 square feet. “We will be able to offer better delivery times, more convenient meeting facilities to meet our customers, and more space to allow our U.S team to keep growing,” the company stated in a press release. “The location allows more proximity with our customers in this highly economically dynamic area.”
New address and contact information:
SBG Systems North America, Inc.
5932 Bolsa Avenue, Suite #103
Huntington Beach, CA 92649
United States
ABI Research’s competitive analysis evaluates GNSS IC vendors across innovation and implementation parameters
The GNSS market is slowly shifting in new directions, according to ABI Research. While the smartphone market continues to grow, new opportunities are also emerging in automotive, insurance, wearables, unmanned aerial vehicles (UAVs) and the Internet of Things (IoT).
Overall, the GNSS market is forecast to continue to grow strongly, with ubiquitous location and market-specific IC design as key differentiators.
In its latest competitive analysis of GNSS IC vendors, ABI Research evaluates a variety of innovation and implementation parameters to determine emerging competitive threats and technologies, the companies best positioned for success and those in danger of losing out.
Unchanged for the past three years, the market’s two top IC vendors remain Qualcomm and Broadcom, soon to be acquired by Avago. Both companies continually illustrate the ability to lead the way on cutting-edge innovation, which in turn drives their dominant market-share position, ABI Research said.
Beyond just GNSS, both companies also offer comprehensive location technology platforms in HULA (Broadcom) and Izat (Qualcomm), which will enable smartphone OEMs to begin offering ubiquitous location in 2016. Qualcomm’s work on LED/VLC and LTE Direct illustrates the gap that now exists between it and pure-play GNSS IC vendors.
u-blox, a well-established GNSS IC company, has shown continuous growth each year by implementing new technologies and making acquisitions, culminating in its first ever third place ranking, ABI Research said. The company continues to lead the way in its core markets, while also expanding into the emerging IoT space.
“The big surprise this year has been MediaTek dropping to fourth place,” said Patrick Connolly, principal analyst at ABI Research. “This is primarily due to a lack of new GNSS or indoor location products. However, this did not affect its IC market share, or its ability to win an important GNSS IC win with Fitbit in wearables. MediaTek has a history of delivering when its customers need new innovation. As a result, ABI Research expects new product announcements from the company in 2016, especially around indoor location.”
Ranking fifth, STMicroelectronics is seeing customers migrate to its TESEO III platform. Its modular, high-performance approach should also enable it to move beyond its traditional markets of automotive and recreational/fitness, especially as it has begun to leverage the company’s expertise in sensor fusion.
As new opportunities for GNSS continue to develop in markets such as wearables, IoT, personal tracking and UAVs, there will also be a number of new or emerging companies looking to claim a share in the stakes. Analysis findings point to the Chinese regional market as one such area that has potential to demonstrate strong growth trends in future years.
“There’s big opportunity for emerging Chinese start-ups, such as CEC Huada, to meet new, indigenous, market demand over the next 10 years, while also working their way toward becoming major international competitors,” concluded Connolly. “Additionally, Galileo Satellite Navigation, an emerging company focused in software GPS, is reporting impressive results in trials. As consumer electronics start supporting software GPS, it will be interesting to watch whether or not it can achieve volume shipments in 2016.”
These findings are part of ABI Research’s Location Devices Service, which includes research reports, market data, insights and competitive assessments.
The Global Car GPS Industry 2015 Market Research Report is a professional and in-depth study on the current state of the car GPS market spread across 108 pages, profiling 21 companies and supported with 245 tables and figures. The report is divided into 13 major chapters that offer an overview of the current market, as well as forecasts for the car GPS industry.
The report provides a basic overview of the car GPS industry, including definitions, classifications, applications and industry chain structure. Analysis is provided for the international markets, including development trends, competitive landscape analysis and key regions’ development status. Development policies and plans of the car GPS industry are discussed and analyzed, as well as manufacturing processes and cost structures. This report also states import/export consumption, supply and demand figures, cost, price, revenue and gross margins.
The report focuses on major global players in the car GPS industry, providing information such as company profiles, product picture and specification, capacity, production, price, cost, revenue and contact information. Upstream raw materials and equipment and downstream demand analysis is also carried out. Industry development trends and marketing channels are analyzed. Finally, the feasibility of new investment projects are assessed and overall research conclusions offered.
With 245 tables and figures supporting the car GPS industry analysis, the research provides key statistics on the state of the industry and is a source of guidance and direction for companies and individuals interested in the market. Companies profiled include Coagent Electronic S&T Co. Ltd. (Guangdong), Denso (Tianjin), Soling Industrial (Shenzhen), Rotiss Electronics (Huizhou), Shinco (Jiangsu), Skypine Electronics (Shenzhen), UniStrong (Beijing), RoadRover Technology (Shenzhen), Bosch (Shanghai), Newsmy (Beijing), Pioneer (Shanghai), Wanlida Group (Xiamen), BDStar Navigation (Beijing), FlyAudio (Guangzhou), ChanghongIT (Sichuan), Saige GPS (Shenzhen), Panasonic (Beijing), Link Create (Shenzhen), Clarion (Dongguan), Alpine (Beijing) and Aisin (Tianjin).
A related study titled “2015 Deep Research Report on Global Vehicle GPS Industry” provides a basic overview of the industry including definitions, classifications, applications and industry chain structure. The vehicle GPS market analysis is provided for the China markets including development trends, competitive landscape analysis, and key regions development status.
With 147 tables and figures, the report provides key statistics on the state of the industry and is designed to be a valuable source of guidance and direction for companies and individuals interested in the market. The report focuses on China’s major leading industry players, providing information such as company profiles, product picture and specification, capacity, production, price, cost, revenue and contact information. Upstream raw materials and equipment and downstream demand analysis is also carried out.
Vehicle GPS industry development trends and marketing channels are analyzed. Finall,y the feasibility of new investment projects are assessed and overall research conclusions offered. Companies such as Garmin, TomTom, Cobra, GlobalSat, Jensen, Deeper, Dragonpad, PUMPKIN, Pupug, Pyle, Rand McNally, Raymarine, Soundstream, Sourcingbay, Stouch, Uniden, YINUO, Generic and Humminbird are profiled.
The ION GNSS+ 2015 Conference once again fielded a jam-packed agenda of papers on subjects from world-wide constellation updates, through GNSS integrity, indoor navigation demonstrations, multi-constellation/function chipsets, interference mitigation and jamming detection, privacy issues, and many other very interesting subjects. That’s GNSS+ in the conference name, as in “plus,” denoting the many other positioning, navigation, and timing technologies it covers.
Most papers contained advanced academic research, but there were also several new industrial releases. This year ION divided and clearly differentiated sessions between “System and Application Tracks,” that is, those with more direct industry content, and “Peer-Reviewed Tracks,” the so-called “pure” research.
As always, some of the most valuable takeaways of attending ION come from the numerous unrelated, off-the-record corridor conversations: an essential element, always spontaneous and much anticipated, but something that cannot be clearly identified nor put into the program.
The conference seemed to have around the same number attendees as last year with about the same number of exhibitors, even though a few of the big booths were missing. Paradoxically, some exhibitors privately said they did better and more business this year, even with fewer attendees, according to their estimates.
SPIRIT Navigation from Moscow did not have a booth, but Ruslan Budnik made sure to fill my notepad with lots about their technology, products and initiatives. They are among several companies working to add indoor navigation capability to smartphones, using existing onboard sensors and new intelligent software. Their solution concurrently uses multiple technologies including geomagnetic fingerprinting, pedestrian dead reckoning, and map matching, but does not rely on an installed beacon infrastructure. A Spirit app allows store operators to quickly map Wi-Fi and Bluetooth signals and collect a Magnetic field map which matches the floor plan of the store’s venue. Spirit claims an accuracy of around 1 meter, which Ruslan proceeded to demonstrate to me in the corridors around the ION meeting rooms.
Theplenary session on Tuesday night was very interesting with a presentation on the results of NASA’s planetary exploration over the last several decades, by Dr. James Green, NASA Director or Planetary Science. I learned a lot about our solar system; much more out there than one suspects, and much to be revealed in the next few years!
GPS World editor Alan Cameron once again led a preview of the planned sessions for the week, with each session chair constrained to a 5-minute rapid-fire presentation aimed at enticing as many attendees as possible. Interesting and somewhat humorous at the same time; we still got a flavor of what was to come in each track.
On Wednesday I was fortunate to be able to interview several show exhibitors. Some of these you will also find in video footage on the magazine’s website, speaking to you straight from the show floor.
Skydel is a relatively new exhibitor, working with Averna, both from Montreal, Canada. Averna makes signal analysis hardware on which Skydel installs software-based simulation of GNSS signals. Skydel’s objective is to be able to make their solution so affordable that every engineer could have one of these record and playback simulators on their desk, rather than having to schedule time on a central, shared multi-function simulator. An exciting new-entry product developed by an energetic group of people with a high level of ingenuity; hopefully they will succeed.
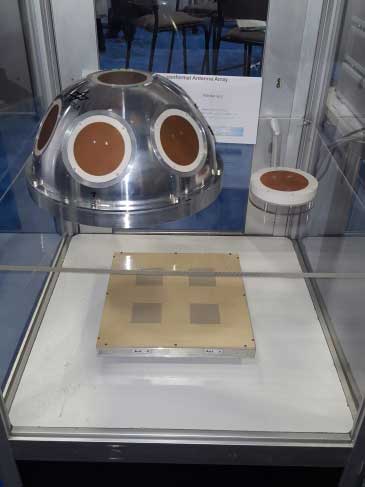
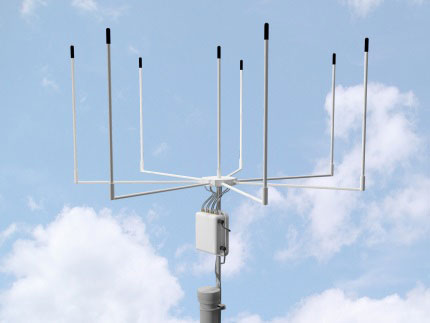
DLR antenna prototypes
A robust receiver initiative from Deutsche Zentrum für Luft- und Raumfahrt (DLR), the German Aerospace Center, aims to demonstrate that jamming and interference detection and mitigation can be achieved much more effectively than just at the RF level. Their processing goes deeper with such features as knowing that a source from a particular direction isn’t aligned with the current constellation, so it’s a jamming/interference suspect. Their conformal antenna development attempts to meld an antenna configuration with their signal processing capabilities. DLR is looking for partners to put these developments into commercial receiver applications.
ComNav has a new K700 family of receivers: K-700 GPS L1, Beidou B1 and Glonass L1 80 channel receiver — added to their K-708 dual frequency 198-channel dual-frequency version. The M300 Pro GNSS Receiver package includes a weather-hardened package, multiple interfaces which enable remote internet control and data access, memory and a rechargeable back-up power supply. ComNav claim the M300 Pro has been selected for the Chinese CORS network. ComNav also anticipates a name change in the near future: SinoGNSS will be their new company name.
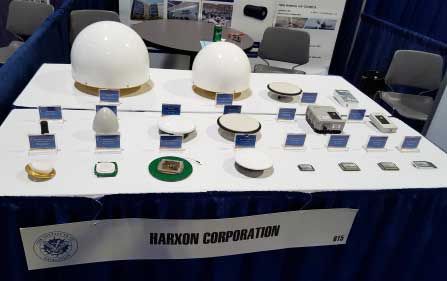
Harxon antennas and radiosUnicore UB370 Beidou/GPS/Glonass multi-frequency OEM receiver
Harxon gave us an overview of their wide range of antenna and radio products, while Unicore in the next booth described their single and dual frequency receivers which they are now promoting extensively in North America.
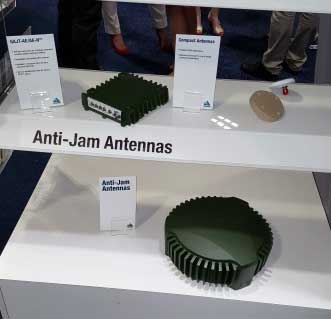
NovAtel GAJT antijam systems
As usual, NovAtel had a wide range of products on display. I was impressed that the mil-spec GAJT anti-jam product-line has now undergone testing by both the U.S. and Canadian military, and that the GAJT-AE is now flying and providing guidance protection in hostile jamming environments. Once again there were mentions of NovAtel receivers and antennas being used for research in several technical papers at the conference.
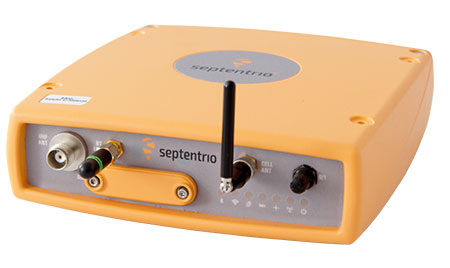
Septentrio continues to make further inroads into the high-precision GNSS receiver market, and announced several new key initiatives. The company has been selected by UNAVCO as the Geodesy Advancing Geosciences and EarthScope (GAGE) facility preferred vendor for next-generation GNSS reference station products. UNAVCO ( ) is a non-profit university-governed consortium, facilitating geoscience research and education using geodesy.
AsteRx-U dual antenna receiver
Septentrio is developing a next-generation reference receiver with UNAVCO’s inputs and evaluation feedback for the purpose of upgrading and renewing their GNSS networks. Septentrio also launched the AsteRx-U and the AsteRx-U Marine multi-constellation dual antenna receivers which incorporate the latest GNSS tracking and positioning algorithms and interference mitigation along with integrated UHF radio, Wi-Fi, USB, Bluetooth, cellular connectivity, and a spectrum analyzer which provides users with their interference profile.
Indoor Navigation
ION’s annual Indoor Navigation Demo session on Wednesday afternoon turned out to have more slides and pre-recorded testing content than actual demonstrations. The participants included Nokia HERE, Rx Networks, SPIRIT Navigation, TRX Systems, Broadcom, Indoors and Combain.
HERE was able to initially demonstrate some indoor tracking of an equipped cellphone, but the display for the audience appeared to quit after a short period. They did provide a link to allow attendees to download their software and try it for themselves.
Rx Networks is apparently focusing on self-location for indoor guidance assets, and ran a pre-recorded demo of ‘Zed’ in a Vancouver Mall – but the vertical tracking display part of the video was completely washed out for the audience.
SPIRIT Navigation ran a recording of the demo I had witnessed earlier – a quite effective, working indoor nav application on a smartphone – and then walked around the demo room, but wasn’t able to show real-time results.
TRX Systems ran a very effective real-time demo and was able to show the audience the path of their ‘walker’ as he meandered around the Conference Center, changed levels and eventually returned on cue to the demo room. They use crowd sourcing to build an initial map which then constrains sensor data from standard sensors, similar to several other presenters. This appeared to be the winning demonstration for this year’s indoor nav demo. We did hear later that they were not using sensors within the smartphone, rather a separate TRX device attached to the belt or the ‘walker’.
Broadcom ran an effective demo, albeit with considerable lag between actual and displayed position and frequent jumps between points, presumably due to the same delay problem. This was attributed to the display system used to present to the audience. They also ran a second short in-room demo which was more effective and more real-time, but apparently not as accurate as TRX from the displayed results.
Indoors also use ‘radio’ fingerprinting with GNSS data as a back-up, and Wi-Fi, BLE, magnetic and inertial data fusion along with dead-reckoning. Their recorded demo was quite effective.
Combain has a system which is required to be world-wide interoperable for machine-to-machine asset location, so they are focused on using cell and Wi-Fi IDs for navigation, with databases containing 64 million Cell IDs and 726 million Wi-Fi location IDs. They claimed accuracies of 200 meters for urban areas and 40 meters for rural. These accuracies are not suitable for indoor location so no demonstration was provided.
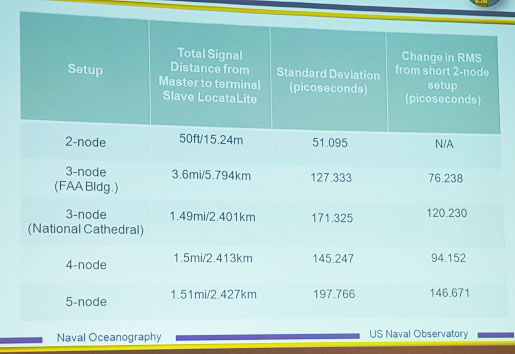
Pico-second test results (Click on the image to enlarge it.)Pico-second test results
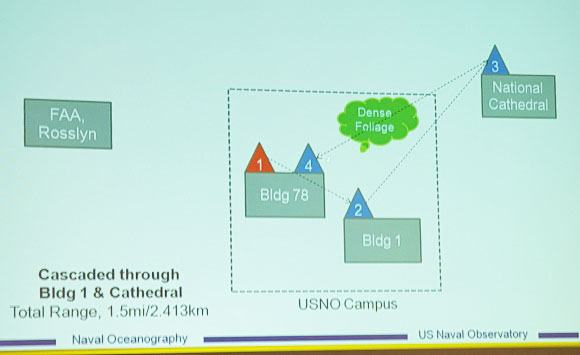
Later, I managed to catch a paper which Locata had recommended, which involved a number of Locata networks used by the U.S. Naval Observatory to demonstrate time and frequency transfer using the USNO Time Standard, with some highly accurate results: picoseconds! This paper forms the basis of GPS World magazine’s October cover story, providing more on these significant time-transfer and synchronization findings.
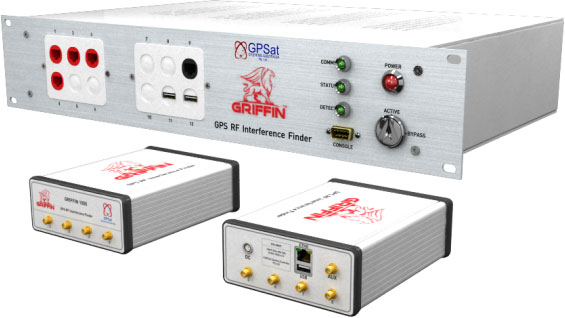
GRIFFIN Central Processor & Node Antenna Electronic Units
Another significant paper was presented in the Interference & Spectrum issues track. GPSat Systems Australia has been working for some time to implement a jammer/interference detection and localization system. The GRIFFIN 1000 system uses both Angle of Arrival (AoA) and Time Difference of Arrival (TDOA) to locate interference sources. GPSat claims that RF interference source in the GPS L1 band can be detected and geo-located to accuracies of a few meters within a few seconds. The system is already in production, with final production field testing underway, and customer deliveries scheduled for November.
Multi Element Antenna Array and Node Electronics
As ION GNSS+ came to a close for another year, it appears that this GNSS-centric conference is weathering the industry’s apparent preference for other sector shows which may draw new paying customers. ION’s academic/technical content was top-notch as usual, unparalleled anywhere, with attendees flocking to the papers, while existing customers still found comfort in meeting their suppliers on the show floor and around the corridors of the Conference Center. The formula still seems to work for now, but the apparent feeling on the floor was that better exhibitor payback may be found elsewhere, and that this could reduce ION participants in future years. Hopefully not, since this was a very good week for everyone with whom I talked.
The 316-page QYResearch Group report provides a basic overview of the industry including definitions, classifications, applications and industry chain structure. The GNSS market analysis is provided for the United States markets including development trends, competitive landscape analysis, and key regions development status.
Development policies and plans are discussed as well as manufacturing processes and Bill of Materials cost structures are also analyzed. This report also states import/export consumption, supply and demand figures, cost, price, revenue and gross margins.
The report focuses on leading industry players in the U.S., providing information such as company profiles, product picture and specification, capacity, production, price, cost, revenue and contact information. Upstream raw materials and equipment and downstream demand analysis is also carried out. The GNSS industry development trends and marketing channels are analyzed. Finally, the feasibility of new investment projects are assessed and overall research conclusions offered.
With 335 tables and figures, the report provides key statistics on the state of the industry and is directed at companies and individuals interested in the market.
The 2015 State of the GNSS Industry Report reveals the results of our annual survey of GNSS professionals, covering the state of their business, the economic climate for GNSS products and services, driving market factors, the government’s role in funding and regulating, budgets devoted to R&D, the effects of jamming, and the “Issue of the Year.” Download the 2015 State of the GNSS Industry Report.
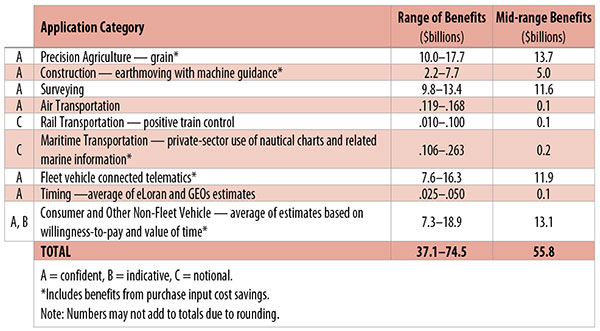
Table 1. Preliminary 2013 U.S. GPS economic benefit estimates. (Chart: GPS World, based on data from author)
This article is based on a presentation to the National Space-Based Positioning, Navigation and Timing Advisory Board in June 2015. The study reported on at the meeting was requested by the National Executive Committee for Space-Based Positioning, Navigation and Timing. It demonstrates the widespread use and importance of GPS to the U.S., with estimated benefits in 2013 of about $56 billion, or 0.3% of GDP for a subset of applications. The study is the first part of an effort that is expected to refine and extend this analysis.
By Irv Leveson
Critical to many civilian applications and innovations, GPS brings great economic benefits. These benefits have grown rapidly with the integration of GPS with other technologies and its wider and deeper infusion into applications. New GPS signals and other improvements in the system will further expand and enhance use. The unmistakable conclusion: GPS is everywhere.
Benefits of GPS to the U.S. will increase with the availability of other GNSS systems, even though GPS will constitute a smaller share of global GNSS benefits. The U.S. will continue to provide leadership, standards and innovation in technology and applications with positive domestic feedback.
GPS and other GNSS and enhancements raise productivity; reduce and avoid costs; save time; enable improved and new production processes, products and markets; increase health and well-being; reduce injury and loss of life; improve the environment; and increase security.
The National Executive Committee for Space-Based Positioning, Navigation and Timing (PNT), which is responsible for maintaining U.S. leadership in GNSS, commissioned a study to assign a quantitative value to the broad economic uses of GPS. The purpose is to inform the public, federal decision makers and critical infrastructure owners/operators on the importance of GPS and the need to protect it from disruption. Assessing the economic implications of actions such as preventing or disallowing interference, spectrum reallocation, developing supplementary or backup systems and/or toughening receivers can be informed by value estimates and the data used to derive them. In addition, economic values can contribute to planning for GPS modernization and analysis of budgets. Baseline estimates facilitate comparisons with future developments. GPS benefit estimates will be “ballpark” no matter how sophisticated the methodology because of limits to the availability of information, but in many cases, knowing orders of magnitude is essential in choosing courses of action.
Widespread, Pervasive Impact. The technological environment is one of rapid changes in information and materials technology and integration of technologies at levels ranging from systems on a chip to large-scale systems. GPS is increasingly integrated with other technologies and systems that build on each other to achieve greater outcomes.
The U.S. Department of Homeland Security counts GPS as an enabling technology because of its crucial role in 14 of the 16 industries that are classified as part of the nation’s critical infrastructure. It is useful to view GPS’ role as being especially important in “enabling the enablers,” industries that particularly support the rest of the economy and are at the forefront of economic growth. The most notable of these are transportation, communications, power and financial services.
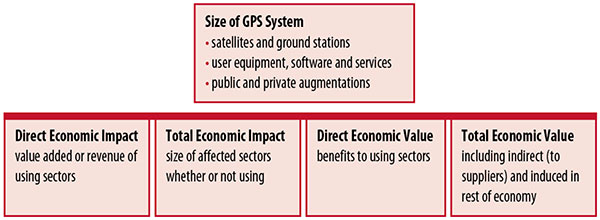
Economic Value versus Impact
Economic value is the addition to the value of the economy from the provision of a good or service, or the introduction of a technology. Benefits are measured relative to what would have been expected if there were no GPS. Direct economic value is the increase in value in using sectors. Total economic value includes increases in value to suppliers and value induced in the rest of the economy.
Direct economic impact, on the other hand, refers to measures of the importance of sectors that are using GPS. Total economic impact is the importance of sectors affected by GPS, whether they are using it or not. Total economic impact of GPS is virtually the size of the whole economy, so it is not very meaningful.
Direct economic impact is measured by value added of using sectors when the purpose is to avoid duplication among sectors that buy from and sell to each other. It may be measured by revenue for a single sector when adding sectors is not involved, so there is no need to avoid duplication.
The distinction between economic value and economic impact is critical. Even if economic impact is measured by value added rather than revenue, the value is not the net addition to the economy from the use of the product or technology. It is only the size of the using sector. See Figure 1.
Figure 1. Measuring GPS economic value and economic impact. (Chart: author)
The GSA Study
The most comprehensive estimates of global GNSS market size come from the European GNSS Agency (GSA), which has released four market reports from 2010 through 2015. The data are measures of economic impact and not economic value. The reports are of great interest because of their comprehensive global look at the sizes of markets and inclusion of forecasts. In contrast, the emphasis in this part of the present study is on current economic value, with U.S. benefits assessed for GPS.
One reason for interest in the GSA reports is that market information and projections often are proprietary and there can be great inconsistency across market research studies. GSA makes use of many confidential studies without revealing which sources contributed to each estimate. It apparently has been allowed to incorporate proprietary information from a number of market research firms since the data is subsumed in GSA’s own estimates and/or presented in graphs for which underlying numbers are not provided — and from which it is often difficult to even roughly extract them.
The 2015 report stated the methodology as: “The underlying forecasting model uses advanced forecasting techniques applied to a wide range of input data, assumptions and scenarios…Where possible, historical values are anchored to actual data.” Results were checked against opinions of market segment experts and market research reports. However, these analyses are not provided in the reports and have not been made available.
A distinction is made between the core market which covers the value of components that provide GNSS functionality in devices and enabled markets which “represent the services and devices enabled by GNSS.” The 2015 report provides global data on both core and enabled market and goes into much more detail on core markets for application sectors. In addition to providing sector information that did not appear previously, the 2015 report presents data on the extent to which each combination of the GNSS constellations was supported by receivers or chipsets offered by suppliers. Additional information on enabled sectors is in earlier reports.
GSA found in its 2015 market report that:
3.6 billion GNSS devices were in use globally in 2014, of which 3.08 billion were smartphones and .26 billion were for road.
North America had about 450 million devices installed (about 80% U.S.).
North America had 1.4 devices per capita in 2014.
North American shipments were 250–300 million in 2013.
Global core revenue was estimated at roughly €62 billion and enabled revenue at €227 billion in 2014. As noted, core revenue includes GNSS device components, software and services, while enabled revenue refers to applications.
Location-based services (LBS) was projected to account for 53.2% of 2013–2023 core revenue growth, and road for 38%.
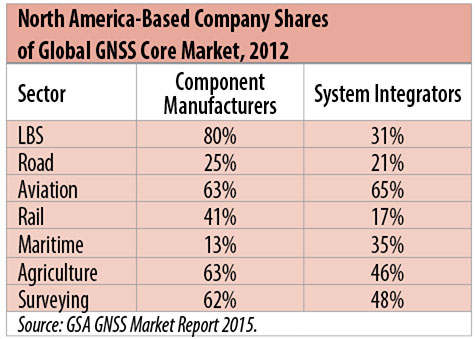
North American-based companies had sizeable shares of the global GNSS core market in 2012, particularly among component manufacturers. (See Table 2). Their market share among system integrators was highest in aviation.
North American-based companies had a 44% market share of value-added services revenue in 2012.
Table 2. North America-based company shares of Global GNSS core market, 2012. (Chart: author)
Markets and Applications
The pervasiveness of GPS-enabled applications is illustrated by the following statistics:
900 million mobile phones that incorporated GPS were sold globally in 2012.
The U.S. had 188 million smartphone subscribers and 263 million Internet users in 2013.
20% of U.S. mobile phone users get up-to-the-minute traffic or transit information.
The new industry category in the 2012 North American Industrial Classification System: “Internet publishing and broadcasting and web search portals” had U.S. revenue of $87 billion and 181,000 employees in 2012.
Google estimated that its search and advertising tools provided $111 billion in economic activity in the U.S. in 2013.
Deloitte estimated that Facebook enabled $104 billion of economic impact and 1.2 million jobs in North America in 2014.
Google Play and the Apple App Store each had more than 1.2 million apps in 2014.
How GPS Is Used. Uses of GPS include:
In agriculture for auto-steering tractors, combines and sprayers for precise operation, variable rate technology for precise placement of seed, fertilizer and pesticides, and for yield monitoring.
Managing forest health and ecological restoration, reducing fire and other hazards, and harvesting forest products.
In commercial fishing, navigation, finding fishing locations and monitoring fish catch by authorities.
In construction to direct the movement of dozers, excavators, pavers, scrapers, compactors and other heavy equipment and the placement of blades to give precise results.
In open-pit mining to guide loaders, dozers, drills and draglines.
In offshore energy exploration and development, for drilling, installations, pipe laying, diving operations, pipe inspection, repair and abandonment.
In surveying, to greatly reduce costs and to improve quality of products that rely on it.
In aviation, for navigation and monitoring positions of aircraft and for satellite-based augmentation systems (WAAS in the U.S.). GPS is the principal source for navigation for aircraft equipped with Area Navigation (RNAV) or Required Navigation Performance (RNP).
Railroad train pacing systems for cruise control, positive train control to keep track of train location and movement authorities, track defect location, and locating trucks with rail workers.
In marine transportation, for navigation, collision avoidance, communications and situational awareness and for monitoring by offshore authorities.
In vehicles, with handheld and embedded devices for navigation and fleet management.
For precise timing and time synchronization and frequency coordination (syntonization). It is used most notably in broadcasting and communications, including both cell phones and traditional telephone applications and the Internet, so packets arrive at the same time, for power generation and distribution to locate problems, and in financial services for time-stamping transactions.
In first responder services for location, navigation and communications and in emergency warnings and evacuations.
In structural monitoring of dams and bridges.
In environmental monitoring, including vegetation growth and sea-level change.
LBS and GIS
Rapid growth is taking place in location-based services (LBS) and geographic information services (GIS), which include everything from indoor location to many aspects of the Internet of Things and the “sharing economy,” and sophisticated systems for information management, analysis and display.
GPS is used for tracking and inventorying assets ranging from heavy machinery on farms and construction and mining sites, to pipes and other materials, containers in trucking sites and ports, and the location of utilities in the ground. In logistics it facilitates planning of product flow and transport.
The growth of same-day delivery — which takes advantage of Internet, cell phone, and location and navigation technologies enabled by GPS — is a continuation of the growth in just-in-time delivery that has been a phenomenon in manufacturing for several decades. Now it is having a profound effect on wholesale trade, retail trade and transportation.
The size of the LBS and GIS sectors is not defined and measured in a consistent way, and except for vehicle use, there is little information on productivity and saving in costs and time. (See sidebar box.)
LBS and GIS Market Size Estimates
For LBS and GIS, definitions and measures can vary greatly and often are not explicit.
Location-Based Services Market Size Estimates
Frost & Sullivan estimated the global LBS market at €22.8 billion in 2012 and forecast €32.0 billion in 2015.
Market and Markets estimated global LBS revenue at $8.1 billion in 2014.
Berg Insight estimated North American LBS revenue at $835 million in 2012.
(The U.S. can be assumed to spend 20–25% of the world value and about 80% of the North American value.)
Geographic information Systems Market Size Estimates
BCG estimated revenue of the U.S. GIS industry at $73 billion in 2011.
The global GIS market will reach $10.6 billion in 2015, according to a report of Global Industry Analysts in 2013.
The Canadian Geomatics study found private-sector spending of $2.3 billion in 2013. If U.S private spending was the same percentage of GDP, it would be $23.6 billion.
International Trade
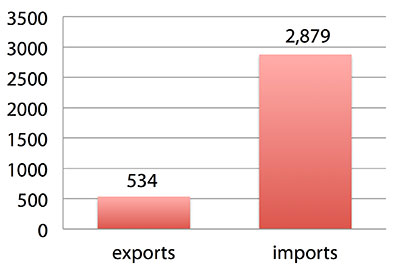
Official data show a $2.3 billion U.S. deficit in trade in GPS equipment in 2013. This gives an incomplete and misleading picture of the role of the U.S. and the benefits that result. See Figure 2.
Figure 2. U.S. trade in GPS equipment, 2013 (millions of dollars). (Chart: author)
The trade numbers for GPS equipment do not include revenue for licensing, international payments received by social media and e-commerce companies, or other Internet-based revenue for which the U.S. may have a substantial net trade surplus and which are an important source of revenue and profits of U.S.-based companies.
Imports of GPS equipment software and services enable the U.S. to gain more efficient production in many applications at home and enable the U.S. to export more goods and service that rely on GPS.
Exports of GPS equipment come back to the U.S. as components that benefit U.S. businesses and consumers with more capable products and lower prices. Exports of GPS equipment enable other countries to build on the technologies and contribute to innovation, while imports enable the U.S. to share in foreign innovations. Exports of GPS equipment and associated knowledge also raise incomes in other countries, creating larger markets for U.S. goods and services.
Scope of Benefit Estimates
The U.S. benefit estimates reported here are the result of an initial effort and are not meant to be comprehensive. More work is expected to be done to fill in some of the gaps.
Sectors were chosen based on availability of information to permit relatively robust estimates and importance to the economy or policy issues. These considerations limited the number of sectors for which estimates could be made. Methods were determined based on the nature of available studies and varied among sectors. Only economic benefits were included, with health and safety and environmental benefits left for later research.
Benefits include the value to users above their costs (consumer surplus). Benefits of GPS are compared with alternatives without GPS or an application using it (counterfactuals). Estimates are gross. They are not reduced by the costs of achieving the benefits. Contributions of augmentations are included, since a quantitative basis for separating them is not available.
Estimates were primarily benefits through productivity and cost savings in operations, with savings in input costs included where their magnitudes were clear. Benefits to the rest of the economy are not included. Illustrative allowances were made for the contributions of other technologies and systems to the outcomes examined.
In the case of GPS timing, the estimates were based on the costs avoided by not having to develop an alternative timing source on the assumption that the type of alternative source possible would have evolved from the time GPS became available. The measure does not represent the value of GPS time and synchronization to the nation and to users relative to the absence of a precise time and frequency source.
Government was included in the estimates for construction, surveying, and fleet and non-fleet vehicles. For timing and non-fleet vehicle benefits, two alternative measures are averaged. Sectors with lower quality estimates — rail and maritime transportation — were included because of their importance to the economy. Shares of benefits attributable to GPS were rough assumptions. More robust estimates would require extensive data collection and interviewing in studies greatly exceeding available time and resources.
The primary focus was on productivity improvements, cost savings and cost avoidance, where costs include users’ time. Productivity increases and cost reductions allow more to be produced with the same amount of resources in the sectors utilizing the technology or allow resources to be freed up for other purposes. In that sense, they are equivalent.
When benefits are measured by productivity gains or cost savings, much of consumer surplus (the value to users above what they pay) is implicitly included. Some sources measure value by willingness-to-pay. Willingness-to-pay includes consumer surplus. It also encompasses costs of the purchase and other costs incurred by the user.
Criteria for Selecting Sectors
The potential for making sector estimates of economic benefits was categorized in three basic levels:
confident: based on robust estimates.
indicative: based on one or more less robust estimates.
notional: illustrative, if major contributions of other technologies are not separated and estimates must be based on a plausible percentage of a larger benefit, or if information is not available and estimates must be based on a percentage of market size.
Choices among categories for estimation and estimation methods depended not only on which of the basic criteria are satisfied but also on the following additional criteria:
The importance of the sector to the economy, for example as an enabler of other activities.
The potential use of benefit estimates for the category as an input into analyses of the effects of signal disruption.
Several dozen studies were assessed to determine categories for inclusion and to select studies that can form the basis of estimation. Studies for use in estimation of benefits in a category were chosen according to how well they met the following criteria:
GPS. A test of introduction of GPS or comparison with and without GPS rather than benefits of a broader service.
Coverage. Estimates that cover a major part of the category.
Robustness of estimates, including the type of review the source is likely to have had.
Consistency. If alternative better estimates are not in such a wide range that an average is less meaningful except where explainable by expected sources of variation.
Timeliness. Preference to a recent period being covered by the estimates.
U.S. Economic Benefit Estimates
Preliminary estimates of economic benefits for included U.S. sectors totaled $55.8 billion in 2013. Averaging the alternative estimates, the sum of the benefits in the two vehicle categories is $25 billion, by far the largest of the sectors estimated. Next were agriculture with $13.7 billion, and surveying with $11.6 billion.
Economic benefits are underestimated for several reasons. Some sectors are not included because of lack of information on productivity and cost savings, namely LBS other than vehicle, including asset tracking and locating people; GIS and mapping other than nautical charts, forestry, fisheries, mining, energy exploration and development, land and coastal management, weather, and scientific applications and space.
Parts of others are not included: non-grain agriculture, construction other than earthmoving, GPS in aviation for some Area Navigation (RNAV) Standard Instrument Departure Routes (SIDs) and Standard Arrival Routes STARS) and Required Navigation Performance (RNP), and rail other than positive train control.
Some estimates are conservative. The value of saved time in non-fleet vehicle transportation is based on the recommendation of the Transportation Research Board rather than the much higher value used by the U.S. Department of Transportation.
Some types of benefits are not included — specifically, benefits of GPS timing applications above the cost of alternatives, and avoided income loss, property damage and medical costs associated with reduced accidents and improved emergency response.
Increases in benefits between 2003 and 2005 are not estimated.
And, as indicated, non-economic benefits such as those to health, safety, security, reduced loss of life and to the environment are not yet addressed.
Benefits as measured thus far are about 0.3% of GDP in one year. If all of the excluded sources of benefits were quantified, the benefits would be much larger.
Estimating Benefits for Sectors
U.S. economic benefits of GPS for grain farming were estimated for farms with grain sales of $250 million or more. The same method as was applied for earthmoving in construction.
A composite range of percentages of productivity gains and cost savings of 18–25% was determined from various studies. In the case of grain farming, benefits also come from yield increases due to improvements in plant health. The productivity gains used in the calculations incorporated both sources of benefits. Productivity was taken together with market size and an estimate of 68% adoption of technologies taking advantage of GPS to compute initial estimates of benefits. A notional adjustment was then made to exclude the contributions of other technologies and GNSSs. While having the adjustment determined by a group of experts would have been preferred, that was not possible with the time and resource constraints of the study.
Benefits of GPS machine guidance with earthmoving in construction were calculated based on an 8–12% share of construction for earthmoving operations, a benefit of 18–22% and a 20–25% adoption rate, relying on a number of sources.
For surveying, an estimate of market size was constructed based on U.S. Bureau of Labor Statistics data on numbers of surveyors, cartographers and photogrammetrists in the engineering services industry vs. the rest of the economy, together with revenue data for private surveying and mapping from the Economic Census. This was combined with a composite estimate of productivity gains over conventional surveying of 45–55% and an assumption of 100% adoption.
The benefit values for air transportation were estimated for the study by the Federal Aviation Administration (FAA) based on effects of WAAS and performance-based navigation (PBN). The rail estimates cover only positive train control, which is in early stages of implementation. Information is highly uncertain, but impacts as of 2013 are small. Maritime benefits were based on updating an earlier estimate of benefits of the private-sector value of nautical charts. The estimates for fleet vehicle-connected telematics were based on savings found in an extensive survey of fleet customers over a five-year period.
Timing benefits were based on the avoided costs from not having to develop an alternative source of timing. Alternatives considered were eLoran and a system of three geostationary satellites. Since there would have been strong pressures to develop an authoritative timing source in the absence of GPS timing, it was assumed that one of the alternatives would have been developed rather than assuming as in other cases that technologies in use when GPS became available would have continued in use.
Two estimates also were made for consumer and other non-fleet vehicle use. One was based on extrapolating results of a study of consumer willingness to pay for navigation services, and the other on time saved by navigation services.
Part of the benefits of LBS other than those that are vehicle-related and for GIS are implicitly included in estimates for sectors that use them.
Data and Research Needs
Additional work would be desirable to extend and refine the GPS economic benefit estimates, quantify safety-of-life and environmental benefits, examine international benefits, assess potential future benefits and consider loss from denial of GPS. Benefits of many new and rapidly growing services are yet to be quantified.
Systematic research is needed to fill in gaps in adoption, productivity and cost savings with comparative before-and-after studies as well as with case studies. Robust studies require major and often multi-year efforts involving targeted data collection, which are rarely done by government or academics for GNSS. Information needs to be much more granular, taking into account specific functions in which GNSS is used (such as plowing, seeding, fertilizing, harvesting), specific GNSS and non-GNSS technologies employed in each function at each site, and extent of their use.
Also, results for GPS might be improved or at least be more acceptable if the contribution of other technologies and GNSSs to measured benefits were assessed by a group of knowledgeable individuals rather than by a single researcher.
Information on market size, penetration and growth from market research firms, which tends to capture recent developments, is based on greatly varying sources and methods, resulting in major gaps and great divergence in estimates, especially in new or rapidly growing areas like LBS and GIS. The North American Industrial Classification System (NAICS) and its application in federal data collection such as in the Economic Census lags far behind in recognizing new categories and providing sufficient detail. Lags in data collection and research lead to understatement of the use and benefits of GPS.
Looking to the Future
Future benefits are expected to be even greater because of evolution of technologies, expansion of GNSS systems, creation of new products and markets, and growth and penetration of markets. The possibilities are suggested by the numerous nascent applications that have been emerging. Many will be enabled by expanding GNSS systems, signals and capabilities in conjunction with geographic expansion and increased capabilities in wireless systems.
The progression of platforms is long and growing: mainframes, PCs, mobile phones and other handheld devices, tablets, game controllers, wearables, TVs, home appliances, air and space — including planes, UAVs, satellites, planets, moons, rovers, rockets and spaceships.
The widespread availability of platforms and the growing ability to utilize them promises a long way to go in developing applications and deriving benefits.
Acknowledgments
The author thanks the PNT Advisory Board and Gov. Jim Geringer, liaison from the board to the study; Jason Kim of the Department of Commerce who oversaw the project; Jim Miller of NASA; and the members of the interagency Economic Study Team that advised the effort. Numerous additional people in and out of government provided information and assistance. Responsibility for the content and findings rests with the author.
IRV LEVESON, who has a Ph.D. in economics from Columbia University, is an economic and strategy consultant and founder of Leveson Consulting. He has done extensive work on GNSS markets and issues for more than 10 years. He is a member of the Institute of Navigation, the American Economic Association and the National Association for Business Economics.
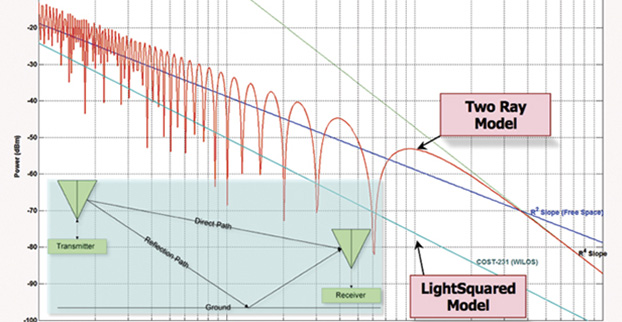
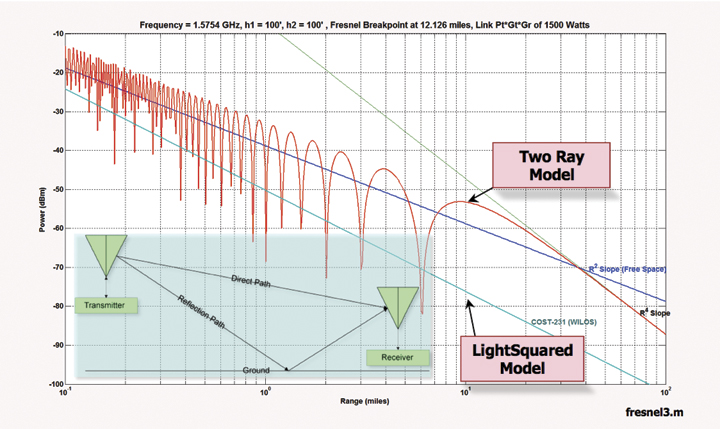
Figure 1. LightSquared propagation models can underestimate interference by more than a factor of 100 (>20 dB). Two-ray models accounting for ground reflections show LightSquared signals at levels 6 dB above free space predictions several miles out. (Figure from August 2011 GPS World.)
The GPS Innovation Alliance has responded to recent media reports on LightSquared’s position regarding the testing of the compatibility of terrestrial broadband and GPS.
LightSquared is asking the GPS industry to participate in new tests on interference between LightSquared’s spectrum and GPS receivers or waive its right to complain, according to a lawyer representing LightSquared.
Following is the GPS Innovation Alliance’s response:
“The GPS Innovation Alliance (GPSIA) supports a consensus-driven process, including all government and non-government stakeholders, to clearly identify and address remaining technical issues raised by LightSquared proposals to repurpose mobile satellite spectrum for terrestrial broadband use.
“The technical challenges posed by these proposals are formidable, as evidenced by the conclusions of multiple U.S. government entities. Specifically, the U.S. Departments of Defense and Transportation and the NTIA have all found in the last several years that LightSquared’s proposals have significant potential to interfere with GPS.
“Contrary to LightSquared’s recent suggestions, this is not simply a private matter between three GPS companies and LightSquared, but is important to all GPS users who rely on this critical technology every day. The Department of Transportation has sponsored an ongoing effort to assess adjacent band issues, and the GPS industry is actively engaged with the FCC, DOT and other government stakeholders to drive consensus around next steps.
“While we welcome the participation of LightSquared consultants, any further analysis of the technical issues should be informed by input from all of the relevant stakeholders, rather than the one-off efforts of an interested party.”
In a filing last week with the FCC, LightSquared listed 28 different GPS receivers and related devices that it wants to test for interference with its terrestrial mobile broadband service. The devices include certified and non-certified aviation receivers and avionics equipment, general location, cell phones and 13 different high-precision clocks and receivers.
The United States will reach one million unmanned aircraft systems (UAS) flights per day within the next 20 years, given the right regulatory environment, according to new economic research from the Consumer Electronics Association.
Brian Markwalter, senior vice president, market research and standards, CEA, shared the association’s domestic UAS economic analysis at the Unmanned Systems 2015 Conference in Atlanta, Ga.
“This is a billion-dollar technology market literally just waiting to take off,” Markwalter said. “We see a dynamic market with tremendous growth potential, once we have final Federal Aviation Administration (FAA) rules to allow commercial UAS operation, combined with continued industry and FAA cooperation to achieve low-risk, beyond-line-of-sight flights.”
“With the right regulatory environment, drones will be safely integrated into our transportation system — displacing noisy trucks, reducing urban traffic, cutting our fuel consumption and carbon emissions,” said Gary Shapiro, president and CEO, CEA. “This will allow for game-changing innovations such as the quick delivery of life-saving diagnostics and medicine, improvements in crop production and efficiency, and safer work environments for those who inspect and maintain our buildings and bridges.”
According to the CEA research, the U.S. UAS market is indeed growing, but risks falling behind in the global market because of fewer or more progressive regulations in other countries. In fact, as the U.S. awaits further FAA rules regarding the commercial use of UAS, CEA’s research estimates a pent-up market demand of $150-$200 million in UAS sales for “line of sight” operations.
Only hobbyists and the do-it-yourself community now are allowed to fly UAS in the U.S., enough to fuel a robust U.S. consumer market with the potential to reach $250 million by 2018. However, if the FAA remains on track to complete its line-of-sight rules for commercial operators within three years, CEA’s research foresees another $200 million in growth. Additionally, with the continued development of “sense and avoid” technology and FAA rules that foster “beyond-line-of-sight” operations, the United States’ UAS industry could become a $1 billion market.
“The ability for beyond-line-of-sight is the true game changer—opening the door to autonomous UAS operation and unleashing a remarkable economic potential,” said Markwalter. “The United States has a long history of being a technology leader—and we’ve led the world at almost every stage of flight innovation. But we have more work to do on UAS. Realizing these economic gains will require ongoing FAA and industry cooperation, as well as a commitment to the necessary infrastructure.”
CEA market research expects 2015 to be a defining year for unmanned systems, with the category ideally positioned for steady growth. According to CEA projections, the global market for consumer UAS will approach $130 million in revenue in 2015, increasing by more than 50 percent from 2014; with unit sales of consumer UAS expected to approach 425,000, an increase of 65 percent.
“Right now, more than six billion packages are delivered every year in the U.S., weighing less than three pounds apiece on average — perfect candidates for drone delivery,” said Markwalter. “The autonomous operation of UAS for the delivery of everyday items would not only lower the cost for consumers and improve delivery times, but also be a significant driver of our tech economy.”
This year CEA debuted the Unmanned Systems Marketplace at the 2015 International CES, with 15 UAS companies — almost four times as many as last year — covering 7,600 square feet of exhibit space. At CES, Shapiro announced CEA’s support of the UAS safety campaign “Know Before You Fly,” which provides prospective UAS operators with the information and guidance they need to fly safely and responsibly.
Annual revenues from connected healthcare and fitness services will approach $2 billion by 2019, nearly six times the $320 million value estimated for this year, according to a report from Juniper Research.
The report, “Smart Wireless Devices: CE, Enterprise, Fitness, Healthcare, Payments 2015-2019,” says that connected healthcare devices and the data they generate will offer substantial benefits to both stakeholders and consumers, potentially improving preventative healthcare. However, deployments will initially be constrained by inconsistent regulation, alongside continued privacy concerns surrounding the sharing and security of personal data.
‘Quantified Others’ are Key
The research highlights the “quantified others” trend: the use of someone’s data by a professional or concerned party — such as a parent — to provide meaning and/or advice. Companies like GOQii and Filip Technologies are using this to provide services beyond mere data provision.
Although, this has the potential to be undermined by unreliable data. While medical devices have validation standards, fitness devices have no such benchmark. The development of standards would alleviate consumer and medical professionals’ concerns, driving up adoption.
Software to Drive Connected Devices Forward
“Connected fitness and health devices provide a way to collect biometric data, not interaction platforms,” said author James Moar. “People want to interact with the devices at the app level – the draw is the information. Because of this, and the omnipresence of sensors, the importance of the hardware will diminish at a much faster rate than other CE market segments.”
Other Findings from the Report
Other findings were mentioned in a news release from Juniper Research, and are listed below:
“Smart Wireless Devices will permeate the enterprise, with smart glasses in particular having a large impact.”
“Mobile point-of-sale devices are poised to take off in developing markets, with several key players looking to move into Latin America and Asia Pacific in the coming years.”
“Smartwatches will be the most popular consumer electronics connected devices, overtaking more established wearable cameras.”
The white paper, Smart Wireless Devices & the Internet of Me, is available to download from the Juniper website together with details of the full research and the Interactive Forecast Excel (IFxl).