M-code receiver enhances security, positioning, navigation and timing capabilities
The U.S. Air Force recently completed a series of successful flight tests of its next-generation military-code GPS using a Raytheon Company receiver onboard a B-2 Spirit at Edwards Air Force Base, California.
This first M-code test onboard the B-2 is an important milestone for the U.S. government-led GPS modernization effort to enhance security, positioning, navigation and timing capabilities for U.S. military and civilian applications.
Military GPS user equipment (MGUE) M-code receivers will give military aircraft, ships and ground vehicles access to the modernized GPS network.
“M-code receivers unlock the next-generation GPS network for military users,” said Rick Yuse, president of Raytheon Space and Airborne Systems. “This test demonstrated M-code capability onboard the B-2 for the first time, marking an early milestone for the overall GPS modernization effort.”
The tests verified the integration of an MGUE-equipped risk reduction prototype of Raytheon’s miniaturized GPS airborne MAGR-2K-M receiver with B-2 systems in representative flight and mission profiles.
Raytheon is developing M-code receivers under a contract with the USAF Global Positioning System Directorate GPS User Equipment Division. The company is also under contract with the USAF Joint Service Systems Management Office to qualify and certify the MAGR-2K-M and deliver production representative units to support platform integration and testing.
When a platform’s mission requires maneuvering among different environments, transitions between these environments may mean that a single method cannot solve the full positioning, navigation and mapping problem.
This article describes an integrated navigation and mapping design using a GPS receiver, an inertial measurement unit, a monocular digital camera and three short-to-medium range laser scanners.
By Evan T. Dill and Steven D. Young, NASA Langley Research Center, and Maarten Uijt de Haag, Ohio University
An unmanned aircraft system (UAS) traffic management system (UTM) is an ecosystem for coordinating UAS operations in uncontrolled airspace, particularly operations under 400 feet altitude involving small- to mid-sized vehicles. In this domain, information services regarding the state of the airspace will be provided to UAS operators.
In addition, UTM would coordinate and authorize access to airspace for particular time periods based on requests from the operators. The Federal Aviation Administration would maintain regulatory and operational authority, and may for example, issue changes to constraints or airspace configurations to operators via this information service. However, there is no direct control from air traffic control personnel (such as “climb and maintain 300 feet” or “turn left, heading 150”).
As with visual flight rules operations of manned aircraft in uncontrolled airspace, under UTM the onus is on the vehicle operator to assure the flight system provides adequate performance with regard to communication, navigation and surveillance during flight. The vehicle/operator is responsible for avoiding other aircraft, terrain, obstacles and incompatible weather. UTM information services do not yet include, for example, information from an alternative positioning, navigation and timing system that may be needed for operations conducted in GPS-degraded environments (such as near buildings or other structures). This is the challenge being addressed by the integrated navigation concept described in this article. Other concepts are also being considered and developed for alternate, and unique, UAS missions and flight environments.
The method presented here employs a monocular camera as part of a multi-sensor solution that continuously operates throughout and between outdoor and structured indoor environments. For this work, an indoor environment is considered “structured” if its walls are vertical and remain approximately parallel, while the floor is either roughly flat or slanted.
In this type of environment, GPS is typically only sparsely available or not available at all. Hence, in our proposed navigation architecture, additional information from a camera and multiple laser range scanners (not the focus of this article) are used to increase the system’s positioning, navigation and mapping availability and accuracy in a GPS-challenged indoor environment. Figure 1 shows the target operational scenario, and Figure 2 the equipped multi-copter used in this research.
Figure 1. Operational scenario: open-sky environment, transition to indoor and indoor environment.Figure 2. Hexacopter sensors and sensor locations.
Figure 3 shows a block diagram for the methodology implemented in this research, with the elements related to monocular camera methods highlighted. When assessing the capabilities of each of the sensors used in the work, only the inertial sensor produces data that is solely dependent on the motion of the platform and local gravity and is more or less unaffected by its surroundings. Therefore, the inertial is chosen to be the primary sensor for this method.
The mechanization integrates the measurements from GPS, the laser scanners and the monocular camera through a complementary Kalman Filter (CKF) that estimates the errors in the inertial measurements and feeds them back to the inertial strapdown calculations. For this inertial error estimation method to function properly, pre-processing methods must be implemented that relate the sensors’ observables to the inertial measurements.
Here we describe the processing techniques necessary to relate measurements from a monocular camera to measurements from the inertial measurement unit (IMU). Then we show how these techniques are used in the broader GPS/optical/inertial mechanization and present testing results.
Figure 3. Monocular camera components of a broader mechanization.
2D Monocular Camera Methods
To process data from the camera, we first perform feature detection and tracking of both point features and line features. Specifically, elements from Lowe’s Scale Invariant Feature Transforms (SIFT) are used to track point features, which are in turn used to obtain estimates of the camera’s rotational and un-scaled translational motion using structure from motion (SFM) based methods. To resolve the ambiguous scale factor, a novel scale estimation technique is employed that uses data from the platform’s horizontally scanning laser. This technique as well as algorithms that produce a 3D visual odometry solution are presented below.
SIFT Point Feature Extraction. To aid in determining camera motion, SIFT has been used as a way of identifying local features that are invariant to translation, rotation, and image scaling. This technique yields 2D point features that are unique to their surroundings and readily identified and associated across a set of sequential camera images. Each key location and its surroundings are analyzed, resulting in a descriptive 128-element feature vector, known as a SIFT key. Example results of the SIFT key identification process are shown in Figure 4.
Figure 4. SIFT feature identification.
Based on the results of the SIFT feature extraction process from two image frames, a feature association function is performed using the feature vectors. For this work, a two-step procedure is implemented.
First, SIFT keys are associated using a matching procedure. Example results of this process are shown in Figure 5, where it can be observed that incorrectly associated features may result from this process. To remove these artifacts, inertial measurements are utilized to ensure the correctness of the associations.
Figure 5. SIFT matching results between consecutive image frames.
Using a triangulation method, prospective associations are used to crudely estimate each feature’s 3D position with respect to the previous frame. While this triangulation method yields 3D data, it is of poor quality, and is therefore only used to obtain rough approximations that are sufficient for association purposes, but insufficient for navigation purposes.
Once transformed to a 3D reference frame, the projected distances of each feature are compared with one another, and prospective associations that produce significantly different depths than surrounding points are eliminated. Example results of this filtering process can be seen in Figure 6.
Figure 6. Point feature association after inertial based miss-association rejection.
In future implementations, the ORB feature will be evaluated, as its performance is expected to be more than two orders of magnitude faster than SIFT.
Wavelet Line Feature Extraction. To implement the scale factor estimation technique described in a later section, it is necessary to first extract and track vertical line features. To accomplish this, a method using wavelet transforms (WTs) was developed. When applied to a 2D image, WTs can be viewed as filters operating in the x and y directions of an image. By applying either a high- or low-pass filter to both of an image’s channels (that is, x and y directions), four sub-images are formed to represent an image approximation. For this work, a level-one bi-orthogonal 1.3 wavelet was used to decompose each image. An example of the four sub-images produced by this wavelet is shown in Figure 7 along with the original image.
Figure 7. Example results of wavelet decomposition.
Through further processing of the vertical decomposition results, strong line features are identified by first inspecting the illuminated elements along the vertical channels of the decomposed image and identifying clusters of adjacent pixels. Next, a 2D line fit is applied to the groups to estimate residual noise. Pixel collections with low residuals (<3 here) are considered valid line features. Example results of this process are shown in Figure 8.
Figure 8. Example vertical line extraction results.
For association purposes, lines cannot be compared over a sequence of image frames solely based on location as similar line features may not necessarily possess the same endpoint, and, therefore, can be of varying lengths. However, corresponding lines will possess many common points and similar orientations if they are projected into the same frame. Using the inertial reference frame, each line’s orientation, , can be transformed across image frames as given by:
In this manner, lines between frames that contain multiple similar points and have comparable orientations are considered associated.
For a discussion of the projective visual odometry and epipolar geometry methodology as well as the resolution of true metric scale used in this work, download the supplemental PDF.
Metric Scale. As the unscaled translation estimate calculated through the aforementioned visual odometry method is a unit vector, it only indicates the most likely direction of motion of the camera. To obtain the sensor’s actual translational motion, an estimate of the scale factor, m, is required to determine the absolute translation ∆r. This can be accomplished through techniques using a priori knowledge of the operational environment or measurements from other sensors. In this research effort, a new method is employed that makes use of data provided by a horizontally scanning laser.
The proposed method estimates the scale in an image by identifying points in the environment that are simultaneously observed by the camera and the forward-looking laser range scanner.
To enable this estimation method we must identify the correspondences between the pixels in the camera images (each defined by a direction unit vector corresponding to the row x and column y) and the laser scanner measurements (each defined by direction unit vector). A calibration procedure establishes these correspondences. Given the laser range measurements, 2D features located on the scan/pixel intersections can be scaled up to 3D points.
Unfortunately, extracted 2D point features are rarely illuminated by a laser scan in two consecutive frames. This can be resolved by considering the intersection of a laser scan with 2D line features rather than point features. As the laser intersects the camera frame at the same location regardless of platform motion, and the platform does not make excessive roll and pitch maneuvers, vertical line features in the image frame are preferred as they will be relatively orthogonal to the laser scan plane.
Using the previously described vertical line extraction procedure, Figure 9 shows an example image frame overlaid with the points in the image frame illuminated by the laser (indicated by a blue line) and the extracted vertical line features (indicated as green lines). Multiple intersections of 2D vertical lines with laser scan data are calculated (indicated as red points). Inversely, Figure 10 depicts the location of all laser scan points in green, all laser points observable with the camera field-of-view (FoV) in blue, and intersection points in red.
Figure 9. Image frame overlaid with points; Laser (blue), vertical line features (green), multiple intersections (red).Figure 10. 2D vertical line and laser intersections in laser scan data.
For scale factor calculation purposes, it is necessary to track the motion of these 3D laser/vision intersection points, across sequences of camera image frames. As each intersection point uniquely belongs to a line feature in the 2D image frame, it can be stated that if two lines are associated, their corresponding intersection points are also associated. Using the rotation computed from the visual odometry process, the line association method described by (1) is implemented, and provides associations between laser/vision intersection points across frames.
To calculate the desired scale factor based on these associated laser/vision points, geometric relationships are established: unit vectors from the camera center to points located on a 2D line. From these, the line’s normal vector can be derived.
Monocular Camera Results
To assess the performance of the visual odometry processes, multiple experiments were conducted. The results of one such test are discussed here. During each test, the visual odometry results for rotation, shown in blue, were easily evaluated through comparison with the platform’s inertially-measured rotation, displayed in red.
The rotational results for each sensor were decomposed into the Euler angles: pitch, roll and yaw with respect to an established navigation frame. Unfortunately, the inertial sensor itself cannot be used to evaluate the visual odometry translation results due to relatively large inertial drift in the sensor measurements. As no independent measurements were available to evaluate translation with high precision, the truth reference was established by accurately measuring the actual paths taken during each flight.
A test flight was conducted traversing a rectangular indoor hallway loop. This test contained translation in multiple dimensions, large heading changes and a flight duration of four minutes. Moreover, this test allowed for evaluation of the eight-point algorithm and scale estimation method in the presence of rapid scene changes.
The attitude estimation results for this test are shown in Figure 11. Throughout data collection, the maximum separation between the inertial and vision-based attitude estimators for pitch, roll and yaw was 9°,19° and 14°, respectively. Upon comparison to many of the other conducted tests, the maximum attitude errors were larger. There are multiple reasons for this increase. First, the duration of this experiment was greater than that of previous experiments. Errors accumulate as a function as time due to integration of residual bias errors, so increasing flight duration will increase cumulative error.
Next, the looping path observed throughout this test caused the eight-point algorithm and scale estimation procedures to quickly adapt to differing scenery. Drastic scene changes (turning a corner) increase the difficulty of feature association between frames. This directly affects the procedures used for visual odometry in an adverse manner. Finally, there are situations in this flight where features are sparse. In general, a decrease in features will cause a decrease in the estimation capabilities of visual odometry.
Figure 12 shows the visual odometry path calculated for experiment 2. Here, the estimated length of each of the four straight legs of the rectangular loop matches to within 2 meters of the measured hallway lengths. This implies that the scale estimation technique is working reasonably well.
Figure 12. Visual odometry path determination while traveling around an indoor loop.
As for the estimated translational directionality produced by the eight-point algorithm, the first two legs of the loop never divert from the measured path by more than 2 meters; the third leg diverts by 5 meters. This is most likely due to a lack of well dispersed features in that specific hallway.
The cumulative error contained in the third linear leg of the loop also makes evaluation of the final leg difficult. However, if previous errors are removed, the final leg appears to match the measured path well. In total, the landing position calculated through visual odometry is 6.5 meters away from the measured end of the trial.
Integration Methodology
In cases where GPS measurements are available along with the visual odometry solution, the proposed method can extend the GPS/IMU integration mechanization. The structure of the referenced GPS/inertial integration consists of two filters: a dynamics filter that uses GPS carrier-phase measurements to estimate velocity and other IMU errors, and a position filter that uses the velocity output of the dynamics filter and GPS pseudoranges. The dynamics filter can be adapted and extended to include camera data within its mechanization.
The dynamics filter is a CKF designed to estimate the inertial error states: velocity error in the north-east-down (NED) coordinate reference frame, misorientation (including tilt error), gyro bias error, and specific force or accelerometer bias error. This yields a state vector. For a discussion of the state vector, download the supplemental PDF.
Results
To evaluate the proposed algorithms, data was collected through multiple flights of the hexacopter platform shown in Figure 2 through a structured indoor and outdoor environment including transitions between these two environments. The availability of GPS measurements in these environments ranged from fully denied, to substantially degraded, to enough observables for a full solution.
The results of one test flight are discussed in this section. Apart from the data collections with the hexacopter, truth reference maps were created for the indoor operational environment and used for evaluation of the described processes. The results of the full GPS/inertial/laser/camera integrated solution described in Figure 3 are shown in an NED frame in Figure 13.
Figure 13. Path compared to 2D reference map.
The truth reference of the environment, depicted in red (derived from a terrestrial laser scanner), is compared to the flight path obtained from the extended Kalman filter (EKF), displayed in blue. The estimated flight trajectory constantly remains within the hallway truth model, indicating sub-meter level performance. Furthermore, based on an extension of this work for environmental laser mapping produced from the EKF, combined with the accuracy of the map, it is further reinforced that sub-meter-level navigation performance is obtained.
During portions of the described data collection, there was enough visibility (>3 satellites) to calculate a GPS position. The availability of GPS measurements to the position estimation portion of the filter allowed for geo-referencing of the produced flight path and 3D map.
Figure 14 displays the geo-referenced continued flight path based on the integration filter superimposed on Google Earth on the left, while the standalone GPS solution based on pseudoranges only is plotted on the right. The geo-referenced path correctly displays the platform passing through Stocker Center, the Ohio University engineering building.
To demonstrate the contributions of the monocular camera to the above results, laser measurements were removed from the solution for a 20-second period where GPS was unavailable. During the 20-second removal of laser data, the system is forced to operate on integration between visual odometry measurements and the IMU. The cumulative effect caused by this situation can be observed in Figure 15. After coasting on an IMU/camera solution for 20 seconds, the path is subsequently altered by 3 meters, as opposed to the solution with all sensors.
Figure 15. Effect of losing GPS and lasers for 20 seconds.
To further emphasize the contribution of the visual odometry component, both the laser and camera were removed from the integration for the same 20-second period. During this time frame the EKF is forced to coast on calibrated inertial measurements. The effect of losing all secondary sensors for a 20-second period can be observed in Figure 16.
Figure 16. Effect of coasting on the IMU for 20 seconds.
During the forced sensor outage, a 45-meter cumulative difference is introduced between the path using all sensors and the path with denied sensors. Through comparison of the results shown in Figure 15 and Figure 16, the contribution of monocular camera data can be isolated.
When the EKF was forced to operate for 20 seconds using an IMU/camera solution, 3 meters of error were introduced. This is significantly smaller than the 45 meters of error observed when using only the inertial for the same period. Thus, the camera is shown to provide stability to the EKF when neither the laser nor GPS are available.
Conclusions
The visual odometry techniques produced reasonably good attitude estimation and are effective at constraining inertial drift when other sensors are not available. The inclusion of camera measurements to the discussed integrated solution resulted in increases in the accuracy, availability, continuity and reliability of the system.
Acknowledgment
The material in this article was first presented at the ION Pacific PNT conference in Hawaii, May 2017.
Manufacturers
The camera used aboard the UAV in these tests is a Point Grey Firefly MV and the IMU is an XSENS MTi. The GPS receiver is a NovAtel OEMStar with a corresponding NovAtel L1 patch antenna.
EVAN T. DILL is a research scientist in the Safety Critical Avionics Systems Branch at NASA Langley Research Center. He received his Ph.D. in electrical engineering from Ohio University.
STEVEN D. YOUNG is a senior research scientist at NASA with more than 30 years of experience in the related fields of safety assurance, avionics systems engineering and human-machine interaction.
MAARTEN UJIT DE HAAG is the Edmund K. Cheng Professor of Electrical Engineering and Computer Science and a Principal Investigator (PI) with the Avionics Engineering Center at Ohio University, where he earlier earned his Ph.D. in electrical engineering.
The use of GPS signals is certainly commonplace in today’s technological age. Various locating systems, tracking systems and precision timing applications all use the common decoded NMEA and 1 PPS signals from a GPS satellite in a multitude of different ways.
When a direct line-of-sight path to GPS satellites is unavailable, the GPS signal must first be received where there is a direct line-sight path, decoded, and then the resulting signals routed to where they are needed. The Luxlink GPSX-1001 has been designed to do exactly that.
LuxLink GPSX-1001 fiber-optic transceiver.
The GPSX-1001 is the result of a specific request by a research group of a midwestern U.S. university for seismic studies in an underground mine. More than 20 units were installed in several branches of the mine and have been in continuous operation successfully for two years.
The GPSX-1001 transceiver is a multifunctional device that can be used as a transmitter or a receiver/repeater. In operation, the NMEA signal and the 1 PPS signal are both multiplexed by the GPSX-1001 (set as a transmitter) and launched into a single optical fiber. The multiplexed signal is then received from the fiber at a second GPSX-1001 set as a receiver/repeater. Here, the NMEA and 1PPS signal are de-multiplexed and available as individual outputs (see Figure 1).
FIGURE 1. GPSX-1001 block diagram.
The original multiplexed signal is also then reapplied to another integral optical transmitter for use at a third receiver/repeater. Additional receiver/repeaters can be connected in the same fashion to allow the signals to be transmitted to numerous locations.
Fiber-optic cable is virtually immune to electrical interference and can be routed wherever convenient without regard to the proximity of electrical noise producers, water or high voltages. Because fiber optic cable is non-conducting, ground loops that can result in loss or corruption of the GPS signals are virtually eliminated. The bandwidth of the fiber and circuitry in the GPSX-1001 is such that the fast rise and fall times of the 1-PPS signal are maintained and the NMEA signal is as noise free as the original input.
Transmission distances using the GPSX-1001 can extend to a mile or more. For longer distances, additional GPSX-1001 units can be added.
The GPSX-1001 is user configured by means of front-panel DIP switches. Integral LED indicators are provided to continuously monitor the NMEA, 1 PPS, power and optical link signals. Power is obtained from simple wall type plug-in adapters or low voltages and need not be regulated because the GPSX-1001 units contain internal regulators.
Figure 2 shows three GPSX-1001 units in a typical GPS signal distribution system. The NMEA interface can be RS-422 or RS-232, depending on the requirements of the signal source. The 1 PPS signal is 50-ohm TTL compatible. Each transceiver pair will produce signals over distances in excess of several miles and will operate from –35° to +75° C (–31° to 167° F), allowing them to be used both indoors and outdoors. Units are available for use with multimode or single-mode fiber and with standard fiber-optic connectors.
FIGURE 2. GPS NMEA/1 PPS transmission system.
Irwin Math is president of Liteway Inc. and has more than 30 years of experience in the design and development of fiber-optic transmission systems. He was also the founder of Math Associates Inc., one of the pioneering firms in fiber-optic transmission system technology in the early 1980s.
Taoglas, a provider of Internet of Things (IoT) and GNSS antenna products, has released two new GPS certification testing services for Google and its device partners. The services are required for devices to meet Google’s new Street View auto-ready standard.
Auto-ready certification distinguishes 360-degree cameras that deliver accurately positioned 360 video, even at high speeds. Taoglas worked with Google to develop the performance requirements, as well as the test methodology used to establish a basic minimum level of GPS receiver performance.
The services are available at any of Taoglas’ design centers and labs in the United States, Ireland, Germany and Taiwan.
Compact wireless devices such as digital cameras with built-in GPS receiver systems contain complex electronic systems that can emit unwanted RF signals that can impact radio receiver performance. The effect of this RF noise can be combated with critical design decisions like the antenna, low noise amplifier, filters, and transmission line choice and implementation.
Taoglas’ new services will help device manufacturers objectively measure real-world performance to understand any GPS performance issues with their products. With this information, product manufacturers will know if their performance is optimized and will meet or exceed user expectation for the application at hand, as well as how it compares with their competitors.
“Google Street View provides people with a 360-degree view of the world, and to enable these services, we require highly accurate location data,” said Charles Armstrong, product manager at Google. “By working with Taoglas to establish a standardized compliance process, we’re helping device manufacturers understand our requirements for GPS performance and quickly deliver products that match and exceed those high performance standards.”
Taoglas is offering two levels of certification testing:
Street View Auto-Ready Conformance Testing (GSA.31) provides a quick verification of minimum performance (in a pass/fail manner) required to achieve Street View certification. Taoglas uses its GPS constellation simulator and anechoic chamber to verify that radiated tracking and acquisition sensitivity meet a minimum performance standard at 15-degree intervals in one hemisphere.
From these test results, manufacturers will be able to clearly see if the device’s GPS is performing adequately for basic location capabilities. The condensed period needed to run this test provides device manufacturers the best value to answer the question, “Is the GPS working optimally?”
A street view image of Guatemala. (Credit: Google)
Street View Auto-Ready Performance Testing (GSA.32) provides an absolute level of testing to assess the GPS receiver performance according to the optional Google Street View Assessment test procedures.
Taoglas uses its GPS constellation simulator and anechoic chamber to measure radiated tracking and acquisition sensitivity at 15-degree intervals in one hemisphere. These optional tests provide more insight into how well a device performs, providing absolute receive sensitivity performance data.
Testing results for both services include suggestions on next steps to resolve identified issues.
“This partnership with Google to deliver GPS testing solutions for Google Street View compliance is an excellent example of how we’re working successfully with the world’s biggest companies to delivering high-quality, reliable antenna solutions,” said Dermot O’Shea, co-CEO of Taoglas. “By certifying their products through Taoglas, device manufacturers will also be able to take advantage of Taoglas’ deep RF expertise, achieving success quickly and reducing time to market.”
“Street view” of the Ambrym Volcano, Vanuatu. (Credit: Google)
OCO-3 will collect spaced-based measurements of atmospheric carbon dioxide and solar-induced fluorescence.
Once launched, OCO-3 will be installed and operated on the International Space Station (ISS) Japanese Experiment Module-Exposed Facility (JEM-EF).
Surrey’s SGR-20 is a single-frequency, multiple antenna GPS receiver designed as a spacecraft orbit determination subsystem for small satellite low-Earth orbit applications. The OCO-3 mission will use the Surrey SGR-20 for positioning information (to an accuracy of better than 20 meters) and velocity data (to an accuracy of better than 0.25 meters per second). The SGR-20 features four front ends with antennas, allowing more flexibility and redundancy for the selected mission.
According to Eugene Hockenberry, project manager at Surrey Satellite, “The SGR-20 receiver is part of a highly proven range of GPS receivers that Surrey Satellite offers. Our receivers are currently active on twenty-four Surrey satellites and have accumulated over 700 years of on-orbit experience. With this mission we will see another first for Surrey: this receiver will be our first space hardware onboard the ISS.”
Surrey Satellite delivered the receiver to JPL three months ahead of schedule. OCO-3 is scheduled to launch in 2018.
Mayflower Communications Company Inc. will develop a small security-certifiable GPS module for the United States Air Force’s Modernized GPS User Equipment (MGUE) Program.
The Mayflower NavAssure 125a GPS receiver.
Mayflower was awarded a Phase III SGUE (Small GPS User Equipment) contract with the U.S. Air Force Research Laboratory sponsored by the Space and Missile Systems Center/GPS Directorate (SMC/GPSD).
Under the contract, the company will develop a small SWaP (Size, Weight, and Power) security certifiable Common GPS Module (CGM).
Mayflowers’ small SWaP GPS receiver technology will allow the Department of Defense (DoD) and its agencies to benefit from increased competition, enhanced capability and reduction in overall program costs to DoD program managers and prime contractors in upgrading their navigation systems to the modernized M-code receiver.
Mayflower’s SGUE program is aimed at the development of advanced GPS receiver technology to support future military GPS requirements. The goal of the program is to develop a NAVWAR (Navigation Warfare) compatible CGM form factor that will support SWaP-constrained military users.
The SGUE CGM development effort will expand Mayflower’s military GPS receiver product line to include modernized NavAssure-M product offerings so that current customers will have a form-fit-function upgrade path from SAASM to MGUE.
“Mayflower is a leader in small SWaP and miniaturized military GPS receiver and anti-jam products,” said Triveni Upadhyay, Mayflower founder and CEO. “I am confident in the quality and innovation expertise of our GPS engineering team to successfully develop the SGUE CGM. The development of small SWaP MGUE form factors, enabled by SGUE CGM, will have a significant impact in the M-Code market, providing secure modernized GPS signals to the warfighters and lowering total ownership costs on many military programs.”
“The Air Force is very pleased to see innovative GPS technology developed under its SBIR Program to find commercialization opportunity in the MGUE market. Mayflower has performed well and we are confident of the SGUE program success,” said Dana Howell, Air Force Research Laboratory (AFRL) program manager.
“The AFRL/GPSD objective in the SGUE Program is to advance MGUE technology and make it affordable to the warfighter,” said Eddy Emile, chief of the Advanced Technology and International Branch, GPS Directorate. ”
The SGUE Program fits the need and will lower the cost to the user by increased competition enabled by the SGUE Program.”
According to Mayflower, the NavAssure-M MGUE receiver form factors, focused toward small SWaP GPS receiver applications, will be backward compatible to SAASM, therefore, lowering the platform integration cost and total life-cycle cost.
Piksi is a low-cost, high-performance GPS receiver with real-time kinematic (RTK) functionality for centimeter-level relative positioning accuracy.
Its small form factor, fast position-solution update rate, and low-power consumption make Piksi ideal for integration into autonomous vehicles and portable surveying equipment. An open-source architecture with a high-performance DSP on-board and our flexible correlation accelerator make it the perfect platform for GNSS research.
Piksi is designed for autonomous vehicle guidance, such as formation flight and autonomous landing; GPS/GNSS research; and surveying systems.
Swift Navigation is a San Francisco-based startup building centimeter-accurate GPS technology for automotive, surveying, robotics, agriculture and drones.
The company says its products are 100 times more accurate than the GPS in a cell phone, at a tenth of the price of the competition.
In November, the company raised $11 million in a series-A investment round led by Pierre Lamond and Lior Susan at Eclipse Ventures. Swift Navigation plans to use the funds for taking current customers to scale and growing their team, with a focus on core engineering. Another focus continues to be research and development, with a second new product due out this year.
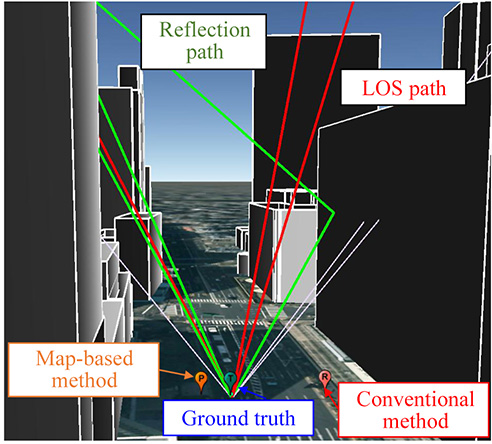
Figure 1. Example of the GNSS signal propagation using ray-tracing and a 3D building map.
A particle-filter-based positioning method using a 3D map to rectify the errors created by multipath and non-line-of-sight signals on the positioning result delivered by a low-cost single-frequency GPS receiver takes a multi-GNSS approach, using the combined signals of GPS, GLONASS and QZSS. The method outperforms conventional positioning in availability and positioning accuracy. It will likely be fused with other sensors in a future pedestrian navigation application.
By Li-Ta Hsu, Shunsuke Miura and Shunsuke Kamijo
GPS provides an accurate and reliable positioning/timing service for pedestrian application in open field environments. Unfortunately, its positioning performance in urban areas still has a lot of room for improvement, due to signal blockages and reflections caused by tall buildings. The signal reflections can be divided into multipath and non-line-of-sight (NLOS) effects. Recently, use of 3D building models as aiding information to mitigate or exclude multipath and NLOS effects has become a promising area of study.
At first, researchers used the 3D map model to simulate multipath effects to assess the single-reflection environment of a city. Subsequently, the metric of NLOS signal exclusion using an elevation-enhanced map, extracted from a 3D map, was developed and tested using real vehicular data. An extended idea of identifying NLOS signals using an infrared camera onboard a vehicle has been suggested. The potential of using a dynamic 3D map to design a multipath-exclusion filter for a vehicle-based tightly coupled GPS/INS integration system has also been studied. A forecast satellite visibility based on a 3D urban model to exclude NLOS signals in urban areas was developed.
The research approaches outlined above seek to exclude the NLOS signal; however, the exclusion is very likely to cause a horizontal dilution of precision distortion scenario, due to the blockage of buildings along the two sides of streets. In other words, the lateral (cross direction) positioning error would be much larger than that of the along-track direction.
Therefore, approaches applying multipath and NLOS signals as measurements become essential. One of the most common methods, the shadow-matching method, uses 3D building models to predict satellite visibility and compare it with measured satellite visibility to improve the cross street positioning accuracy. A multipath and NLOS delay estimation based on software-defined radio and a 3D surface model based on a particle filter was proposed and tested in a static experiment in the Shinjuku area of Tokyo.The research team of The University of Tokyo developed a particle-filter-based positioning method using a 3D map to rectify the positioning result of commercial GPS single-frequency receiver for pedestrian applications.
An evaluation of the QZSS L1-submeter-class augmentation with integrity function (L1-SAIF) correction to the proposed pedestrian positioning method was also discussed in an earlier paper by the authors of this article. However, satellite visibility in the urban canyon using only GPS and QZSS would not be enough for this proposed method. The use of emerging multi-GNSS, encompassing GLONASS, Galileo and BeiDou, could furnish a potential solution to the lack of visible satellites for this method. This article assess the performance of the proposed pedestrian positioning method using GPS, GLONASS and QZSS.
Building Models Construction
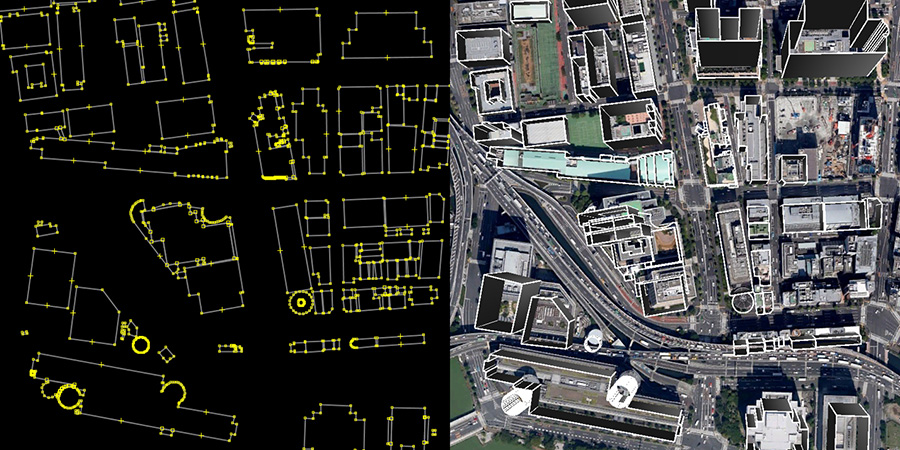
Our work established a 3D building model by a 2D map that contained building location and height information of buildings from 3D point-clouds data. The Fundamental Geospatial Data (FGD) of Japan, which provided by Japan geospatial information authority, is open to the Japanese public. This FGD data is employed as 2D geographic information system (GIS) data. Thus, the layouts and positions of every building on the map could be obtained from the 2D GIS data. In this article, the 3D digital surface model (DSM) data is provided by Aero Asahi Corporation. Figure 2 shows the process of constructing the 3D building model used here. This process first extracts the coordinates of every building corner from FGD as shown in the left of Figure 2. Then, the 2D map is integrated with the height data from DSM. The right of Figure 2 illustrates an example of a 3D building model established in this way. The 3D building map contains a very small amount of data for each building in comparison to that of the 3D graphic application. For our purposes, the file only contains the frame data of each building instead of the detail polygons data. This basic 3D building map is utilized in the simulation of ray-tracing.
Figure 2. The construction of the 3D building map from a 2D map and DSM.
Our version of the ray-tracing method does not consider diffractions or multiple reflections because these signals occurred under unfavorable conditions. Here, we utilize only the direct path and a single reflected path. The developed ray-tracing simulation can be used to distinguish reflected rays and to estimate the reflection delay distance. Our research work assumes that the surfaces of buildings are reflective smooth planes, that is, mirrors. Therefore, the rays in the simulation obey the laws of reflection. In the real world, the roughness and the absorption of the reflective surface might create a mismatch between the ray-tracing simulation and the real propagation. Here we ignore this effect, as the roughness of the building surface is much smaller than the propagation distance.
The opening figure (Figure 1) shows an example of the GNSS signal propagation using ray-tracing and a 3D building map. Red, green and white lines denote the LOS path, reflected paths and the NLOS paths, respectively. In this environment, a conventional positioning method such as weighted least squares (WLS) usually estimates the position on the wrong side of street as shown in the red balloon. With the aid of 3D building model and ray-tracing, the map-based positioning method is able to provide a result close to the ground truth.
Map-Based Pedestrian Positioning
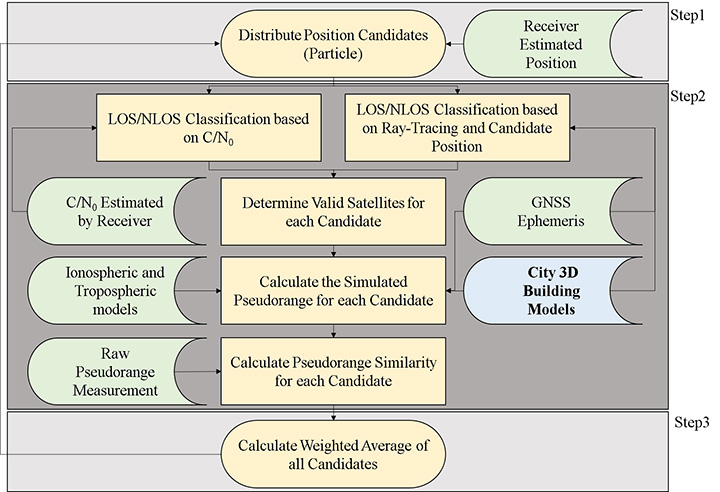
The flowchart of the 3D city building model-based particle filter is shown in Figure 3. This method first implements a particle filter to distribute position candidates (particles) around the ground-truth position. In Step 2, when a candidate position is given, the method can evaluate whether each satellite is in LOS, multipath or NLOS by applying the ray-tracing procedure with a 3D building model. According to the signal strength, namely carrier-to-noise ratio (C/N0), the satellite could be roughly classified into LOS, NLOS and multipath scenarios. If the type of signal is consistent between C/N0 and ray-tracing classification, the simulated pseudorange of the satellite for the candidate will be calculated. In the LOS case, simulated pseudoranges can be estimated as the distance of the direct path between the satellite and the assumed position. In the multipath and NLOS cases, simulated pseudoranges can be estimated as the distance of the reflected path between the satellite and the candidate position via the building surface.
Figure 3. Flowchart of the particle filter using 3D city building models.
Ideally, if the position of a candidate is located at the true position, the difference between the simulated and measured pseudoranges should be zero. In other words, the simulated and measured pseudoranges should be identical. Therefore, the likelihood of each valid candidate is evaluated based on the pseudorange difference between the pseudorange measurement and simulated pseudorange of the candidate, which is simulated by 3D building models and ray-tracing.
Finally, the expectation of all the candidates is the rectified positioning of the proposed map method. This method can therefore find the optimum position through a dedicated optimization algorithm of these assumptions and evaluations. The positioning principle of the proposed method is very different from the conventional GPS positioning method, that is, WLS. As a result, the calculation of the positioning accuracy of the 3D map method should be also different.
We define two positioning performance measures for the 3D map method: user range accuracy of the 3D map method (URA3Dmap) and positioning accuracy.
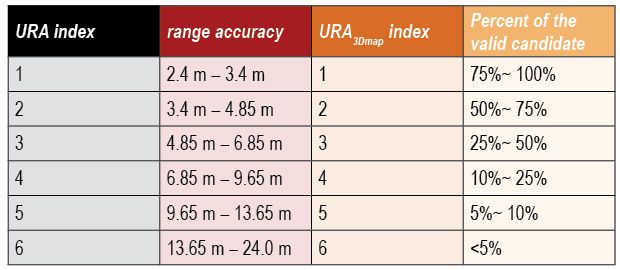
The value of URA3Dmap is to indicate its level of positioning service, which is similar to the user range accuracy (URA) of conventional GPS. The URA3Dmap is defined based on the percentage of the valid candidates from all candidates outside the building. The higher percentage of the valid candidate implies a higher confidence of the estimated position. Ideally, if the center of the candidate distribution is not far from the ground truth, the simulated pseudorange of the candidates located at the center of distribution would be very similar to the measurement pseudorange. We define the URA3Dmap as shown in Table 1.
Table 1. The definition of URA and URA3Dmap used in this article.
Experiments and Discussion
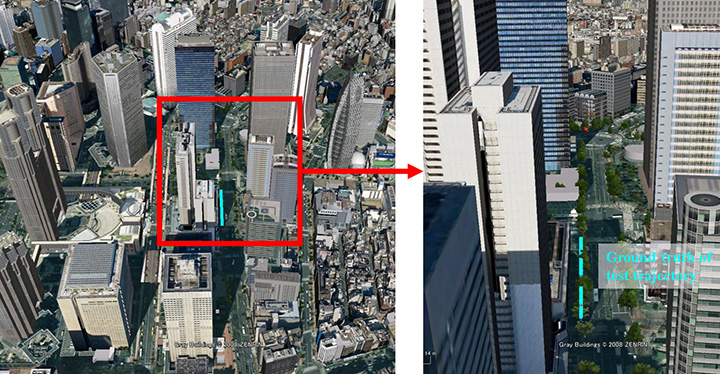
We selected the Hitotsubashi and Shinjuku areas in Tokyo to construct a 3D building model because of the density of the tall buildings. In this area, multipath and NLOS effect are frequently observed. We tested pedestrian navigation in a typical path that included walking both sides of street and passing through/waiting at a road intersection. The cut-off angle is 20 degrees. The data were collected in November and December 2014.
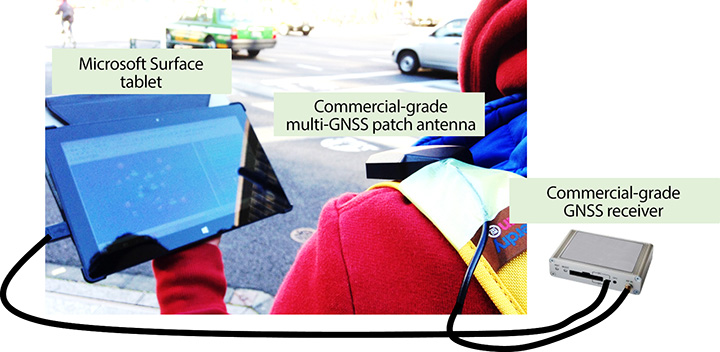
We compare here two single point positioning methods: single-point positioning solutions provided by open source RTKLIB software (RTKLIB SPP), and the proposed 3D map method. RAIM FDE of the RTKLIB SPP is used here as a conventional NLOS detection algorithm. The test used a geodetic-grade GNSS receiver and a commercial grade receiver. The geodetic receiver was only used to collect the QZSS L1-SAIF correction signal. The antenna of the commercial receiver was attached in the strap of the backpack as shown in Figure 4. The receiver is connected to a tablet to record the GNSS measurements and is set to output pseudorange measurements and positioning results every second.
Figure 4. Equipment set-up.
We generated a quasi-ground truth using a topographical method.Video cameras were set in the ninth and18th floors of a building near the Hitotsubashi and Shinjuku areas, respectively, to record the traveled path. The video data output by the cameras are used in combination with one purchased high-resolution aerial photo to get the ground truth data. The aerial photo is 25 cm/pixel and therefore the error distance for each estimate can be calculated. The synchronization between video camera and commercial GNSS receiver is difficult to get as accurate as in the topographical method. As a result, we used point to “points” positioning error to evaluate the performance of the dynamic experiment. The synchronization error is limited to 1 second. Hence, for each estimated position x(t), the ground truth points used to calculate the positioning error is xGT (t-1), xGT (t) and xGT (t+1). The point to “points” positioning error is calculated as:
Three performance metrics are used here: mean, standard deviation of the point to points error, and the availability of positioning solution. The availability defined here means the percentage of given solutions in a fixed period. For example, if a method outputs 80 epochs in 100 seconds, the availability of the method is 80 percent.
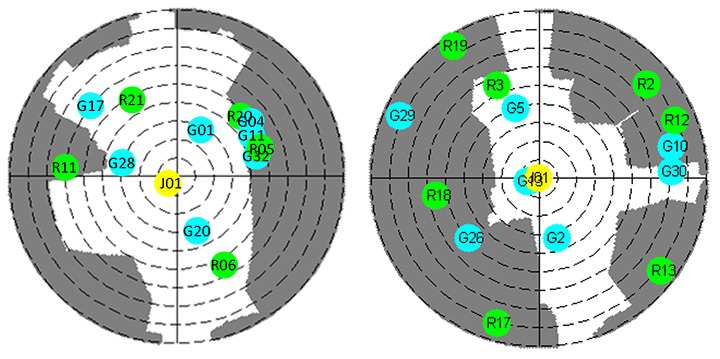
This research demonstrates two dynamic data. The skyplot of the data are shown in Figure 5. The satellites are tracked by the commercial receiver. The grey areas indicate the obstruction of the surrounding buildings. The two dynamic data are typical signal receptions at Hitotsubashi (middle urban canyon) and Shinjuku (deep urban canyon) areas.
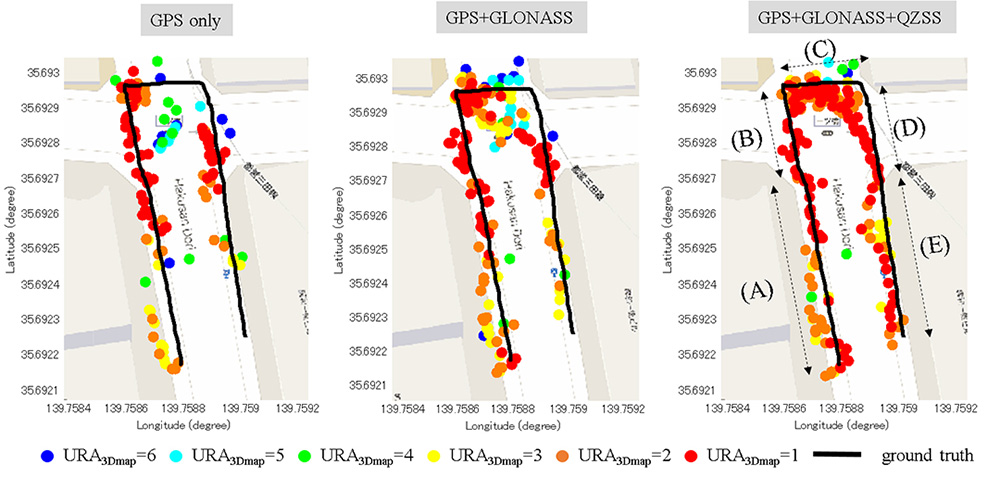
Hitotsubashi Mid-Canyon. To study the benefit of using different GNSS constellations in the 3D map method, Figure 6 shows the trajectory estimated by the proposed method under different satellite constellations. The different colors indicate different values of URA3Dmap of each point. This walking trajectory is divided into five sections (identified as A, B, C, D and E in the right-most of the three plots). In the GPS-only case (left), results in A and B sections have much better performance than sections D and E, because more than half of the GPS satellites are blocked at D and E, as shown in the left of Figure 5.
Figure 5. The left and right are the skyplot of the dynamic experiment at the Hitotsubashi and Shinjuku areas, respectively, in Tokyo.
The middle plot in Figure 6 shows the trajectory using GLONASS. It is obvious that the positioning results located at the right side of street are greatly increased, derived from the greater number of satellites in view. However, the quality of the GLONASS signal is not as good as GPS because multipath has a double effect on GLONASS.
Figure 6. Positioning results of the proposed 3D map method using different combinations of satellite constellations in a middle urban canyon.
In summary, the positioning error of applying GLONASS maintains a similar level, and availability increases about 12 percent compared to using GPS only. The right plot of Figure 6 shows the result after adding QZSS L1 C/A and L1-SAIF. This increases the results of C, D and E sections, because QZSS provides a high-elevation-angle satellite to the 3D map method. As a result, the number of valid candidate points in C, D and E sections increases dramatically. The reliability in C, D and E sections is also much higher than that of GPS+GLONASS. In addition, the trajectory became smoother than before.
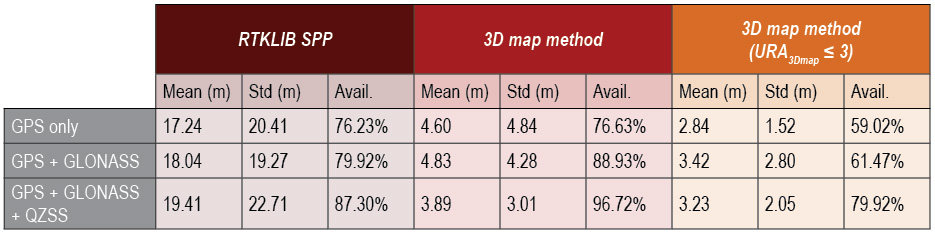
Table 2 compares the positioning results of both RTKLIB SPP and the 3D map method, showing the 3D map method using GPS, GLONASS and QZSS to have the best performance among three scenarios. The positioning error mean and availability are 3.89 meters and 96.72 percent, respectively. The positioning error mean could be further improved to 3.23 meters if selecting the position point with URA3Dmap ≤ 3 (yellow, orange and red points in Figure 6). This selection will lose about 17 percent of availability.
Table 2. Positioning results of the 3D map method using different combinations of satellite constellations in a middle urban canyon.
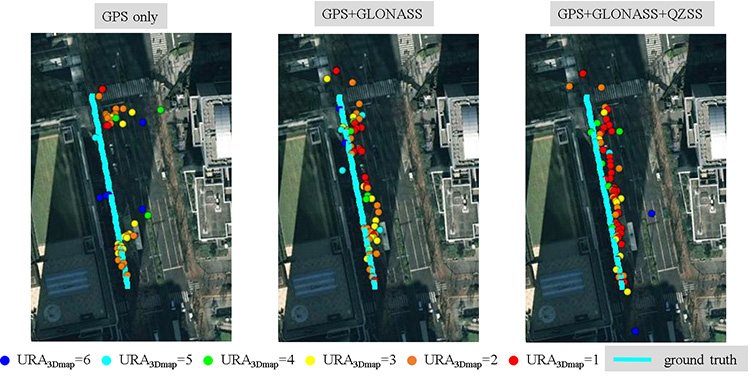
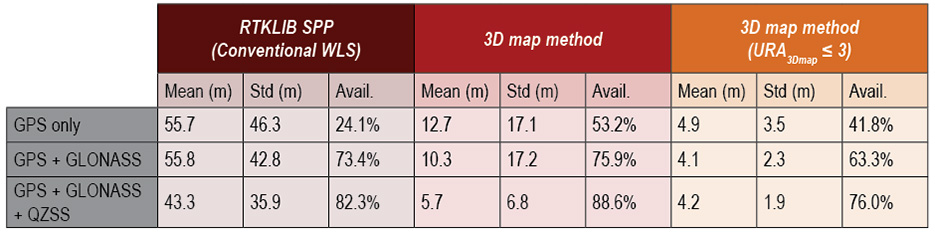
Shinjuku Deep Canyon. We conducted a similar experiment in the Shinjuku area of Tokyo, the most urbanized area in Japan (Figure 7). The positioning results and skyplot are shown in Figure 8 and the right of Figure 5, respectively. Table 3 compares the results of the two methods using the three constellation configurations.
Figure 7. Deep urban canyon environment, Shinjuku, Tokyo. (Courtesy Google Earth)Figure 8. Positioning results of the proposed 3D map method using different combinations of satellite constellations in a deep urban canyon.Table 3. Performance comparison of RTKLIB SPP and the proposed 3D map method using different combinations of satellite constellations in a deep urban canyon.
As shown in the left of Figure 8, only half of the GPS-only solutions are on the correct side of the street. A few points are incorrect due to the insufficient number of satellites. Adding GLONASS measurements greatly increases the availability, and most of the GPS-only outliers are corrected. The positioning error mean improves from 12.7 to 10.3 meters, and the availability improves from 53.2 to 75.9 percent. GLONASS measurements provide such a significant improvement because the distribution of GPS and GLONASS satellites are complementary.
After adding the QZSS measurements, availability further increases to 88.6 percent, and positioning error mean is reduced to 5.7 meters. The positioning error mean could be further improved to 4.2 meters if selecting the position points with URA3Dmap ≤ 3: the red, orange and yellow points in Figure 8. Although this selection will lose about 12 percent of availability, it could be easily compensated by a simple filtering technique.
Comparing Table 2 and Table 3, we find the positioning error of the proposed method in the middle urban canyon is about 1 meter worse than that in the deep urban canyon. This is because of the increase of multiple reflected signals.
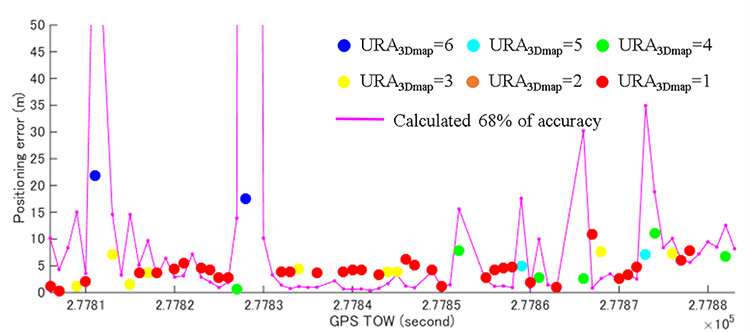
The target application of this 3D map method is consumer-based pedestrian navigation. Most of these applications benefit from an integrated system of multiple sensors. The 3D map method could serve as one sensor for such an integrated system. The calculation of positioning accuracy is required to indicate the quality of the point solution estimated by this method. Figure 9 shows the relationship between the calculated accuracy and positioning error. We can find that the calculated accuracy is able to describe the performance of the proposed method.
Figure 9. Positioning error of the 3D map method using GPS+GLONASS+QZSS. The purple line denotes the calculated 68 percent accuracy of the proposed method.
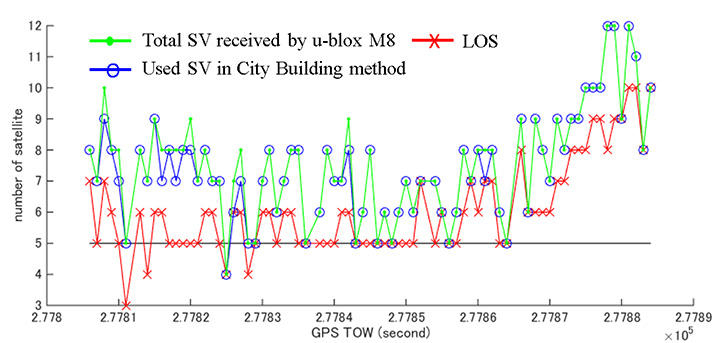
The performance of the conventional method is very inaccurate in this deep urban canyon. Its positioning error is larger than 40 meters. Figure 10 shows the number of satellites in this data. Note the number of LOS satellites is determined by the ray-tracing simulation according to the ground truth trajectory.
Figure 10. Number of LOS satellites, the number of satellites used in the 3D map method, and the total number of satellites tracked by the commercial-grade receiver.
The number of LOS satellites means the light-of-sight path of satellite is not blocked by buildings. Note that the LOS signal also contains the multipath effect. In this deep urban canyon, the number of LOS signals is much less than that of all received satellites. This implies a lot of NLOS is received, which deteriorates the performance of the conventional method. The map-based method is able to correct most of the NLOS signals.
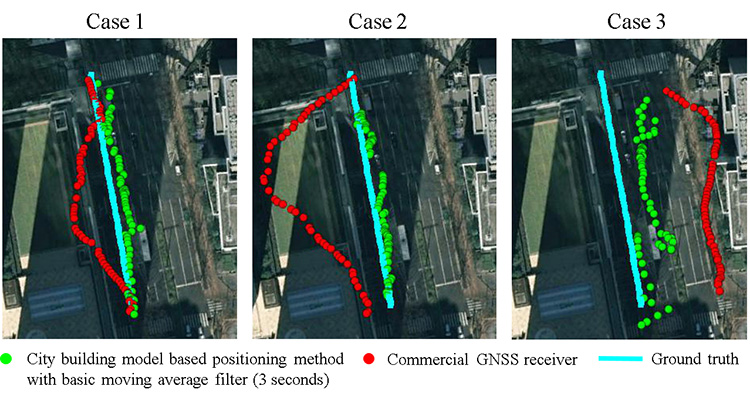
The number of satellites used in the map-based method is close to the number of all the satellites received. Therefore the map-based method can achieve better performance than the conventional method. Figure 11 demonstrates the comparison between the map-based method and the commercial GNSS receiver. The map-based method is simply smoothed by a moving average filter with 3 seconds data. It is difficult to understand the pedestrian trajectory by the commercial-grade receiver result. In some cases, the commercial receiver will estimate the pedestrian to be on the wrong side of the streets. The proposed method, instead, is capable of estimating the result at the correct side of the street.
Figure 11. Positioning results of the proposed 3D map method and commercial-grade receiver using GPS+GLONASS+QZSS in the deep urban canyon.
Li-Ta Hsu is a post-doctoral researcher at the Institute of Industrial Science of the University of Tokyo. He received his Ph.D. degree in aeronautics and astronautics from National Cheng Kung University, Taiwan.
Shunsuke Miura received an M.S. degree in information science from the University of Tokyo in 2013.
Shunsuke Kamijo received a Ph.D. in information engineering from the University of Tokyo, where he is now an associate professor.
McMurdo Group, maker of end-to-end search and rescue solutions, has received formal certification from the U.S. Federal Aviation Administration (FAA) and European Aviation Safety Agency (EASA) for its Kannad Integra ARINC 429 Navigation Interface.
Based on the ARINC 429 GPS communications standard for most commercial aircraft, the interface, when used with the Kannad Integra Emergency Locator Transmitter (ELT), provides dual GPS redundancy that can result in aircraft being found much faster compared to standard ELTs in event of an emergency. The solution has already been selected by aircraft manufacturers including Pilatus, Embraer and Airbus Helicopters.
Traditional ELTs rely on an aircraft’s external antenna and GPS equipment, which is subject to failure in the event of an emergency. The Kannad Integra ELT, however, can operate independently of the aircraft to provide key positioning data through its built-in internal antenna and embedded GPS receiver. The Integra ARINC 429 navigation interface stores the latest known position of the aircraft based on the aircraft navigation system data. This data is then used by the built-in Integra GPS for better location accuracy and a higher chance of rescue.
The Kannad Integra ELT and Integra ARINC 429 Navigation Interface are suitable for commercial aircraft, helicopters, business jets and airlines. Once activated, the Integra ELT transmits a distress signal to alert international rescue services to the emergency location via the global Cospas-Sarsat Search and Rescue satellite system, which has helped to save more than 37,000 lives since 1982.
“McMurdo’s Kannad products have been chosen by the world’s leading aircraft manufacturers and airlines for their quality, reliability and innovation,” said Christian Belleux, head of McMurdo’s Kannad Aviation Business Unit. “This new ARINC 429 interface is yet another example of how we are helping to shape the present and the future of aviation safety.”
A leap second will be introduced this year at 23:59 on June 30. This phenomenon comes around periodically and is necessary for keeping Coordinated Universal Time (UTC) in line with the small vagaries of the Earth’s slowing rotation. Although it is an event that will pass unnoticed by the majority of people, it has implications for anyone involved in the development of GNSS-enabled devices. For some, it can be the cause of a major headache.
Part of the problem with the leap second is its irregularity. Occurring every two or three years, it means that receiver technology moves on in between — and because the Earth’s slowing rotation is not at a constant rate of change, it cannot be predicted when the next one will be announced. A rapidly developing market of GNSS products having to deal with random alterations to its time framework is not an ideal situation. Suitable preparations, clearly, should be employed.
The behavior of a new receiver when subjected to a leap second may prove critical in certain instances, and without robust characterization it can lead to inconsistent performance. It has already happened this year: on January 21, GPS signals started to include information which effectively announced this year’s leap second event, with the relevant data for future delta time, and week and day numbers. This caused issues with some receivers that weren’t expecting it: some units applied the additional second immediately. It would be interesting to see how these systems might have reacted during an actual leap second transition.
Receiver logic flow requires testing so that any GPS receiver can remain compliant with the IS-GPS-200 standard, and potential problems mustbe mitigated and controlled. The use of a GNSS simulator — which outputs a scenario containing the leap second event — allows for the receiver and any systems around it to be exercised over and over again, ironing out any anomalies, to ensure total reliability.
The recent issues with those non-compliant GPS engines highlights the advantage that simulation provides. The consistency it delivers enables a very thorough testing schedule, which will in turn lead to a straightforward application of the time change.
One school of thought holds that leap seconds should be abandoned, and that we should stick to atomic time from now on. Their removal would mean that by 2100, the Earth’s rotation would be some two to three minutes behind humanity’s precise, atomic-powered, 24-hour clock, and half an hour or so by 2700.
The World Radiocommunication Assembly, which has control over such matters, had been postponing a decision on whether to abolish the leap second for over a decade; another vote is due this year. It wouldn’t be any great wonder if this prevarication continues, so whilst it still exists, it is best to concentrate on what this June’s extra second might have in store for anyone currently developing a GNSS product. Armed with a simulator, the unpredictability of leap second scheduling should no longer be a major concern. Should this year’s vote be again inconclusive, those who have taken the positive step of acquiring a GNSS simulator will be in good shape to deal with the next time the clocks show 23:59:60.
Mark Sampson is LabSat product manager for RaceLogic.
Editor’s Note: Janice Partyka is principal of JGP Services, a consulting practice. She is GPS World’s editor for wireless, writing a monthly column for the Wireless LBS Insider newsletter. The views expressed are her own.
Hard to believe, we have only now reached the 10th anniversary of Google Maps. As important as digital maps have become, their purpose is much the same as the printed and drawn maps that preceded them. Digital maps emerged in the 1960s with the Census Bureau’s DIME maps. These first digital maps were used for analysis of place-specific data, such as populations within census tracts or cities. Digital maps in turn led to geographic information systems (GIS) for spatial analysis. Though GIS had uses in fields like city planning, the main stimulus for digital maps came in the 1990s with the convergence of the completion of GPS infrastructure, and affordable and portable computers.
Naturally, just knowing where you are doesn’t have huge value, but if that information can be fused with a digital map, which could generate a route to the destination of your choice, or access information on the places that surround you, then you have something. This is why companies like Etak, Tele Atlas and Navteq began the painstaking process of converting satellite images, printed topographic maps and data that could only be observed with one’s eyes (such as street signs, addresses, speed limits, and turn restrictions) into digital form.
One of my projects during the 1990s was to compare the accuracy of competing digital maps. It was a tedious process, entailing two-person driving crews traveling each street. The passenger recorded all relevant information and made periodic readings with a large, costly GPS receiver. At the time, digital maps could only be accessed by complicated GIS programs which restricted their usefulness.
Since then, digital maps have grown in significance due to the advent of smartphones, a growing suite of digital-map-enabled applications, and of course Google Maps. Google has made maps friendlier to developers through its application program interfaces (APIs), which also improved the user experience for scrolling across locations from a map view.
Google has mastered the process of data capture from roadways. Rather than rely on the eyes of people in the field, sensors and cameras collect mapping data. Image-processing software extracts and geo-codes textual data, automating and enhancing map creation. And Google has incorporated overhead and street-level photographic images into maps, adding substantial value.
We will never arrive at having a perfect digital map. The work to keep mapping accurate and give it more context will be ongoing. The next challenge in digital mapping is making it work offline and creating accurate maps of the indoors. These next innovations will not be led by GPS, but by sensors, including beacons. GPS has already done the heavy lifting.
The U.S. Department of Transportation will host a third workshop to continue discussions of the GPS Adjacent Band Compatibility Assessment on March 12.
The workshop will focus on the following topics:
Identification of GPS and GNSS receivers to be considered for testing that are representative of the current categories of user applications
Discussion of a GPS/GNSS receiver test plan.
Anyone interested in presenting on either or both of the above topics should contact Stephen Mackey by March 2.
The workshop will be held 8:30 a.m.-3:30 p.m. PDT at Aerospace Corporation, 2310 E. El Segundo Blvd., El Segundo, California.