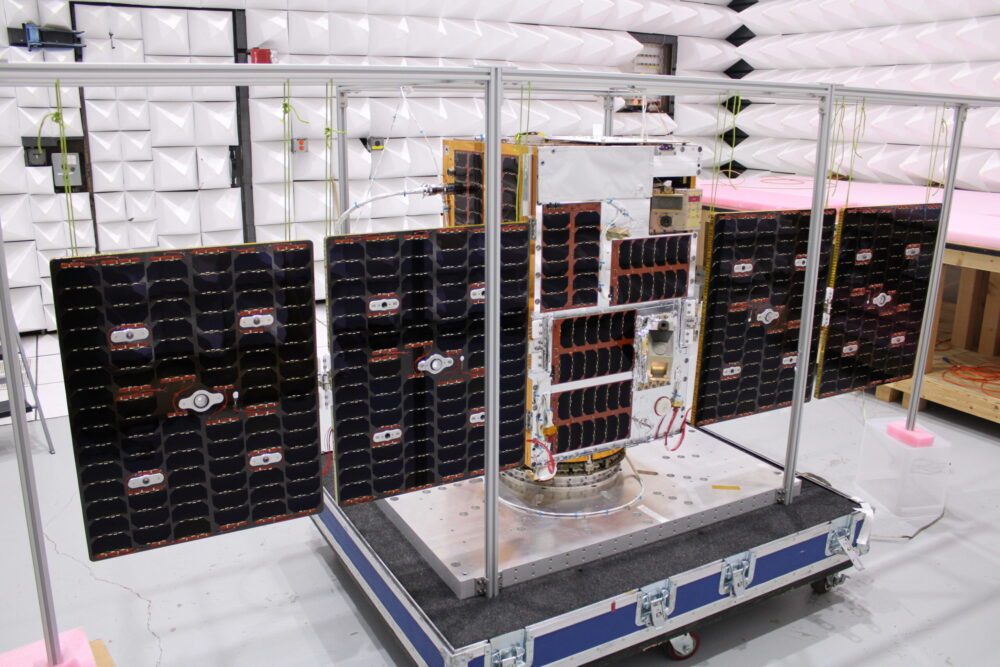
The U.S. Naval Research Laboratory (NRL) has successfully launched the GNSS Orbiting Situational Awareness Sensor (GOSAS), one of three advanced experimental payloads.
GOSAS was aboard the Space Test Program’s (STP) Satellite-7, which launched at 4:33 a.m. PDT on April 7 from VandenbergU.S. Space Force (USSF) Base, California.
The other payloads are the Lasersheet Anomaly Resolution andDebris Observation (LARADO) instrument and the Gadolinium Aluminum Gallium Garnet (GAGG) Radiation Instrument (GARI-1C).
GOSAS will improve the reliability of navigation and communication systems for warfighters.
“The GOSAS is a CubeSat-compatible, programmable dual GPS receiver designed to characterize the orbital GNSS environment and produce high-quality ionospheric space weather products,” said Scott Budzien, PhD, NRL research physicist and GOSAS principal investigator. “Understanding and predicting space weather is critical for ensuring the accuracy of GPS and the integrity of military communications.”
GOSAS is a follow-on to the NRL experiment GROUP-C (GPS Radio Occultation and Ultraviolet Photometry-Collocated) experiment on the International Space Station that took place 2017-2023 and serendipitously detected GPS ground interference.
GOSAS originated in 2020 with the mission of increasing GPS accuracy for the warfighter.
Ionospheric delay remains a significant error source in GNSS positioning, particularly for single-frequency users and during periods of enhanced space weather activity (Dabbakuti, 2021). While global and regional ionospheric models provide large-scale corrections, they often fail to represent localized ionospheric variability at individual receiver locations (Jee et al., 2010; Osanyin et al, 2025).
Consequently, residual ionospheric errors persist in positioning solutions, degrading accuracy for applications including precise point positioning (PPP), real-time navigation, and single-frequency GPS users (Biswas et al., 2022). Hence, accurate modeling of the ionosphere is essential in tackling the principal challenges in high-precision GNSS positioning.
Vertical total electron content (VTEC), a key driver of ionospheric delay, exhibits strong nonlinear temporal variability controlled by solar radiation, geomagnetic activity, seasonal effects, and local electrodynamics (Osanyin et al., 2023; Seemala et al., 2023). Capturing this variability at individual GNSS stations poses a significant challenge. Advances in artificial intelligence (AI), i.e., machine learning (ML) techniques have emerged over the decades as powerful tools for approximating complex non-linear systems and deterministic geophysical processes, while significantly reducing computational cost (Sarker, 2021). As such, they have successfully replaced repeated full-scale numerical simulations by learning input-output relationships directly from data (Zhang et al., 2025). This paradigm shift is particularly relevant for ionospheric modeling, where long-term GNSS observations provide rich time series well suited for data-driven learning.
Time series forecasting traditionally relies on statistical models such as autoregressive (AR), moving average (MA), autoregressive moving average (ARMA), and autoregressive integrated moving average (ARIMA), which model future values as linear functions of past observations (Kaselimi et al., 2020). They have been widely employed to predict VTEC by extrapolating historical observations. Nonetheless, the classical approaches are inherently limited by assumptions of linearity, stationarity and short-term memory, which restrict their ability to capture complex ionospheric dynamics, particularly during disturbed conditions and over longer prediction horizons. To address these limitations, this study adopts a deep learning-based framework using long short-term memory (LSTM) neural networks for station -pecific VTEC prediction. Unlike conventional statistical models, LSTM networks are specifically designed to learn non-linear temporal relationships and retain long-term memory in sequential data (Hochreiter and Schmidhuber, 1997).
Essentials
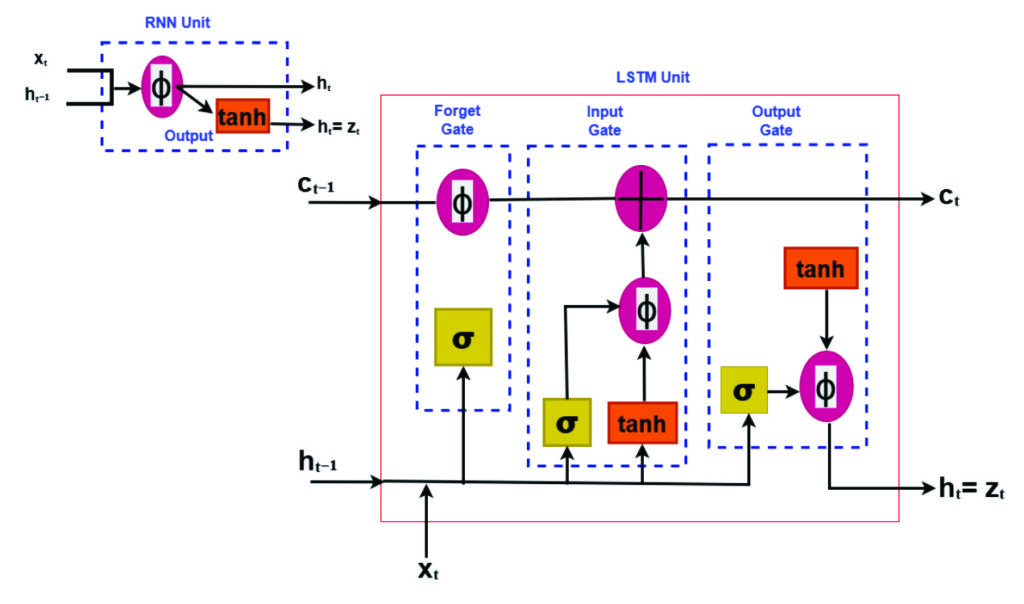
LSTM neural networks for prediction have emerged as a powerful tool for time-series prediction (Hochreiter and Schmidhuber, 1997). LSTM is a type of recurrent neural networks (RNNs) that takes sequences of information and uses recurrent mechanisms and gate techniques (see Figure 1). RNNs are well known for their ability to process single data points and entire data sequences (Gonzalez and Yu, 2018). The LSTM model has various forms for different types of data inputs. The basic condition of LSTM modeling is that all inputs and outputs are independent of each other. The key to the LSTMs is the cell state, which is protected and controlled by the forget, input and output gates, respectively (Gonzalez and Yu, 2018).
FIGURE 1 Comparison of recurrent neural network (RNN) and long short-term memory (LSTM) structures.
Training deep learning modelsremains computationally demanding despite their fast prediction capability. LSTM networks consist of interconnected layers with numerous trainable parameters that must be optimized iteratively to accurately capture temporal dependencies in the data. Training typically involves large historical datasets spanning multiple years, which is necessary to expose the model to varying ionospheric conditions, but also increases computational effort (Thompson et al., 2020). The optimization process relies on iterative algorithms such as stochastic gradient descent and variants, requiring repeated forward and backward passes through the network. As the depth of the model and the length of input sequences increase, so does the demand for memory and processing power. These challenges are particularly relevant when training is performed using graphics processing units (GPUs), where memory limitations and data transfer overhead must be carefully managed (Sarker, 2021).
Like all neural networks, LSTM has trainable parameters (weights and biases). These parameters are optimized by minimizing a loss function using gradient-based optimization. Due to its ability to learn time sequences, gradients must be propagated across time steps, not only across layers. This process is accomplished using backpropagation through time, which computes gradients of the loss with respect to all parameters and accumulates gradients across the sequence. The major advantage of LSTM is the use of its gating mechanism in mitigating vanishing gradients, making backpropagation practical for long time series such as VTEC (Adekunle et al., 2025; Hochreiter and Schmidhuber, 1997; Noor and Ige, 2025).
In recent years, LSTM networks have achieved impressive results in modeling complex physical systems characterized by strong non-linearity and long-term temporal dependencies. Notably, LSTM-based approaches have been successfully applied to atmospheric and geophysical time series, demonstrating superiority in predictive skill compared to traditional empirical and statistical models (see Reddybattula et al. (2022 and references therein). These research results show the capability of LSTM to capture diurnal, seasonal, and storm-time variations. By leveraging historical GNSS-derived VTEC time series, LSTM-based models can adaptively capture both regular ionospheric patterns and transient disturbances, enabling more accurate and robust VTEC forecasts. This data-driven approach directly supports improved ionospheric correction in GNSS positioning, offering a practical and scalable solution to overcome the shortcomings of traditional time series methods.
This study focuses a station-specific vertical total electron content (VTEC) prediction framework based on long short-term time series. The proposed framework treats VTEC prediction as a supervised regression problem. A sequence of past VTEC observations is used to predict future values over one or multiple forecast horizons. Also, emphasis is placed on methodology clarity, practical implementation, and positioning relevance.
Elements: TEC estimation from GNSS measurements
For the purpose of forecasting local VTEC using time series analysis, this study utilized the GPS dataset provided by the Brazilian Institute for Geography and Statistics (RBGE; www.ibge.gov.br/en/) over Santa Maria (SMAR; -20.72o, 306.28o), a station located in Brazil over the period of 10 years from January 2010 to December 2019.
VTEC data were derived from dual-frequency GPS observations at the selected station using the standard ionospheric processing techniques, including slant TEC estimation, instrumental bias correction, and mapping to vertical TEC. For more details, readers can consult the GPS-TEC analysis software developed by Seemala and Valladares (2011), which has been employed in this study for TEC processing. The time resolution is selected to be 15 minutes following an average over a sampling interval of 30 seconds. The resulting VTEC time series provides a continuous record of ionospheric variability with a fixed temporal resolution.
Station-specific LSTM modeling framework
A structured deep learning workflow for station-specific VTEC prediction has been adopted using the LSTM framework. The overall methodology follows a sequential pipeline consisting of data collection, preprocessing, feature engineering, model training, evaluation, validation, and deployment. This workflow ensures reproducibility, minimizes information leakage, and facilitates integration into GPS positioning engines. The focus is on time series learning at a single station, where temporal dependencies dominate and spatial smoothing from regional or global models is undesirable.
Data preparation and model training
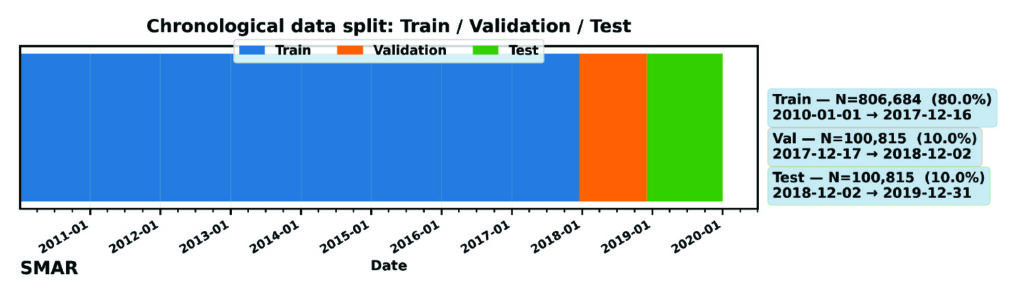
High-quality input data are essential for stable LSTM training. The extracted VTEC time series are preprocessed to remove cycle slips, mitigate differential code biases, and ensure consistent temporal sampling. As shown in Figure 2, for this model (as variations can be considered), the dataset has been divided into training (80%), validation (10%), and testing (10%). The validation is mostly required during training the LSTM deep learning model to ensure generalization and prevent overfitting. Furthermore, preprocessing aims at ensuring capability of the model in handling missing data and temporal consistency checks.
FIGURE 2 Chronological splitting of VTEC dataset for machine learning.
Feature engineering mainly converts raw VTEC observations into structured model inputs such as local time (LT) and day-of-year (DOY) features. These features are normalized prior to training, although normalization is applicable to only the training dataset to avoid future leakage. The model consists of an input layer whose dimension equals the number of input features, followed by a single LSTM layer with 64 memory cells to learn temporal dependencies in the input sequence. A dropout layer with a rate of 0.2 is applied to mitigate overfitting during training. The LSTM representation is then passed to a fully connected (Dense) regression head with nout neurons, where nout equals the number of forecast lead times. Model training minimizes the Huber loss function using gradient-based optimization, while performance is evaluated using RMSE. The optimizer updates the network weights iteratively to reduce the forecast error across the training samples. Early stopping and regularization are applied to further prevent overfitting, particularly during periods of low ionospheric variability. The final outputs are the predicted VTEC at multiple lead times (in this experiment: 30, 60, 120 and 180 minutes). The trained model is suitable for deployment in near real-time ionospheric correction systems: once operational, it ingests the most recent VTEC observations and produces short-term forecasts that can be integrated into GNSS positioning workflows, particularly for single-frequency applications and PPP.
Performance evaluation and baseline comparison
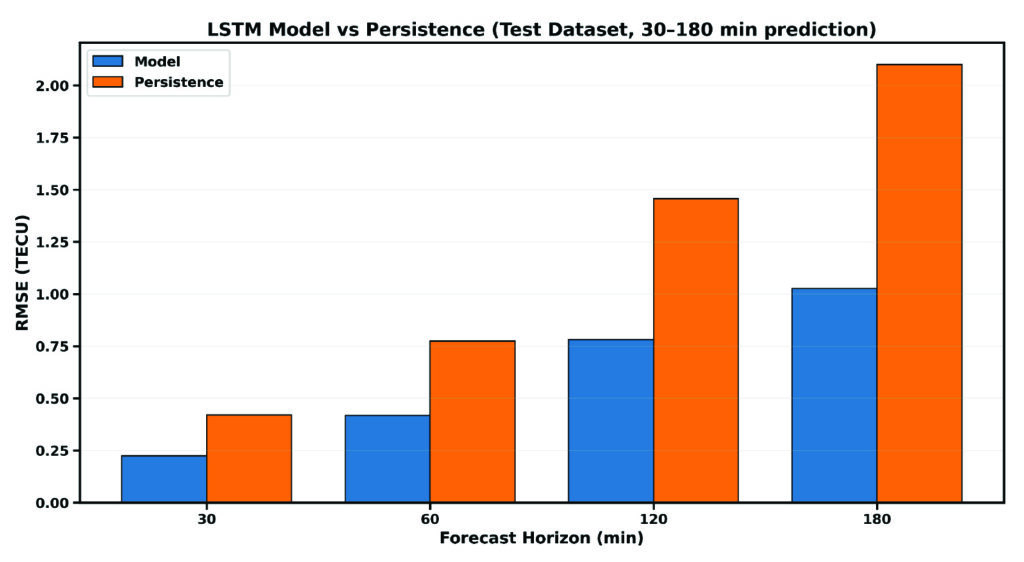
For practical assessment, the LSTM-based predictions are evaluated against commonly used baseline models, including persistence (using the trained model with new data) and skill (the ability of the model to make predictions). These baselines represent the minimum performance expected in operational GNSS ionospheric modeling and serves as internal validation of the overall model’s performance. Evaluation metrics include, but are not limited to, root mean square error (RMSE), mean absolute error (MAE), and relative improvement over persistence (skill). Figure 3 compares the predictive performance of the proposed LSTM model against the persistence baseline on the independent dataset. RMSE increases over time, while persistence largely deviates from the LSTM model, showing the great strength and capability of the LSTM model for time series prediction over the Santa Maria station. For instance, the RMSE of the LSTM model increases from 0.24 TECU to 1.15 TECU from 30 minutes to 3 hours lead time, while that of persistence ranges from 0.41 TECU to 2.25 TECU, respectively.
FIGURE 3 Comparison between the RMSE of the LSTM model and persistence for single-station VTEC prediction.
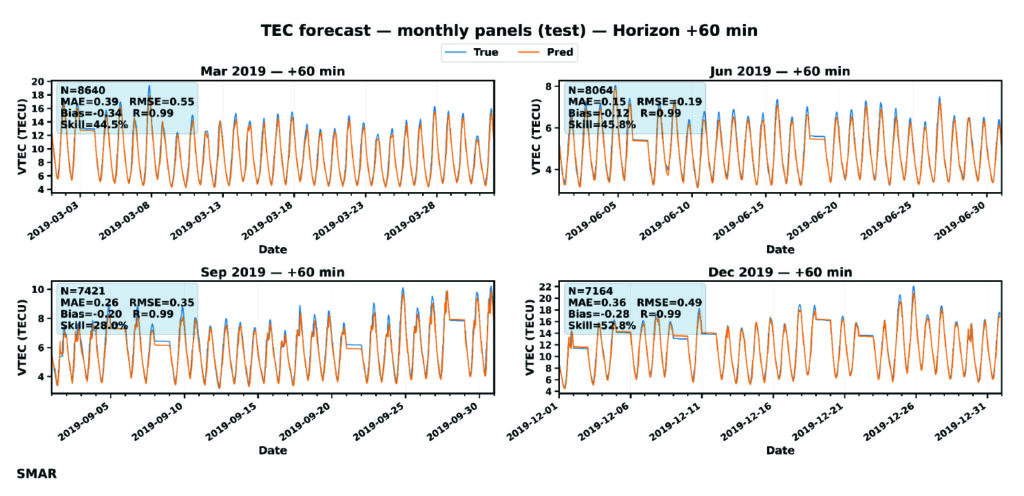
For further evaluation, day-to-day variation of VTEC at 60 minutes lead time is shown in FIGURE 4. GPS TEC (orange curves) shows a strong diurnal cycle with expected daily peaks, while forecast (blue curves) matches these peaks across months, indicating that the LSTM captures the key deterministic component of TEC variability. TABLE 1 or the embedded metrics in Figure 4 summarizes an overall accuracy of the LSTM model using the performance metrics: MAE, RMSE, Bias, R, and skill. MAE and RMSE values change with season — with the lowest reported in July.
FIGURE 4 Day-to-day variation of VTEC at 60 minutes forecast during July to December 2019. The embedded metrics show the performance of the LSTM model for each month of the testing dataset.
Error increases toward December with the largest RMSE in March (0.549 TECU). September shows moderate error levels. Also, correlation is consistent across all months, which confirms the model’s capability to capture TEC changes and day-to-day variability patterns. The model is nearly unbiased as the bias is consistently close to zero, meaning that the LSTM does not drift systematically and shows that the model underpredicts GPS VTEC. This characteristic is important for operational GNSS corrections, because biased VTEC forecasts would translate to persistence positioning errors. Going by the skill values, even at 60 minutes forecast, the model provides ~27%-52% improvement over persistence. This result implies a major indicator of real predictive ability, especially for GNSS applications.
Statistical validation
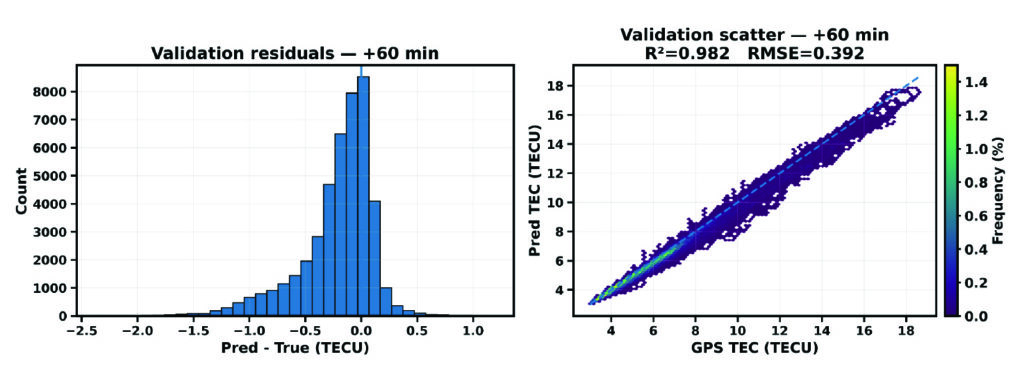
Figure 5 presents the diagnostic of the validation dataset for the SMAR station at a 60-minute forecast horizon. It combines the distribution of prediction residuals (left) and density-based scatter comparison between predicted and observed VTEC values. These analyses help explain the overall agreement of the LSTM model forecast during validation.
FIGURE 5 Validation diagnostics at 60 minutes forecast horizon. (Left) Histogram of prediction residuals. (Right) Density scatter of predicted versus observed TEC.
The residual distribution is mostly concentrated near zero, which implies that most predictions deviate only slightly from observations. The right plot shows the scatter density plot of predicted VTEC against observed GPS VTEC. The points are tightly clustered along the dashed line, indicating that the model corresponds very well (98.2%) to the TEC variance in the validation period. Also, a RMSE of 0.39 TECU reflects a relatively low magnitude error. These findings support the reliability of the proposed LSTM model for VTEC forecasting.
Implications for GNSS Positioning
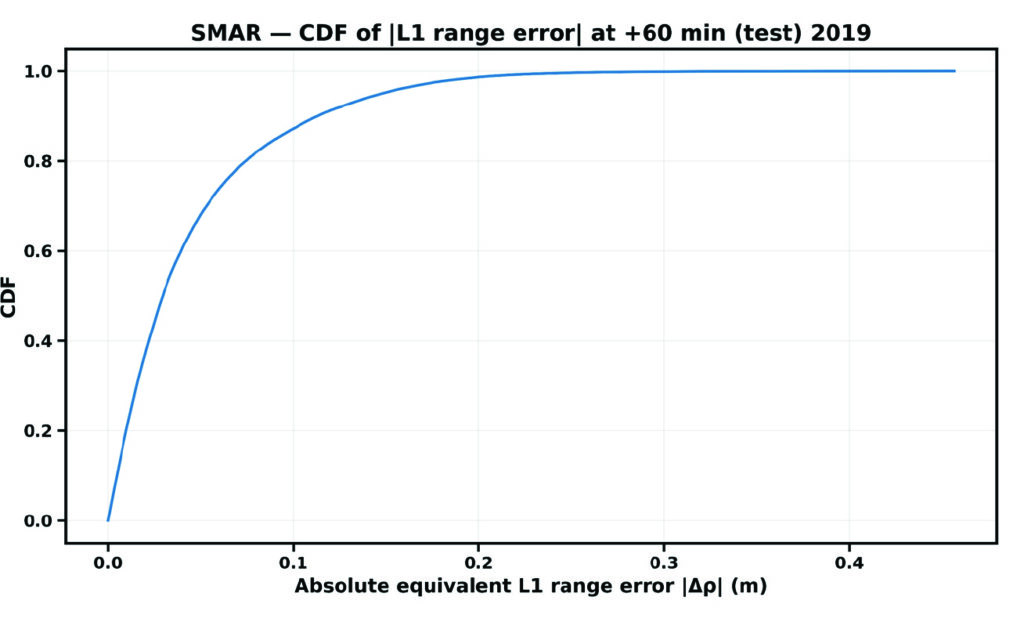
The cumulative distribution function (CDF) of the absolute equivalent L1 error, denoted by |∆ρ|, for the Santa Maria station at a forecast horizon of 60 minutes is shown in Figure 6.
FIGURE 6 CDF of residual VTEC equivalent L1 ranging error at the single station.
The CDF provides a direct positioning-relevant interpretation of model performance. The steep rise at small error values indicates that most samples exhibit low residual range errors, demonstrating strong correlation performance.
Evolutionary
This study demonstrates that LSTM-based machine learning provides a practical and effective approach for station-specific GNSS VTEC prediction during low solar activity. The LSTM model accurately reproduces diurnal and seasonal VTEC variability at the station level. Forecast skill remains stable across increasing horizons, while significant RMSE reductions over persistence confirm the model’s predictive value, supporting the feasibility of LSTM-based station-specific VTEC forecasting for operational GNSS applications. By leveraging historical GPS-derived VTEC time series, LSTM neural networks capture complex temporal dependencies that are difficult to model using conventional techniques. This approach offers a valuable complement to existing ionospheric correction models and represents a promising direction for future GNSS positioning systems. The results presented in Table 1 confirm that the proposed LSTM algorithm can derive an accurate predictive model as far as a 3-hour forecast. The proposed approach improves long-term ionospheric prediction and enhances positioning accuracy.
Month
MAE (TECU)
RMSE (TECU)
Bias (TECU)
R
Skill
Mar
0.39
0.55
-0.34
0.993
44.5
June
0.15
0.18
-0.12
0.994
25.8
Sep
0.26
0.35
-0.20
0.986
28.0
Dec
0.36
0.49
-0.28
0.994
52.8
Table 1 Comparison of VTEC performance metrics of the LSTM model at 60 minutes forecast.
While the results demonstrate the potential of AI-based modeling for station-specific VTEC prediction, further investigation is required to assess its limitations. Future research will investigate the sensitivity and robustness of the data-driven approach under extreme geomagnetic storm conditions and maximum solar activity considering multiple stations over the same region. These experiments will help evaluate the LSTM-based modeling reliance for a better positioning GPS accuracy. In addition, combining efficient training strategies with LSTM-based temporal learning offers a practical and scalable solution to station-specific VTEC prediction. The resulting models will bridge the gap between computationally expensive physics-based approaches and overly simplified empirical models, providing accurate, localized ionospheric corrections that directly enhance GPS positioning performance. Therefore, the Bayesian optimization technique would be integrated during model’s training to tune LSTM hyperparameters (Adekunle et al., 2025), with the aim of reducing computational cost and improving convergence and generalization in station-specific ionospheric modeling. It is very likely that machine learning will play a significant role in near-term ionospheric modeling/prediction for GNSS.
Dr. Taiwo Osanyin is a Ph.D. visitor at York University, Toronto, Canada. Her research interests include space physics, atmospheric sciences, statistics, and modeling of the upper atmosphere. Osanyin received a Ph.D. in space geophysics from the National Institute for Space Research, Brazil, an M.Sc. in nuclear science and engineering from Obafemi Awolow University, Nigeria, and a B.Sc. in engineering physics from Obafemi Awolow University, Nigeria.
Sunil Bisnath is a full professor in the Department of Earth and Space Science and Engineering at York University in Toronto. For more than 25 years, he has been actively researching precise GNSS-focused positioning and navigation solutions and applications. He holds an Honors Bachelor of Science degree and master of science degree in surveying science from the University of Toronto and a Ph.D. in geodesy and geomtics engineering from the University of New Brunswick.
• Adekunle AA, Fofana I, Picher P, Rodriguez-Celis EM, Arroyo-Fernandez OH, Zemouri R. (2025). Optimizing deep learning predictive models: A comprehensive review of RNN and its variant architectures. Applied Soft Computing. Oct 9:114015.
• Biswas T, Banerjee P and Paul A (2022). Impact of low-latitude ionospheric effects on precise position determination. Radio Science, 57(4): 1-11.
• Dabbakuti JK (2021). Modeling and optimization of ionospheric model coefficients based on adjusted spherical harmonics function. Acta Astronautica, 182: 286-294.
• Gonzalez J and Yu W (2018). Non-linear system modeling using LSTM neural networks. IFAC-PapersOnLine, 51(13): 485-489.
• Hochreiter S and Schmidhuber J (1997). Long short-term memory. Neural Computation, 9:1735-1780.
• Jee G, Lee HB, Kim YH, Chung JK, Cho J (2010). Assessment of GPS global ionosphere maps (GIM) by comparison between CODE GIM and TOPEX/Jason TEC data: Ionospheric perspective. Journal of Geophysical Research: Space Physics. 115: A10.
• Kaselimi M, Voulodimos A, Doulamis N, Doulamis A, Delikaraoglou D. (2020). A causal long short-term memory sequence to sequence model for TEC prediction using GNSS observations. Remote Sensing. 12(9): 1354.
• Noor MH and Ige AO (2025). A survey on state-of-the-art deep learning applications and challenges. Engineering Applications of Artificial Intelligence. 159: 111225.
• Osanyin TO, Candido CM, Becker-Guedes F, Migoya-Orue Y, Habarulema JB, Obafaye AA, Chingarandi FS, Moraes-Santos SP (2023). Performance of a locally adapted NeQuick-2 model during high solar activity over the Brazilian equatorial and low-latitude region. Advances in Space Research. 72(12): 5520-38.
• Osanyin TO, Maria Nicoli Candido C, Becker-Guedes F, Migoya-Orue Y, Habarulema JB (2025). Ingestion of GNSS-Derived-TEC Into NeQuick 2 Model Over South America. Space Weather. 23(12): e2024SW004212.
• Reddybattula KD, Nelapudi LS, Moses M, Devanaboyina VR, Ali MA, Jamjareegulgarn P, Panda SK (2022). Ionospheric TEC forecasting over an Indian low latitude location using long short-term memory (LSTM) deep learning network. Universe. 8(11): 562.
• Sarker IH (2021). Deep learning: a comprehensive overview on techniques, taxonomy, applications and research directions. SN Computer Science. 2(6): 1-20.
• Seemala GK, Katual I, Kapil C, Vichare G (2023). Seasonal and solar activity dependence of TEC over Bharati station, Antarctica. Polar Science. 38: 101001.
• Seemala GK, Valladares CE. Statistics of total electron content depletions observed over the South American continent for the year 2008 (2011). Radio Science. 46(05): 1-4.
• Thompson Neil C, Kristjan G, Keeheon L, Manso Gabriel F (202). The computational limits of deep learning. Cornell University, arXiv:2007.05558, 10: 2.
• Zhang R, Li H, Shen Y, Yang J, Li W, Zhao D, Hu A (2025). Deep learning applications in ionospheric modeling: progress, challenges, and opportunities. Remote Sensing. 17(1): 124.
For users relying on centimeter-level accuracy — such as surveyors, engineers and autonomous systems — ionospheric disturbances can mean system downtime and significant losses. Traditional network real-time kinematic (NRTK) positioning methods assume smooth ionospheric conditions and thus fail during active solar periods.
To meet these challenges, a research team from Wuhan University and Guangzhou Hi-Target Navigation Tech Co. Ltd. developed an NRTK positioning model capable of maintaining centimeter-level accuracy under intense ionospheric disturbances.
This approach could serve as the foundation for next-generation, self-correcting navigation systems that operate reliably under any atmospheric condition.
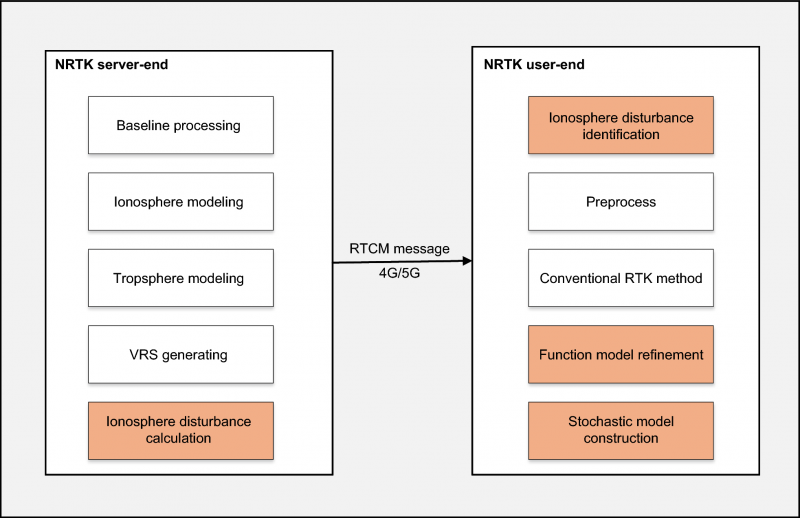
The study (DOI: 10.1186/s43020-025-00179-4), published in Satellite Navigation on Oct. 6, introduces a dual-optimization framework that integrates real-time ionospheric indices with adaptive functional and stochastic models. By learning from disturbance patterns and automatically recalibrating user-side algorithms, the system dramatically enhances GNSS reliability during the ongoing solar cycle peak — offering a key safeguard for positioning technologies in low-latitude regions most vulnerable to ionospheric turbulence.
The innovation centers on leveraging the rate of the total electron content index (ROTI), a key indicator of ionospheric activity, to dynamically adjust both ionospheric residual estimation and observation weighting. When the system detects disturbances, it automatically reduces the influence of affected satellites and refines error models in real time.
Using data from Hong Kong’s Continuously Operating Reference Station (CORS) network — one of Asia’s most active low-latitude regions — the researchers found that ROTI showed a strong positive correlation (0.91) with ionospheric interpolation errors and a negative correlation (–0.9) with signal-fixing rates.
Compared to conventional NRTK methods, their adaptive “Method B” improved horizontal and vertical positioning accuracy by 37.6% and 41.6%, respectively. Moreover, it achieved a stable 84% average fixing rate, even during equinoctial months when ionospheric scintillation is strongest. The results reveal not just a technical upgrade but a practical solution for real-time navigation across regions frequently affected by solar-induced ionospheric noise.
“Our method essentially teaches GNSS systems to think smarter under stress,” said Xiaodong Ren, senior researcher at Wuhan University and lead author of the study. “By allowing the model to ‘sense’ and adapt to space-weather disturbances in real time, we’ve moved beyond static correction systems toward intelligent positioning. This is crucial not only for maintaining accuracy but also for ensuring resilience as solar activity intensifies.”
He added that this approach could serve as the foundation for next-generation, self-correcting navigation systems that operate reliably under any atmospheric condition.
This adaptive NRTK framework marks a significant leap forward for industries that depend on precise, real-time location data — from autonomous driving and drone surveying to precision agriculture and infrastructure monitoring, Ren said. By integrating live ionospheric monitoring into everyday positioning workflows, it ensures continuous accuracy even when solar storms strike.
Future developments may combine the model with artificial intelligence and multi-constellation GNSS networks to further enhance forecasting and resilience. As Earth moves through one of its most active solar cycles, Ren said, such innovations will be essential to keeping navigation, communication and automation systems firmly on course.
One of the most persistent sources of GNSS error — ionospheric delay — has been challenging to correct in real time, especially for mass-market devices. While dual-frequency receivers and commercial correction services can mostly mitigate this issue, they remain too costly and impractical for the billions of smartphones and IoT devices that rely on single-frequency GNSS. Even for dual-frequency systems, the commonly used ionosphere-free linear combination amplifies multipath and receiver errors and reduces data redundancy — yielding only two usable combinations from four original measurements.
This landscape may be shifting with the introduction of GloTEC, a real-time global Total Electron Content (TEC) map from NOAA’s Space Weather Prediction Center (SWPC), released in February 2025. GloTEC assimilates both ground- and space-based observations to provide real-time global ionospheric corrections without relying on error-prone linear combinations.
Unlike coarse models such as the broadcast Klobuchar algorithm or forecast-only products such as the predicted IGS Global Ionosphere Maps, GloTEC updates every 10 minutes using real-time measurements. This high refresh rate establishes a new benchmark for open-access ionospheric nowcasting in GNSS applications.
Originally designed to monitor and mitigate space weather impacts on aviation and communications, GloTEC may also deliver a broader benefit: enabling precise, scalable GNSS corrections for low-cost, single-frequency devices, making high-accuracy positioning more accessible and democratic.
Why Nowcasting Matters for GNSS
The GNSS community has long had to choose between accuracy and latency. Predictive models, such as those from NASA CEDIS or CODETEC, can offer reasonable approximations but may fall short when real-time corrections are required, particularly in the context of navigation, asset tracking or autonomous systems.
Post-processed products (such as rapid/final IGS GIMs) provide excellent fidelity but are typically delayed by hours, days, or even weeks. This makes them useful for research or auditing, but not for real-time navigation needs.
Commercial correction services, such as Trimble RTX and Hexagon’s TerraStar, have filled the gap for high-value applications. These systems interpolate ionospheric corrections in real time, but at a significant cost and they typically require specialized GNSS receivers.
GloTEC bridges this gap by delivering a publicly accessible, high-refresh ionospheric product that can support near real-time corrections. Updated every 10 minutes with a 2.5° latitude and 5° longitude spatial resolution, GloTEC represents a major step forward for public sector GNSS capability, particularly in contexts where accuracy, reliability and scale are all crucial. The data has also been supporting the United States Space Force and is accessible through their Unified Data Library (UDL).
Technical Approach: Adapting GloTEC for Practical Use
While the potential of GloTEC is exciting, turning it into usable corrections for consumer-grade devices isn’t straightforward. TEC maps represent volumetric electron density, while most mass-market GNSS chipsets, especially in smartphones, expect simplified models, such as the eight-parameter Klobuchar model broadcast by GPS satellites. GloTEC is a three-dimensional data assimilation system that uses a Gauss-Markov Kalman Filter to estimate electron density in the ionosphere. It ingests slant TEC measurements from ground-based GNSS receivers and space-based radio occultation data, using the IRI-2016 model as its background state.
To bridge this mismatch, Zephr’s team has been exploring regional fitting techniques, whereby a local subset of GloTEC data is used to generate custom Klobuchar coefficients. These can be transmitted to devices via standardized protocols, such as the LTE Positioning Protocol (LPP), enabling improved ionospheric delay estimation with minimal changes to device-side computation. Even with a regionalized Klobuchar fit and LPP encoding, there is still the problem of accessing the GNSS chip to apply the corrections. To solve this problem, Zephr has created a virtualized positioning engine that takes the raw GNSS measurements from the chip and provides a purely software-based solver. This approach allows the team to implement a variety of more advanced positioning techniques using commodity hardware such as smartphones.
Field Testing: A Quantitative Step Forward
To evaluate the efficacy of GloTEC in improving GNSS accuracy, engineers at Zephr used the virtualized positioning engine to conduct 51 real-world campaigns across various conditions – including urban, suburban, static, walking, and driving – using a Pixel 8 smartphone and an RTK unit for ground truth.
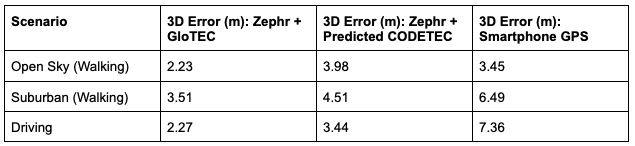
The results were promising, as shown in Figure 1:
Figure 1: GloTEC vs. CODETEC vs. Android Native across multiple scenarios. (All figures provided by author)
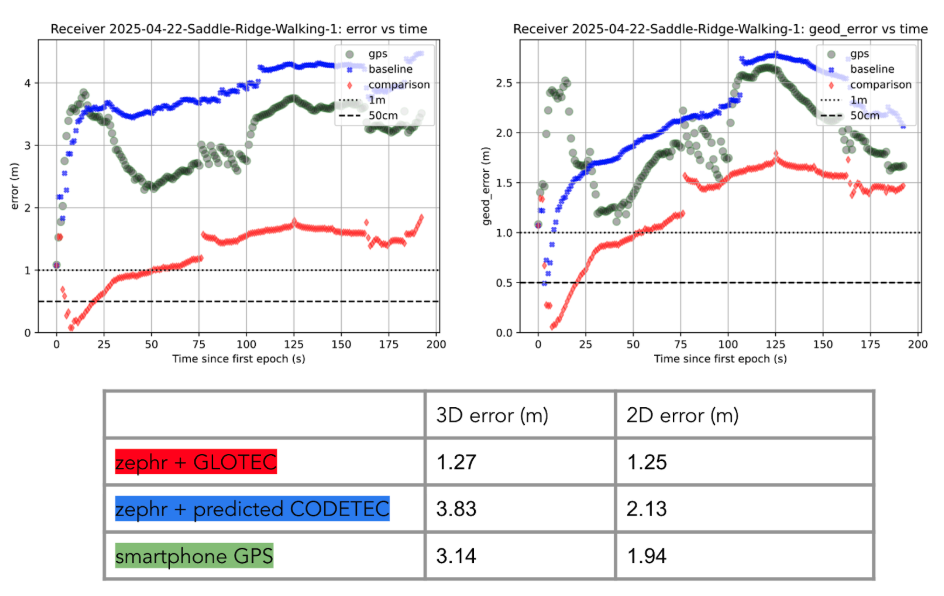
We can break down these results using detailed graphs for each scenario as examples. This will provide a more in-depth look at the positioning for specific traces through the outlined scenarios in Figure 2, Figure 3 and Figure 4:
Figure 2: GloTEC vs. CODETEC vs. Android Native for an open sky walking scenario
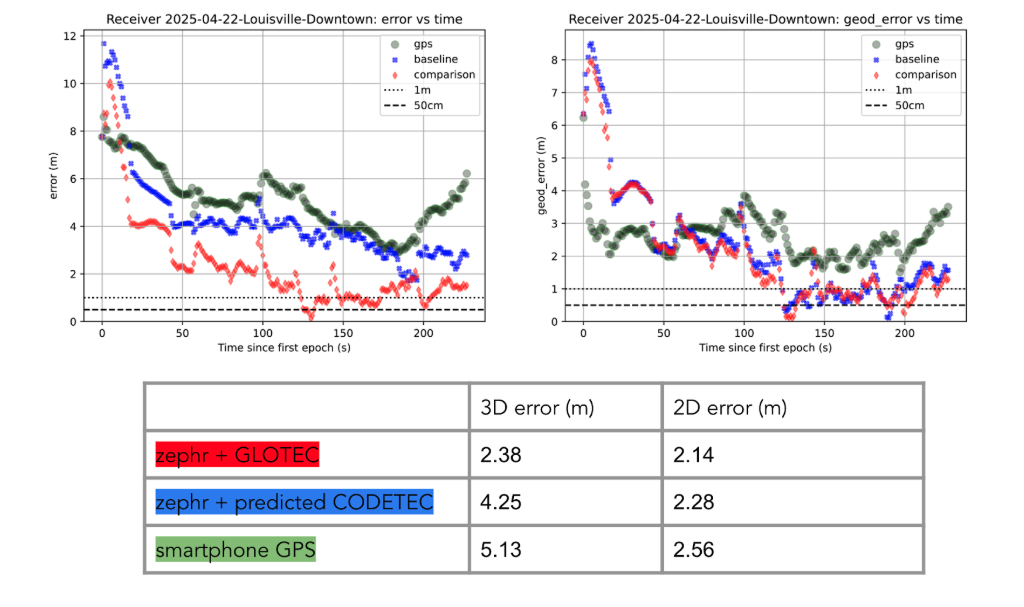
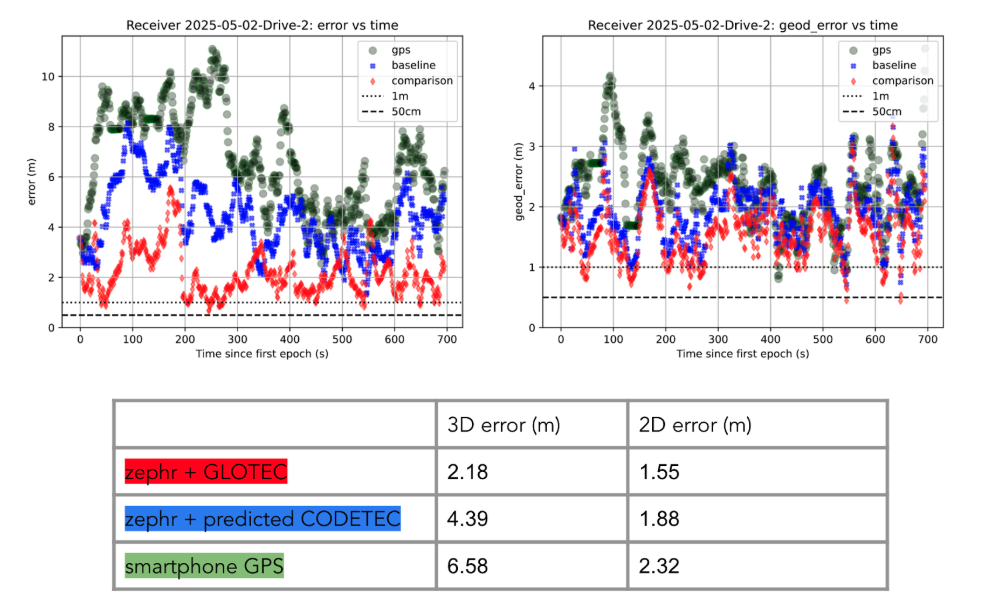
Figure 3: GloTEC vs. CODETEC vs. Android Native for a suburban downtown walking scenario.Figure 4: GloTEC vs. CODETEC vs. Android Native for a mixed sky driving test.
Across all categories, the GloTEC-based regional fitting approach significantly outperformed both the default GNSS solution (which uses broadcast data plus a Klobuchar mode) and the competing IGS products. Accuracy improved by up to 69% in driving scenarios and 46% in walking scenarios, compared to standard smartphone GPS.
While the Pixel 8 used in testing supports dual-frequency GNSS, smartphones face several practical limitations that hinder effective use of ionosphere-free dual-frequency combinations. These include limited signal availability (due to antenna constraints, L1/L5 support gaps, and partial constellation coverage), elevated multipath and noise (especially from omnidirectional antennas in dynamic conditions), and unstable clock biases that complicate error modeling. In fact, iono-free combinations can amplify multipath effects, potentially degrading accuracy in some conditions.
Despite these constraints, the results show that meaningful improvements in positioning are possible using a software-based approach with publicly available corrections. GloTEC, when paired with cooperative or cloud-based GNSS engines, offers a substantial step forward without requiring expensive commercial correction services or specialized hardware.
Broader Implications and Next Steps
While these results are promising, several challenges remain before GloTEC-based corrections can be broadly deployed:
Connectivity Requirements: Real-time access to GloTEC requires periodic downloads over cellular or Wi-Fi connections, raising questions about reliability in low-bandwidth or disconnected environments.
Global Calibration: The accuracy of regional fitting depends on local coverage density and VTEC variability. Further tuning may be needed in equatorial or polar regions, where ionospheric behavior is more volatile.
Nevertheless, the availability of GloTEC marks a significant milestone. For the first time, a free, real-time, high-resolution ionospheric correction product is accessible to developers, researchers, and engineers seeking to improve GNSS accuracy at scale. NOAA SWPC has plans to integrate more low-latency space-based and ground-based data into GloTEC in the near future. The new version of the model outputs will be released to the public once the results are validated. As techniques for applying it to mobile and IoT devices mature, the GNSS community may see a broad shift toward more precise, resilient, and cost-effective positioning systems.
GloTEC may have been designed to help forecasters monitor the response of the ionosphere due to space weather events, but its potential to provide an advanced tool for positioning on Earth is just beginning to be understood. In a world where nearly every mobile application depends on location, and where the cost of poor accuracy is rising (from package delivery failures to navigation errors), this kind of public infrastructure is invaluable.
Researchers and industry developers alike should explore how this NOAA capability can be integrated into their positioning systems. If properly supported, GloTEC could become one of the most impactful GNSS innovations of the decade.
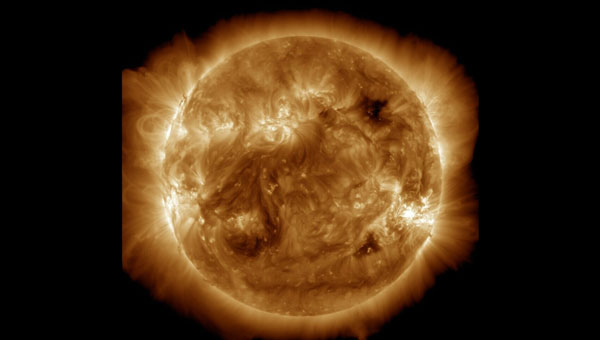
NASA’s Solar Dynamics Observatory captured this image of solar flares on May 11, 2024. The NOAA says there have been measurable effects and impacts from the geomagnetic storm. (Photo: Solar Dynamics Observatory)
Earth is experiencing a severe solar storm causing concern for those responsible for power grids, communication systems and satellites.
The National Oceanic and Atmospheric Administration (NOAA) has reported measurable effects and impacts from the geomagnetic storm that has been visible as aurora across vast swathes of the Northern Hemisphere. As of May 12, 2024, NOAA had seen no reports of major damage.
There has been some degradation and loss to communication systems that rely on high-frequency radio waves, NOAA told NPR, as well as some preliminary indications of irregularities in power systems.
“Simply put, the power grid operators have been busy since yesterday working to keep proper, regulated current flowing without disruption,” said Shawn Dahl, service coordinator for the Space Weather Prediction Center at NOAA.
“Satellite operators are also busy monitoring spacecraft health due to the S1-S2 storm taking place along with the severe-extreme geomagnetic storm that continues even now,” Dahl added, saying some GPS receivers have struggled to lock locations and offered incorrect positions.
As NOAA warned, the Earth has been experiencing a G5, or “extreme,” geomagnetic storm. It is the first G5 storm to hit the planet since 2003, when a similar event temporarily knocked out power in part of Sweden and damaged electrical transformers in South Africa.
As of May 13, NOAA’s Space Weather Prediction Center said that a G3, or “strong,” geomagnetic storm warning was in effect until 2 a.m. ET. While stronger storms are no longer likely and conditions are expected to “gradually wane” throughout the day, the center said in its forecast that moderate to strong geomagnetic storms are “likely” on May 13, as are minor storms on May 14.
The center also said that “solar activity is expected to be at high levels” with a possibility of more solar flares, or bursts of electromagnetic radiation from the sun.
The update came as another X-class solar flare was recorded. X-class flares are the strongest class of these solar bursts, and the latest was recorded as “moderate.”
Flares of this magnitude are not frequent,” the center said. “…Users of high frequency (HF) radio signals may experience temporary degradation or complete loss of signal on much of the sunlit side of Earth.”
Northern lights in unusual places
On May 12, people from all around the world shared photos of a dazzling display of the Northern Lights, which were visible in Russia, Scandinavia, the United Kingdom, continental Europe and some even reported seeing the aura as far south as Mallorca, Spain.
In the United States, the NOAA center shared that the storm-induced auroras were visible as far south as Northern California and Alabama.
The source of the solar storm is a cluster of sunspots on the sun’s surface that is 17 times the diameter of Earth. The spots are filled with tangled magnetic fields that can act as slingshots, throwing huge quantities of charged particles toward our planet. These events, known as coronal mass ejections, become more common during the peak of the Sun’s 11-year solar cycle.
While the storm has proven to be large, predicting the effects of such incidents can be difficult, Dahl said.
The world has grown more reliant on electronics and electrical systems. Depending on the orientation of the storm’s magnetic field, it could induce unexpected electrical currents in long-distance power lines. Those currents could cause safety systems to flip and trigger temporary power outages in some areas.
I took these photos near Ranfurly in Central Otago, New Zealand. Anyone can use them please spread far and wide. :-) https://t.co/NUWpLiqY2S
— Dr Andrew Dickson reform/ACC (@AndrewDickson13) May 10, 2024
The storm caused some navigational systems in tractors and other farming equipment to break down, suppliers and farmers told the New York Times.
Farmers have become dependent on equipment that utilizes GNSS and other navigation technology to help them plant more effectively — a practice known as precision agriculture. However, some of these operations in the Midwest, as well as in other parts of the United States and Canada, came to a temporary halt.
How it affects the ionosphere
The storm will also likely disrupt the ionosphere, a section of Earth’s atmosphere filled with charged particles. Some long-distance radio transmissions use the ionosphere to “bounce” signals around the globe, and those signals can be disrupted.
The particles may also refract and otherwise scramble GNSS signals, according to Rob Steenburgh, a space scientist with NOAA. Those effects can linger for a few days after the storm.
The storms can bring on ionospheric scintillation, which refers to rapid fluctuations in GNSS signal strength and phase due to localized irregularities in the electron density of the ionosphere resulting from solar activity. Scintillation adversely affects GNSS positioning, particularly around the geomagnetic equator after local sunset.
Similarly to Dahl, Steenburgh said that it is unclear just how bad the disruptions will be. While we still depend on GNSS, there are also more satellites in orbit. Moreover, the anomalies from the storm are constantly shifting through the ionosphere like ripples in a pool. “Outages, with any luck, should not be prolonged,” Steenburgh said.
GNSS researchers presented hundreds of papers at the 2022 Institute of Navigation (ION) GNSS+ conference, which took place Sept. 19–23 in Denver, Colorado, and virtually. The following five papers focused on atmospheric effects on GNSS signals. The papers are available at www.ion.org/publications/browse.cfm.
Addressing Scintillation Error
Mitigating the scintillation effect at low latitude is a complex matter: several kinds of experimental data must be collected, realistic models must be developed, and, most importantly, useful real-time indices and alerts must be made available.
The authors introduce a prototype based on a patent owned by SpacEarth Technology to address scintillation error detection and mitigation, supporting precision GNSS-based services at low latitudes in any season and space weather conditions. The patent relates to a method of total electron content (TEC) and scintillation empirical forecasting, in particular short-term forecasting (seconds to minutes). The output of the method is necessary to feed mitigation algorithms aiming at improving accuracy on GNSS precise positioning techniques (RTK, NRTK, and PPP) under ionospheric harsh conditions.
The prototype is designed with a Central Elaborating Facility, which collects the data provided by a network of GNSS monitoring stations detecting scintillation events, and broadcasts foreseen scintillation parameters. Users with a rover mitigation device can apply the parameters from the central facility for scintillation error mitigation.
Vincenzo Romano, INGV and SpacEarth Technology; Claudio Cesaroni, INGV; Luca Spogli, Alessandro Fiorini, INGV and SpacEarth Technology; Marco Fermi, Gter; Lorenzo Benvenuto, Gter and University of Genoa; Tiziano Cosso, Gter; Marcin Grzesiak, SRC/PAS; Joao Francisco Galera Monico, Italo Tsuchiya, UNESP; Gabriel Oliveira, Marcos Guandalini; “Ionospheric Scintillation Mitigation at Low Latitude to Improve Navigation Quality.”
Ring of Fire GUARDIAN
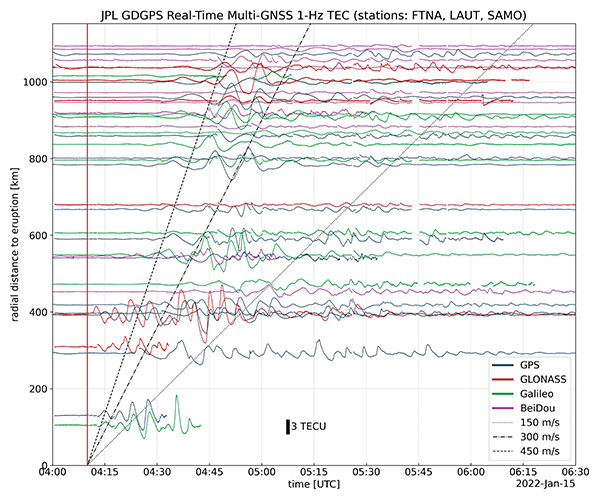
Commonly, natural hazards release energy into the Earth’s atmosphere in the form of acoustic-gravity waves, which propagate up to the ionosphere. The resulting traveling ionospheric disturbances (TIDs) can be detected using GNSS signals, through the computation of the integrated total electron content (TEC) along the lines of sight between GNSS receivers and satellites. The global distribution of ground-based GNSS receivers constantly tracking multiple GNSS constellations (GPS, Galileo, GLONASS, BeiDou, and others) provides excellent spatio-temporal coverage around the world, including in areas of limited coverage by existing warning systems.
The authors present the operational GNSS-based Upper Atmospheric Real-time Disaster Information and Alert Network (GUARDIAN). Based on dual-frequency GNSS data from the Global Differential GPS (GDGPS) network of the Jet Propulsion Laboratory, the GUARDIAN architecture computes slant TEC time series in near real time.
As part of the GDGPS network, 78 stations around the Pacific ring of fire monitor the four GNSS constellations: GPS, Galileo, GLONASS and BeiDou. Cycle slips are corrected and the time series are filtered, both in real time. The resulting data stream is output live to a user-friendly public website, benefitting the general public and the scientific community.
The current GUARDIAN focuses on the Pacific region. However, the architecture can readily be extended to a worldwide coverage.
Léo Martire, S. Krishnamoorthy, L. J. Romans, B. Szilágyi, P. Vergados, A. W. Moore, A. Komjáthy, Y. E. Bar-Sever, A. B. Craddock, NASA Jet Propulsion Laboratory, California Institute of Technology; “GUARDIAN: A Near Real-Time Ionospheric Monitoring System for Natural Hazards Early Warnings.”
Civil Aviation Interference
The authors provide a survey on GNSS receiver architectures with emphasis on new carrier-tracking techniques for mitigating the adverse effect of ionospheric scintillation within the context of civil aviation. The survey is complemented by results gathered from simulations on the impact of ionospheric scintillation in conventional receiver architectures. A review on scintillation mitigation techniques is carried out, covering several “technique families,” highlighting their potential for performance improvement, as well as their shortcomings and challenges in implementation.
A semi-analytical simulation campaign is carried out for different modulations: L1, L5 for GPS, and E1, E5a for Galileo. Here, the performance of a standard receiver tracking a set of GPS and Galileo satellites affected by ionospheric scintillation is analyzed to pinpoint existing vulnerabilities to this effect.
The simulation results show that ionospheric scintillations are responsible for large variations in carrier-to-noise ratio, which in turn can be responsible for losses of lock and large phase variations, increasing phase RMSE and in some cases leading to cycle slips of the phase estimation. Thus, the adopted solution must be robust to signal power fluctuations and the occurrence of cycle slips and able to maintain phase lock.
António Negrinho, GMV-PT Pedro Boto, GMV-PT Marta Cueto, GMV-ES Mikael Mabilleau, EUSPA Claudia Paparini, EUSPA Ettore Canestri, EUSPA; “Survey on Signal Processing Techniques for GNSS Ionospheric Scintillation Mitigation.”
Tonga Eruption Data Analyzed
Extreme natural disasters, such as volcanic eruptions, can create visible pressure waves in the atmosphere and trigger observable ionospheric wave responses that can travel hundreds of kilometers in the ionosphere. The acoustic and gravity waves generated can cause ionospheric TEC perturbations and variations. The TEC determines the GNSS ionospheric delay and can cause significant positioning errors, which may affect the performance of GNSS-based applications.
The researchers processed GNSS data collected from the Hong Kong Satellite Positioning Reference Station Network to analyze the ionospheric activity and positioning performance responding to the Tonga volcanic eruption on Jan. 15, 2022. To detect and repair cycle-slip jumps, the researchers applied theTEC rate and Melbourne Wubbena Wide Lane (MWWL) linear combinations. A Savitzky-Golay low-pass filter with a 30s window was used to improve the TEC accuracy.
The team investigated the changes in TEC, Rate of TEC index (ROTI) and positioning errors in the eastward, northward and upward directions after the anomalous ionospheric propagation to Hong Kong between 11:30 and 14:30. The team found the ionospheric anomaly could generate large changes in the three parameters, with peaks up to three times the calm period. Their prompt research contributes to a better understanding of the coupling of extreme ionospheric activities and dynamics caused by volcanic eruptions.
Xiaojia Chang, Kai Guo, Zhipeng Wang, Kun Fang, Hongxia Wang, Beihang University; Hailong Chen, China Academy of Aerospace Electronics Technology; “Ionospheric Anomaly and GNSS Positioning Responses to the January 2022 Tonga Volcanic Eruption.”
Toolbox for Monitor Network
The MONITORtoolbox is a set of Python-coded software tools to perform automatized large-scale processing of data from the Monitor network of the European Space Agency (ESA). The Monitor network aims to continuously monitor ionospheric scintillation events from multiple ground stations strategically located around the globe. It accommodates a repository with a large number of GNSS measurements containing scintillation events for users to analyze scintillation data or for research purposes.
This paper shows the potential of the MONITORtoolbox for providing access to a large amount of data that otherwise, without a systematic processing, becomes practically useless. The software developed implements the means to collect data and store it in a local database for quick offline access. It detects the presence of scintillation events based on certain conditions and criteria defined by the user and identifies its properties in terms of duration, time of occurrence, intensity and satellite location. It implements the tools to compute relevant statistics, providing insights on ionospheric scintillation phenomena.
Sergi Locubiche-Serra, Alejandro Pérez-Conesa, Diego Fraile-Parra, Gonzalo Seco-Granados, José A. López-Salcedo, Universitat Autònoma de Barcelona, IEEC-CERES; Juan M. Parro-Jiménez, Raúl Orús-Pérez, ESTEC, European Space Agency; “MONITORtoolbox — Software Tool for the Analysis of Ionospheric Scintillation Data from the ESA Monitor Network.”
The largest source of error in GNSS positioning is the delay suffered by the signals as they pass through the ionosphere traveling from the satellites in orbit to receivers on or near Earth’s surface. That is because the ionosphere is full of free electrons stripped from atoms and molecules by ionization and this plasma refracts the signals, changing their speed. Normally, models compensate for this. However, geomagnetic storms wreak havoc on the free electrons in the ionosphere, making it difficult to accurately determine the signal delay.
That is why space weather matters for GNSS and for the myriad human activities that have come to depend on it.
So, here’s the good news. “On a scale of one to five, the geomagnetic storm on April 14 was a three,” Bill Murtagh told me. Murtagh is the Program Coordinator and Space Weather Forecaster at the Space Weather Prediction Center (SWPC) of the National Oceanic and Atmospheric Administration (NOAA). He was referring to the third rung of NOAA’s space weather scales, which were introduced to communicate to the public the current and future space weather conditions and their possible effects on people and systems.
NOAA has three space weather scales, one each for geomagnetic storms (G scale), solar radiation storms (S scale), and radio blackouts (R scale). The steps on the scales, ranging from “minor” to “extreme,” are analogous to those NOAA uses to classify hurricanes, tornadoes and earthquakes. They describe the environmental disturbances for each of these events and list their possible effects at each level.
Solar activity runs in 11-year cycles. A G5 event happens two or three times per cycle, and the last one was in October 2003, Murtagh told me. “I can only remember a handful of occasions over the past 20 years when ionospheric activity has significantly impacted users,” told me Gavin Schrock, PLS, manager of the Washington State Reference Network, a regional cooperative of GPS reference stations and data. According to Rick Hamilton, the GPS Information Analysis Team Lead at the U.S. Coast Guard Navigation Center, it “did not receive any reports of interference related to the geostorm” and “there was no significant increase in reports that we might attribute to geomagnetic activity.”
Now, the bad news. We are heading for a maximum in solar activity, expected to occur in 2025. The Sun is “already quite active,” Murtagh pointed out, and recently there has been an increase in the number of R1 and R2 storms. Solar coronal mass ejections (CMEs), which launch plasma and magnetic fields into space, also have become more frequent. When a CME hits the Earth, its collision with the Earth’s magnetic field causes a geomagnetic storm.
So, the GNSS constellations and the GNSS industry should be preparing now. Fortunately, improvements in GNSS software and receiver technology, plus corrections and integrity information and the much larger number of satellites, make us better prepared than we were during the last cycle. On the other hand, the stakes also are much larger, due to our ever-greater reliance on GNSS.
As a sailor, I rely on NOAA nautical charts and marine weather forecasts. GNSS users can thank NOAA for its space weather forecasts.
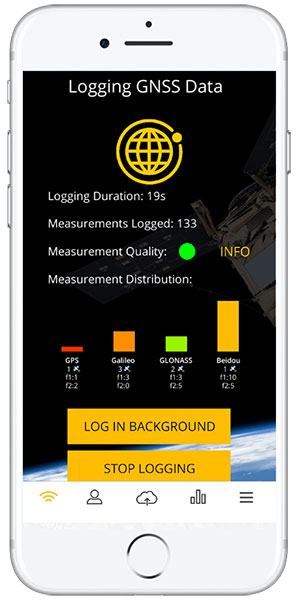
A new Android app released by the European Space Agency (ESA) turns smartphones equipped with dual-frequency GNSS receivers into instruments for crowdsourced science.
The CAMALIOT app, developed through ESA’s Navigation Innovation and Support Programme (NAVISP) with the support of the GNSS Science Support Centre, is suitable for more than 50 smartphone models.
Using the CAMALIOT app, the phones will record small variations in satellite signals, gathering data for machine learning analysis of meteorology and space weather patterns.
As well as helping to create new Earth and space weather forecasting models, participants are also in with the chance to win prizes including new phones and Amazon vouchers. This four-month “citizen science” campaign runs until the end of July.
“The precisely modulated signals continuously generated by the dozens of GNSS satellites in orbit are proving a valuable resource for science, increasingly employed to study Earth’s atmosphere, oceans and surface environments,” said ESA navigation engineer Vicente Navarro. “Our GNSS Science Support Centre was created to help support this trend.”
For instance, tens of thousands of permanent GNSS stations are continuously recording GNSS data. As the satellite signals travel down to Earth they are modified by the amount of water vapor in the lower atmosphere, helping to forecast rainfall in particular.
GNSS signals also undergo delay and fading — known as scintillation — as they pass through irregular plasma patches in the ionosphere. This electrically charged upper atmospheric layer is continuously changing, influenced by solar activity, geomagnetic conditions and the local time of day. Dual-frequency GNSS receivers can compensate for this effect by comparing their two frequencies.
“The combination of Galileo dual band smartphone receivers and Android’s support for raw GNSS data recording is what opened up the prospect of supplementing data from these fixed GNSS stations with tens of millions of smartphones, vastly increasing our density of coverage,” Vincente said. “We took inspiration from the famous ‘SETI@home’ initiative, where home laptops help seek out signs of extraterrestrial life.”
The results can then undergo a Big Data machine learning approach, seeking out previously unseen patterns in both Earth and space weather.
“This is our first step in enlarging GNSS data acquisition using an internet of things data-fusion approach, employing novel sources such as fixed sensors and drones as well as smartphones,” Vincente said. “A wide range of other applications are also possible for the system, including improving the performance of GNSS systems.”
Formally known as the Application of Machine Learning Technology for GNSS IoT Data Fusion project, CAMALIOT is run by a consortium led by ETH Zurich (ETHZ) in collaboration with the International Institute for Applied Systems Analysis (IIASA).
“The CAMALIOT effort was underpinned by Element 1 of our NAVISP research programme, spurring innovation in satellite navigation,” said Pierluigi Mancini, ESA’s NAVISP program manager.
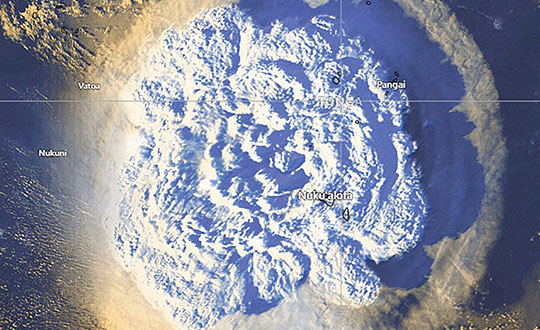
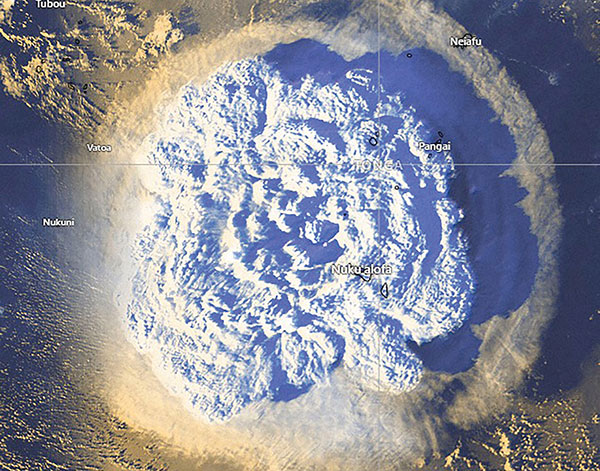
On Jan. 15, Hunga-Tonga-Hunga-Ha’apai, an uninhabited volcanic island on the Tongan archipelago in the South Pacific Ocean, erupted with spectacular force, churning ocean waters halfway across the globe.
GNSS engineers also detected its effects hundreds of miles above, in the ionosphere. The GNSS community is now moving from such after-the-fact detection to real-time monitoring using NASA’s Global Differential GPS (GDGPS) system, according to a team with the Tracking Systems and Application Section at NASA’s Jet Propulsion Laboratory (JPL) in Southern California.
“We monitored, in real time, four GNSS satellite constellations from numerous stations around the world using the GDGPS network. In particular, the three stations closest to the volcano, in Samoa, Fiji and Tahiti,” said postdoctoral associate Leo Martire. “We could see extremely high and strong signals in the ionosphere, which is very unusual. As a function of radial distance from the eruption, the first detected ionospheric perturbation likely originated directly from the explosion. Then we see patterns propagating at increasing distances at different radial propagation speeds.”
Monitoring such events adds information to the catalog of signals from natural hazards, pointed out Siddharth Krishnamoorthy, a research technologist who manages JPL’s GUARDIAN near-real-time tsunami warning system, currently under development. “That is useful because, in the future, if you want to be able to spot natural hazards and issue alerts, you need to know what the signal looks like. There have been reports of a tsunami in Tonga due to this event, so we will look at potential tsunami-induced signatures in the ionosphere. We are trying to get to a place where we pick up a signal like this and we are able to say, ‘This is a tsunami propagating at this speed and in this direction.’”
Chart: Jet Propulsion Laboratory
Before being detected in the ionosphere, signals from natural hazards must travel all the way from the surface. For tsunamis, this usually takes more than 10 to 20 minutes, but the volcanic eruption only took a couple of minutes to reach the ionosphere because it shot straight up. “We do not know yet, based on observations, how exactly different events on the surface caused by natural hazards couple with the atmosphere,” said research technologist Panagiotis Vergados. “Every event is unique in its spectral properties.”
The event did not affect the quality of GDGPS’s GNSS positions or orbits, because dual-frequency measurements remove significant ionospheric effects. “Instead of looking at the direct effects on the position of our available reference stations, which is what our traditional real-time monitoring does and which was basically negligible, imagine the links from each of those stations to a dozen or more satellites,” said Larry Romans, GDGPS chief technologist. “Every time one of those many links pierces the ionosphere, we can monitor that signal for ripples as waves go by. So, this is an incredibly powerful method for seeing disturbances, just in terms of the density of data. It is very complementary to position-based natural-hazards monitoring because the data is much richer.”
In addition to volcanoes and tsunamis, several other natural events, such as earthquakes and very large thunderstorms, also produce these effects. “These natural forcings cause large-scale, low-frequency pressure perturbations that tend to travel up and be visible in the ionosphere,” Krishnamoorthy said. “There are also perturbations of the ionosphere due to events from outside the Earth, such as solar flares or bolide impacts.”
Many of these perturbations start from the troposphere, which ranges between 10 km and 15 km in altitude — including hurricanes, which overshoot gravity waves all the way to the ionosphere, and thermal tides that have been observed to go all the way up to 600 km, said Vergados. “There are also geomagnetic storms and sub-storms that, during electron precipitation, can change the ionization of the ionosphere. So, the coupling can happen from either below or above or simultaneously, and then the effect can be dramatically enhanced.”
Most of the perturbations that come from below are of a pressure nature — that is, they start out as mechanical waves — while most of those that come from above are electromagnetic. “Aside from nuclear explosions, very large chemical ones, such as the 2020 Beirut explosion, also cause a signature on the ionosphere because they create very large pressure waves,” Krishnamoorthy said.
Photo: Tonga Meteorological Services, Government of Tonga
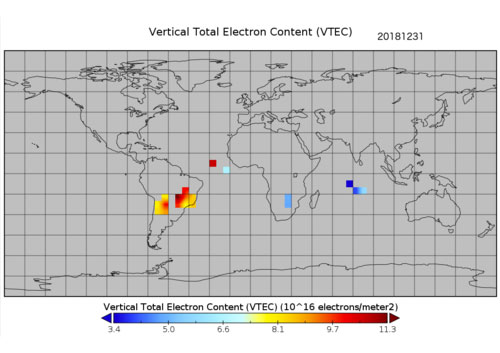
A new data source to help scientists better understand the ionosphere and its potential impact on communications and positioning, navigation and timing (PNT) is now available to the public.
The data, which was collected by sensors on GPS satellites in 2018, was released through a collaborative effort by Los Alamos National Laboratory and the National Oceanic and Atmospheric Administration (NOAA).
“Radio signals from satellite or ground-based transmitters can travel through the ionosphere or bounce off of it, so ionospheric conditions have the potential to disrupt communications depending on the density of electrons,” said Erin Lay, a remote-sensing scientist at Los Alamos who was a technical lead on the project. “This new set of data will help us better model and predict the behavior of the ionosphere and possibly improve the reliability of our communications and positioning, navigation, and timing services, which are critical for both everyday life and national security.”
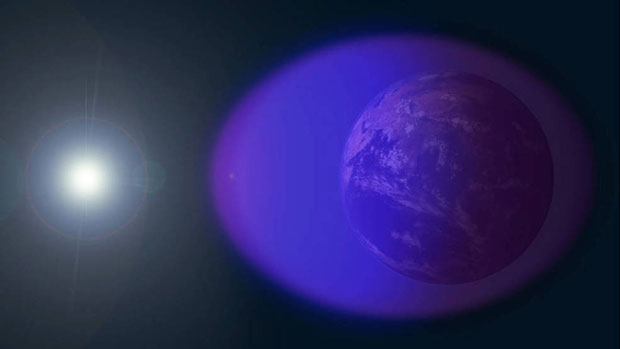
The ionosphere is the boundary between Earth’s atmosphere and space, stretching 40 to 250 miles above Earth’s surface. It is composed of tenuous atmosphere and charged particles (ions and electrons) that interact with traversing radio waves. The behavior of the ionosphere reacts to weather on Earth, such as thunderstorms, wind, and hurricanes, as well as space weather created by solar winds impacting Earth’s magnetic field.
“NOAA’s Space Weather Prediction Center (SWPC) serves a huge customer base interested in space weather effects on communications and GPS-reliant technologies,” said Bill Murtagh, program coordinator at SWPC. “We expect access to these Los Alamos data sets to improve the development, validation, and testing of models used at SWPC for characterizing and forecasting ionospheric disturbances.”
Preview graphic. (Image: NOAA)
The new data comes from unique measurements of lightning events, each of which produces a flash of radio waves that gets dispersed through the ionosphere before it is detected on satellite receivers. Each measured flash provides a snapshot of the ionospheric conditions at that instant, and many lightning measurements accumulated over time provide a unique view of ionospheric weather. This is the first-ever global set of ionospheric electron density data to use a naturally occurring source phenomena.
Before this release, the data available to feed ionosphere models was primarily from arrays of ground-based receivers, which are limited because they only monitor fixed locations. According to Lay, “the new data is gathered from lightning that happens all over the world and will give scientists the opportunity to study the ionosphere in ways previously not possible.”
The release of underutilized data sets was a priority established in the 2019 National Space Weather Strategy and Action Plan. Los Alamos processed the data from its radio-frequency sensors that are onboard GPS satellites and used for nuclear treaty monitoring, and then worked with a government interagency group, called the Space Weather Operations, Research and Mitigation (SWORM), to facilitate public release.
NOAA’s National Centers for Environmental Information will host the data on existing sites that serve terrestrial weather and space weather resources.
The ionosphere is shown in purple and not-to-scale in this image. (Image: NASA’s Goddard Space Flight Center/Duberstein)
Adva’s OSA 5405-MB provides nanosecond timing at a network’s edge. (Photo: Business Wire)
Adva has launched the OSA 5405-MB, a compact outdoor precision time protocol (PTP) grandmaster clock with multi-band GNSS receiver and integrated antenna.
Part of the OSA 5405 series of smart synchronization devices for indoor or outdoor deployment, the OSA 5405-MB ensures timing accuracy by eliminating the impact of ionospheric delay variation. This empowers communication service providers and enterprises to deliver the nanosecond precision needed for 5G fronthaul and other emerging time-sensitive applications.
The GNSS receiver and antenna enable the OSA 5405-MB to meet PRTC-B accuracy requirements (+/-40 nanosec0nds) even in challenging conditions. For the first time, the technology is available in an edge timing device with minimal footprint, helping operators achieve unprecedented accuracy and reliability as they roll out wide-spread small cell networks.
“Our multi-band, multi-constellation GNSS receiver provides an extremely cost-efficient way to achieve PRTC-B UTC-traceable network timing with the levels of accuracy needed for next-generation use cases,” said Gil Biran, general manager, Oscilloquartz, Adva. “By adding this technology to our versatile, small-form-factor OSA 5405 series, we’re offering a route to precision synchronization at the network access without significant investment.”
“A ruggedized design and minimal visibility make our OSA 5405-MB easy to install in almost any outdoor location,” Biran said. “With the power to compensate for ionospheric delay variations and resilience against jamming and spoofing, our compact edge solution really is the key to 5G synchronization.”
The OSA 5405 series is a versatile timing solution for deployment deep in urban canyons, where advanced end applications require stringent synchronization. With its small form factor, the OSA 5405-I indoor variant can be positioned on windows to avoid multipath signal interference.
Offering both electrical and optical interfaces and with cost-effective Ethernet cabling, the OSA 5405 series avoids RF feeds of traditional GNSS installations by integrating an antenna, receiver and PTP grandmaster in a single device.
Ionospheric Delays. With multi-band GNSS technology, the OSA 5405-MB also protects against timing inaccuracies caused by ionospheric disturbance. By receiving GNSS signals in two frequency bands and using the differences between them to calculate and compensate for delay variation, the OSA 5405-MB eliminates inaccuracy and ensures ultra-precise synchronization whatever the space weather conditions.
It can work with up to four GNSS constellations concurrently (GPS, Galileo, GLONASS and BeiDou), increasing the number of observable satellites in urban canyons. A comprehensive set of Syncjack PTP and GNSS jamming and spoofing monitoring features in combination with Adva’s Ensemble Controller and Sync Director assures high synchronization quality and provides transparency for simple operation of large synchronization networks.
The OSA 5405-MB also offers network-delivered timing backup to further mitigate GNSS vulnerabilities and make synchronization more robust and resilient.
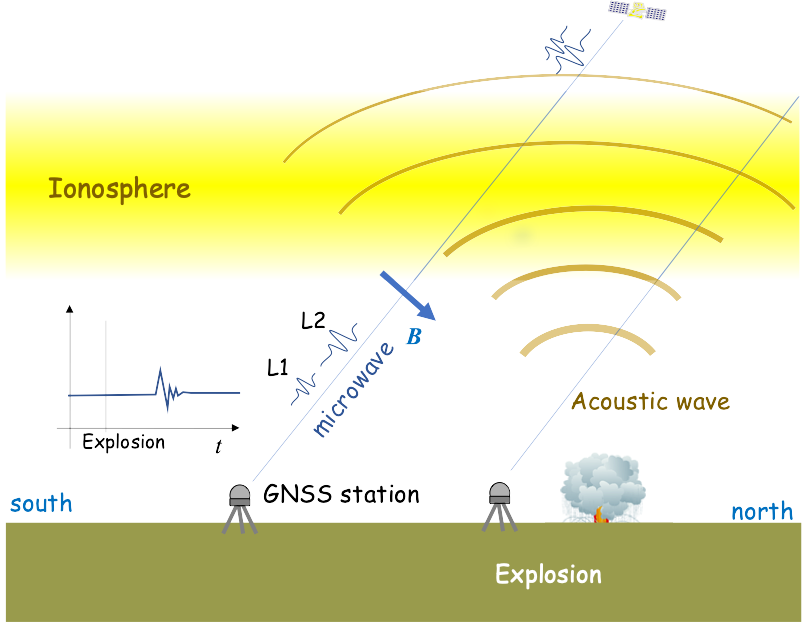
A 2020 explosion in Lebanon’s port city of Beirut led to a southward-bound, high-velocity atmospheric wave that rivaled ones generated by volcanic eruptions.
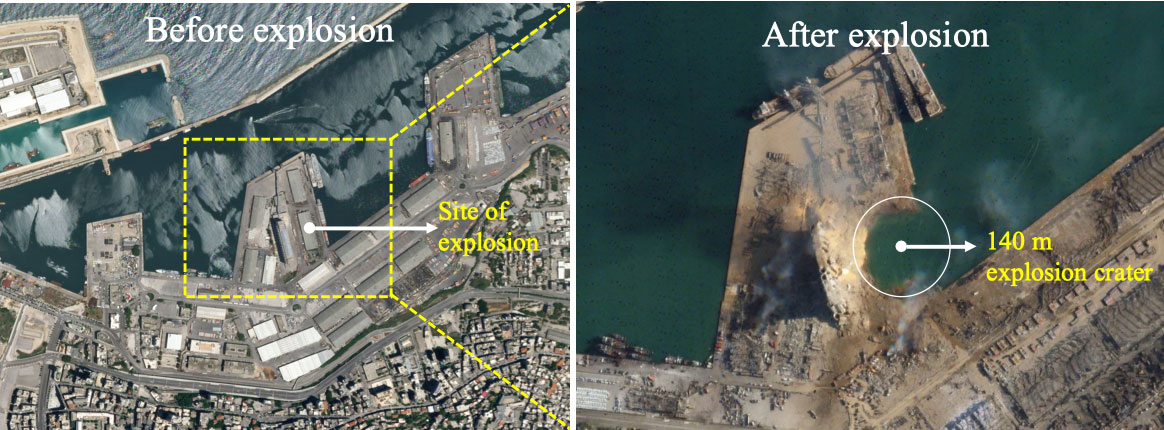
The epicenter in Beirut, before and after the explosion.(Image: Bhaskar Kundu, et al. Scientific Reports. Feb. 2, 2021).
Just after 6 p.m. local time (15:00 UTC) on Aug. 4, 2020, more than 2,750 tons worth of unsafely stored ammonium nitrate exploded in Lebanon’s port city of Beirut, killing around 200 people, making more than 300,000 temporarily homeless, and leaving a 140-meter-diameter crater in its wake. The blast is considered one of the most powerful non-nuclear, man-made explosions in human history.
Now, calculations by Hokkaido University scientists in Japan have found that the atmospheric wave from the blast led to electron disturbances high in Earth’s upper atmosphere. They published their findings in the journal Scientific Reports.
The team of scientists, which included colleagues from the National Institute of Technology Rourkela in India, calculated changes in total electron content in Earth’s ionosphere: the part of the atmosphere from around 50 to 965 kilometres in altitude. Natural events like extreme ultraviolet radiation and geomagnetic storms, and man-made activities like nuclear tests, can cause disturbances to the ionosphere’s electron content.
“We found that the blast generated a wave that travelled in the ionosphere in a southwards direction at a velocity of around 0.8 kilometres per second,” says Hokkaido University Earth and Planetary scientist Kosuke Heki. This is similar to the speed of sound waves travelling through the ionosphere.
The team calculated changes in ionospheric electron content by looking at differences in delays experienced by microwave signals transmitted by GPS satellites to their ground stations. Changes in electron content affect these signals as they pass through the ionosphere and must be regularly taken into consideration to accurately measure GPS positions.
The ionospheric disturbance caused by an explosion can be detected by differential ionospheric delays of microwave signals of two carrier frequencies from global navigation satellite system (GNSS) satellites. (Image: Bhaskar Kundu, et al. Scientific Reports. Feb. 2, 2021).
The scientists also compared the magnitude of the ionospheric wave generated by the Beirut blast to similar waves following natural and anthropogenic events. They found that the wave generated by the Beirut blast was slightly larger than a wave generated by the 2004 eruption of Asama Volcano in central Japan, and comparable to ones that followed other recent eruptions on Japanese islands.
The energy of the ionospheric wave generated by the Beirut blast was significantly larger than a more energetic explosion in a Wyoming coal mine in the USA in 1996. The Beirut blast was equivalent to an explosion of 1.1 kilotons of TNT, while the Wyoming explosion was equivalent to 1.5 kilotons of TNT. The total electron content disturbance of the Wyoming explosion was only 1/10 of that caused by the Beirut blast. The scientists believe this was partially due to the Wyoming mine being located in a somewhat protected pit.