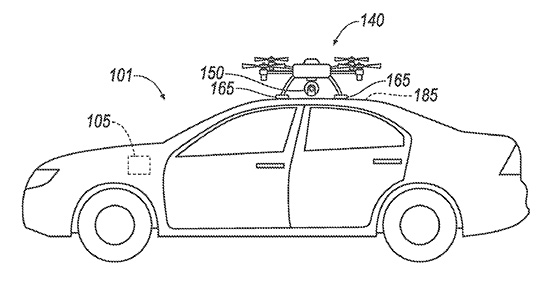
Ford has applied for a patent that would send a drone to dock with an autonomous vehicle and act as a surrogate sensor if one of the car’s sensors failed. The UAV then uses its own sensors to guide the car to a repair facility.
A UAV docks with a car. (Diagram: Ford’s patent application)
The filing from Ford Global Technologies, a subsidiary that manages and commercializes patents and copyrights, outlines the process.
Once the vehicle registers a fault in one of its sensors, it uses a vehicle-to-vehicle (V2V) network to summon the drone, which flies to the vehicle, receives authorization, and then lands atop it. The UAV then serves as a replacement sensor while directing the vehicle to a nearby repair center to fix the car’s sensor.
Ford developed the technology to aid autonomous vehicles that have lost a critical navigation sensor; autonomous cars use GNSS, short- and long-range radar, lidar, cameras and ultrasound.
According to OGC, the Indoor Mapping and Navigation Pilot Initiative, sponsored by the Public Safety Communications Research Division of the National Institute of Standards and Technology (NIST), will create and advance solutions to complex geospatial challenges related to indoor mapping and navigation for first responders.
First responders typically survey high-risk facilities in their jurisdiction at least once per year as part of a preplanning process. The preplanning process can be time-consuming and inefficient, according to OGC, so the Public Safety Communications Research Division of the NIST Communications Technology Laboratory has identified mobile 3D light detection and ranging (lidar) as a potentially transformational technology for first responders. Using lidar and 360-degree camera imagery coupled with advanced software processing, first responders could efficiently capture 3D point clouds and a wealth of other information, both observed and derived, while walking through buildings as part of their routine preplanning operations, OGC said.
In addition to creating point clouds for visualization and mapping, 3D lidar can be used in localization, object classification, integration with virtual/augmented reality solutions, change detection and more. OGC’s Pilot Initiative will call upon a diverse array of leading organizations in the field and leverage standardized, open GIS frameworks, data models and data exchange formats to stimulate the rapid generation of prototypes and demonstrations for these activities.
According to OGC, best practices and lessons learned from the Pilot Initiative shall be captured in engineering reports or other means and, where appropriate, forwarded to the respective standards committees under the OGC and International Standards Organization for consideration.
Participation is only open to OGC members; however, proposals from non-members will be considered provided that a completed application for OGC membership (or a letter of intent to become a member) is submitted prior to (or with) the proposal.
ILMF is a technical conference and exhibition showcasing the latest airborne, terrestrial and underwater lidar, as well as emerging remote-sensing and data collection tools and technologies.
According to organizers, the show will allow attendees and exhibitors to connect with hundreds of professionals seeking lidar and other 3D geospatial data collection technologies to support asset management, civil infrastructure, coastal zone mapping, emergency services and disaster response, land and natural resource management, urban modeling and more. It will also cover the latest advances in lidar technology.
Keynote speakers at the event will include the U.S. Geological Survey’s Jeff Sloan, who will discuss if data from UAS sensors will overtake manned and satellite sources; Colorado State University’s Michael Lefsky, who will discuss reconstructing historic land use and forest structure using aerial photos and structure from motion analysis; and the NASA Jet Propulsion Laboratory’s Eric Larour, who will address a new tool from NASA for coastal planners.
ILMF will be co-located with the ASPRS Annual Conference. The combined event will feature a single exhibit hall. The two events will still have their own technical programs, and attendees will have the option to purchase a conference pass for programs of their choice or a universal pass for all offered programs.
Drones and robots complement traditional platforms, delivering insights in unique use cases.
Guest column by Mike Fuller
Geographic surveys have changed in the last 150 years. What started with early film cameras strapped to hot air balloons, kites and homing pigeons has advanced — both in terms of sensors and the platforms on which they’re deployed. These innovations — which include drones and robots — are changing the way we can collect data, enabling us to gather greater detail and providing richer insights about the world around us.
These nascent platforms are set to explode in popularity. The global market for remote sensing platforms will more than double in the next four years. It’s projected to reach more than $21 billion by 2022, driven in large part by use of drones, according to an October 2017 report from MarketsandMarkets.
Despite the anticipated growth in drone and robot usage, they will not replace traditional remote sensing platforms such as airplanes, satellites and vehicles. The new technologies bring with them some limitations with regard to the number, size and weight of sensors they can carry, capture rates, area covered and and line-of-site restrictions.
As a result, drones and robots will offer new capabilities that complement the traditional platforms and provide greater geographic detail, as well as the ability to be quickly deployed and constantly monitor areas where humans cannot routinely go.
How far we’ve come
To understand how far geographic information system (GIS) mapping and remote sensing technology has come, it’s important to consider how it started. Inventors in the 1800s relied on early film cameras and somewhat unreliable, imprecise airborne platforms — such as hot air balloons, pigeons and kites — to conduct land surveys and do surveillance.
The introduction of a new kind of “bird” — the airplane — opened up new opportunities in the 1900s, supporting the use of more accurate aerial photography for reconnaissance and mapping.
Satellite technology launched remote sensing into space in the 1970s, supporting the collection of detailed multispectral data that led to improved understanding of minerals, soils, urban growth, agriculture and other geographic features.
Even though the technology has become more sophisticated, GIS professionals still leverage data from many of these historical platforms:
Manned aircraft – planes and helicopters
Satellites – high-resolution satellites and cubesats
Terrestrial – survey vehicles and handheld devices
But — much like the impact of airplanes and satellites — we’re on the precipice of another significant milestone for remote sensing. Marked by use of burgeoning drone and robotic technology, this new technology will complement traditional platforms and deliver more insights than ever before possible.
Rise of drones and robots
Drones and robots are the newest remote sensing platforms catching the eye of the GIS community. Not only are they cool and cutting-edge, they open up a new class of use cases that were previously not possible with traditional aerial survey methods. They offer new opportunities to monitor remote areas, and their form factors and cost enables a higher frequency of data collection compared to aerial survey.
Because of their unique features, users are envisioning how these platforms can be implemented for remote sensing in many fields, such as energy, oil and gas, aviation, forestry, transportation, emergency management, and natural resource preservation and restoration.
When the frequency of data from these platforms is coupled with analytics and cloud infrastructure, it is possible to acquire, analyze and act in ways that were not possible before.
Keep in mind, though, that each technology comes with trade-offs. Users should assess their goals, and weigh these factors, to determine if drones or robots will deliver the results they wish to achieve. Let’s take a closer look:
Drones
Drones are capable of delivering ultra-high-resolution data, with ground sample distances (GSD) of 1 cm and accuracy of under 5 cm. However, accuracy is highly variable; it can vary based on the drone model, terrain and software used to process the collected data.
The form factor of many drones also limits the ability to do multi-sensor flights. A drone typically can cover no more than a few square miles per day with a visible or multispectral camera, compared to manned aircraft that span hundred of thousands of acres a day carrying hyperspectral, lidar and orthophotography devices simultaneously.
Because they can be deployed quickly, and on a daily basis, drones offer a cost-effective, practical approach for covering small areas compared to other aerial survey methods. But drone usage currently faces a significant impediment.
Current regulations require operators to maintain sight of the devices during all flights. These line-of-site restrictions limit the distance a drone can go on each flight, and require operators to change locations multiple times for a single survey. As a result, frequent revisits can be labor intensive.
Battery life also plays a role in the usability of drones. Most commercial drones can fly for only about 45 minutes, despite continued improvements in battery technology. Combined with the line-of-site restrictions, battery life impacts the amount of territory drones can cover. Most can handle only a few square or linear miles during each flight, making helicopters or airplanes better suited for projects that span hundred of miles or more.
Despite some of the drawbacks, drones are proving ideal in many use cases — from damage assessment and power restoration after hurricanes to data collection for hydraulic modeling, stream restoration design and aquatic habitat assessment.
For example, drones equipped with bathymetric and terrestrial laser scanning sensors are ideal for supporting riverine mapping applications. In these cases, drones offer an effective alternative when the waterway cannot be accessed, or it is too dangerous to use ground- or water-based survey methods for collecting channel geometry.
Robots
Robotic platforms are flexible, enabling users to attach a variety of sensors, including thermal cameras, lidar and sniffers for natural gas or other hazardous material. They are rarely hampered by payload restrictions, like drones.
And, with programming, robots can return to their chargers when their batteries dip below a certain threshold.
Like drones, there are many potential applications for terrestrial remote sensing robots. One use is for precision agriculture to test soil, water and plant health.
Many utilities are expressing serious interest, too, for robots. These robots can include onboard spectral, thermal and lidar sensors, precision navigation and hazard cameras to perform fine-scale spatial mapping and can acquire a wide array of data from electrical substations.
In this scenario, the robotic platform could detect physical and spectral changes, identify objects, monitor corrosion, detect liquid and gas leaks, and conduct thermal monitoring. Using this model, utilities could track substation environments remotely, saving time associated with physical inspections and enabling earlier detection of potential problems.
Systemwide approach required
Traditional remote sensing platforms — airplanes, satellites and vehicles — will continue to play an important role in GIS mapping. Drones and robots give us new tools that will have a dramatic impact on the amount of detailed geographic information collected.
For these new platforms to be used effectively as complements to traditional platforms, the industry must adopt a systems approach that takes into consideration a number of factors:
The end application
The sensors and acquisition protocol that will collect data at the precision required by the end application
The actionable analytics that need to be extracted from the data
How the data and insights integrate with the business processes used for decision making.
By taking this approach, those who work in a variety of fields can gather the insights they need to do their jobs more effectively and efficiently, while leveraging the unique strengths offered by these emerging platforms.
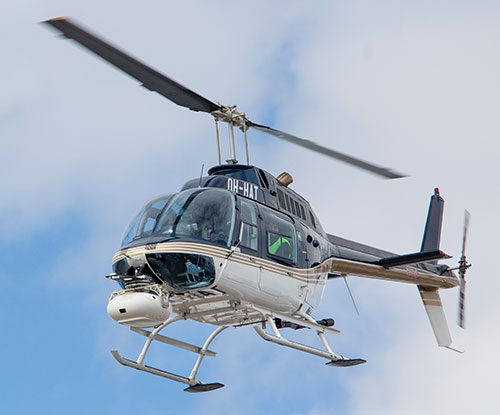
Sharper Shape, a provider of unmanned aerial utility inspection solutions, has released the Heliscope 2.0, an onboard payload system that expands the company’s aerial sensing portfolio into the manned helicopter industry.
According to the company, the Heliscope 2.0 integrates multiple sensor systems into a single, lightweight helicopter payload, capable of simultaneously collecting a range of data types required for utility maintenance and vegetation management inspections.
Deployment of the Heliscope 2.0 enables optimized inspection and maintenance schedules, offering potential cost savings in those operational activities by as much as 50 percent.
The Heliscope 2.0 also stands out with its flexible mounting configurations and ability to adapt for mounting on many different helicopter types.
For example, the system can be mounted on most Bell Jet/Long Ranger helicopters using its FAA-approved nose mount, or attached to numerous other typical helicopter models using its unique Glider aerodynamic sled.
The U.S. Federal Aviation Administration (FAA) permits mounting the Heliscope 2.0 to helicopters by using the cargo hook found on many helicopter models; this user-friendly method is approved by FAA under a classification for gliders.
“While drones are a very flexible and safe method for performing utility inspections, there are situations where manned helicopters are the preferred vehicle to host sensors during certain utility inspections,” said Mikko Saarisalo, Sharper Shape’s vice president of drones and project lead for the Heliscope 2.0 project. “The new Heliscope 2.0 provides a solution for those situations where we need to operate over greater distances or in harsher environments than the drones can easily accommodate. This system takes our data harvesting efficiency and productivity up to a level unprecedented in the industry.”
CORE includes algorithms to automatically analyze lidar point clouds and quickly generate utility vegetation management reports. Further, its unique automatic issue detection (AID) machine vision software uses artificial intelligence (AI) to eliminate the daunting task of performing frame-by-frame image data inspection, allowing personnel to focus on other aspects of inspection compliance.
CORE applications work equally well with either Sharper Shape’s proven unmanned aerial inspection services, or with the new Heliscope 2.0 manned aircraft solution.
“The fact that the Heliscope 2.0 integrates fully with our CORE software suite is a huge benefit,” said Sharper Shape CEO Ilkka Hiidenheimo. “We can collect all the key inspection assets and measurements in one high-speed pass, and then easily pass these files to our CORE suite for automatic processing. Sharper Shape is the only company on the market that offers this range of options for collecting aerial data and for processing this data automatically into a wide range of digital report formats.”
The Heliscope 2.0 system is now available for immediate contract services in the U.S., South America and Europe.
LizardTech, a provider of software solutions for managing and distributing geospatial data, will launch Version 10 of its GeoExpress data manipulation and compression software at the 2018 GEOINT Symposium. GeoExpress 10 includes significantly expanded lidar data handling capabilities and improved interface communication.
LizardTech will demonstrate GeoExpress 10 in booth #1245 at the GEOINT Symposium, which is being held April 22-25, 2018, at the Tampa Convention Center in Tampa, Florida.
GeoExpress is LizardTech’s flagship software product originally created to enable geospatial professionals to manipulate digital satellite, aerial and UAV images and losslessly compress them to industry-standard MrSID or JPEG2000 files for more efficient use.
The addition of lidar handling in 2015 and 2016 releases gave GeoExpress the ability to natively compress lidar data to MrSID and LAZ formats with no loss of data content, saving up to 75% on storage and processing time, as well as support for high-density BPF point clouds.
“Users can do a lot more with their lidar data in GeoExpress 10,” said Toby Martin, LizardTech vice president, Development and Strategy.
In past versions of the software, GeoExpress performed only basic compression and mosaicking of lidar point clouds. The new version enables users to reproject lidar files into different coordinate systems and crop the data to create smaller files.
Individual files or single tiles within a mosaic may be cropped to a desired area of interest for easier and faster processing. Additionally, GeoExpress 10 allows the user to crop by elevation, adding a third dimension to spatial image management.
“You can use the elevation cropping function to create point clouds of just the mountain peaks in an area, for example, if you are planning a high-elevation project,” said Martin.
In GeoExpress 10, users will also find the overall experience of interacting with their data sets is more intuitive thanks to enhanced information and communication from the software. Users may now select the data sets they want to mosaic together, and the software presents a selection of processing options which may be applied to those files.
Another general upgrade in the new version is the ability to pause and then re-start a processing task without losing any progress already achieved. In the past, a task could only be stopped and started again from the beginning once it had been initiated, which for extremely large processing jobs may take significant resources to complete.
Other enhancements to GeoExpress 10 include:
compatibility with LZW compressed TIFF files commonly output from Pix4D software.
addition of Esri projections to the Reprojection Manager.
addition of rectangular cropping around a center point.
shape cropping using Google Earth KML files.
In addition to GeoExpress 10, LizardTech will showcase its complete line of geospatial products at GEOINT 2018:
Express Server software for high-performance delivery and publication;
the recently updated GeoViewer software, which is the fastest way to view MrSID and JPEG 2000 imagery; and
the recently released Portfolio 2017 digital asset management solution, which makes it easy to organize, access and share geospatial imagery alongside associated graphic and digital files.
By Simon Batzdorfer, Markus Bobbe, Martin Becker and Ulf Bestmann, Technische Universitaet Braunschweig
All images courtesy of the authors.
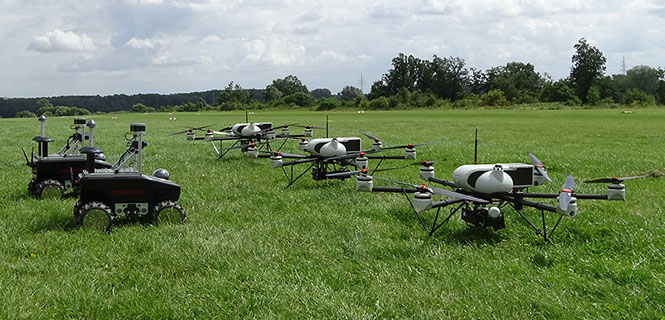
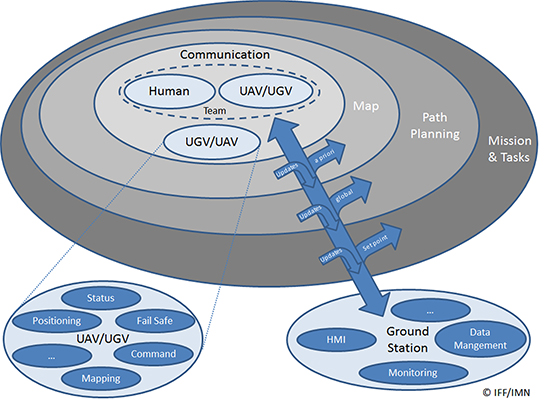
Autonomous vehicles equipped with different environmental sensors, such as optical or thermal camera or a lidar, performed a team survey controlled by a central ground station. The ground station serves as a user interface to define missions and tasks and also to visualize exploration task results online. 2D stitched orthophoto or lidar point clouds are transmitted for display and processing into 3D photogrammetry. Georeferencing data is gathered by an integrated GNSS/IMU positioning system.
In disaster scenarios such as fires, floods or search-and-rescue tasks, good situational awareness is indispensable for responders coping with a complex and often chaotic environment. In most cases, a prior known map data are outdated, and an efficient situational proceeding such as path planning or creation of a search pattern cannot be performed. This information can often only be gathered by manned exploration using ground or airborne systems, with limits on availability.
The research project Automated Navigation and Communication for Exploration (ANKommEn) seeks to create an automated unmanned system to close this gap by providing up-to-date scenario information while increasing the safety of human resources, using unmanned aerial (UAV) and ground-based (UGV) vehicles.
To provide up-to-date information of the desired destination area, all vehicles are equipped with identical positioning and communication hardware complemented by diverse sensors (RGB camera, infrared [IR] camera, lidar) for visual exploration. The visual sensor information is transmitted to a central ground station for visualization and/or analysis. To increase the advantages of the system, the unmanned systems should have a high grade of automation to reduce the workload of the operator so that only basic inputs have to be done by the operator. For example, just by marking a destination area and choosing a predefined task, the mission will be planned automatically, and after the corresponding waypoint-list has been transmitted to the vehicles, the mission will start.
Automated procedures of a UAV in particular require valid position information related to accuracy, availability and continuity. In exploration areas where the UAV operates in low altitude or using a UGV, the reception of the GNSS signal can be degraded by the topology (buildings and such). Using more than one GNSS can increase the availability of position information. Vehicle control, georeferencing environmental sensor data and exploration results all require high-frequency absolute position and attitude and heading information. This data is gathered by fusing GNSS and inertial measurment unit (IMU) data.
OVERALL SYSTEM DESIGN
The overall system consists of three UAVs, two UGVs (Opening photo) and a central ground control station. The latter serves as a central human-machine interface to monitor and manage cooperative operation of the UAVs/UGVs by an operator. Based on a priori known map data, exploration areas and tasks are defined and assigned to the UAVs/UGVs and will be updated with actual information of the visual sensors while performing a mission.
Figure 1 shows the interaction and information exchange between the different vehicles and sensors.
Figure 1. Diagram of interaction and information exchange.
All UAVs/UGVs are equipped with a navigation and communication unit (NAV/COM) and an environmental sensor payload (ENV) unit, including an RGB camera, thermal camera or a lidar respectively.
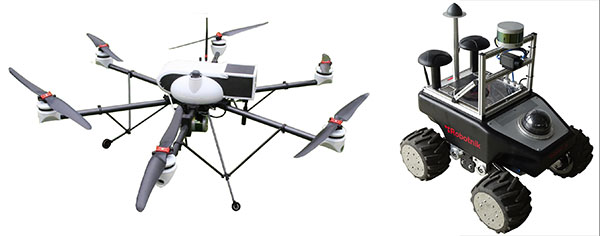
UAV/UGV and Sensor Hardware. The UAVs carry a payload of 2.7 kg (NAV/COM unit, mounted in the upper compartment, and ENV unit mounted under the UAV) and a flight time of up to 30 minutes (Figure 2, left). The payload sensors are carried and stabilized by a two-axis-gimbal. The environmental sensor payload unit is based on three different types of sensors, which are interchangeable between the different UAVs: RGB camera, lidar and IR camera.
For ground-based exploration, two four-wheel-drive UGVs carry a pan-tilt-zoom (PTZ) camera at the top of front chassis (Figure 2, right), and are equipped with a lidar and a thermal camera, or a stereo RGB camera, respectively.
Figure 2. UAV carrying a lidar (left) and UGV carrying lidar and IR camera (right).
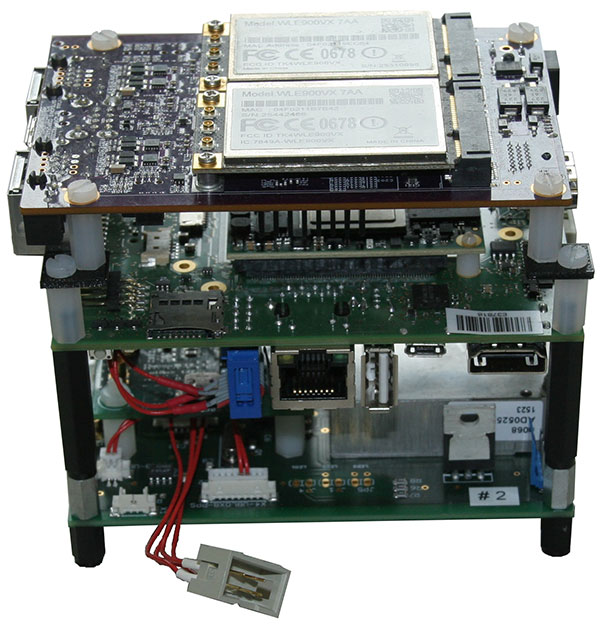
The navigation and communication unit mounted as a stack includes a network processor board for communication and data exchange between the UAV/UGV and the central ground and control station. An embedded processing board provides position calculation and GNSS-NTP-based time server. Data for the position calculation is provided by a custom-designed break-out-board (Figure 3).
Figure 3. Navigation and communication unit.
Data traced by these sensors cannot be sent directly to the ground station because of the huge data amount and the limited bandwidth of the communication link. Therefore, data from the sensors are preprocessed or compressed on a small form-factor personal computer and then transmitted to the ground station.
Ground Station. The ground station is the central device for command, control and visualization of the total system. It provides several options to display the data from the sensors and vehicles and a combination of them, and also provides automated path planning and calculation of the 3D reconstruction (photogrammetry) and online 2D stitched orthophoto.
Software Frameworks. The basic software for determining the vehicle’s state in 3D position, velocity, attitude and heading is established within a modular navigation software framework, with the option to process data of different sensors in real time as well as post-processing for data evaluation and development purposes. Several algorithms for sensor data fusion are implemented. The algorithm for IMU/GNSS fusion is based on an extended Kalman filter and also provides an IMU data-based state vector, stabilized by GNSS information, for the visual sensors. This state vector is published by using the robot operating system (ROS), a framework for inter-process communication based on a TCP or UDP publisher/subscriber concept. The visual sensors and embedded PCs subscribe to different ROS messages, for example, the state-vector-message or information of other sensors.
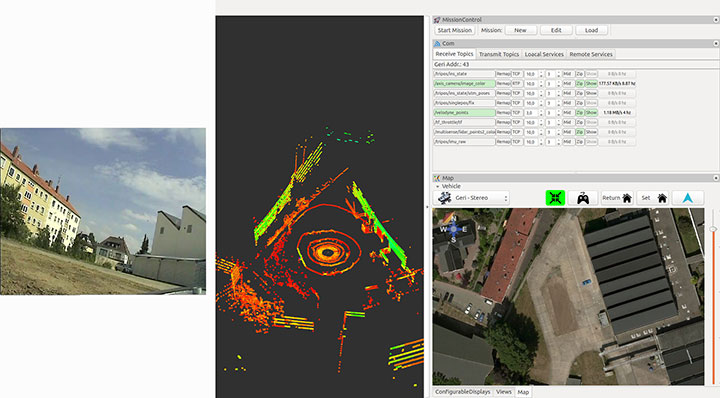
Figure 4 shows examples of the actual camera view from the UGV, and point cloulds and map generated by the UAV. The software layout can be customized by the user.
Figure 4. From left to right: the actual view by the PTZ camera onboard the UGV, the point cloud gathered by the UAV’s lidar, and the mission parameters and map of an aerial view.
POSITIONING OF UAV AND UGV
Automated operation of UGVs and UAVs requires valid position as well as attitude and heading information. In the case of using only one GNSS, signal quality and availability can be degraded by the environment (buildings) and can result in less precise or even a lack of position information.
GNSS Multi-Constellation. To overcome the risk of poor availability of GNSS-based position information, parallel usage of different GNSS can raise the number of received satellite signals: GPS, GLONASS, the evolving Galileo and BeiDou. When using a multi-constellation approach for positioning, one has to take care of several differing aspects between the GNSS. Each system uses a different geodetic reference frame and time basis. Measurements gathered from another GNSS system must be transformed into the reference frame of the desired system. The geometric distribution of the satellites is improved by using more than one GNSS constellation, indicated by a lower dilution-of-precision value.
The navigation software framework is designed for real-time computation and also for post-processing. In post-processing, the recorded sensor data is streamed to the software framework with the option of changing several parameters and settings for calculation. One option is to exclude satellites at low elevation from position calculation by changing the cut-off elevation for these satellites. This parameter will be changed to simulate environmental conditions that block receiving GNSS signals, like buildings within urban scenarios, to compare the availability of received GNSS signals for single- and multi-constellation-based position calculation.
Recorded data of a real-world test serves as the database for the post-processing with different cut-off elevation parameters. At the beginning of the field test, there was a short initialization period to boot the OS and to start basic processes for positioning. After that, a predefined mission was flown and the GNSS measurements have been saved for the described post-processing.
Post-processing has been performed with different cut-off elevation parameters of 5° up to 35°. In the case of 35°, the number of GPS satellites is reduced to the minimum for position calculation of four, in contrast to 5–7 available satellites for a multi-constellation based solution.
GNSS/IMU Fusion. Using the GNSS multi-constellation approach can increase availability of position information. For attitude and heading determination, an IMU is nevertheless indispensable. Additionally, the frequency of the pure GNSS-based positioning information is usually between 1 Hz to 5 Hz within the described hardware setup. Meaningful georeferencing of the environmental sensors requires much higher frequency position and attitude information.
The IMU provides high-frequency 3D measurements of accelerations and angular rates. Using common strapdown algorithm processing, high-frequency position, velocity, attitude and heading information is provided in real time. Due to the short time stability of pure inertial navigation, the GNSS positioning results are used for aiding purposes within the Kalman filter’s update step. To overcome the absence of GNSS aiding information even when using multi-constellations, there are mainly two options. First, a short coasting period is possible after the data fusion has reached a steady state.
Second, due to the highly modularly design of the navigation software framework, it is possible to use position or attitude increments from environmental sensor data processing for aiding the IMU.
The vehicle’s state vector is then distributed with high frequency within the system for georeferencing measurements of the environmental sensors, especially the RGB camera and the lidar for photogrammetry and simultaneous location and mapping (SLAM) applications.
PHOTOGRAMMETRY AND SLAM
In major fire scenarios, maps can be out of date. Therefore, techniques have been developed to gather a 2D overview based on several single RGB pictures taken and processed on board a UAV and transmitted to the ground station via data links. Additional processing of a 3D reconstruction of the scenario is an integrated feature within the ground station. Both approaches were implemented to get an automated rapid aerial mapping solution.
In the case of the 2D overview, SLAM algorithms, often used in robotic research, are adapted for this specific use case. These algorithms provide good results for a rapid aerial mapping solution to get an overview of the scenario, because the map is updated incrementally with every new image, but they are less precise, which can be compensated for by using the photogrammetric 3D reconstruction. The live mapping (SLAM) approach is based on the ORB-SLAM algorithm, and the photogrammetry-based approach uses commercially available photogrammetry software.
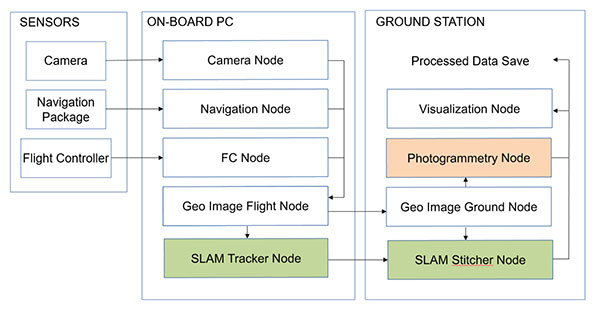
The systems, on the UAV for 2D and for 3D on the ground station, use the ROS framework for processing the visual sensor data and the described techniques for positioning, georeferencing and attitude determination. For data exchange between these frameworks, several software interfaces have been implemented. Figure 5 displays a flowchart of the implemented workflow.
The sensor/input data is received by corresponding nodes on the aerial vehicle. After adding the camera pose information to the image in the geo-image flight node, the image is sent to the geo-image ground node on the ground station. The SLAM process is separated into two parts. The SLAM tracker node calculates the transformation between images, and the SLAM stitcher node applies the transformations. The transformed images are displayed by the visualization node. The photogrammetry node receives the georeferenced images, stores the data, and initiates the photogrammetric processing once the survey is finished. The results can also be displayed by the visualization node and exported in a desired format.
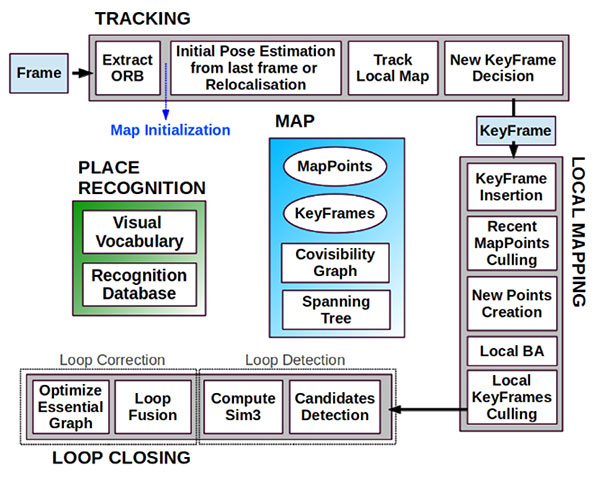
Visual SLAM. Computer vision-based algorithms have developed rapidly over the last few years. One method estimates a pose by using monocular image processing, known as parallel tracking and mapping (PTAM). This integrates a bundle adjustment and separates the tracking and the mapping procedure into different threads, leading to a real-time capable framework. These basic PTAM principles have been integrated into a robust loop-closing and another method of relocalization, known as Oriented FAST and Rotated BRIEF (ORB SLAM), shown in Figure 6. Here, tracking, local mapping and loop closing are separated into different threads (gray boxes), with the main map and place recognition in the middle.
Figure 6. ORB SLAM system overview [Mur-Artal, 2015].The tracking thread predicts the current pose from the last known position and movement by using a constant velocity model and performs a guided search of map points. If these points are found near the estimated position, the velocity model is valid and the tracking procedure continues. Otherwise, the tracking is lost and a relocalization in the global map starts by using a subset of features, which are increased after detection of corresponding features in other keyframes to optimize the camera pose and, finally, the tracking procedure continues. The last step of this procedure is to decide whether the current frame contains enough information to be inserted as a new keyframe for further calculations.
To mark a frame as a new keyframe, the frame must fulfill all of the following conditions:
More than minimum number of frames has passed.
Local mapping is on idle or condition 1 fulfilled.
A minimum number of 50 points is observed.
A maximum of 90% of the features is already observed by the other frames.
When a new keyframe is passed to the local mapping procedure and inserted as a node into a co-visibility graph structure, new correspondences are searched in the connected keyframes to triangulate new points. Based on the information accumulated during the tracking, a point culling keeps only high-quality points in the map as well as a culling of redundant keyframes.
Then a loop closing is performed. This is one of the main improvements compared to PTAM. If a loop is detected, the drift accumulated in the loop is computed, and both sides of the loop are aligned and visible points are fused. In a final step, a pose graph optimization is done to achieve global consistency.
This information of the 3D camera pose is used to generate a 2D orthophoto in real time while the vehicle is flying. To create a 2D orthophoto, a common reference frame is approximated, which is orthogonal to all camera measurements. The projection is performed by using a projection model based on a pinhole camera.
After the compensation and distortion, the whole image can be stitched to the current global map.
Photogrammetry. This approach uses off-the-shelf photogrammetric processing software. The processing is triggered automatically when the survey is completed and all images are transferred to the ground station via data link. For georeferencing of the images, the camera location and the inner camera geometry were written to the EXIF file of each image by the geo-image ground node (Figure 5). To ensure an acceptable compromise between orthophoto quality and the required processing time, an analysis regarding the impact of the most relevant processing parameters has been performed.
Figure 5. ROS node layout with SLAM (green) and photogrammetry workflow (red).
The photogrammetry process consists of four steps:
camera alignment (optimizing the homographic equation)
mesh creation by generated tie points
orthophoto creation (dense cloud or digital elevation model)
export.
Analyses and Evaluation. To evaluate the correct workflow of both approaches of 2D live-stitching and the 3D photogrammetry, a real-world flight test above agricultural cropland has been performed. The results of both approaches are shown in Figure 7 and Figure 8. Generally, agricultural cropland and its mean textured surface pose a challenge for mapping processes because of the limited number of trackable features.
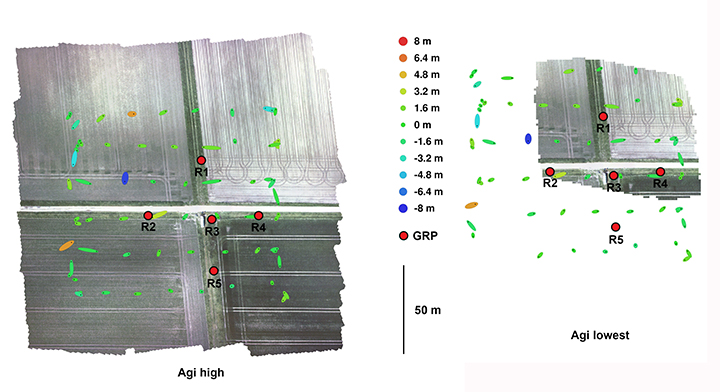
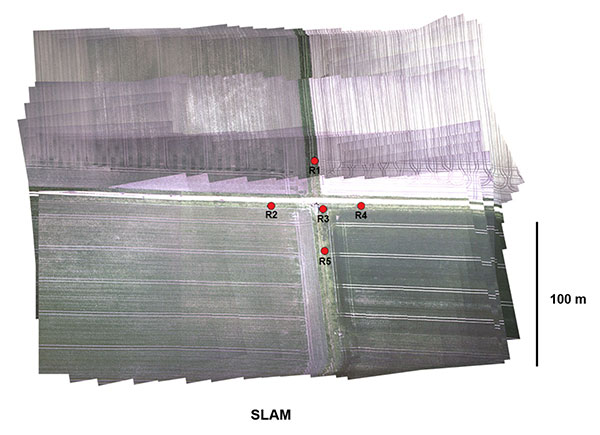
Figure 7. Orthophotos created with the profiles high and lowest (including ground reference points).Figure 8. Orthophotos created with 2D live stitching approach of cropland.
Four predefined profiles were used to cover the requirement of compromise between processing duration and quality of the generated orthophoto. Each profile level generates a corresponding level of alignment accuracy and mesh face count: lowest, low, medium and high.
To estimate the accuracy of the created maps by the different profiles, five ground reference points (GRPs) were distributed over the mission area. The location of the GRPs was determined using a RTK-GNSS system leading to a horizontal RMSE below 2 cm. To enable robust processing for this scenario, the overlap and the sidelap was chosen to be 70%. A ground-sampling distance (GSD) of 2 cm was needed to identify the GRPs. This resulted in a mission consisting of six times 100-meter (m) lines with a distance of 25 m in an altitude of 60 m over ground. During the flight time of 4.5 minutes, 271 images were taken.
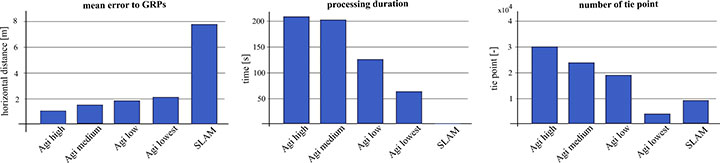
To compare the profiles, they were triggered one after another with the same set of images. The created results are shown in Figure 7. All profiles resulted in consistent solutions and were successfully georeferenced. The map based on the lowest profile could not recreate the complete area (Figure 7, right). The remaining profiles led to similar results without notable differences to visual inspection. The processing time varied between 1.2 and 3.6 minutes. A comparison of this and other criteria is given in Figure 9.
Figure 9. Evaluation and comparison of defined software profiles and visual SLAM.
The created final image of the SLAM pipeline is shown in Figure 8. The image was updated with every new image and was therefore finished before the UAV landed. The mean location error measured using the reference points was about 8 m, significantly larger than the errors observed in the photogrammetry results. In Figure 9 the results are contrasted to the results of the photogrammetry approach.
While the mean error in the low profile is half as high as in the lowest profile, the calculated errors using the medium and high profiles are not enhanced significantly. The number of tie points created by the lowest profile is an order a magnitude lower compared to the other three profiles.
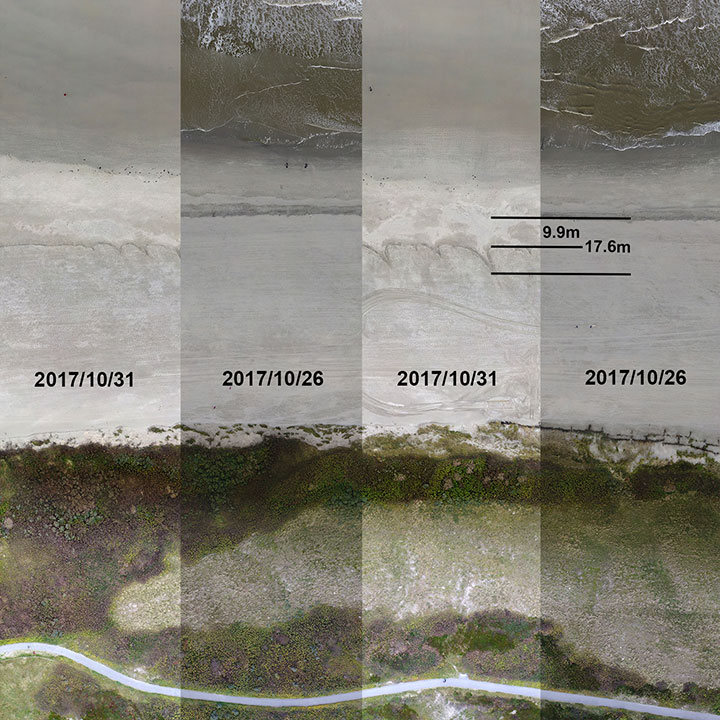
We conducted flight tests on Langeoog island in the North Sea, to gather information on efforts to protect the island’s coastline from water erosion. For this reason, sand was selectively washed up to the coastline by dredgers at the beginning of October 2017. Between Oct. 26 and 31, due to severe weather with a storm flood, a huge erosion of the washed up sand occurred, and the result is shown in Figure 10. The level of erosion was determined by comparison of the orthophoto of the same area. The dislocation averaged out to 9.9 m with some peaks up to 17.6 m.
Figure 10. Evaluation of erosion.
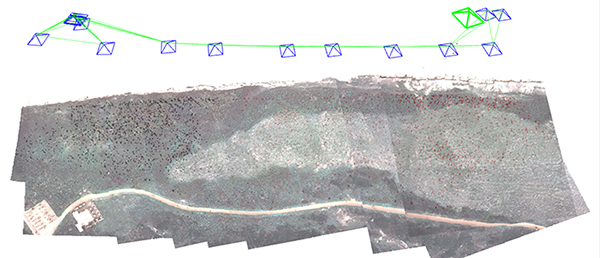
The 3D photogrammetry provides a more detailed image compared to the image of the 2D-live-stitching approach (Figure 11), but both approaches can provide the desired information of the area.
Figure 11. Result of the SLAM approach with camera poses and tracked features.
Both implemented approaches were successfully integrated to get the desired fully automated rapid aerial mapping solution. This also includes the basic tasks of the automated mission planning, camera control, image transport to ground station, automated processing and the visualization of the results.
CONCLUSION
The benefits of multi-constellation GNSS positioning have been demonstrated with a focus on UAVs and UGVs operating in catastrophic scenarios, especially where GNSS signal reception might be blocked. This position information is also used for georeferencing of images and visual reconstruction of the area. The overall system has demonstrated the capability of an automated orthophoto generation. Both implemented mapping methods — a 2D live stitching and a 3D photogrammetry — provided results that fulfill the requirements to get an instantaneous 2D overview and a contemporary 3D reconstruction of the area.
ACKNOWLEDGMENTS
This work was done within the joint research project ANKommEn, funded by the German Federal Ministry of Economic Affairs and Energy, administered by the Space Administration of the DLR (funding code: 50NA1518). Project partners are the Institute of Flight Guidance (IFF), the Institute of Mobile Machines and Commercial Vehicles (IMN) — both part of Technische Universität Braunschweig — and AirRobot GmbH & Co. KG, a German manufacturer of multirotor UAVs. The professional fire brigade of Braunschweig and the Lower Saxony Water Management, Coastal Defense and Nature Conservation Agency also participate as associated project partners.
SIMON BATZDORFER holds a Dipl.-Ing. in mechanical engineering and is a research engineer at the Technische Universitaet Braunschweig, Institute of Flight Guidance (IFF).
MARKUS BOBBE holds a M.Sc. in aerospace engineering and is a research engineer at the Braunschweig IFF.
MARTIN BECKER holds a Dipl.-Ing. in aerospace engineering and is a research engineer at the Braunschweig IFF.
ULF BESTMANN received his Dr.-Ing. in mechanical engineering from TU Braunschweig. He is head of the navigation department of the IFF. He co-founded the company messWERK GmbH, a service provider in flight testing and certification.
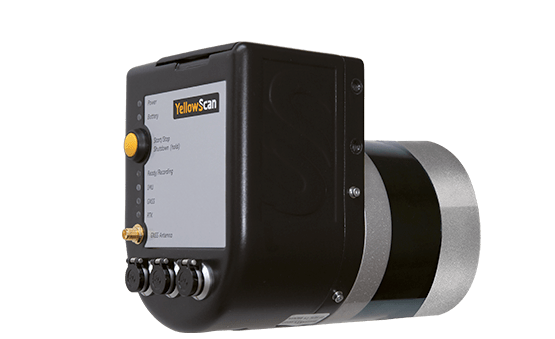
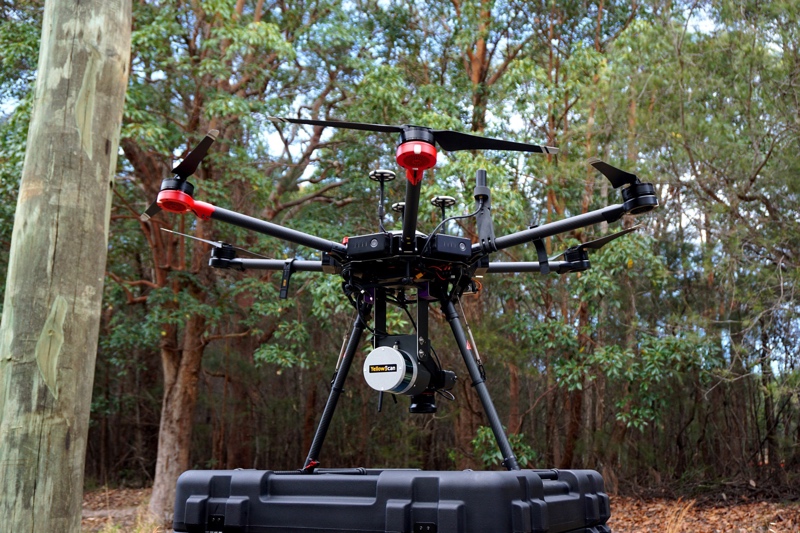
YellowScan has launched a new lidar system, the Surveyor Ultra. It integrates the Velodyne VLP-32C scanner and the Applanix APX-15 GNSS/inertial measurement unit (IMU).
With high density (600,000 shots per second), the system is suitable for high-speed UAVs and long-range needs (maximum range: 100 meters). Its light weight (1.7 kg) makes it easy to mount on any drone, including vertical takeoff and landing (VTOL) UAVs.
As for all YellowScan lidar systems, the Surveyor Ultra is a turn-key system fitted for under vegetation 3D modeling and fast data processing, the company said.
Applications such as forestry, archeology and environmental research will benefit from Surveyor Ultra, as they require long-endurance flights high above trees or over rocky mountains and rugged terrain.
“The Surveyor Ultra shows great potential to safely and efficiently operate lidar on lightweight fixed-wing UAVs,” said Tristan Allouis, YellowScan CTO. “The Surveyor Ultra completes our product line, including the successful Surveyor Lidar System (integration of the VLP-16 scanner from Velodyne).”
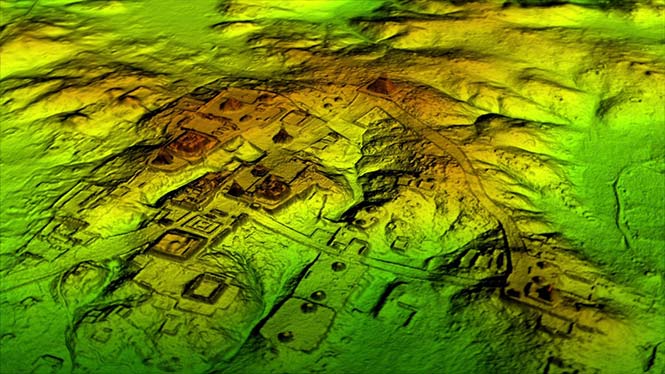
Lidar and UAV technology has revealed hundreds of previously unknown Mayan ruins in the Guatemalan rainforest.
The Optech Titan stripped away overlying vegetation to reveal extensive Mayan ruins in Guatemala’s rainforest. (Image: Teledyne Optech)
In what is considered biggest aerial lidar survey in the history of archaeology, a vast and complex civilization has been discovered.
The University of Houston’s National Center for Airborne Laser Mapping (NCALM) used Teledyne Optech’s Titan sensor to identify raised highways, and complex irrigation and terracing systems.
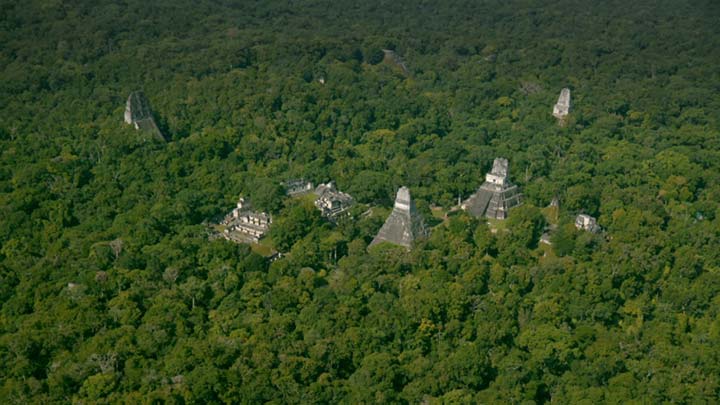
The jungle of Central America is one of the last great frontiers of archaeology, according to National Geographic, which covered the new finds in a recent documentary, Lost Treasures of The Maya Snake Kings.
After the collapse of the Mayan civilization, its cities and monuments were quickly covered by thick rainforest, hiding it from airborne observation and making it very difficult to survey on foot. Over decades of work, the ancient civilization has gradually been revealed. But now technology is set to change everything.
Lidar digitally removes the forest canopy to reveal ancient ruins below, showing that Maya cities such as Tikal were much larger than ground-based research had suggested. (Photo: National Geographic)
Flying high above the rainforest, the Titan’s lasers penetrated the canopy to collect almost a million data points per second from the forest floor, giving archaeologists a “bare earth” view of the structures underneath.
Having covered 2,100 square kilometers, the Titan’s data revealed massive amounts of ruins hidden below the forest, showing that their urban centers were significantly larger than archaeologists had previously thought.
“Lidar is revolutionising archaeology the way the Hubble Space Telescope revolutionised astronomy,” Francisco Estrada-Belli, a Tulane University archaeologist, told National Geographic. “We’ll need 100 years to go through all [the data] and really understand what we’re seeing.”
(Image: Teledyne Optech)
“We are incredibly proud and excited that our award winning Titan multispectral lidar sensor has contributed to this spectacular discovery,” said Michel Stanier, EVP and general manager of Teledyne Optech. “The Titan’s ability to strip away overlying vegetation and map wide areas very quickly and accurately makes it an important tool for archaeologists, and we expect to see many more discoveries coming from it and our other airborne laser terrain mappers.”
The Optech Titan multi-spectral lidar sensor incorporates three independent laser wavelengths into a single sensor design, with beams at 532, 1064 and 1550 nanometers (0.5/1.0/1.5 microns) and a ground sampling rate of 300 kHz per beam.
Because Titan uses both green and infrared channels, it is capable of simultaneous water-depth mapping and high-precision 900-kHz topography.
Titan can also be used for purposes such as vegetative and forestry applications, which require multiple wavelengths for improved classification accuracy and carbon credit counting initiatives.
Lidar and UAV technology has revealed hundreds of previously unknown Mayan ruins in the Guatemalan rainforest.
The Optech Titan stripped away overlying vegetation to reveal extensive Mayan ruins in Guatemala’s rainforest. (Image: Teledyne Optech)
In what is considered biggest aerial lidar survey in the history of archaeology, a vast and complex civilization has been discovered.
The University of Houston’s National Center for Airborne Laser Mapping (NCALM) used Teledyne Optech’s Titan sensor to identify raised highways, and complex irrigation and terracing systems.
The jungle of Central America is one of the last great frontiers of archaeology, according to National Geographic, which covered the new finds in a recent documentary, Lost Treasures of The Maya Snake Kings.
After the collapse of the Mayan civilization, its cities and monuments were quickly covered by thick rainforest, hiding it from airborne observation and making it very difficult to survey on foot. Over decades of work, the ancient civilization has gradually been revealed. But now technology is set to change everything.
Lidar digitally removes the forest canopy to reveal ancient ruins below, showing that Maya cities such as Tikal were much larger than ground-based research had suggested. (Photo: National Geographic)
Flying high above the rainforest, the Titan’s lasers penetrated the canopy to collect almost a million data points per second from the forest floor, giving archaeologists a “bare earth” view of the structures underneath.
Having covered 2,100 square kilometers, the Titan’s data revealed massive amounts of ruins hidden below the forest, showing that their urban centers were significantly larger than archaeologists had previously thought.
“Lidar is revolutionising archaeology the way the Hubble Space Telescope revolutionised astronomy,” Francisco Estrada-Belli, a Tulane University archaeologist, told National Geographic. “We’ll need 100 years to go through all [the data] and really understand what we’re seeing.”
(Image: Teledyne Optech)
“We are incredibly proud and excited that our award winning Titan multispectral lidar sensor has contributed to this spectacular discovery,” said Michel Stanier, EVP and general manager of Teledyne Optech. “The Titan’s ability to strip away overlying vegetation and map wide areas very quickly and accurately makes it an important tool for archaeologists, and we expect to see many more discoveries coming from it and our other airborne laser terrain mappers.”
The Optech Titan multi-spectral lidar sensor incorporates three independent laser wavelengths into a single sensor design, with beams at 532, 1064 and 1550 nanometers (0.5/1.0/1.5 microns) and a ground sampling rate of 300 kHz per beam.
Image: Teledyne Optech
Because Titan uses both green and infrared channels, it is capable of simultaneous water-depth mapping and high-precision 900-kHz topography.
Titan can also be used for purposes such as vegetative and forestry applications, which require multiple wavelengths for improved classification accuracy and carbon credit counting initiatives.
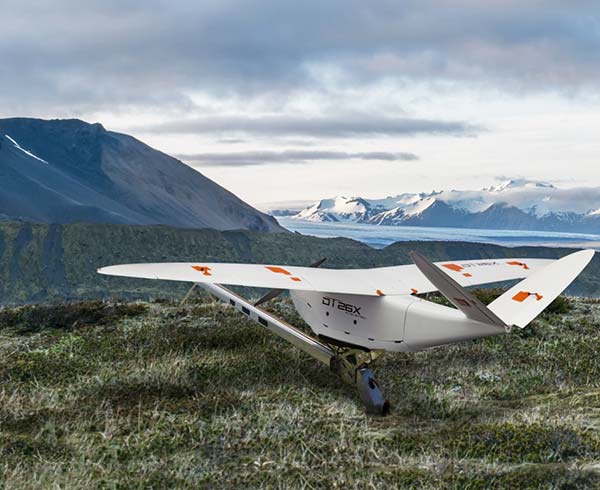
Delair, a supplier of drone solutions for commercial industries, has introduced the next-generation of its high-performance DT26X Lidar UAV.
The DT26X is a long-range fixed-wing drone that combines highly accurate lidar sensing capabilities with an integrated high-resolution RGB (red, green, blue) camera, dramatically increasing the precision, efficiency and cost effectiveness of surveying and 3D mapping.
The Delair DT26X lidar drone combines lidar sensing with RGB camera data to enable highly accurate and high-resolution 3D representation and measurement over large areas with minimal flights and in challenging environments. (Image: Delair)
Details of the new model, which builds on Delair’s proven expertise in long distance, beyond visual line of sight UAV operations, were revealed at the International Lidar Mapping Forum in Denver.
Aerial-based lidar allows for extremely detailed and accurate collection of elevation data of the ground, even in large and vegetated areas, but is typically performed with specialized, single function platforms or expensive manned aircraft surveys with long lead times.
Camera-enabled drones offer a complementary solution for collecting imagery that can augment the lidar-based models. Most projects therefore require multiple mapping flights and separate UAVs, with initial missions using lidar sensors and subsequent flights equipped with RGB-cameras to enhance the digital rendering.
The Delair DT26X lidar’s combined payload of a lightweight sensor and integrated camera allows the acquisition of lidar and photogrammetry data in a single flight, which drastically reduces cost and immediately provides an extremely detailed digital model of the inspected assets.
The lidar sensor is specifically designed for UAV use, adding little weight or bulk to the Delair frame. The fully-integrated smart RGB camera enables real-time camera sensor control and in-flight photo review with automated quality checks.
The new platform delivers increased accuracy in 3D mapping and modeling of terrain and corridors in challenging physical environments (e.g. mountainous, inaccessible by road or foot, dense vegetation) and with difficult visibility, lighting or weighting conditions.
Its long range flying capabilities — allowing coverage of up to 2,400 square acres, communication range of 30 kilometers and 100 minutes of flight time — improve the efficiency of aerial mapping operations over large areas. As a result, the Delair DT26X lidar is well suited for uses such as environmental and land surveys, forestry monitoring, infrastructure surveillance, powerline and pipeline inspections, and road and rail construction.
“The combination of a sophisticated lidar sensor and an industrial grade RGB camera removes the ‘either/or’ decision of choosing between lidar and imagery data acquisition for geospatial professionals,” said Chase Fly, geospatial product manager at Delair. “This is the most versatile and cost-effective UAV solution for large area, long range mapping and surveying where accuracy and detail are required. It provides the precision and visibility required by the most demanding use cases and allows data acquisition and advanced digitization not possible through terrain-based or satellite 3D mapping techniques, or with limited short-range UAVs. With this configuration, users can acquire all the data required for a colorized point cloud from a single flight, which eases the point cloud classification process back in the office, saving significant time and money.”
New lidar sensor for more accurate mapping. TheDelair DT26X lidar fixed-wing UAV incorporates the new RIEGL miniVUX-1DL lidar sensor, a specially designed device for the needs of UAV use.
The small form factor sensor includes a downward looking and optimized field of view specifically geared for corridor mapping tasks. The wedge prism scanner construction produces a field of view of 46 degrees, and the circular scan pattern provides a very high point density and point distribution.
It offers a high scan speed of up to 150 scans per second and a measurement rate of up to 100,000 measurements per second. It is effective in penetrating poor lighting conditions or dense foliage. The lidar sensor makes use of RIEGL’s Waveform-lidar technology, allowing echo digitization and online waveform processing. It supports multiple-target resolution of up to five target echoes per laser shot.
“The new Delair UAV is typically the type of drone RIEGL had in mind when designing the RIEGL miniVUX-1DL, and represents another step toward completing our UAV lidar equipment product portfolio. The scanner’s specific wedge prism scanning mechanism generates a circular scan pattern, resulting in high point densities and therefore is especially well suited when deploying the scanner from fast moving acquisition platforms such as fixed-wing UAVs. The FOV (field of view) of the miniVUX-1DL is 46deg, resulting in optimized efficiency for downward-looking, linear acquisition set-ups like corridor mapping applications, for example. We are pleased to have such an innovative company like Delair as an esteemed OEM integration partner, bringing our sensing technology to key market sectors that require a flexible lidar solution,” commented Michael Mayer, managing director, RiCOPTER UAV GmbH.
RiCOPTER UAV GmbH is a subsidiary of RIEGL Laser Measurement Systems GmbH, an international provider of technology in airborne, mobile, terrestrial, industrial and unmanned laser-scanning solutions. RiCOPTER UAV GmbH commercializes RIEGL’s turnkey lidar UAV solution and laser-scanning payloads dedicated for UAV integration.
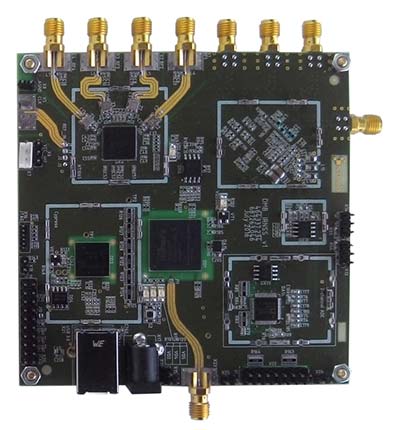
7-channel multi-GNSS multi-band for software-defined receiver
The NT1065/66_USB3 multi-channel GNSS RF front-end board is based on NTLab’s RF ICs: NT1065 (four channels for GPS / GLONASS / Galileo / BeiDou / IRNSS / QZSS, L1/L2/L3/L5 bands) and new NT1066 (two channels for all previously mentioned GNSS signals, plus one extra-channel for IRNSS S-band). The board supports USB3 connection, allowing users to process captured satellite signals on a PC or DSP platform. The board is accompanied by comprehensive software and manuals. Features include six channels for L1/L2/L3/L5-band signals + one channel for S-band signals simultaneous reception; up to four coherent channels; IF bandwidth up to 32 MHz; acquisition of wideband signals up to 64 MHz (such as Galileo E5) by two coherent channels; USB3 interface (up to 800 Mbit/s); ability to connect four x CRPA. NTLab offers an academic discount program for universities, colleges and institutes, allowing them to purchase this powerful research tool with significant savings.
Three new Tersus GNSS HRS kits feature high-precision BX305, BX306 and BX316 GNSS RTK boards. The kits consist of RTK receivers, GNSS antennas, RS05R radio station modems, radio station antennas, and related cables and converters. Embedded in the receivers are the Tersus RTK boards. They are compact-design, energy-efficient, centimeter-level accurate GNSS real-time kinematic (RTK) boards that bring high-precision positioning accuracy to the market. Different from the standard BX305/306/316 GNSS kits, the new HRS versions are equipped with the RS05R lightweight and robust UHF rover radio for wireless applications. It provides reliable data communication for demanding conditions that require a combination of stability, high performance and long-range operation. The kits can be used in a variety of applications, such as unmanned aerial vehicles (UAVs), surveying, mapping, precision agriculture, construction engineering and deformation monitoring.
Spoofer detection is now available on all JAVAD GNSS original equipment manufacturer (OEM) boards. When a receiver equipped with a JAVAD board detects more than one correlation peak for any PRN code, it warns the user of the presence of spoofing (false signals) and identifies the spoofed satellites. The receivers then switch to other signals and sensors that are not being spoofed to maintain accurate positioning. The user can also employ the receiver to try to identify the direction from which the spoofing signals are originating.
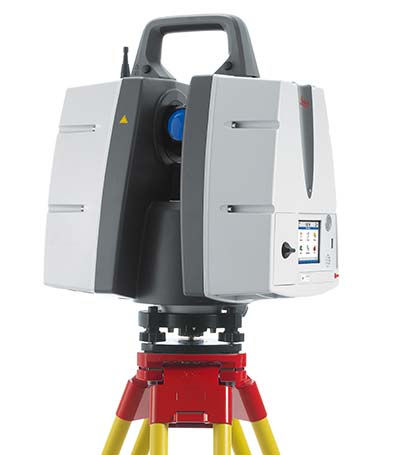
The ScanStation P50 combines all the features of the P40 plus a longer range scanning capability of more than 1 kilometer. The rugged, versatile laser scanner enables professionals to 3D capture at great distances with angular accuracy paired with low-range noise and survey-grade dual-axis compensation. The ScanStation P50 opens new business opportunities for reality-capture professionals, helping them to scan what was previously unreachable such as big mine pits, long bridges, dams and skyscrapers. With its range, the P50 enables users to scan any tall or wide infrastructure or dangerous sites from a remote and safe position. This newest member of the P-Series provides the highest quality 3D data and high-dynamic range (HDR) imaging at an extremely fast scan rate of up to 1 million points per second and ranges of more than 1 kilometer.
Azuga FleetMobile: Standalone Smartphone Edition (SSE) is a smartphone-based solution for driver behavior monitoring, mobile timecard management and GPS tracking. Azuga FleetMobile SSE leverages data analysis components of the original Azuga FleetMobile application, including driver behavior monitoring, location-based timestamps for timecards, gamification and driver rewards, without requiring separate hardware installation via a vehicle’s OBD port. Azuga’s GPS fleet-tracking offerings feature a driver rewards program to help fleets reduce accidents by up to 70 percent. The standalone application, which works on both Android and iOS smartphones, integrates gamification and real-time data to encourage self-coaching and healthy competition. Azuga’s data science team can then leverage information about driving behaviors and combine them with route patterns, fleets’ vehicle health information and environmental factors to identify opportunities for performance improvements in fleet operations.
The RIFA series of full-featured GPS trackers have built-in gyro and G-sensors, and supports OBDII and J1939 protocols. In addition to 4G/3G communication, it provides options to use low-power wide-area networks (LPWAN) such as NB-IOT or LoRa, which can reduce communication costs significantly. The unique CAN-to-ADR (automotive dead reckoning) function provides accurate positioning in situations of weak GPS signals, such as driving in tunnels, indoor parking facilities, urban canyons or when GPS signal obstruction hinders positioning, without additional cabling for wheel speed input.
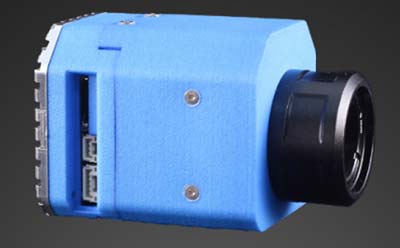
The ThermalCapture IRnet provides an Ethernet interface for live data streaming to new and existing FLIR Tau 2 drone cores and FLIR Vue Pro/R cores. The market has increased its demand for connectivity by Ethernet, with professional drone manufacturers choosing Ethernet for communication on board UAVs. The ThermalCapture IRnet allows for real-time access via Ethernet while recording radiometric data to microSD, bringing real-time access in drone flight operations to thermal imaging data. It stores the full 14-bit radiometric thermal data on a microSD card. Real-time access remains available while radiometric data are being recorded; operators can also control the camera and settings via Ethernet. Using Ethernet also offers data privacy.
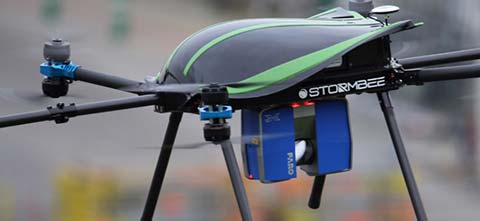
The Think 3D Stormbee multicopter integrated with Trimble’s AP15 provides efficiency, accuracy and performance for lidar surveys from unmanned vehicles. The Stormbee is a directly georeferenced UAV lidar solution for 3D industrial mapping applications, designed to collect survey-grade spatial data more cost effectively and efficiently than static lidar. Stormbee’s 3D mapping technologies include Faro’s Focus 130 laser scanner, Trimble’s AP15 high-performance GNSS/inertial receiver, Applanix’s POSPac UAV GNSS/inertial post-processing software and Stormbee Beeflex software for lidar point-cloud generation. By using the high-performance Trimble AP15 with two antennas and the Applanix post-processing software (POSPac MMS) for georeferencing the lidar data, Stormbee provides an accurate real-time and post-mission solution for all motion variables.