Velodyne presents business cases of lidar solutions in forestry, utilities and surveying at AUVSI’s Xponential.
Frank Bertini, UAV and robotics business manager at Velodyne Lidar (booth #1420), will deliver a featured presentation on the business cases for 3D lidar technology in mobile mapping applications at AUVSI Xponential 2019, taking place on April 29 to May 2, at McCormick Place in Chicago.
Bertini will discuss revenue-generating strategies created by adding lidar to drones, backpacks and all-terrain vehicles (ATV) to build autonomous solutions.
Bertini’s session, “Emerging Autonomous Applications for 3D Lidar,” will provide a technical overview of industrial applications for lidar onboard unmanned systems. The presentation focuses on emerging use-cases which are creating businesses opportunities in developing markets, including forestry management, utilities management, and surveying.
The session takes place on Wednesday, May 1, 2-2:30 p.m. in XPO Hall – Solutions Theater.
“Velodyne Lidar helps systems developers by providing rich computer perception data that enables high-performing mapping systems in a lightweight, versatile solution,” said Bertini. “Velodyne sensors make it quick and easy for companies to build highly accurate 3D models of any environment, such as forests, power corridors, and solar energy farms.”
In the presentation, Bertini will examine how drones equipped with Velodyne’s lightweight, powerful lidar can produce high-density point clouds for a forest canopy as well as the terrain underneath.
He will also explain how this can be done at ground level with a backpack application.
Additionally, the session will include mobile mapping case studies involving a power line inspection and surveying a solar power field.
Attendees to AUVSI Xponential 2019 can visit the Velodyne booth to learn about Velodyne’s state-of-the-art lidar technology that delivers a high-resolution surround-view image to accurately measure and analyze the environment.
The performance, range and compact form factor of Velodyne sensors enable developers to design versatile systems that can be configured to any mapping need.
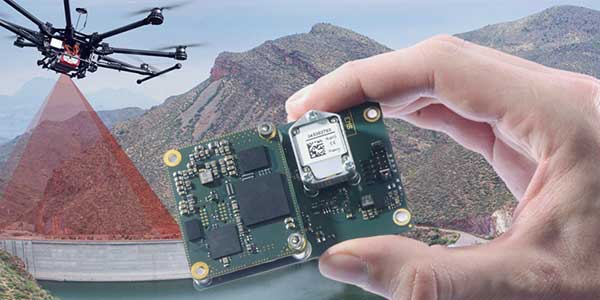
SBG Systems will present its Quanta UAV series at AUVSI’s Xponential show, which takes place April 30-May 2 in Chicago. The Quanta UAV series is a line of inertial navigation systems (INS) dedicated to UAV-based surveying integrators.
Because SBG Systems wants UAV surveyors to save autonomy for additional survey lines, the company has designed a small, lightweight, and low-power INS offered on two levels of accuracy. Quanta UAV and Quanta UAV Extra have been developed for compact lidar to high-end BVLOS mapping solutions. They provide precise orientation and centimeter-level position data delivered both in real time and post processing. This direct geo-referencing solution eliminates the need for ground control points and greatly reduces the need of overlapping.
Qinertia, SBG’s post-processing software completes the Quanta UAV offer. It gives access to offline real-time kinematic (RTK) corrections from more than 7,000 base stations in 164 countries, the company said. Trajectory and orientation are greatly improved by processing inertial data and raw GNSS observables in forward and backward directions. This advanced software also computes the base station position to quickly provide centimeter accuracy. Qinertia comes free for one year with the Quanta UAV sensor.
Robotics and surveying. Quanta UAV is the result of SBG’s expertise in both miniaturized technology for drone navigation and high-end sensors for mobile mapping. Designed as a geo-referencing solution, it can also be used as a high-end navigation solution to feed the UAV autopilot.
Quanta UAV benefits from a tight integration with in-house IMUs, advanced calibration techniques and algorithms that ensure consistent behavior in all weather conditions, as well as robust position even if the UAV gets close to buildings, electrical lines or trees.
Quanta UAV embeds a web interface for an easy configuration with a 3D view showing all parameters. The calibration tool automatically aligns the lever arm between the two antennas and the sensor, and re-estimates it in flight for more precision.
The ITAR-free Quanta UAV INS are available for order.
By Daniela E. Sánchez, Harvey C. Gómez and Thomas Pany, Institute of Space Technology and Space Applications (ISTA)
This paper presents how our system, consisting of a GNSS receiver antenna, an inertial measurement unit (IMU) and a lidar, is used to obtain high-precision maps through the geo-referencing of lidar point clouds. An accuracy assessment of the system is conducted, which also gives us insights on the quality of lidar range measurements for autonomous driving applications.
The assessment is done by geo-referencing the obtained point clouds of extracted buildings and comparing them against a supporting measuring system like a total station. The building extraction is done by performing an approximation of the mathematical model of a plane to the facades that composes the building in both, the lidar and the supporting measurement system data.
The paper also indicates the proposed pose determination method of a mobile agent using lidar data. Thanks to the advantages of active, 3D sensors, diverse objects in the environment can be detected as individual point sets, or clusters. Each of the segmented objects can be used as a landmark to figure how the agent is located with respect to those structural elements. The algorithm is capable of detecting the clusters in one point cloud, and finding the most alike point set on a subsequent scan. This is achieved by comparing global descriptors for point cloud data.
The Ensemble of Shape Functions (ESF) is selected as the cluster descriptor. The cluster matching is performed by comparing the clusters one-to-one, calculating the minimum Chi-squared distance among their descriptors. The smaller this distance, the greater the probability of being the same cluster in distinct epochs.
Figure 2. Direct geo-referencing of lidar data at different times. (Image: Authors)
The resultant cluster correspondences for the whole point cloud allow finding the rigid transformation between the point clouds. An initial coarse alignment among the clouds based on the centroids of each matched cluster was performed, followed by a fine alignment in order to reduce errors by the use of the Iterative Closest Point (ICP) algorithm. This approach is valid for urban environments, or for those where many objects can be segmented as clusters.
Finally, a practical case is described in order to show how we plan to use the outcome of the highly precise geo-referenced point clouds and the pose estimation method using lidar.
Why abandon well-worn mapping methods in current use?
It has to be for one or more forms of gain: time, money or staffpower. UAV-borne lidar can save a lot of field time, eliminate the need for site revisits, capture more data than previously possible, and provide a better product using more automated extraction tools.
Surveyors and other mappers must frequently develop a reliable surface model of an area about to undergo major construction. If it is new construction over native soil, then the area is often covered with vegetation ranging from short grass to very tall trees. By far the majority of these areas are surveyed using GPS, total stations, levels or some combination thereof, depending on the project. In any case, at least one trained individual, more often two or even three individuals, must walk the area collecting the necessary data with some form of survey equipment.
This is the tried-and-true methodology. It is easy to schedule, easy to estimate, and barring any field or office mistakes, absolutely reliable. Manually visiting a point in the field on return visits should yield similar, though not exact, results, at least within the tolerances of the equipment. It doesn’t matter if the temperatures are near freezing or over 100 degrees. It doesn’t matter if it is raining or sunny. It doesn’t matter if the grass is cut or if the leaves are on and in full glory. This is a very reliable method in all respects, assuming the proper tools and techniques are used.
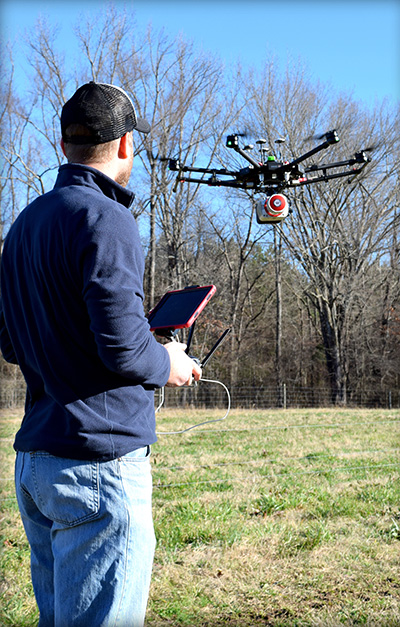
Piloting a lidar-equipped drone. (Photo: Bailie McRae)
How can this type of field survey be improved upon? First, is the product sufficient? Does the field crew reliably capture all the pertinent features? Did they get the location of the trees, buildings, poles and so on?
How many site visits are usually required to complete the average project?
What about the elevation data? Did they capture the drainage and breaklines sufficiently?
As always, the driving question is: Why change? Why abandon well-worn methods in current use?
It has to be for one or more forms of gain: time, money or manpower — which often equates to one or both of the first two terms.
When surveying with conventional equipment such as total stations, levels, and even GPS equipment, the likelihood of failure of a tried and true system is not very great. Comparatively, when using a UAV lidar system, not only are the stakes higher (as the equipment costs more), but the likelihood of an all-out failure is more likely and is definitely more devastating. There is no quick fix if your UAV crashes. It is more likely that the UAV will crash (usually due to operator error) than the lidar system itself will fail.
Facing these concerns, does one embrace a UAV lidar solution or hold to the tried and true?
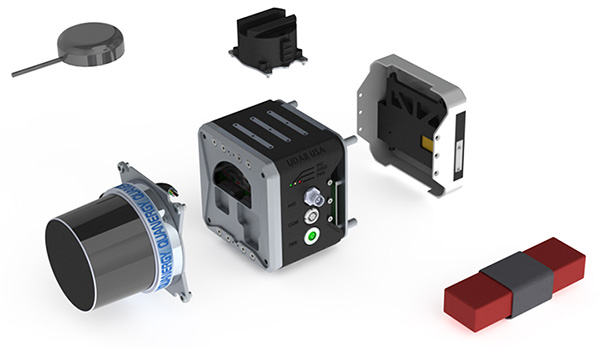
EQUIPMENT: Left to right, from top down: GPS antenna, laser head (Quanergy M8), detachable mount (car & UAV), computer and INS (GNSS receiver + IMU), interface plate, battery. (Photo: Lidar USA)
If it is important to get a heavily wooded 40- to 100-acre job collected and delivered as a surface at 1-foot contour accuracy (or maybe even 0.5 foot) in a single day, then UAV lidar is the tool for the job. UAV lidar can save a lot of field time, eliminate the need for site revisits, capture more data than previously possible, and allow for a better product using more automated extraction tools.
Accuracy. Often the client wants a 3D point cloud, or digital elevation model (DEM), which is not necessarily derived from lidar. If the site has no vegetation present, then an image-based solution should be sufficient.
However, most sites are initially covered with vegetation. In that case, an image solution from some sort of aerial camera will only provide a surface on the top of the vegetation — not what the client wants. While lidar may not be perfect, it can get to within 0.1 to 0.2 feet of the ground surface, in spite of grass or trees. For most initial design surveys, this is all that is required.
Money. Cost is perhaps the topic of greatest persuasion against lidar and in favor of an image-only solution. A lidar system is more expensive than most camera systems, but again the camera system simply cannot collect viable ground data in vegetated areas.
Time. Another factor is the time required to become profitable with the system, and the longevity of the system. In a good economy, it doesn’t take many 40-acre topo jobs to completely pay for a UAV lidar system. Once more, it is about time.
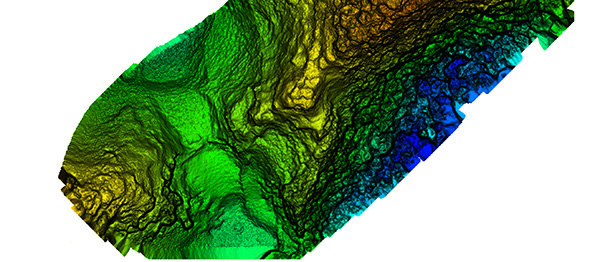
Broad overflight area of the cloud forest. (Image: Lidar USA)
As to product longevity, any new UAV product released today should be just as functional in five years. You may have to upgrade your UAV, but the lidar system will still be good for the jobs we’re discussing.
Lidar collects XYZ and intensity. It does not collect RGB values. This is a strike against lidar. While lidar data can be colorized with imagery captured from a camera on the same system as the lidar, or separately, this is generally discounted as being imprecise (not well aligned). Lidar does not inherently or directly capture color. However, imagery is 2D in nature and does not capture XYZ data.
Imagery can align with the lidar nearly perfectly; it is a matter of a good boresight.
UAV photogrammetry, or image-only solutions are amazing. They provide a wealth of information. They are complementary to and synergistic with UAV lidar.
The advantages of including a UAV lidar solution along with a UAV photogrammetry solution include:
the ability to measure at any time, day or night, in bright light or no light;
rapid surface generation (not instant, but fast);
flat surfaces, vertical walls, overhead structures — everything is collected without difficulty;
power lines, guy wires and so on are all collected directly,
bare-earth collection (multi-echoes and direct collection to ground, not just top of vegetation) is possible;
generally a much wider collection width and fewer flight lines.
Further, lidar can often penetrate dust, fog and mists.
Sensors and Their Issues
Bare earth classified surface of small site. (Image: Lidar USA)
Lidar does require an inertial navigation system (INS) and all of the controlling software. This generally makes the system more expensive. It also makes it able to more rapidly generate the final product.
Inertial Use with Lidar. An INS combines a GNSS receiver with an inertial measurement unit (IMU) and a lot of software and specialized filtering algorithms. It is essentially the central nervous system of a lidar system. The GNSS receiver provides universal timing such that every instrument including the IMU, scanner, cameras and others are all precisely time-stamped. This is key to proper data fusion. The GNSS receiver also provides positioning. The IMU is essential for determining proper orientation (roll, pitch, heading) as well as positioning at an extremely high data rate (2000 Hz) between the recorded GNSS epochs. If a GNSS event is missed (which shouldn’t happen on a UAV) the IMU bridges the gap between epochs. Large gaps can lead to positional drift, but shouldn’t happen on a UAV.
The real-time software maintains satellite lock (coupling with the IMU as necessary), while the post-processing software, using a post-process kinematic (PPK) process, provides the best possible solution of the trajectory. It solves the trajectory forward, backward and over and over with different parameters until it reaches an optimum solution. So it’s not just the hardware that makes the system more expensive, it’s also the software.
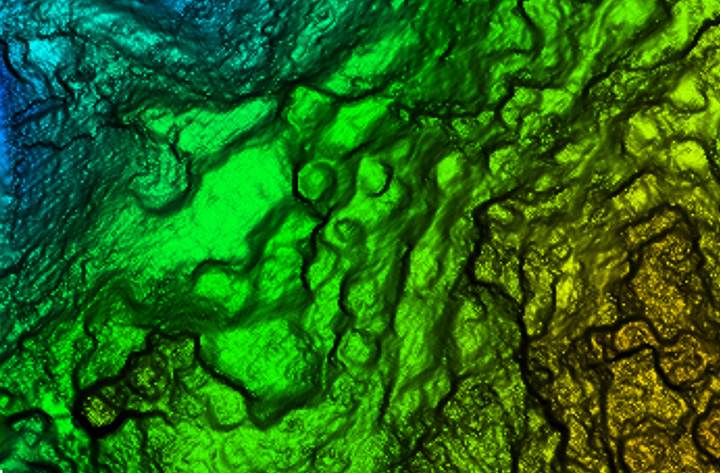
Closer site inspection — notice non-natural occurring mounds. (Image: Lidar USA)
Double Duty? There is some confusion as to the INS on a UAV. Can the INS used to navigate the drone be used for the lidar system as well, to save money? Yes, and no. Yes it can, with the proper integration — however, the INS to navigate the drone is usually far, far inferior to that required by a lidar system. So, No. Also, the lidar system really should be portable from the UAV to a car to maximize use. So the systems need to remain separate, for the most part.
Height and Width. Another UAV sensor issue concerning lidar is often very confusing. Some sensors are only good for 40- to 60-meter flying heights; some are useful to 200 or more meters. Depending upon where you work, this may be of no concern. In the U.S., we are limited to 120 meters above ground level (AGL) in any case. In most areas, being able to fly at 80 to 100 meters AGL is sufficient as long as accuracy and point density are not compromised.
Scan width varies a lot as well. The scan width of the shorter range systems is typically no more than 150 meters of usable area, whereas others can scan 500 meters wide. Consider that most surveys are 40 acres, maybe up to 100 acres, and we find that one flight is all that is necessary even with the least-expensive system. Do you need 500 meters wide? The answer depends upon your business model. If you are doing miles and miles of transmission corridor work, you probably need the greater width.
Ground Accuracy. What matters here is not so much positioning accuracy but point-cloud thickness. This can be difficult to understand and is a worthy subject by itself. The question is whether you can deliver the product you most often are required to deliver with the system. If you deliver 1-foot contour projects, can you achieve this with a 6-centimeter system or do you have to have a much more costly 1-centimeter system? Clearly the 1-centimeter system is much better, but what do you need to deliver?
Intensity is another concern. Most of the less expensive systems don’t do a very good job delivering a “b+w image-like” point cloud; that is, their intensity falls off dramatically with distance. Others do an amazing job. Is this important? Can it be overcome with colorization? If you were doing your work conventionally, would you be delivering an image-like surface? I doubt it. Certainly the intensity is nice to have and the information can be very useful in automated processing, but is it worth the price difference?
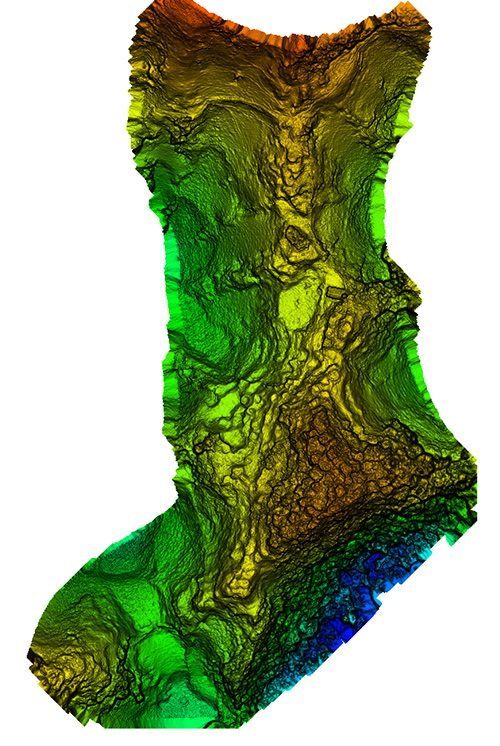
Ultimate Test: the Jungle
Recently we undertook an adventure with some explorers in South America, near the city of Jaen, Peru. A crew filming a new TV show for the Travel Channel sought to understand more about the ancient civilization of Chachapoyas, Warriors of the Clouds. Little is known about this race of people because they were conquered by the Incas in the 16th century and shortly thereafter by the Spanish conquistadores.
Our team was to help identify structures in an area called Leymebamba, about four hours’ drive from Jaen, hidden beneath the deep Amazon cloud forests — definitely not a typical North American forest. These forests are not only very dense with vegetation but with cloud cover that is generally at the level of the canopy.
Many centuries after the Chachapoyas have vanished, structural remains are concealed not only by the clouds and the canopy, but buried beneath several feet of dirt and a lot of living and long-since-dead organic matter. Only the most pronounced features can be found by the naked eye or a traditional survey.
Lidar brings a huge advantage in that it can get a much better approximation of the ground as well as any other hard surface such as walls, fences, trails, buildings and towers. By blanketing an area with dozens if not hundreds of points per square meter, post-processing software can “peel” the living vegetation away from the ground surface. This ground-classified data can then be analyzed by a trained scientist to determine if there are in fact any revelations to be had.
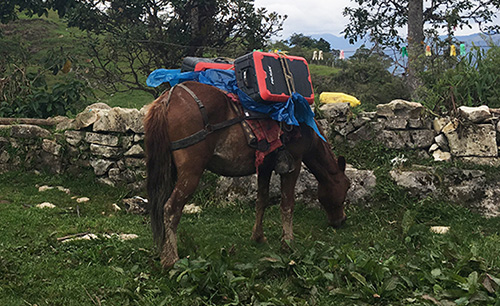
In our case, we were using an A-series high-definition lidar system, best flown at 40 to 60 meters and, in extremely dense vegetation, at 5 to 6 meters/second. Collecting 700,000 points per second enables us to potentially capture more than 400 points per square meter in a single pass. The area we were to scan varied considerably in terrain and had very little to offer that was flat and open. In fact, to get to the site, we had to pack several mountain horses with the UAV, several sets of batteries, and the scanner as they traveled down very steep terrain about 900 feet to the base of the hill to be scanned.
We’ve said we can scan from nearly anything moving, but we’ve never done it from a horse. Well, we weren’t actually scanning, but it was pretty close.
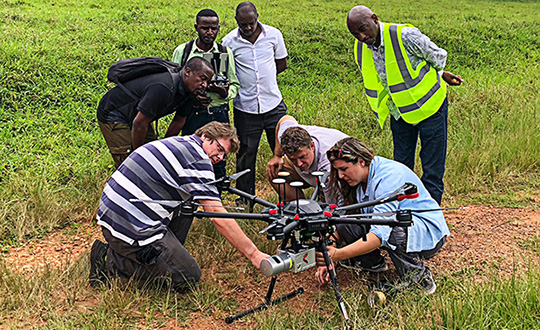
UAV and lidar, bound for the cloud forest. (Photo: Forrest Briggs)
Finding a suitable take-off and landing area posed a challenge. Due to vegetation and terrain, only small areas could be scanned in a single flight, as the vehicle would quickly leave line-of-sight (LOS). While LOS may not be an issue legally in this area, it remains a real concern: we always want our equipment to come home at the end of the mission.
We learned something we hadn’t anticipated along this journey regarding weather. The day would start out around 80° F; around 2 p.m. it would rain, and the rest of the day would close out much cooler. Does this matter? Yes, if you are now wet and cold with several hours ahead of you. It seems there is always some new surprise.
As the area was remote, with no internet access, the existing map data for mission planning had to be downloaded prior to visiting the site. Each lidar mission was preceded by a scout flight using a small UAV to help ensure safety and appropriate flying height per flight line.
Situating the Base. Projects like this always pose dilemmas. Finding a good place for a GPS base station in a cloud forest is no small task. Normally we would put the base station on a known reference point so we can easily join the data with other projects. In this case we didn’t have any such concern. We simply needed an area with a clear view of the sky; usually this means no obstructions 12 degrees above the horizon. However, in a forest and in the mountains, you take what you can get. In our case, we found a rock outcropping and placed the unit on it with no tripod. It didn’t give us the best solution, but it worked.
Ideally we leave the base running for hours to get a good solution. Since we had multiple sites to scan, this wasn’t a problem. All sites were within walking distance of the base, so there was no concern about being too far away and adding more problems to the project. In PPK mode we can easily be 10 or 20 kilometers from the base with no concern.
Other Forest Challenges. In-field processing, far from internet or electrical supply, requires very judicious battery and especially laptop usage. The lack of many things we take for granted can quickly be a show-stopper if necessary (maybe even a phone call).
Even back at the hotel where power was available — don’t count on it. While the film crew and archeologists are eager to see results, everybody has to wait. No power.
Supposedly this is common and only lasts an hour. Three hours pass and everybody goes to bed but the lidar crew.
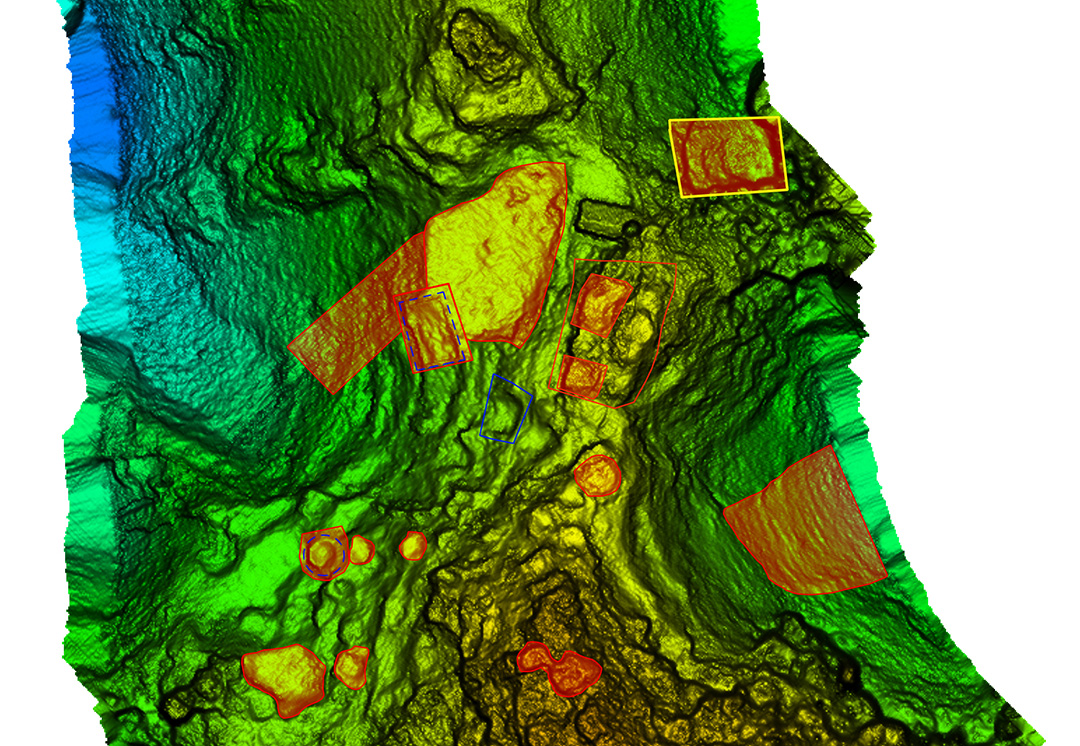
Areas of interest to archeologist — lots of them. (Image: Lidar USA)
Finding the ground should be easy, but a new version of software has been installed. There’s a kink in our plans. Finally after some internet help (a call back home), the right settings are found and the software begins peeling away the vegetation to reveal the ground. The top of each hill (several were scanned) looked like a primitive fortress with 20 to 30 cylindrical structures clearly spread over the top of each site. On one site we identified a tower at least 3 meters in height.
While areas like this could be scanned with a conventional aerial system, collecting much larger areas, the UAV lidar solution offers several distinct advantages. One of these is just a quick recon of the area. Physically being on the ground at the site makes the team much more aware of what is going on. Secondly is the far, far greater density of points and the ability to collect much more off-nadir, allowing for more of the vertical structure to be captured.
In the end, our mission was successful. The UAVs were ported by horseback up and down precarious trails. The lidar worked great. None of the batteries failed. The drones didn’t crash. The archeologists were thrilled with the results, having found several new structures and a tower unknown to them. Once again, UAV lidar proved to be the best tool for the job. Indiana Jones out!
Manufacturers
As both INS sensors and lidar scanners continue to change, this allows us to make quite a variety of configurable systems. For this particular project, we used our Snoopy INS (OEM) with a Quanergy M8 Ultra scanner. The Snoopy INS uses a NovAtel OEM719 GNSS receiver to ensure best performance with GNSS collection. Other options for the INS include the NovAtel STIM300 (Sensonor IMU), VectorNav VN-300 and Trimble Applanix AP family. For scanners we support all Velodyne scanners including the latest AlphaPuck, Quanergy, Riegl and several more. Of course, for cameras there are the ever-popular FLIR, Sentera, PhaseOne and DJI. GPS base stations are not all equal, but most will work as long as they log at least L1/L2 GPS at 1Hz.
JEFF FAGERMAN is a a professional surveyor and certified photogrammetrist. He has a master’s degree in photogrammetry from Purdue University and worked as a photogrammetric software developer at Intergraph before starting Fagerman Technologies. Now known as Lidar USA, the company focuses on mobile lidar aboard UAVs.
This digital elevation model (DEM) indicates the type of data currently being acquired across Florida. (Photo: Dewberry)
High-resolution airborne lidar data to be acquired over 34,000 square miles for disaster response and recovery.
Under an active Geospatial Products and Services contract, the U.S. Geological Survey (USGS) has selected Dewberry, a privately held professional services firm, to complete a statewide lidar mapping project for Florida. The project is funded by the Florida Division of Emergency Management and USGS as part of Hurricane Irma Disaster Recovery, Response and Preparedness measures being conducted by the state and federal agencies.
The approximately $20 million project includes airborne lidar data acquisition, ground survey and preparation of bare earth point cloud and digital elevation model products for various applications to support response, recovery, and preparation for future storm events.
The resulting quality level 1 data will be primarily used for hydrologic and hydraulic modeling and many engineering applications by the water management districts to mitigate the impacts of flooding caused by these storms.
USGS and the Federal Emergency Management Agency (FEMA) will also utilize these data for various flood studies. The project encompasses an area of more than 34,000 square miles.
Photo: Dewberry
Dewberry has acquired and processed nearly 22,000 square miles of lidar data for various local, state, and federal agencies in Florida within the past three years.
“As we continue to map the state of Florida, we’re looking forward to using the best technology and personnel to complete such a vast undertaking,” said Dewberry Vice President and Director of Remote Sensing Amar Nayegandhi, CP, CMS, GISP. “Once these data are acquired and analyzed, they will be able to support USGS, FEMA, the Natural Resources Conservation Service, the Florida water management districts, and several other state and local agencies in their mission to better prepare for natural disasters and minimize loss of life and property; and use these scientific data to enhance and protect our quality of life.”
Dewberry will serve as prime contractor for this project and will perform the majority of the data production. The firm is teaming with seven other partner firms including Woolpert Inc., Quantum Spatial Inc. and Digital Aerial Solutions, Inc, which will acquire and process data to support the project.
Dewberry’s other subcontractors will be tasked with acquiring airborne lidar data.
“We have 11 aircraft with top-of-the-line airborne lidar sensors being deployed for data acquisition starting in early December,” said Dewberry Senior Project Manager Elise MacPherson, PMP. “I’m excited to manage this project and support the needs of USGS, their partner federal agencies and the many stakeholders in Florida.”
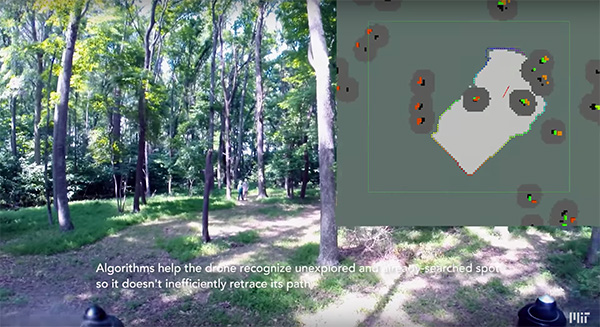
Researchers at the Massachusetts Institute of Technology (MIT) presented a project at the International Symposium on Experimental Robotics involving an autonomous drone fleet system that collaboratively mapped an environment under dense forest canopy.
Designed with search and rescue in mind, the drones used lidar, onboard computation and wireless communication, with no requirement for GPS positioning.
Each drone carries laser-range finders for position estimation, localization and path planning. As it flies, each drone creates its own 3-D map of the terrain. A ground station uses simultaneous localization and mapping (SLAM) technology to combine individual maps from multiple drones into a global 3-D map that can be monitored by operators.
The MIT team tested its concept via simulations of randomly generated forests, and world-tested two drones in a forested area at NASA’s Langley Research Center. In both experiments, each drone mapped a roughly 20-square-meter area in about two to five minutes, while the control system integrated their maps together in real-time.
The drones were programmed to identify multiple trees’ orientations, as recognizing individual trees in impossible for the technology, and individual trees’ orientation very difficult. When the lidar signal returns a cluster of trees, an algorithm calculates the angles and distances between trees to identify the cluster and determine if it has already been identified and mapped, or is a new mini-environment.
The technique also aids in merging maps from the separate drones. When two drones scan the same cluster of trees, the ground station merges the maps by calculating the relative transformation between the drones, and then fusing the individual maps to maintain consistent orientations.
Riegl now offers several new sensors and systems for airborne data gathering at various elevations.
At Intergeo 2018, the company unveiled sensors designed for low-flight altitudes, such as with UAVs. Riegl also introduced sensors designed for medium-flight altitudes used in large UAS/UAV/RPAS with higher payload capacity or in manned helicopters, and scanners and systems for data acquisition at high flight altitudes using manned fixed-wing aircraft.
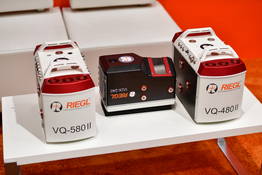
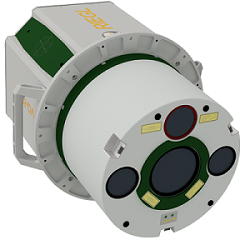
The Riegl VQ-480II and VQ-580 II on display at Intergeo 2018. (Photo: Riegl)
Medium altitude. The Riegl VQ-480 II (Mark 2) and VQ-580 II (Mark 2) are designed for airborne applications at mid-altitudes for use on both manned and unmanned aircraft. Based on the capabilities of their predecessors VQ-480 and VQ-580, their new, sophisticated designs lead the quality of the systems to a new standard of performance and user-friendliness.
Both offer a measurement rate of up to 1,250,000 measurement/second and a wide field of view of 75 degrees, suitable for corridor mapping, city modeling and applications in agriculture and forestry.
With approximately 10 kg of weight, they are ready for integration into helicopters as well as unmanned UAVs with a higher payload capacity, and are compatible with stabilized platforms and even small hatches.
The VQ-480 II and VQ-580 II are prepared for smooth GNSS/IMU integration, offer interfaces for up to five optional cameras, and are equipped with a removable storage card and an integrated SSD for data storage.
While the VQ-480 II works at a laser wavelength of 1550 nm, the VQ-580 II works at 1064 nm wavelength suited to measure on ice and snow.
Laser scanning. Riegl’s VUX series, focusing on unmanned laser scanning, has also been expanded. With the Riegl VUX-240, a new airborne lidar sensor with less than 4 kg weight and a sophisticated design offering 75-degree field of view is now ready to be integrated on both small manned and larger unmanned aircraft.
The high measurement rate of 1,500,000 measurements/second and a high scan speed of up to 400 lines per second are the basis for high scan efficiency, especially in applications like power lines, railway tracks, pipeline inspection or topography in open-cast mining. Interfaces for an optional GNSS/INS system integration and up to four optional cameras are further convincing key features of the new scanner.
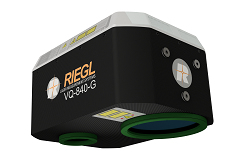
The Riegl VQ-840-G. (Photo: Riegl)
Bathymetry. For the bathymetric segment, the Riegl VQ-840-G has entered the marketplace. Designed for combined topographic and hydrographic surveys for use with large UAVs from lower flight altitudes, the scanner carries out laser range measurements for high-resolution surveying of underwater topography utilizing a green laser beam.
The scanner’s compact, lightweight and robust housing also can include an optional digital camera and an additional, fully integrated infrared laser rangefinder, and is compliant with typical hatches in aircrafts and with stabilized platforms.
The Riegl VQ-880-GII. (Photo: Riegl)
Airborne laser scanning. The Riegl VQ-880-GII is a further improvement of the VQ-880-G topo-hydrographic airborne laser scanning system, offering online waveform processing and full waveform recording.
The improved setup includes a green laser channel, an integrated infrared laser channel, and an integrated dual camera system for RGB and IR. Typical applications include coastline and shallow water mapping, acquiring base data for flood prevention, and measurements for aggradation zones.
Also available are the VQ-780i airborne laser scanner and the VQ-1560i dual wavelength airborne mapping system.
Cohda Wireless has successfully demonstrated its connected autonomous vehicle technology in a live trial on the streets of the city of Adelaide, Australia.
The trial proved the potential for connected self-driven vehicles to make streets safer and that Cohda’s technology is effective even in challenging urban canyons.
In an area covering two city blocks east of Adelaide’s Victoria Square, the demonstration replicated a scenario that is a daily occurrence on the streets of cities all over the world.
In the scenario, two vehicles approach a four-way intersection at right angles to each other. Car 2, driven by a human, fails to adhere to the red-light signal and approaches the intersection at speed, intending to “skip” the red light. Car 1, a connected autonomous vehicle, is approaching the intersection from another direction and intends to proceed through the intersection on the green light.
In a real-life scenario, there would be a risk of a collision as human drivers will invariably approach the intersection when the light is green, fully confident that all other road users will obey the traffic signals. In an instance where Car 2 disobeyed the traffic signal and Car 1 was unable to see the approaching danger, due to visibility being obstructed by buildings or other infrastructure, a collision would be especially likely.
But as Cohda Wireless’s Chief Technical Officer Professor Paul Alexander explained, if the vehicles were connected using Cohda’s V2X (Vehicle-To-Everything) technology, a potential collision situation would be detected and avoided well in advance of it actually happening.
“We demonstrated that when vehicles are connected to each other using our smart V2X technology, Car 1, the connected autonomous vehicle, would detect that Car 2 is approaching the red light at speed and is probably not going to stop. This allows the connected autonomous vehicle to pre-emptively identify and respond to the threat by slowing down and stopping.”
“Cohda’s V2X technology allows vehicles to ‘speak to each other’ to extend their perception horizon,” added Alexander.
“The technology provides the vehicle with an awareness of its environment and risk factors associated with it, consistently and accurately up to ten times per second, enabling it to make decisions that a human being would not be capable of making as the driver of the vehicle.”
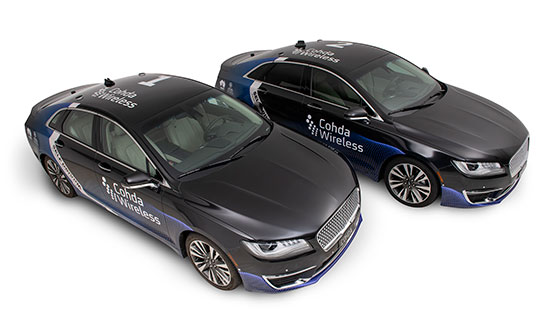
Cohda’s Smart Cars Smart City initiative was funded by the South Australian Department of Transport and Infrastructure’s Future Mobility Lab Fund. In June this year, Cohda Wireless took ownership of two specially-modified vehicles from the U.S. that it is using in advanced trials of its V2X (Vehicle-To-Everything) technology.
The two Lincoln MKZ sedans were fitted with the ADAS (Advanced Driver Assistance Systems), ROS (Robot Operating System) various sensors including lidar, radar, cameras, GPS as well as in-vehicle compute platform and Cohda’s GNSS- independent positioning technology.
The fusion and cooperation of the various sensors and Cohda’s V2X technology augment the vehicles’ perception capability and make the autonomous vehicles features more practical, to include threat detection, the dangers associated with blind intersections and vulnerable road users, the company said.
“Our goal today was not only to demonstrate the efficacy of our technology in enabling self-driven vehicles to communicate with each other, but also to do so in a city environment where so-called ‘urban canyons’ significantly affect the ability of systems reliant on Global Navigation Satellite Systems (GNSS) to achieve accurate positioning,” Alexander said.
“The area in the city of Adelaide in which the trial was conducted was one such urban canyon where positioning through GNSS can be off by up to 40 meters, but with our V2X Locate technology positioning accuracy is improved to within a meter.”
Photo: Cohda Wireless
Cohda Wireless demonstrated the efficacy and accuracy of its V2X-Locate system in a 2017 trial in New York City where it repeatedly demonstrated sub-meter accuracy while driving along Sixth Avenue, which has the tallest buildings in the Big Apple. Comparably tested GPS-based systems were as much as tens of meters off-course, at times showing cars driving through buildings.
Cohda’s V2X technology underpins and complements other technology used by autonomous vehicles such as cameras, sensors, radars and lidars by enabling cooperative perception.
“The role of technology in making our roads safer is probably not generally understood but we hope that this demonstration has helped to prove that with the appropriate technology and infrastructure, connected self-driving vehicles are safer to have on our roads than vehicles controlled entirely by human beings,” added Alexander.
Steve Malkos of Google, and a GPS World contributor, will address the ION GNSS+ plenary session at the technical meeting and showcase, to be held Sept. 24-28 in Miami.
Malkos will address “Emergency Location Service in Android.” When emergency services get a call, they need to know the caller’s location to send help and save lives. More than 80 percent of calls to emergency services come from mobile phones, but locating these mobile callers can be a major issue.
Current emergency solutions rely on cell tower location (which can have a radius of several kilometers) and, in some countries (like the U.S. and Japan), on A-GNSS. But A-GNSS can fail with weak signal reception, in urban canyons and indoors.
Malkos will discuss how Emergency Location Service in Android is delivering more accurate location (computed from fusion of Wi-Fi, cell, GPS and sensors) to emergency services when an emergency call is detected.
Paul LaRocque
Also speaking is Paul E. LaRocque, Teledyne Optech‘s vice president of Special Projects. In his presentation, “A Lidar History: From Ship to Air to Space,” LaRocque will give a historical review of the airborne laser mapping systems that Teledyne Optech has designed and built over the years.
Optech has been active in laser radar systems beginning with marine lidars and later moving to airborne and spaceborne systems. Navigation has been an important subsystem in these developments, and its role will be described as part of this story.
LaRocque has been involved in the development of Optech’s lidar systems since the late 1980s. Dr. LaRocque was instrumental in the design of Optech’s airborne lidar bathymeters, airborne lidar terrain mappers (ALTM), and waveform digitizers, as well as other special lidars.
No, this is not a drill or a major motion picture event.
During my lifetime, many natural disasters that have taken place around the globe. These unfortunate events have created mass destruction and caused many deaths by a variety of environmental elements, ranging from earthquakes and volcanic eruptions to hurricanes and snowstorms.
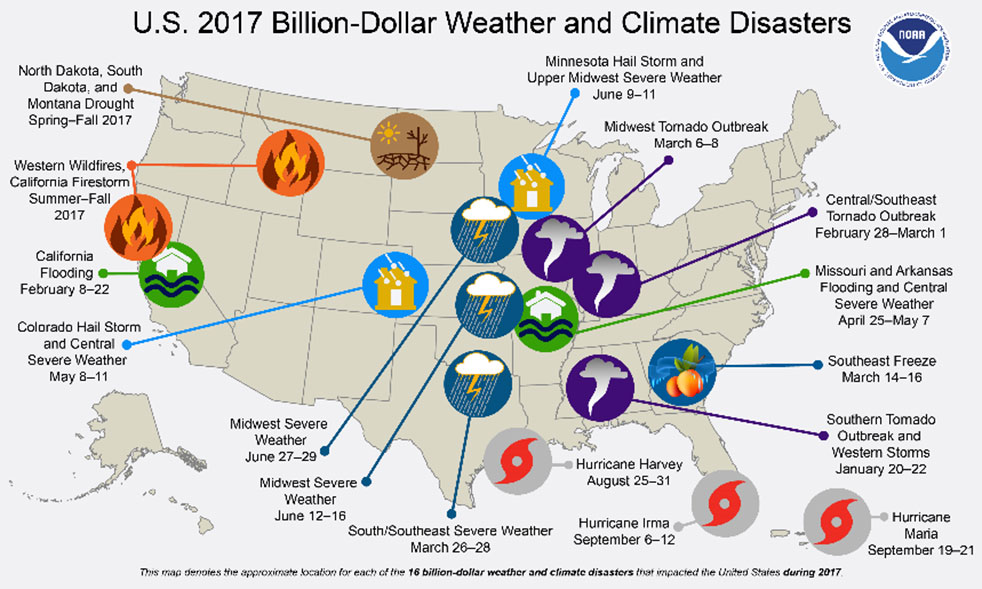
Disasters in the United States. (Image: FEMA)
Once Mother Nature decides to unleash her wrath, rarely anything stands in her way. Some types of disasters create situations worse than others, but all have a reputation of leaving a trail of death and destruction.
Search and rescue is the first and foremost priority when it comes to these disasters, with cleanup and rebuilding to soon follow.
The role of the land surveyor, however, doesn’t usually enter the discussion when it comes to these situations. It has always been considered an occupation that fills an important role in development, construction and parcel ownership, but rarely is discussed in the same terms as a fireman, policeman or doctor.
We will take a closer examination at how the surveyor uses skills developed through education, technical training and practical application of geographical data to quietly assist those in need through these difficult bouts with Mother Nature.
First, however, we will discuss various types of the deadliest natural disasters, the amount of destruction that has been caused and types of problems (besides deaths) that were left because of these tragedies.
Disasters throughout history
When describing natural disasters, the obvious ones come to mind: earthquake, hurricane/typhoon/cyclone, tornado, wildfire, flooding/monsoon, drought/famine, volcanic eruption, tsunami, sandstorm, avalanche, and snowstorm.
All of these have wreaked havoc on mankind for centuries, with more physical destruction taking place in the past few centuries.
Some of the factors leading to an increase in this devastation are gains overall population and amount of buildings and improvements in populated areas. Let’s look at how each disaster impacts the areas in which it occurs:
Flooding/Monsoon
Historically the deadliest type of natural disaster, rainfall through storms and monsoons cause flood events that have caused millions of deaths in several instances around the world. Most of the deaths caused by flooding situations are due to drowning in floodwaters that inundate areas not normally affected by normal amounts of rain.
The largest flood in recorded history took place in China during 1931, combining melting snow and ice with ongoing rain events to create a continuous flooding event that lasted most of the year. Death toll estimates range from 400,000 to almost 4 million, as many of the victims either died or moved to other regions with no trace.
Hurricane/Typhoon/Cyclone
This is another type of flooding disaster, but it combines large amounts of rain gathered from ocean storms with high winds to batter shoreline and inland areas. These storms can often stall in place, causing significant damage by both wind and rain.
Tornado
Most weather systems associated with creating tornadoes are believed to occur in the United States, but they happen all over the world. Many of the deadliest tornadoes have taken place in the Middle East, including Bangladesh, Russia and Pakistan. These storms can include torrential rain, but most of the damage caused by tornadoes is wind-related.
Earthquake
Shifting tectonic plates and earth-shaking tremors are a significant cause of damage and deaths throughout the world. Most of the highest death tolls have taken place in Asia, with the biggest loss of life occurring in Shaanxi, China, on Jan. 23, 1556, with more than 830,000 deaths.
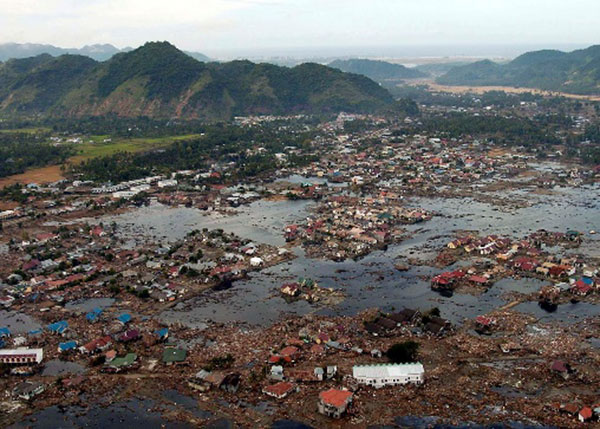
Indian Ocean (Jan. 2, 2005): A village near the coast of Sumatra lays in ruin after the Tsunami that struck South East Asia. (Photo: U.S. Navy/Photographer’s Mate 2nd Class Philip A. McDaniel)
Tsunami
Often a secondary disaster generally associated with earthquakes in coastal areas, tsunamis kill thousands by inundating shorelines with huge waves and sending vast amounts of water into low-lying areas and poorly constructed seaside villages. The largest tsunami in recent memory was on Dec. 26, 2004, in the Indian Ocean off the coast of Indonesia, with the death toll reaching 280,000 people.
Volcano
The biggest cause of earthquakes is typically molten lava expanding to shift tectonic plates, but volcanoes are formed with the lava and associated gases finding an escape in the Earth’s crust.
Once a volcano has formed, an eruption can lead to significant damage from lava flow onto adjacent land and hot ash spewed into the atmosphere. Many volcanic eruptions throughout history have buried local cities and villages, making them virtually disappear.
Wildfire
Grabbing the headlines more recently has been the proliferation of wildfires. While not causing the substantial loss-of-life associated with many other natural disasters, wildfires are responsible for scorching hundreds of thousands of acres of forest and brush areas, as well as decimating neighborhoods.
Avalanche
This disaster only takes place in locations with significant snow pack and elevation changes. After large amounts of snowfall, various factors lead to movement of large areas of snow and ice down mountainous slopes. Often these events take place near cities and villages in mountainous regions and can leave the inhabitants buried and unreachable.
Other Types of Natural Disasters
While the varieties of events listed above can create large-scale destruction, there are others that, while smaller in nature, can collectively cause great damage and loss of life. Thunderstorms, snowstorms and sandstorms are wind-related and can be devastating to the areas being affected.
Other natural disasters that often don’t get the same recognition as those listed above include drought and famine. These environmental tragedies ruin thousands of lives, and it take years to recover from the damage caused by these inflictions.
Disaster hits. Now what?
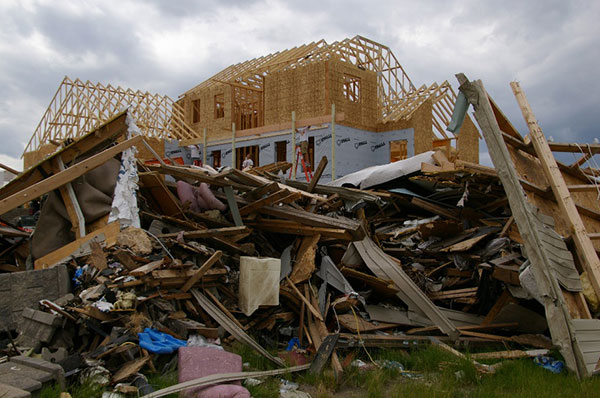
June 28, 2008: A house in Parkersburg, Iowa, is being rebuilt while debris from a deadly EF5 tornado still covers the ground. (Photo: FEMA/Richard O’Reilly)
All of these disaster types have led to a great number of fatalities and total devastation of cities and roadways. To help us understand what type of assistance the surveyor can provide, we first need to identify the conditions left by each of these events.
Most of the disasters simply wipe out whatever is in its path; from tornadoes, hurricanes, and wildfires to earthquakes, avalanches and tsunamis, the regions affected are left in shambles after the occurrence.
The initial search and rescue through the rubble takes manpower and careful identification of areas where people are known to inhabit, either as residences, places of employment or public spaces. These areas require retracement of existing mapping and atlases to accurately identify those places for timely recovery.
Once the search-and-rescue efforts have ceased and cleanup/rebuilding commences, the destroyed areas will need to be remapped based upon existing parcels and ownership rights. Reconciliation of existing parcels, subdivisions and rights-of-way will be required to properly return the injured areas to a habitable state.
The one disaster that’s a big wildcard, however, is the earthquake. The devastation is like the others and generally will need rebuilding like the others, but with one large difference; putting everything back where it belongs.
When large tremors cause significant shifts in inhabited and/or complex parcels, the ability to retrace existing parcels, subdivisions and rights-of-way to place them in their original location becomes a nightmare.
How surveyors and GNSS help before and after disasters
As expert measurers and establishers of boundaries, the surveyor provides guidance for the creation of parcels and rights-of-way. Through extensive education, training and experience, the surveyor combines field reconnaissance, legal definitions of parcels and high-level mathematics to provide direction for the creation and retracement of real property.
After experiencing a devastating event like the ones described above, the surveyor becomes a key position in rebuilding the affected area.
Prior to the invention and proliferation of GNSS technology, however, the use of state plane coordinate data was a tedious and time-consuming task (see my January 2017 article at GPS World).
Establishing coordinate values across a large region and/or utility system was not practical from a time or cost viewpoint. The arrival of GNSS technology in the 1990s changed that situation with the ability to determine coordinate values in real-time and create large databases of infrastructure and utility information. Government agencies (and surveyors) now could replicate, with acceptable accuracy and precision, locations of improvements and utilities throughout their jurisdiction.
Surveyors are now being called upon to assist with search and rescue efforts when these disasters hit to help locate and turn off existing utilities (i.e. electricity, gas, water), and to provide mapping assistance for retracing where people may be in the rubble. Because lives are at stake, timely location is essential for these services and GNSS technology use by the surveyor provides a much-needed service.
Once these disaster events being a rebuilding mode, the surveyor steps in to find the existing parcel and right-of-way lines to assist the respective owners where a deed or roadway was previously located. Most times, the surveyor can retrace existing line by locating buried monuments and recreating existing deed descriptions and/or roadway locations.
Where there becomes a problem is when the devastation is large enough to destroy all existing monuments and leave no trace of any occupied land. The surveyor must expand the search area, as far as needed, to find the closest available monuments in which to begin rebuilding the parcel descriptions.
Depending on the site conditions, GNSS equipment is used to locate the positions of the nearest monuments so the surveyor can perform retracement calculations for the disturbed area.
Once the area to be re-established to calculated, the surveyor can return to the site and place markers signifying parcels and rights-of-way for the rebuilding of roads, utilities and buildings. GNSS receivers are again utilized to increase the proficiency of the field crew by allowing the installation of the markers over a large area in a short amount of time.
How surveyors can prepare for future events
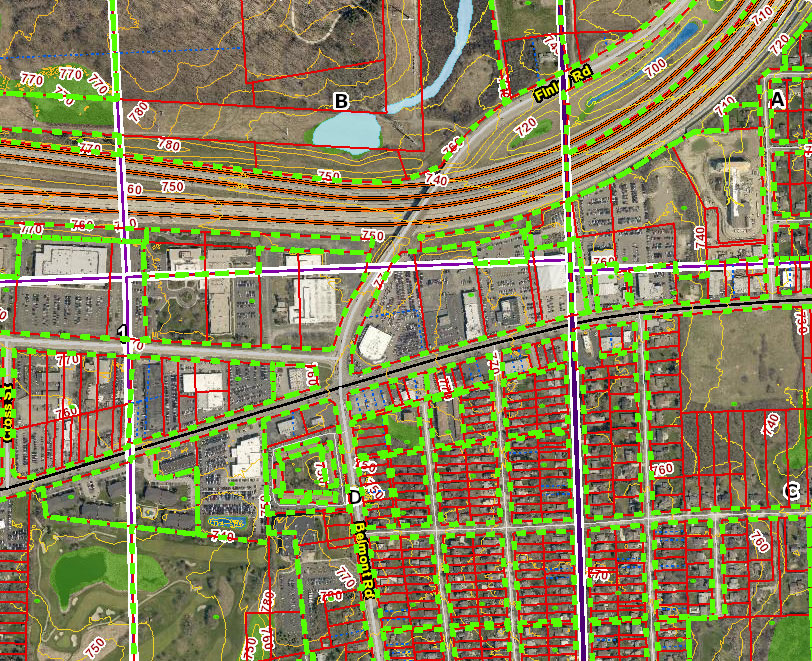
Image: DuPage County, Illinois, GIS
As previously written in my January 2017 column, GNSS technology has helped expand geographic information systems (GIS) into a database beast, containing everything from voter districts, zoning regions and floodplain maps to locations of most municipal utility maps and databases.
When these databases have included a geodetic layer of survey information overseen by the licensed land surveyor, the GIS is now more than a glorified digital Etch-A-Sketch. These entities within the database have geolocation as part of its dataset, with varying accuracy depending on the source of the data.
By having all this information available in a digital format, typically saved in a cloud-computing location, the ability to replicate these entities becomes a simple exercise. As more information becomes available, it needs to be included into the database for future mapping consideration.
All relevant data, together with a geolocation tag, becomes valuable for future retracement. This information could be used to locate possible survivors during a disaster event.
Upcoming technology to assist surveyors with disaster relief planning
Image: Esri
Many of the tools being utilized by surveyors have the capability of helping with mapping and data collection of municipal and public facilities for GIS database inclusion.
We currently use laser and lidar scanners both terrestrially and aerially to collect point-cloud data for establishing existing conditions of various sites. This point cloud, along with high-resolution photography, can be used to augment and enhance new and existing GIS databases with extensive datasets.
By having this additional information collected and available digitally, qualified experts can perform disaster simulation tests to depict various environmental events and determine what strategies will be necessary for search-and-rescue efforts.
These experts can also use this data to predict potential flood paths, conduct seismic modeling to determine building shift, and combine weather conditions with conceivable wildfire-capable areas. All these potential life-saving exercises can utilize the surveyor as a significant data-collection source.
Coming to a theater near you…
Whether one believes in climate change or just being affected by an active environmental cycle of natural disasters, the entire world is prone to have an occurrence of at least one of these events.
Since these events are not going away, remember to help your fellow man, woman or child in their time of need. It is the duty of the surveyor to provide a service that is intended to protect the public, and being there for disaster planning, prevention and recovery is part of our mission.
Think of us like the Avengers; now there’s a sequel I’d pay to see.
A number of geospatial companies played a key role in the government’s response to the Kilauea Volcano eruption. The volcano on the Big Island of Hawaii began erupting May 3, and while quiet for more than a week, it could resume erupting at any time.
Mapping the flow. As a resident of Hawaii, Brennan O’Neill, Hawaiian branch manager of Frontier Precision, was in a unique position to offer support. Frontier Precision provided free access to technology and expertise to assist in mapping the lava flow.
“I had to help out,” O’Neill said. “It was tearing at my soul. For a geologist, it’s even more powerful than that. The lava flow is like a living mass that has a mind of its own, creeping, glowing — an upside-down conveyor belt surging forward and burning everything in its path.”
Through Frontier Precision, O’Neill offered high-tech mapping equipment, his own expertise, and the help of Nathan Stephenson, an applied geospatial engineer working in the company’s Denver office.
“We used a combination of Trimble R10s and Trimble R8s to gather accurate data points on the ground,” Stephenson said.
This thermal map shows the fissure system and lava flows as of 6 a.m. on Saturday, Aug. 11. The thermal map was constructed by stitching many overlapping oblique thermal images collected by a handheld thermal camera during a helicopter overflight of the flow field. The base is a copyrighted color satellite image (used with permission) provided by Digital Globe. (Map: USGS)
The mapping team flew UAS drones over the flow to gather visual imagery data, matched it to the ground reference points, stitched the photos together and draped it over county maps. The process was repeated as often as needed — daily, and sometimes even hourly — to show the speed and direction of the flow.
Stephenson isn’t new to mapping lava flows. As a graduate student at the University of Hawaii – Hilo, he worked on collecting data on the Pahoa eruption in 2014, and he’s seen advances in technology in just a few years.
“One thing we have now that we didn’t have in 2014 was a thermal radiometric camera that helps us map more accurately at night and enables us to capture large heat signatures.”
The collected data helps Hawaii Civil Defense and other agencies keep the public informed and safe, and in the long term it also contributes to the store of scientific knowledge about eruptions and lava flow behavior.
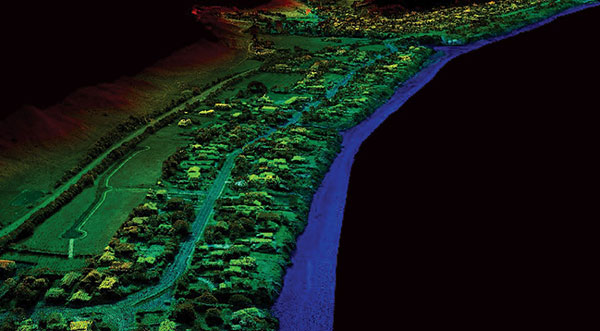
Lidar image of the Hawaii dataset showing the Kilauea Calderand the Halena’uma’u Crater and within it. (Image: Quantum Spatial)
Airborne lidar insights. Another technology that aids in volcano response is lidar. High-resolution lidar surveys help first responders, scientists and government agencies monitor Kilauea conditions and predict future lava flows.
Independent geospatial data firm Quantum Spatial Inc. (QSI) has conducted high-resolution lidar surveys of areas surrounding the Kilauea volcano eruption in Hawaii.
The emergency response effort was part of the U.S. Geological Survey’s (USGS) Rapid Response Imagery Products (RRIP) in support of the Kilauea’s 2018 East Rift Zone – Remote Sensing Acquisition Requirement.
The USGS Hawaiian Volcano Observatory (HVO), along with emergency responders, government agencies and academics, will use the data to better understand the conditions and characteristics of the volcano, and help planners model potential lava flows, which may better predict and respond to future flows and enhance safety of residents.
The QSI team, which included GEO1 and Windward Aviation, deployed within days to acquire high-resolution lidar at point densities averaging from 40 to 80 ppsm, with up to 150 ppsm in select areas and 100-mp digital imagery using a Riegl dual VUX-1 LR sensor pod equipped with ABGPS/IMU mounted on a Hughes 500D helicopter.
The project required 11 missions over the course of six days, operating at times as low as 500 feet above the ground and above active flows and nearby erupting calderas. With a need for a quick turn around, QSI deployed an analyst with the flight crew to post process each mission within hours of collection.
The data was uploaded to the Geospatial Repository and Data Management System (GRiD) interface, developed by the U.S. Army Corps of Engineers (USACE), where additional data products have been developed and provided to the response team that includes FEMA, Hawaii’s Emergency Operations Center (EOC) and the Hawaii County Civil Defense.
After data collection, QSI measured topographic shifts during the processing by comparing new data with a 2011 lidar collection from the same area. Survey specialists and USGS experts confirmed within hours of processing QSI’s lidar data that areas within the site had shifted up to 1.5 meters east, 2 meters to the north and 1 meter in elevation.
USGS scientists will continue to examine the new topographic data to better understand the nature of these shifts, and integrate it into lava flow models for more accurate predictive modeling.
The eruption in action. Using small unmanned aerial systems (sUAS) together with air-quality sensors, advanced imaging tools and Esri’s spatial analytics and mapping, a team from the Center for Robot-Assisted Search and Rescue (CRASAR) provided real-time aerial views of the eruption.
The five volunteers armed with drones, advanced sensor systems and GIS technologies joined the response effort May 14-19 at Kilauea Volcano Lower East Rift Zone to assist in tracking and predicting the ongoing volcanic eruption. The team supplemented the University of Hawaii Hilo’s (UHH) sUAS capabilities, allowing UHH sUAS operators to focus on geographical and volcanology.
The CRASAR team identified a new fissure not visible from the ground, projected the lava flow rate during the night when manned helicopters were not allowed to fly, and provided ongoing data collection from new thermal sensors technology.
During the six-day Leilani deployment, the CRASAR team flew 44 sUAS flights, including 16 at night, using DJI 200, 210, Inspire, and Mavic Pro drones. Esri’s Drone2Map for ArcGIS together with Hangar’s Enterprise Platform for 360-degree imaging enabled rapid 360-imaging for situational awareness.
DJI’s new XT2 thermal sensor provided unprecedented drone-based air-quality monitoring. Video and data were shared with local first responders using FirstNet, the first high-speed, nationwide wireless broadband network dedicated to public safety.
The CRASAR response marks the first known use of sUAS for emergency response to a volcanic eruption and first known use of sUAS for sampling air quality.
The GIS mapping and imaging technologies responders used on the scene at Kilauea Volcano Lower East Rift Zone are available here.
Looking southwest towards Leilani Estates with Fissure 8 erupting in the background. (Image: Ron Chapple/GEO 1)
High-resolution lidar surveys help first responders, scientists and government agencies monitor Kilauea conditions and predict future lava flows.
Independent geospatial data firm Quantum Spatial Inc. (QSI) has conducted high-resolution lidar surveys of areas surrounding the Kilauea volcano eruption in Hawaii.
The emergency response effort was part of the U.S. Geological Survey’s (USGS) Rapid Response Imagery Products (RRIP) in support of the Kilauea’s 2018 East Rift Zone – Remote Sensing Acquisition Requirement.
The USGS Hawaiian Volcano Observatory (HVO), along with emergency responders, government agencies and academics, will use the data to better understand the conditions and characteristics of the Kilauea volcano, which has been continually erupting since May 3.
Data also will assist planners in modeling potential lava flows, which may better predict and respond to future flows and enhance safety of residents.
The USGS National Geospatial Program (NGP) selected QSI to perform the first of two planned surveys over the active volcanic area. The QSI team, which included GEO1 and Windward Aviation, deployed within days to acquire high-resolution lidar at point densities averaging from 40 to 80 ppsm, with up to 150 ppsm in select areas and 100-mp digital imagery using a Riegl dual VUX-1 LR sensor pod equipped with ABGPS/IMU mounted on a Hughes 500D helicopter.
Five distinct locations, covering an area of 57 square miles, were targeted:
Kīlauea Summit Caldera
Pu’u O’o Crater and flow
Chain of Craters Road / Kaoe
Puna Geothermal Venture (PGV)
Western Leilani Estates lava field.
The project required 11 missions over the course of six days, operating at times as low as 500 feet above the ground and above active flows and nearby erupting calderas. With a need for a quick turn around, QSI deployed an analyst with the flight crew to post process each mission within hours of collection.
The data was uploaded to the Geospatial Repository and Data Management System (GRiD) interface, developed by the U.S. Army Corps of Engineers (USACE), where additional data products have been developed and provided to the response team that includes FEMA, Hawaii’s Emergency Operations Center (EOC) and the Hawaii County Civil Defense.
After data collection, QSI measured topographic shifts during the processing by comparing new data with a 2011 lidar collection from the same area. Survey specialists and USGS experts confirmed within hours of processing QSI’s lidar data that areas within the site had shifted up to 1.5 meters east, 2 meters to the north and 1 meter in elevation.
USGS scientists will continue to examine the new topographic data to better understand the nature of these shifts, and integrate it into lava flow models for more accurate predictive modeling.
“Airborne lidar and imagery remote sensing surveys are invaluable tools for understanding the effects of active volcanic eruptions, which change the topography as fissures emerge and lava flows extend to the ocean,” said Michael Shillenn, vice president at QSI. “We were honored to work with the USGS and others on this critical project. We believe that data and analysis provided by the QSI team will provide insights into future scenarios, enabling emergency responders to protect the surrounding community.”