Ten years ago, scientists watching the skies experienced a Halloween fright of cosmic proportions, when space weather degraded GPS signals, affecting land and ocean surveys, and commercial and military aircraft navigation.
The most extreme of what became known as the Halloween Storms hit on October 30, 2003 — ten years ago today. According to the National Oceanic and Atmospheric Agency, the Earth could experience a repeat performance this Halloween, with a 35 percent chance of a major storm at high latitudes.
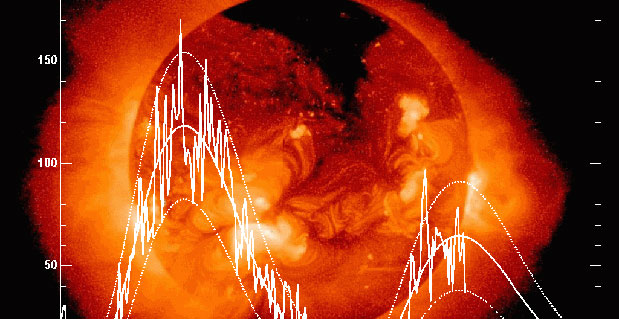
In mid-October 2003, a bundle of concentrated magnetic energy emerged from the Sun’s interior, forming a large sunspot, a site of seething activity. Enormous solar flares soon followed.
Then, on October 28, the sunspot abruptly ejected a concentrated mass of electrically conducting solar wind, flinging it out into interplanetary space toward the Earth. Less than a day later, on October 29, a geomagnetic storm was initiated as the solar wind disrupted the Earth’s protective magnetosphere.
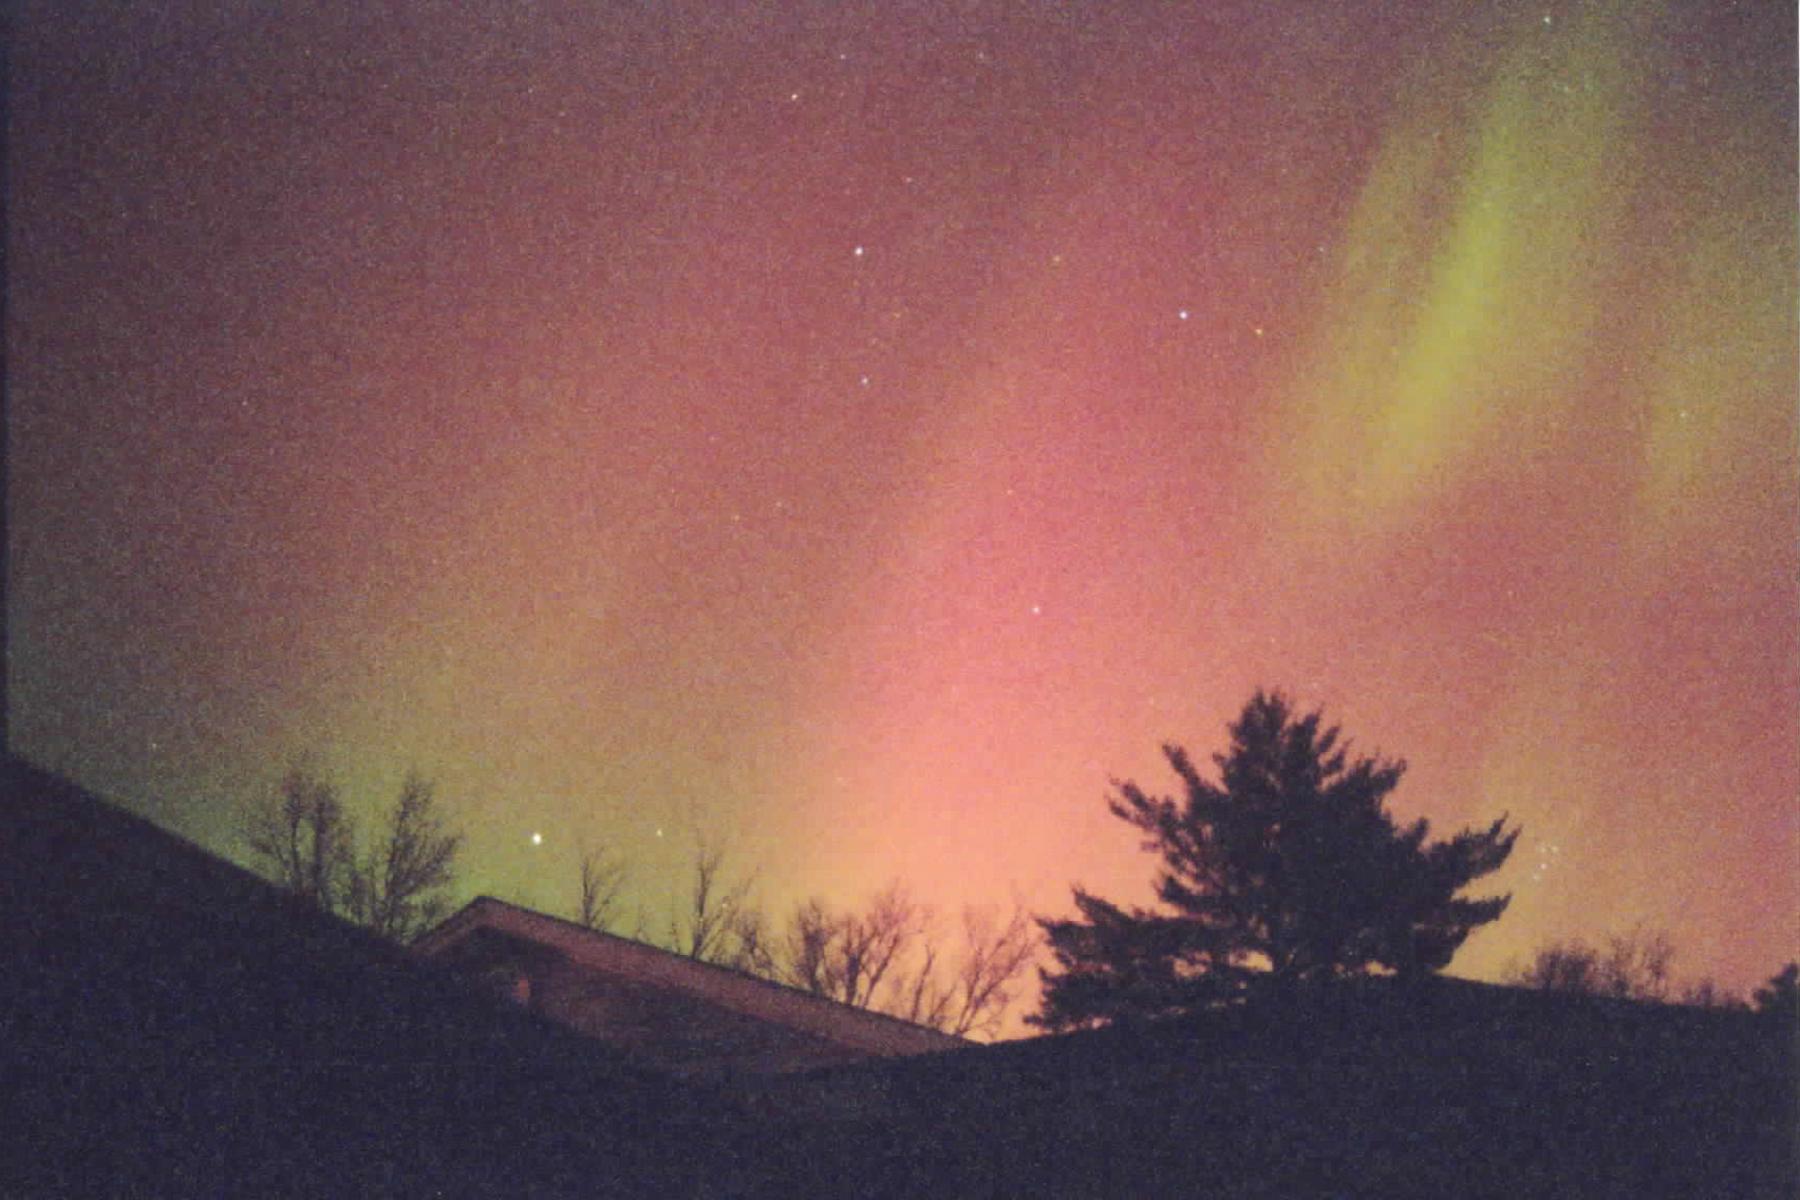
Over the next three days, the “Halloween magnetic storm” would evolve and grow to become one of the largest such storms in half a century. Magnetic storms are global phenomena, and their effects can be easily seen around the world. During the Halloween storm, for example, magnetic direction in Alaska quickly changed by more than 20 degrees. In other words, the storm was so large that it could be measured with a simple compass. The Halloween magnetic storm also produced spectacular aurora, with green phantom “northern lights” seen as far south as Texas and Florida.
“The aurora was exciting,” said Richard Langley, GPS World’s Innovation editor. “I’ve never seen a better one since.”
This full-sky aurora was observed near Fredericton, New Brunswick, Canada (46 degrees north latitude) on October 30, 2003. (Photo courtesy of Richard Langley.)
Langley explained the effect of the phenomenon in his introduction to the October 2004 Innovation article, “Combating the Perfect Storm: Improving Marine Differential GPS Accuracy with a Wide-Area Network.”
It was previously thought that the mid-latitude North American ionosphere was reasonably benign, with minimal storm effects of relevance for marine DGPS users. However, during ionospheric storms in May and October, 2003, [single-frequency] marine DGPS horizontal position accuracies were degraded by factors of 10–30.These degraded accuracies persisted for hours and were well beyond system tolerances specified for marine DGPS users. Such ionospheric activity is not unusual during the years following solar maximum, and is expected to persist for several years.
Langley provides background on what scientists learned from the Halloween Storms in his February 2011 Innovation column, “GNSS and the Ionosphere: What’s in Store for the Next Solar Maximum?”:
The current solar cycle is referred to as cycle 24. During the last solar cycle, cycle 23, the GNSS community was alert and aware of what could happen, and therefore many events were observed and analyzed. Among the most well-known events is a sequence of storms during October and November 2003, commonly referred to as the Halloween Storms.
The most extreme was the storm on October 30, 2003, which resulted from a CME on October 29 at 20:49 UTC, which subsequently impacted Earth’s magnetic field at 16:20 UTC on October 30 and produced a great geomagnetic storm, which lasted for many hours.
Effects on GPS positioning of this storm have been documented by the GNSS research group of the Royal Observatory of Belgium, where kinematic analyses of data from 36 GNSS stations in Europe showed position errors of more than 10 centimeters in the horizontal and up to 26 centimeters in the vertical between 21:00 and 22:00 UTC on October 30. The position errors were largest for locations in northern Europe including Sweden and Norway. The data analysis was carried out using high-quality carrier-phase data, and the processing was based on using an ionosphere-free linear combination of observations from the L1 and L2 frequencies, whereby the first-order effect of the ionosphere is removed from the results. The position errors are thus caused by mainly higher order ionospheric effects.
For navigation-grade GPS positioning, a U.S. National Atmospheric and Oceanic Administration technical memorandum reported that the Wide Area Augmentation System (WAAS) vertical error limit of 50 meters was exceeded for a period of about 11 hours on October 30, 2003. This means that, in practice, WAAS was not available for precision aircraft approaches during that time. The European Geostationary Navigation Overlay Service (EGNOS) was not transmitting during the storm, but simulations carried out later by ESA showed that the boundary regions of the EGNOS coverage area would have been especially affected by a reduction in service availability of about 20–60 percent during that day.
The simulations also showed, however, that in the center of the EGNOS coverage area (in the vicinity of northern Italy), the effect would have been much smaller with a reduction in service availability of only 5–6 percent over the day.
Such large storms are also often accompanied by displays of aurora (aurora borealis and aurora australis) at lower latitudes than normal.
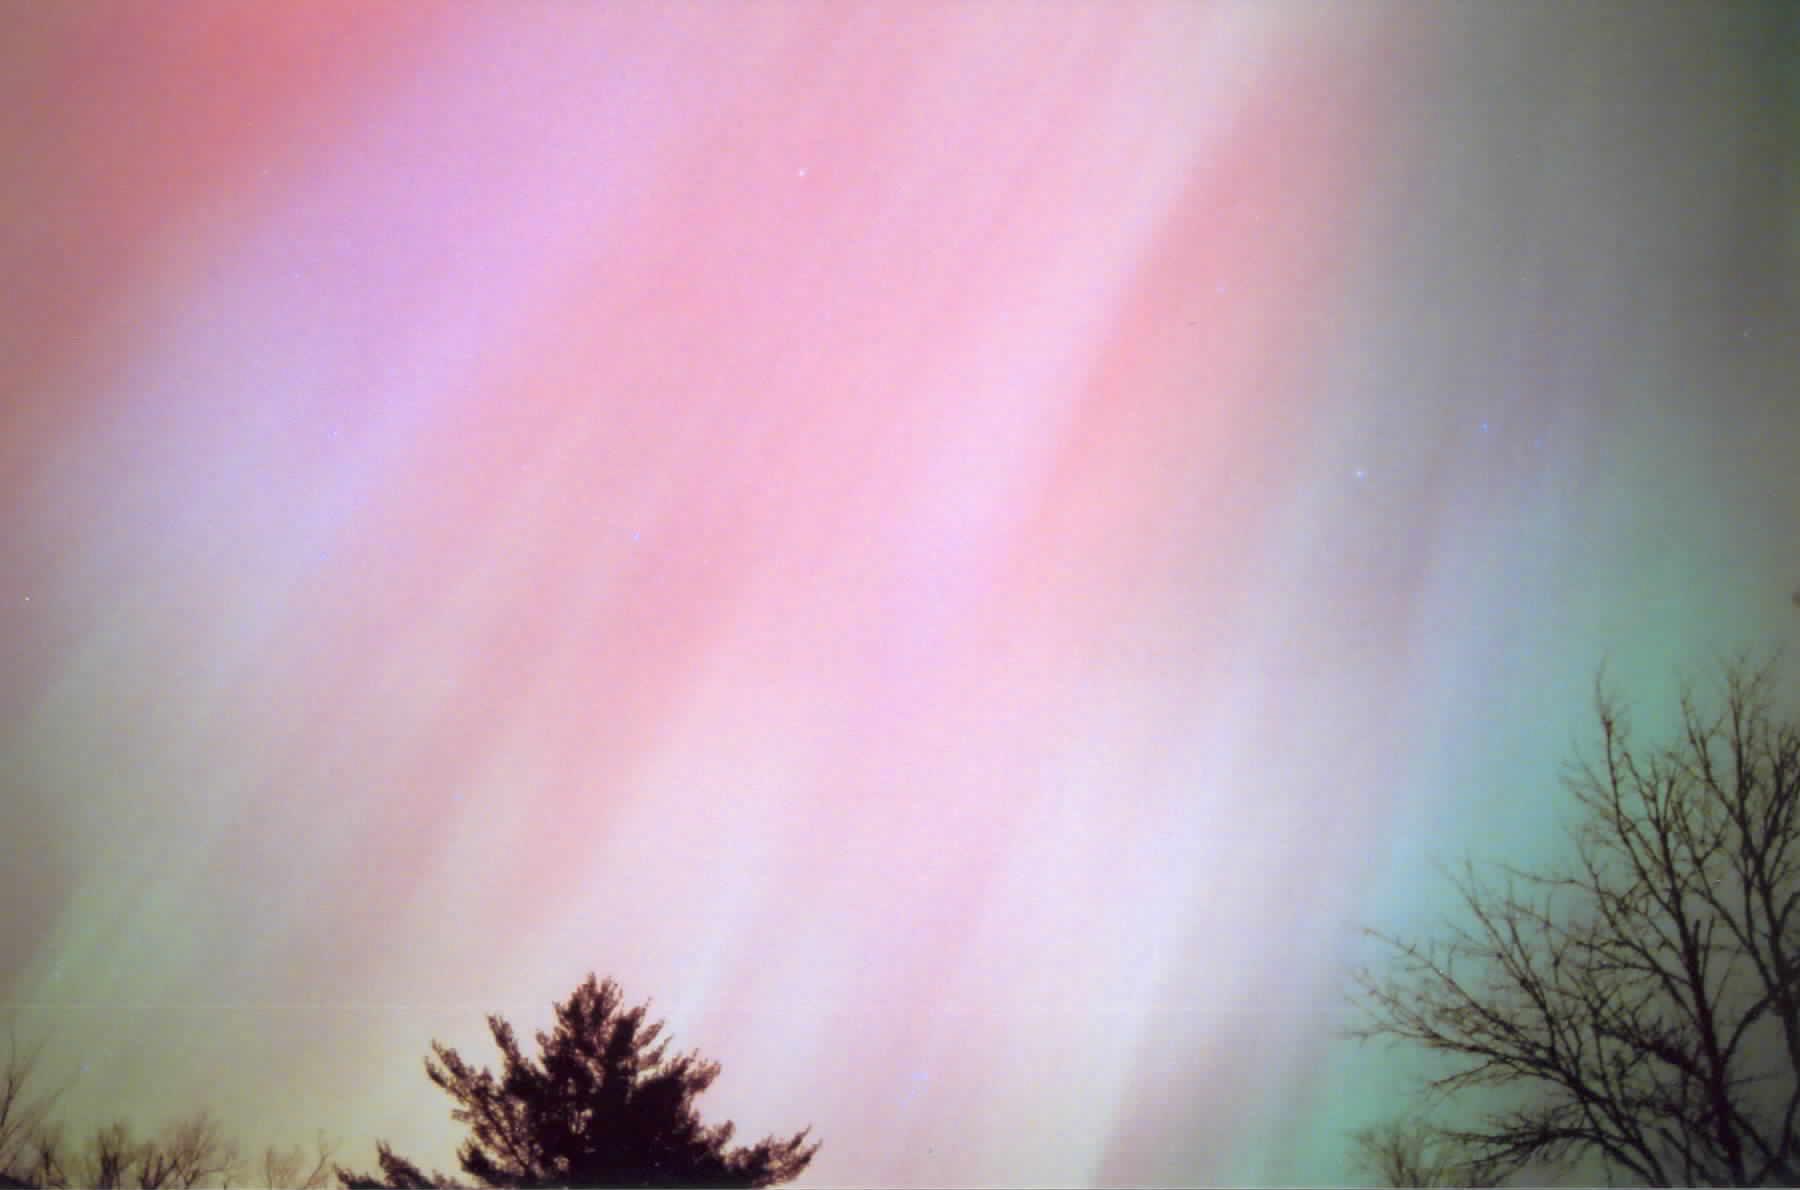
Another shot of the Halloween 2003 aurora, as seen near Fredericton, New Brunswick. (Photo courtesy of Richard Langley)
Other Innovation columns assessing the ionosphere’s effect on GPS include:
On October 1, 2013, the U.S. federal government shut down and furloughed 800,000 non-essential workers. While services considered essential remained active, those considered non-essential services, like the National Geodetic Survey’s Online Positioning User Service (OPUS), were shutdown. OPUS is a free, online GPS post-processing service. If you try to access www.ngs.noaa.gov, the following screen will be displayed:
Photo: NOAA
For those of you who rely on OPUS for GPS post-processing, now is a great time to try one of the other seven online post-processing services available and not subject to the U.S. federal government. Yes! I wrote seven, and the results from those seven are comparable to OPUS. The other seven, free online GPS post-processing services are:
CSRS-PPP: Canadian Spatial Reference System, Natural Resources Canada
My colleague Mark Silver, creator of the X90-OPUS receiver I wrote about a few months ago, embarked on an effort to run test data through each of the online post-processing services to demonstrate that there are free, online GPS post-processing services available worldwide that produce results comparable to OPUS. The following report is the result of his efforts:
A Comparison of Free GPS Online Post-Processing Services
By Mark Silver
You are probably familiar with the National Geodetic Survey’s OPUS suite of online post processing tools (OPUS-Static, OPUS-Rapid Static and OPUS-Projects.) These services are capable of producing centimeter-level positioning from static GPS observations. What you may not realize is there are at least six viable alternatives to OPUS.
All are free, easy to use, provide world-wide coverage, and generate surprisingly similar results.
Since each uses a unique baseline tool and processing strategies they form an excellent reality check against each other.
IGS orbits and the IGS permanent CORS arrays are used by many of the services, however some use proprietary equipment arrays and orbit products that provide additional redundancy.
How comparable are these services? Which one is the best?
Criteria for Comparing
Comparing results is a difficult proposition:
The true/correct answer for any site is unknown.
What grading scale should be used? Should elevation differences be weighted differently than horizontal differences?
Should the peak-to-peak range or the standard-deviation be prized?
Should comparisons be made on long 24-hour data sets or short 2-hour occupations?
Is a single data set sufficient for a meaningful comparison or are multiple data sets preferable?
Should a service be ‘thrown out’ of consideration because the solutions are substantially different from the mean?
The answer to all of these questions is “it depends.” Your evaluation will depend on your specific application.
For this evaluation, the following rules governed the data set selection:
Choose a site known to be stable with a clean EMI environment.
Use 24-hour observation sets to enable ‘best case’ processing.
Use a sufficiently large data set, 32-consecutive days, to expose trends.
Choose a time period, 90-days in the past, so precise orbits are available to reduce ephemeris effects.
Only consider GPS data.
Use default settings for every option on each processing service.
Scoring
This would not be as interesting without a little competition.
To keep the evaluation simple, the sum of the X, Y and Height range will be the score and the services will be ranked from lowest score to highest score, with the low score being the ‘best.’
Range was chosen as an indicator of the expected maximum error that might be encountered if only a single 24-hour file was observed.
The combined range rewards a processing scheme that best estimates delays, interference, clock errors and other sources of change that occurred during the 32-day trial.
Remember that the every aspect of this ‘competition’ is arbitrary: from the selection of observation sets, to the final scoring system.
The real take-away from this evaluation is not that one service is better, but how close all of the services are to each other.
Two services (JPS’s APPS, magicGNSS) won’t be acceptable to the average user and a third (RTX Centerpoint) may not work for some users based on receiver and antenna support. Details of these problems are presented with the service descriptions below.
The Test Data
SGU1 in St. George, UT USA was chosen as the observation base. The observations consist of 32 consecutive days (May 3, 2013 through June 3, 2013), 24-hour observation files, 30-second interval, GPS only data. The data files were downloaded from the NGS CORS archive.
Each of the 32 files were submitted to each of the processing services and the results have been tabulated for X, Y and Ellipsoid Height. All data is presented in IGS08 current epoch framed coordinates. All data has been projected to UTM Meters for these comparisons.
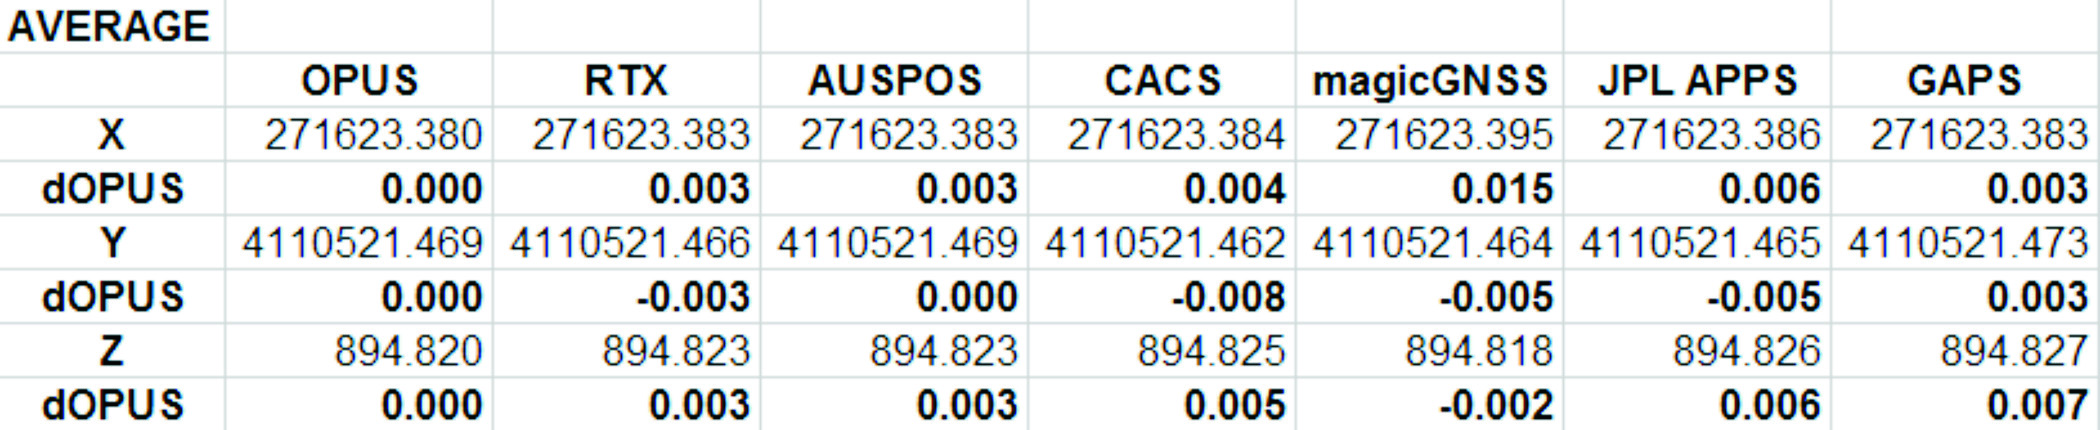
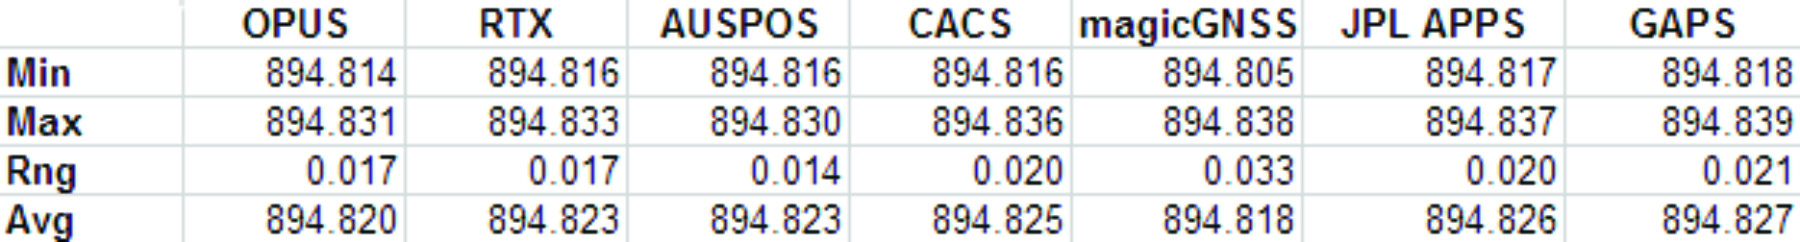
The Average Values
Remember, the real story is how close each of these services produce results to one another. Let’s look at the average positions from each service and the difference from OPUS:
Fig 1: Average Solution Difference from OPUS
As you can see in Figure 1 above, the services were generally within 5mm of OPUS in X, Y and Height.
Position Tracking vs. Time
Fig 2: Service Results X vs. Time
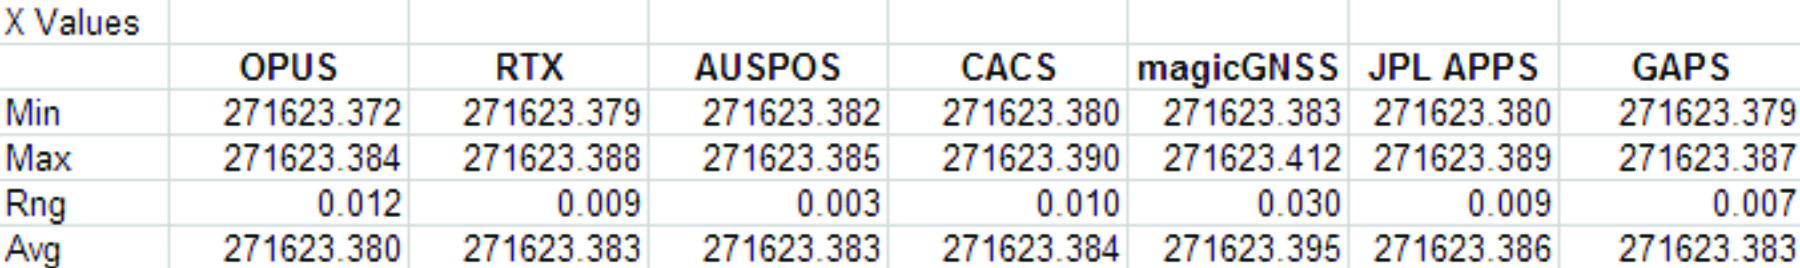
Fig 3: Service Results X Range, Average
Fig 4: Service Results vs. Time
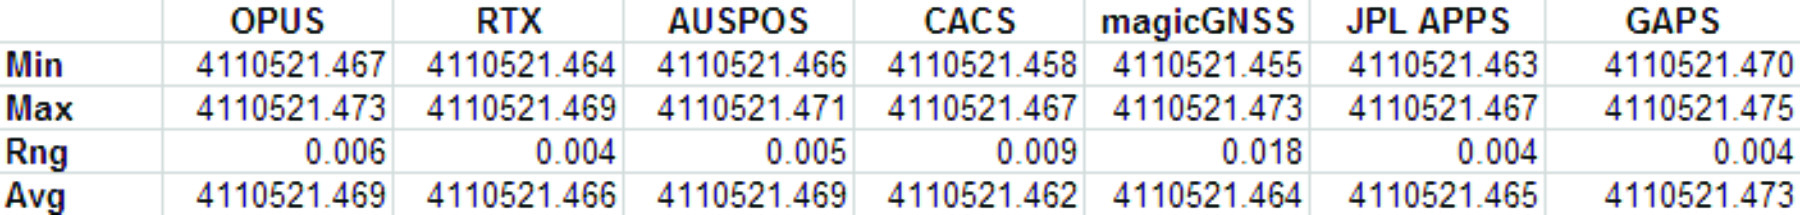
Fig 5: Service Results Y Range, Average
Fig 6: Service Results Z vs. Time
Fig 7: Service Results Z vs. Time
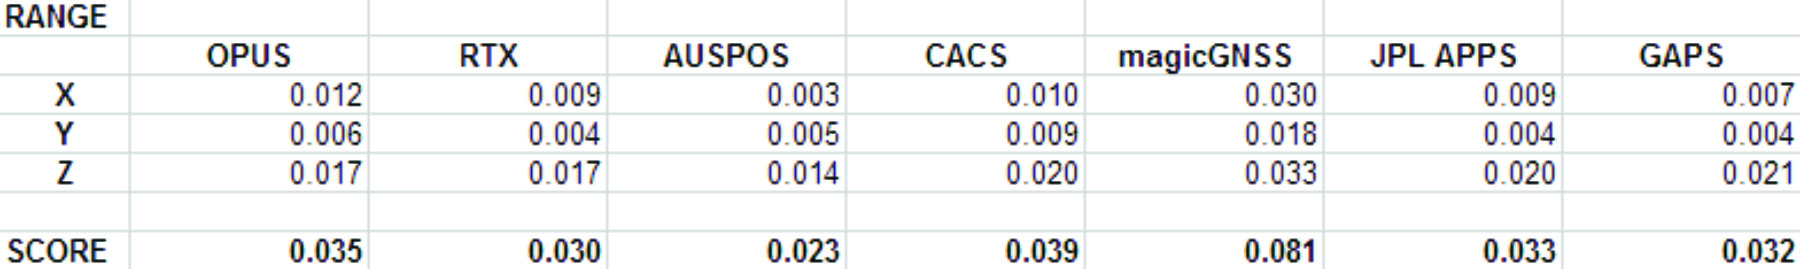
And the Winner Is…
Following are the scores, based on the combination of X, Y and Height range:
Fig 8: The Scores
Score ranking (remember this is just for fun as the services provided remarkably similar results):
AUSPOS
CenterPointRTX
GAPS
APPS
OPUS
CSRS-PPP
magicGNSS
There is a significant issue in the JPL APPS’s reported output positions, which will keep it from being of any use to most users. magicGNSS’s results are significantly different than the other services. User’s should independently evaluate magicGNSS’s suitability for their purpose. SOPAC’s SCOUT could not be evaluated because it patently does not support either the receiver or antenna that was used at the test site.
AUSPOS is a free service from Geoscience Australia. Access is via a simple web interface, the antenna height and type are entered along with a email address for the returned report set. File submission is via FTP or directly from the web interface.
The returned PDF report is the best looking of the reviewed services and includes a Processing Summary showing a map of the CORS sites that were used in the solution. SINEX files are also available.
AUSPOS uses the Bernese GNSS Software for processing baselines, IGS orbits and IGS network stations. Solutions are available for anywhere on the earth.
RINEX files need to be at least 1-hour in length, 6-hour files are recommended. Compact RINEX files are also accepted. Files may be compressed with UNIX, Hatanaka, ZIP, gzip or bzip compression.
Centerpoint RTX Post Processing: Trimble Navigation Limited
CenterPoint RTX Post Processing is a free service offered by Trimble.
It works anywhere in the world and is based on a proprietary Trimble 100+ worldwide CORS network. Accuracy is 2 cm with 1-hour of observation data; 1 cm with 24-hours. Files longer than 24-hours are not accepted.
RTX uses GPS, GLONASS and QZSS tracked SV’s.
The reported output frames include ITRF2008 at current epoch and a user selectable frame like NAD83/2011 2010.0. RTX is one of the few services that will directly export NAD83 framed results.
A single page PDF and a XML result file are returned by RTX. Unfortunately, it is not possible to copy numerical results from the read-only PDF result file to the clipboard.
RTX supports a limited number of receivers (Trimble, Ashtech, Javad, some Leica, some Topcon) and a relatively small subset of IGS modeled antennas. For this test, TEQC was used to stuff the RINEX headers with a comparable Trimble receiver to the actual Ashtech ProFlex 500 receiver that is in use at SGU1. This was all that was required to spoof an accepted device. If the antenna had not been listed, it would have been necessary to spoof the antenna and adjust the height to reflect the difference in L1 phase center offset.
GAPS is an ongoing project at the University of New Brunswick and was developed by the Department of Geodesy and Geomatics Engineering.
File submission is by a web page and GAPS provides a large number of user inputs and potentially allows the highest level of customization of any of the reviewed services:
You may enter a priori coordinates, and a priori constraints
GAPS accepts static or kinematic files
You can set the elevation mask
The Neutral Atmosphere Delay model is selectable
Earth Body Tides and Ocean Tidal Loading can be applied or disabled
GAPS only processes GPS data (no GLONASS.)
Submitted filenames must adhere to the SSSSDDDh.YYt file format. GAPS accepts RINEX and compact RINEX files, they may optionally be gzip, unix compressed or ZIP compressed.
WARNING! APPS only reports the derived position to the nearest decimeter-meter in geographic (lat/lon) coordinates, while reporting ECEF coordinates to a fraction of a millimeter. If you choose to use APPS, you will need to manually convert the ECEF XYZ to geographic coordinates.
JPL’s APPS is based on GIPSY-OASIS (currently version 5). APPS uses NASA’s 70+ Global GPS Network plus densification from other systems (100+ total receivers distributed globally.) Solutions are typically available with 5 seconds delay from observation.
APPS is easy to use, you just specify a file to upload and then click on ‘Upload’ it takes only 15 seconds to get a result after the file upload is complete. You can optionally register for a free account and use email or FTP for bulk uploads.
APPS also has receiver Live Performance Monitoring: (http://www.gdgps.net/monitoring/index.html) which generates a real time graph of three receivers spread through the world.
Before using CSRS-PPP, you will need to register for a free user account.
CSRS has a fantastic desktop application named PPP-Direct that you can just drag and drop files onto. PPP-Direct automatically submits the file and saves all typing, greatly reducing the chance of error.
CSRS-PPP uses both GPS and GLONASS (if available) observables. Ocean Title Loading corrections can be overridden.
CSRS-PPP will accept single frequency files for processing. CSRS will accept RINEX and Compact RINEX, and will decode ZIP, GZIP and unix compression formats.
CSRS-PPP has a fantastic PDF report, a .csv file detailing results epoch by epoch and a great machine readable summary file.
The desktop submission tool, coupled with the great output reports made CSRS-PPP my favorite tool.
magicGNSS accepts emailed files and returns solutions by email. Turnaround time is fast and features a nice PDF report plus SINEX, receiver clock bias files, tropospheric delay, KML trajectory and RINEX CLK clock bias files.
Static and kinematic files with observations from GPS, GLONASS are processed by magicGNSS and the service reportedly Galileo-ready.
magicGNSS uses a subset of IGS stations to provide core coverage.
SCOUT: Scripps Orbit and Permanent Array Center (SOPAC). University of California, San Diego
Scout accepts RINEX and compact RINEX files, compressed (Z, gz, ZIP) submitted from an FTP site or pushed onto a provided FTP server.
Files must be generated on a limited subset of receivers and antennas. While the IGS antenna and receiver files are the basis for acceptable devices, not all IGS-listed devices are on the allowable device list. SCOUT documentation specifically warns against spoofing devices and antennas.
SCOUT uses the GAMIT processing engine.
Because the test data for this article is from a unsupported receiver and the submittal process requires a FTP host server with anonymous access which most users will not bother with, the output from SCOUT was not evaluated.
Conclusion
The similarity of results between all of the services I processed is amazing. That they differ only by millimeters demonstrates the robustness of the algorithms and processes they use.
The difference between AUSPOS, RTX, GAPS, OPUS and CSRS-PPP solutions are negligible. For important positioning projects, it undoubtedly makes sense to use them all.
For locations in the United States, OPUS and RTX return NAD83-2011 framed results. Only OPUS returns derived orthometric heights using GEOID12A. While OPUS has more provenance than the other services, it is easy enough to submit important observations to multiple services as a reality check for important positions.
###
As you read from Mark’s report above, even though OPUS is shut down until the U.S. Congress can resolve its differences, don’t let that stop you from processing your GPS static sessions. However, some level of due diligence on your part is needed as requirements vary for each service. For example, static sessions for the OPUS-RS service can be as short as 15 minutes while other services require two hour GPS static sessions. Furthermore, some services process GPS L1 data while others require both GPS L1 and GPS L2 observations.
NOAA’s National Geodetic Survey (NGS) is conducting a 12-year project, called Gravity for the Redefinition of the American Vertical Datum (GRAV-D), to redefine the vertical datum of the United States by flying airborne gravity missions. The accuracy of the resulting vertical datum depends directly on the quality of the aircraft’s GNSS position solutions.
In August 2010, NGS issued a Kinematic GPS Challenge to seek community input on the best practices for processing this large positioning data volume. Ten international groups answered the call, submitting 16 different position solutions calculated with a variety of software and techniques. However, the majority of solutions were corrupted by a characteristic “sawtooth” pattern which was tracked back to the aircraft receiver used in the initial challenge; for this challenge reissue, a second onboard GNSS receiver is used. Also in this new call for participation, inertial measurement unit (IMU) data are made available for joint GPS+IMU processing.
“To further facilitate our software and method development, we invite interested researchers and practitioners to compute and submit solutions from samples of actual GRAV-D data,” said Gerry Mader and Theresa Diehl, NGS, in an invitation email. “In this new call, NGS requests that all participants submit a GPS-only solution utilizing the new aircraft GPS data. For those able to process with IMU data, we request additional submission of a second IMU+GPS solution. NGS would like to receive all solutions by April 1, 2013.
“This is a strictly voluntary exercise for those interested in such a comparison and we will share our results with the participants. We are also interested in possibly co-authoring a publication with the participants on the topic if results are significant.”
Detailed information on the challenge is available here:
Those interested in participating should read through the PDF (link above), then email Gerry Mader (gerald.l.mader at noaa.gov) and Theresa Diehl (theresa.diehl at noaa.gov) with any questions.
The National Oceanic and Atmospheric Administration (NOAA) announced that effective Wednesday, July 25, 2012, at 1600 UTC (10:00 AM MDT), the Space Weather Prediction Center (SWPC) will modernize its geomagnetic storm watch products. These products will now be issued relative to the highest expected geomagnetic storm category (NOAA Scale) and will be based on the 3-hour geomagnetic K-index rather than the 24-hour A-index.
According to the announcement, SWPC watch products will still be valid for the entire UTC day, just as they are under the A-based watches today. This change will better align SWPC's geomagnetic watch products with its geomagnetic warning and alert products and NOAA Scale designations. Product Subscription Service customers are not required to take any action regarding this change. The current A-based watches contain expected geomagnetic storm scale (G-level) information so all subscriptions will be automatically transferred to the new G-based watch products.
Four years ago my wife and I moved to Lake Guntersville as our ultimate retirement location because it seemed to have ideal factors we were looking for — mountains, lakes, great fishing, mild weather, low taxes, low cost of living and genuinely nice people. This inland location had navigable water to the Gulf of Mexico and even to the Great Lakes. We liked the small town atmosphere away from coastal hurricanes, panicky road clogging evacuations, blizzard, earthquakes or big tornadoes. Well, so much for that plan as we had a front row seat to one of the biggest tornado events of the decade with one of the tornadoes passing 500 yards in front of our windows.
Just like in the movies, on Wednesday morning, April 27, the winds started to pick up, tornado alarms sounded, and debris started flying, including outdoor furniture. The boathouse next to us had the shingles stripped off the roof like a deck of cards, and then big oak trees started toppling over. The lake looked like it was boiling violently as winds in Guntersville reached 130 mph. We could see countless power lines and transformers arcing green and then going dead. Many buildings and trees were okay while others were totally demolished.
Downed trees caused much of the damage.
My visual estimate was that at least 10 percent of the power poles and lines were damaged or toppled. It’s now six days after the storm. Although utility crews have been busy putting in new poles and lines, much remains to be done and I’m doing this article on battery power from my car charger.
This tornado event was unusual in that Alabama rarely gets more than one tornado at a time with most being the smaller F-1/F-2 storms. Tuscaloosa got the worst of it with an F-4 that stayed on the ground for 70 miles.
Concrete block walls were no match for the 130 MPH winds.This was a TV repair shop in downtown Guntersville.
Our county, Marshall County, was lucky with only 10 tornadoes during the 8 hour period. I don’t think any were over an F-2 but Marshall County still had 5 fatalities. Alabama had over 200 tornadoes that day with fatalities nearing 300.
One thing that really impressed me about the people in Alabama is their resilience and willingness to help their neighbors. There was no hand wringing waiting for the government to help. Almost immediately after the first tornado you could hear the sound of chainsaws as neighbor helped neighbor dig out and clear the roads. This helped the city and county get most roads passable within a day.
People helping people.
Local businesses helped also. Within 12 hours T.L.’s Barbeque and our favorite seafood restaurant, Crawmama’s, had a catering service set up in downtown Guntersville providing free meals for the National Guard, emergency workers and anyone who needed a hot meal. Crawmama’s is one of those hidden gems that serve seafood comparable to the best restaurants in New Orleans.
After the tornadoes, NOAA captured ortho imagery of the affected areas using a King Air at 5000 ft. The imagery can be seen at the NOAA website. Pictometry is providing low altitude high resolution ortho and oblique imagery and there are stunning video clips of the Tuscaloosa tornado on youTube.
The first tornado came and went so fast that I really didn’t have much time to ponder the event. However the unexpected surprise was news media reports that we could expect numerous tornadoes during the 8 hours following the initial tornado. The tornado alarms sounded again and again throughout the day and I can tell you from first-hand experience that getting through this was much easier thanks to the location based GIS services of my iPhone. Here is why.
When the power was still on we had the luxury of watching the television news with Doppler radar and all the detailed graphics. Once the power went out all we had were tornado alarms, a portable radio and my lowly cell phone. The tornado alarms were nerve racking since they went off so often. I later learned that the alarms are linked county-wide so a tornado threat anywhere in the county will cause all the alarms to sound. Radio stations were helpful but it was difficult to form a clear picture of the moving storms.
The iPhone proved to be wonderful. It continued working even after power was lost so we could communicate with family members. From the first power outage until now the cell phone service continued un-interrupted. The service did slow and show weaker cell tower signals as the system switched to battery power and standby generators. But it did continue to work.
Most important, the iPhone radar mapping application from the Weather Channel provided us with a video loop of weather bands and their path on a Google map so we could see for ourselves how the storms were moving and if we would be affected. This really put our minds at ease most of the time despite numerous tornado alarms. Throughout the day as we dodged other tornadoes, I thought about all the man-hours I and my colleagues spent in the early ’90s digitizing street centerline data and addresses ranges to build the digital street databases and other maps that are now the backbone of location based services.
I never could get really excited about the tiny screens of smart phones but this tornado event and even more mundane applications such as navigation are making me appreciate these little devices. My iPhone has replaced my cell phone, camera, calculator, notepad, and now my GPS. I liked the navigation and Google maps of my iPhone but many times, such as in DC traffic, it was hazardous looking at the screen. So I was very pleasantly surprised with an application that turns the iPhone into a full featured car navigation system including voice navigation and real time traffic. The MotionX GPS Drive is one of the hottest selling applications for the iPhone and I’m a convert. I bought a mounting bracket that lets me mount the iPhone on the AC vent of any rental car and I now don’t bother packing my old GPS. The only downside is that it uses up the iPhone battery so I have a 12v adapter to keep it charged when using navigation.
That little iPhone and GIS keep making my life better. So for all the hand wringers nearly panicked that their iPhone tracks their location and worried about their privacy, my vote is for more and better location-based services.
By David W. Affens, Roy Dreibelbis, James E. Mentall, and George Theodorakos
In 1997, a Canadian government study determined that an improved search and rescue system would be one based on medium-Earth orbit satellites, which can provide full global coverage, can determine beacon location, and would need fewer ground stations. This month’s column examines the architecture of the GPS-based Distress Alerting Satellite System and takes a look at early test results.
INNOVATION INSIGHTS by Richard Langley
IT IS NOT COMMONLY KNOWN that the GPS satellites carry more than just navigation payloads. Beginning with the launch of the sixth Block I satellite in 1980, GPS satellites have carried sensors for the detection of nuclear weapons detonations to help monitor compliance with the Non-Proliferation Treaty. The payload is known as the Nuclear Detonation (NUDET) Detection System (NDS) and is jointly supported by the U.S. Air Force and the Department of Energy.
And now a third task is being assigned to the GPS satellites — that of search and rescue. Since the mid-1980s, a combination of low Earth orbit (LEO) and geostationary orbit (GEO) satellites have been used to detect and locate radio beacons activated by mariners, aviators, and others in distress virtually anywhere in the world and at any time. Some 28,000 lives have been saved worldwide since the search and rescue satellite-aided tracking, or SARSAT, system was implemented.
But the current system has some drawbacks. LEO satellites can determine a beacon’s position using the Doppler effect but their field-of-view is limited and one of them may not be in range when a beacon is activated. Furthermore, a large number of ground stations is needed to relay data from these satellites to search and rescue authorities. GEO satellites, on the other hand, have a large field of view (although missing parts of the Arctic and Antarctic), but they cannot position a beacon unless its signal contains location information provided by an integral satellite navigation receiver.
In 1997, a Canadian government study determined that a better SARSAT system would be one based on medium Earth orbit (MEO) satellites. A MEO system can provide full global coverage, determine beacon location, and do this with fewer ground stations. GPS was identified as the ideal MEO constellation.
And so was born the Distress Alerting Satellite System (DASS) that will become fully operational on Block III satellites. But already nine GPS satellites are hosting prototype hardware that is being used for proof-of-concept testing.
In this month’s column, we examine the architecture of DASS (including its relationship with the NDS), and take a look at some of the very positive test results already obtained — results that support the claim that DASS will take the search out of search and rescue.
NASA, which pioneered the technology used for the satellite-aided search and rescue capability that has saved thousands of lives worldwide since its inception nearly three decades ago, has developed new technology that will more quickly identify the locations of people in distress and reduce the risk to rescuers.
The Search and Rescue (SAR) Mission Office at the NASA Goddard Space Flight Center, in collaboration with several government agencies, has developed a next-generation satellite-aided search and rescue system, called the Distress Alerting Satellite System (DASS). NASA, the National Oceanic and Atmospheric Administration (NOAA), the U.S. Air Force, the U.S. Coast Guard, and other agencies are now completing the development and testing of the new system and expect to make it operational in the coming years after a complete constellation of DASS-equipped satellites is launched.
When completed, DASS will be able to almost instantaneously detect and locate distress signals generated by emergency beacons installed on aircraft and maritime vessels or carried by individuals, greatly enhancing the international community’s ability to rescue people in distress, This improved capability is made possible because the satellite-based instruments used to relay the emergency signals will be installed on the GPS satellites.
A recent satellite-aided rescue started on June 10, 2010, when 16-year-old Abby Sunderland on her 40-foot (12.2-meter) sailboat “Wild Eyes” encountered heavy seas approximately 2,000 miles (3,200 kilometers) west of Australia in the Indian Ocean. Her sailboat was dismasted and an emergency situation resulted. Ms. Sunderland activated her two emergency beacons whose signals were picked up by orbiting satellites. Using coordinates derived from the signals, a search plane spotted Ms. Sunderland the next day, and a day later she was rescued by a fishing boat directed to the scene. This highly publicized event is one of thousands of successful rescues made possible by years of NASA research and development.
Background
The beginnings of satellite-aided search and rescue date back to 1970, when a plane carrying two U.S congressmen crashed in a remote region of Alaska. A massive search and rescue effort was mounted, but to this day, no trace of them or their aircraft has ever been found. At the time, search for missing aircraft was conducted by search aircraft flying over thousands of square kilometers hoping to sight the missing aircraft. As a result of this tragedy, Congress recognized this inefficient search method and passed an amendment to the Occupational Safety and Health Act of 1970 requiring most aircraft flying in the United States to carry emergency locator beacons (ELTs) to provide a local homing capability. NASA then developed the technology to detect and locate an ELT from ground stations using the beacon signal relayed by satellites to provide more global coverage. This concept evolved into a highly successful international search and rescue system called COSPAS-SARSAT (COSPAS is an acronym for the Russian words “Cosmicheskaya Sistema Poiska Avariynyh Sudov,” which translates to “Space System for the Search of Vessels in Distress;” SARSAT is an acronym for Search and Rescue Satellite-Aided Tracking). Established by Canada, France, the United States, and the former Soviet Union in 1979, the system has 43 participating countries and has been instrumental in saving more than 28,000 lives worldwide, including 6,400 in the U.S. — all as a result of NASA’s innovations.
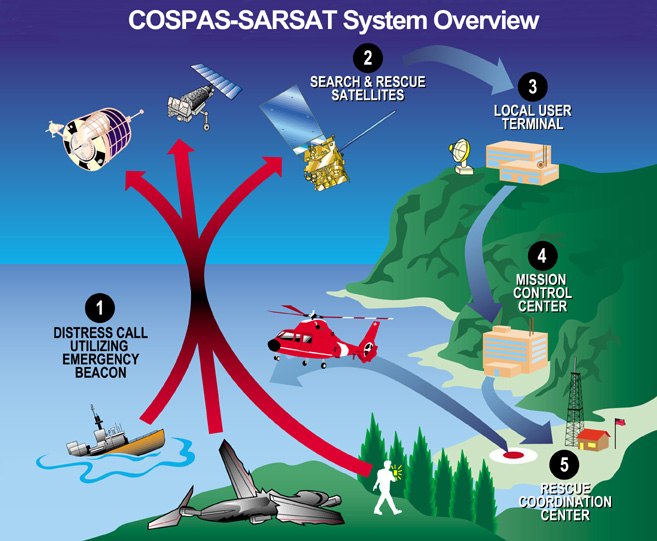
Since this auspicious beginning, NASA has continued to perform SAR research and development as a member of the National Search and Rescue Committee, and supports the National Search and Rescue Plan through an interagency memorandum of understanding with the Coast Guard, the Air Force, and NOAA. NOAA is responsible for operation of the U.S. portion of current COSPAS-SARSAT system that relies on SAR payloads on weather satellites in low-earth and geostationary orbits. As shown in Figure 1, the satellites relay distress signals from emergency beacons to a network of ground stations and ultimately to the U.S. Mission Control Center (USMCC) operated by NOAA. The USMCC distributes the alerts to the appropriate search and rescue authorities: the U.S. Air Force or the Coast Guard. The Air Force coordinates search and rescue for the mainland U.S. SAR region and operates the Air Force Rescue Coordination Center. The Coast Guard performs maritime search and rescue and oversees the U.S. national SAR policy.
FIGURE 1. Overall concept of search and rescue system. (Image: Cospas-Sarsat)
Beacons
Three types of distress emergency locator beacons are in use that are compatible with the COSPAS-SARSAT system:
EPIRBs (emergency position-indicating radio beacons) designed for maritime use.
ELTs (emergency locator transmitters) for use on aircraft.
PLBs (personal locator beacons) for personal use. These can be used by persons engaged in high-risk activities such as mountain climbing and backcountry skiing.
Originally, emergency locator beacons transmitted an analog signal on two frequencies: 121.5 MHz and 243 MHz in the civil and military aeronautical communications bands, respectively, so that they would be audible over aircraft radios. Later, a signal that was encoded with a digital message and transmitted at 406 MHz was added. Since February 1, 2009, only the 406-MHz-encoded signals are relayed by satellites supporting the international COSPAS-SARSAT system. Therefore, older beacons that only transmit the 121.5/243-MHz signals are now only detectable by ground-based receivers and aircraft overflying a crash site.
The 406-MHz beacons transmit an approximately half-second message, or burst, approximately every 50 seconds, beginning 50 seconds after being activated. The actual time of burst transmission is dithered in time so that no two beacons will have all of their bursts coincident. A 406-MHz beacon may also have an integral global navigation satellite system (GNSS) receiver. Such a beacon uses the GNSS receiver to attempt to determine its location for inclusion in the transmitted digital message. In this way, the beacon will be located once it is detected by a low-Earth-orbit (LEO) or geostationary orbit (GEO) satellite.
Distress messages contain information such as:
The beacon’s country of origin.
A unique 15-digit hexadecimal beacon ID.
Location, when equipped with an integrated GNSS receiver.
Whether or not the beacon contains a 121.5-MHz homing signal.
Room for Improvement
SARSAT first became operational in the mid-1980s. The current system uses instruments placed on LEO and GEO weather satellites to detect and locate mariners, aviators, and recreational enthusiasts in distress almost anywhere in the world at anytime and in almost any condition. Previously, dedicated Russian LEO satellites were also implemented but the use of these satellites was discontinued in 2007.
Although it has proven its effectiveness, as evidenced by the number of persons rescued over the system’s lifetime, the current capability does have limitations. LEO spacecraft orbit the Earth 14 times a day and use the Doppler effect with satellite orbital ephemeris data to calculate the position of a beacon. However, a satellite may not be in a position to pick up a distress signal the moment a user activates the beacon. Time is critical in responding to an emergency situation. Unfortunately, delays of two hours or longer are possible, especially near the equator.
LEO spacecraft carry two instruments: a Search and Rescue Repeater (SARR) supplied by the Canadian Department of National Defence, and a Search and Rescue Processor (SARP) provided by the French Centre National d’Etudes Spatiales (CNES). The SARR is a pure repeater, which relays the beacon signal to a local ground station where the data is analyzed to obtain a location. The SARP processes the received beacon signal by measuring the Doppler shift as a function of time, and decoding the digital message included in the 406-MHz signal. This information is stored until it can be transmitted to a ground station using the SARR’s downlink transmitter. Under most conditions beacon locations can be determined to within a radius of 5 kilometers.
Geostationary weather satellites, on the other hand, orbit above the Earth in a fixed location over the equator. Although they do provide continuous visibility of much of the Earth, they cannot independently locate a beacon unless it contains a GNSS receiver that determines its position and includes it in the beacon’s digital message. Currently, not all beacons contain integral GNSS receivers. Furthermore, even if a beacon contains a GNSS receiver, the navigation signal may be obstructed by terrain or thick foliage.
The next-generation system, DASS, overcomes these limitations and will improve accuracy and response time to provide an even more capable life-saving system.
Distress Alerting Satellite System
A 1997 Canadian government study of possible alternative satellite systems for SARSAT, including commercial sources, determined that the ideal system is based on medium Earth orbit (MEO) satellites. A MEO system will be able to provide superior global detection and location data with fewer ground stations than the existing COSPAS-SARSAT system. The GPS constellation was identified as an ideal MEO platform.
The concept of the DASS system is straightforward. Three or more antennas track different GPS satellites equipped with search and rescue repeaters that receive the distress signal and retransmit the signal to the ground. Since each satellite is in a different orbit, each received signal has a different Doppler-shifted arrival frequency and time of arrival. Knowing the position and orbit of each satellite, it is possible to determine the position of the distress beacon.
Future improvement in location accuracy is made possible by one of the strengths of the DASS space segment. That is, the DASS location algorithm optimizes location accuracy utilizing time and frequency measurements of beacon signals that were not designed for that purpose. The DASS space segment allows for the beacon signal to be modified in the future, enhancing the performance of this type of location process.
Other advantages of DASS over the existing system are fairly obvious. Reception of the emergency signal is immediate. Locations can be determined after receiving a single beacon burst since it does not rely on measuring the Doppler shift over time to determine position, as in the current LEO system. A full constellation of DASS-equipped GPS satellites in orbit will ensure that four or more satellites are in view of the transmitting emergency beacon anywhere in the world while requiring fewer ground stations.
Another key strength of the DASS system is the promise of SARSAT transponders on each satellite in the large and well-managed GPS constellation. There are at least 24 GPS active satellites in orbit at any given time (currently, 31 are active). When the GPS constellation is fully populated by satellites with DASS transponders, it will provide global coverage for satellite-supported search and rescue and provide capabilities for rapid detection and location of distress beacons.
Efforts are ongoing to integrate a satellite beacon repeater instrument, to be provided by the Canadian government, onto the GPS Block III B and C satellites to provide the DASS space segment for operational use.
DASS Development
DASS development will proceed in phases referred to as the definition and development, proof of concept, demonstration and evaluation, initial operating capability, and final operating capability. The proof of concept (POC) phase was completed in January 2009. The POC testing and results are summarized in this article. At the time of this writing, preparations are ongoing to initiate the demonstration and evaluation phase.
Definition and Development. In 2000, as part of the definition and development phase, the NASA GSFC SAR Mission Office began discussions with the Department of Energy’s Sandia National Laboratories (SNL) to determine if it would be feasible to add a SAR repeater function to a Department of Energy (DOE) instrument on GPS satellites. Sandia representatives thought it possible, and NASA agreed to fund a study to determine if, with minor modification, one could include a search and rescue repeater function to their instrument. The SNL feasibility study concluded that the GPS DOE package could, with minor modifications, perform the SAR mission. The study also determined that accurate locations could be calculated after a single beacon transmission and improved with each subsequent beacon transmission. Based on this information, NASA, with the cooperation of the U.S. Air Force Space Command and SNL, proceeded with the development of the new space-based search and rescue system, which was named the Distress Alerting Satellite System.
Proof of Concept. In 2003, a memorandum of agreement (MOA) between NASA, NOAA, the Air Force, the Coast Guard, and the Department of Energy tasked NASA to perform a POC program for DASS. The MOA included the development of a POC space segment and a prototype ground station to perform post-launch checkout, performance testing, and implementation planning of an operational DASS system. It stressed the need for DASS, gave authority to each participating agency to participate in the POC demonstration, and defined the roles of each.
The Air Force Space Command approved the addition of modified equipment on GPS satellites. The DASS POC space segment operates as a subcomponent of GPS Block IIR and IIF satellites. Nine GPS Block IIR satellites carry experimental DASS payloads, and all 12 IIF satellites are scheduled to. Therefore, the final POC space segment will consist of 21 DASS-equipped GPS satellites. Each payload receives 406-MHz SAR signals on an extant GPS UHF antenna and relays the signals at a GPS S-band frequency on a second extant antenna.
It is important to note that the performance of the DASS POC space segment will be exceeded by the performance of the operational space segment being designed specifically for DASS and planned for launch on GPS Block III satellites.
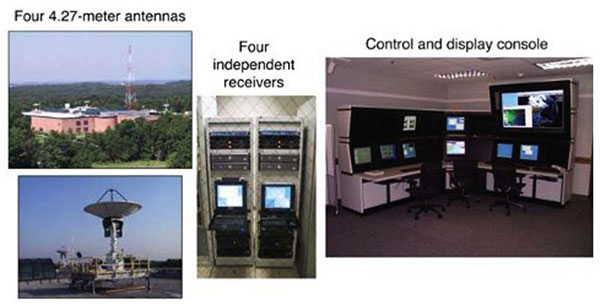
A prototype DASS ground station (Figure 2) was funded by NASA and installed at GSFC. The DASS prototype ground system consists of four antennas, four receivers, and the workstations and servers necessary to process the received data, command and control the operation of the ground station, and display and analyze the results. The antennas are located on the corners of the roof of a building connected by fiber-optic cable to signal processing equipment located in another building two kilometers away.
FIGURE 2. Prototype ground station at NASA GSFC. (Images: NASA)
Proof of Concept Testing
The overall objectives of the POC tests were to demonstrate the effectiveness of the DASS concept and to define its technical and operational characteristics. The primary technical objective was to demonstrate the system’s ability to detect and locate 406-MHz emergency beacons under various controlled conditions. This is the most important measure of the system’s ability to perform as expected.
The specific objectives of the DASS POC demonstration were to
Confirm the expected performance of the DASS concept.
Determine if new or enhanced requirements needed to be established.
Define preliminary performance levels that will be used to establish the scope and content of the next phase of development, referred to as the demonstration and evaluation phase.
Therefore, during POC testing, performance measurements were taken for the probability of detection, probability of location, and location accuracy, defined as follows.
Probability of detection is the probability of detecting the transmission of a 406-MHz beacon and recovering a valid beacon message from any available satellite.
Probability of location is the probability of obtaining a location solution within a given time after beacon activation, independently of any encoded position data in the 406-MHz beacon message.
Location accuracy is the distance from the location solution obtained within 5 minutes after beacon activation, to the actual beacon location. The required performance is specified as the probability that a given solution is within a given distance of the actual location.
It is important to note that the predicted performance of DASS assumes a full constellation of DASS-equipped GPS satellites. In fact, one of the key strengths of DASS is the promise of DASS transponders on each satellite in the GPS constellation. When a full constellation is equipped with DASS transponders, there will typically be between seven and 13 GPS satellites visible at the NASA ground station. Thus, it will be possible to schedule the ground-station antennas to receive data from the best satellites in terms of geometry, signal strength, processing capability, and other factors.
However, at the time of the POC testing, there were only eight GPS satellites equipped with DASS transponders. A maximum of three DASS-equipped GPS satellites were visible at the same time at the NASA ground station (above a 15-degree elevation angle), and there were times when only one DASS-equipped GPS satellite was visible. Thus, it was impossible to optimize satellite selection since there was never an opportunity to select from an excess of satellites that a full constellation would provide.
In particular, satellite geometry and its effect on performance is never as optimal as what would be obtained from a full constellation of GPS satellites. To predict the results of a full constellation using the results from a severely reduced constellation, a calculation based on “dilution of precision” was used.
Dilution of precision (DOP) or geometric dilution of precision, to be specific, is used to describe the geometric strength of satellite configuration on GPS accuracy. When visible satellites are close together in the sky, the geometry is said to be weak and the DOP value is high; when far apart, the geometry is strong and the DOP value is low. Thus a low DOP value gives rise to a better GPS positional accuracy due to the wider angular separation between the satellites used to calculate a beacon’s position.
Location accuracy results can be scaled to reflect the true DOP that would be obtained by a satellite constellation of 24 GPS satellites. The DOP error caused by uncertainty in time and frequency measurements is used for scaling. The DOP of the satellites actually used to calculate a location solution, denoted by ftDOPACT, is always bigger than the DOP that would have been available from a constellation of 24 GPS satellites, ftDOP24. The raw location errors need to be multiplied by the ratio ftDOP24 / ftDOPACT to reflect the results that would have been obtained if all 24 satellites were present.
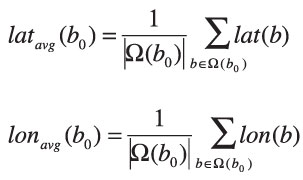
The raw average location error, erravg, is given by the following:
err(b) = err(lat(b),lon(b))= distance from the known location to (lat(b),lon(b))
erravg(b0) = err(latavg(b0),lonavg(b0))
where Ω(b0) is the set of seven or fewer consecutive burst locations within 5 minutes, starting with burst b0.
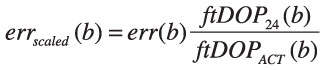
The scaled location error is the location error scaled by the DOP ratio:
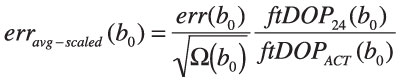
Since DOP changes little over 5 minutes, the error of the average is approximately
where ftDOPACT(b) is the time-frequency DOP of burst b calculated with either three or four satellite geometries depending on
the number of measurements used in the location calculation.
Test Source
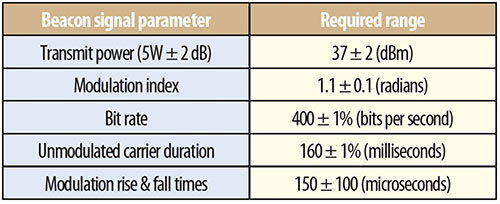
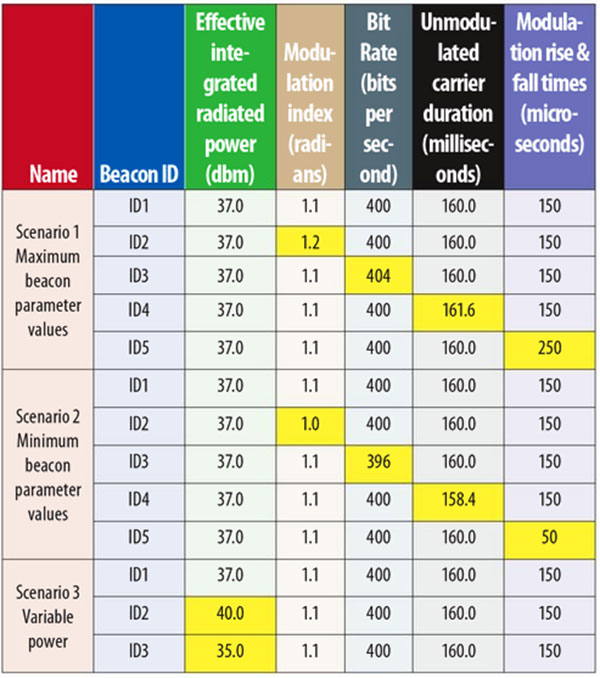
A custom-designed beacon simulator was used to generate the transmissions of multiple COSPAS-SARSAT 406-MHz beacons over an extended period of time. To represent expected operational realism in the tests, the beacon simulator was used to transmit beacons at the limits of the five major beacon parameters specified by COSPAS-SARSAT as well as the nominal values. The five major beacon parameters are transmit power, modulation index, bit rate, un-modulated carrier duration, and modulation rise and fall times (see TABLE 1).
During POC testing, five beacons were transmitted using three scenarios: maximum beacon parameter values, minimum beacon parameter values, and variable power. The parameter values changed in each test scenario and are highlighted in TABLE 2. Beacon detection and location performance is measured for periods when there are three or more satellites visible at the same time, and for durations sufficient to collect a statistically significant amount of data.
Table 2. Beacon parameter values for each test scenario. (Data: Authors)
Two characteristics of the test source that affect system performance are the beacon antenna pattern and ground mask. To simulate beacons, the beacon simulator has a monopole antenna with the gain pattern shown in Figure 3. There is a substantial reduction in the transmitted signal at high-elevation angles (above 60°). DASS-equipped GPS satellites are often at high-elevation angles during a typical day. As expected, the effect of the pattern on test results can clearly be seen upon close inspection of the data. However, the beacon antenna pattern is an unavoidable reality and is, therefore, fully represented in the data used to generate the results presented here. Additionally, there were significant ground obstructions of the beacon signal in certain directions. The effect of beacon antenna pattern is fully included in the results presented in this article, but ground mask is taken into account by limiting satellite visibility to an elevation cut-off angle of 15 degrees.
FIGURE 3. Beacon simulator transmit antenna gain pattern.
POC Test Results
In this section, we discuss the POC test results in terms of probability of detection, probability of location, and location accuracy.
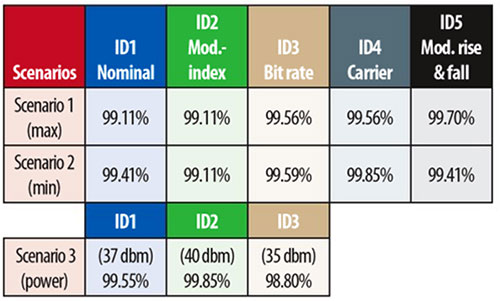
Probability of Detection. As previously mentioned, probability of detection is the probability of detecting the transmission of a 406-MHz beacon and recovering a valid beacon message from any available satellite. The requirement is that 95 percent of individual transmitted messages are detected.
Test results are given in TABLE 3 and show that the probability of detection is approximately 99 percent for all scenarios, even though only three satellites were in view at a time. Obviously, the probability of detection is dependent on the number of available satellites and performance would improve with continuous coverage by four or more satellites.
Table 3. Probability of detection test results. (Data: Authors)
Probability of Location. Again, the probability of location is the probability of obtaining a location solution within a given time after beacon activation, independently of any encoded position data in the 406-MHz beacon message. The requirement is that the probability of calculating a beacon location is 98 percent within 5 minutes.
Since the probability of location is dependent on the number of visible satellites, our performance was limited by the reduced constellation of DASS-equipped satellites. Results from periods of three-satellite coverage were 85 percent within 5 minutes, 92 percent within 10 minutes, and 94 percent within 15 minutes.
Again, the probability of location is dependent on the number of visible satellites, and performance would improve with continuous coverage by four or more satellites. To investigate the possible improvement with enhanced satellite coverage, we reduced the minimum satellite elevation angle from 15 to 10 degrees. This allowed a fourth satellite to become visible for a limited time at very low elevation angles. Even though the signal quality from such a satellite was poor, the probability of location during this period of four-satellite coverage improved as follows: 91 percent within 5 minutes, 96 percent within 10 minutes, and 97 percent within 15 minutes.
As can be seen from these results, even adding a satellite with a very low elevation-angle pass significantly improves performance. The expectation is that having a full constellation of satellites available would improve performance even more. Furthermore, the increase in satellite performance expected in the operational system will also improve probabilities of detection and location.
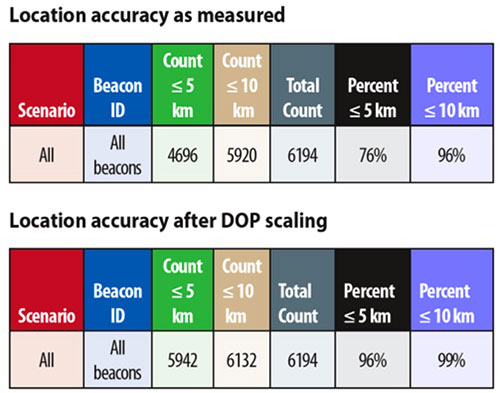
Location Accuracy. Recall that location accuracy is measured as the percentage of location solutions obtained within five minutes after beacon activation that are within five kilometers of the actual beacon location.
The requirement is to obtain 95 percent of the locations to within 5 kilometers of the actual location and 98 percent within 10 kilometers within five minutes after beacon activation.
As mentioned earlier, the requirements included in the performance specification assume a constellation of 24 DASS-equipped GPS satellites. POC testing was done with a system that had only eight DASS-equipped GPS satellites available. However, location errors can be scaled to reflect what the DOP would be if the satellite constellation contained all 24 GPS satellites. Therefore, it is the scaled results that can be used to determine whether performance will meet the requirement.
TABLE 4, therefore, presents the location accuracy results as measured, and after being scaled by DOP.
Table 4. Location accuracy for 5-minute periods. (Data: Authors)
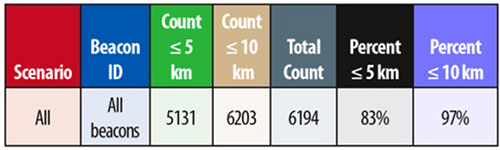
Another important performance metric for DASS is location accuracy obtained after a single beacon burst is received. Even though there is not currently a requirement for single burst location accuracy, it is a very desirable feature of DASS since an emergency situation does not guarantee that more than a single burst will be received. Single burst location accuracy was, therefore, measured with the results shown in TABLE 5. Once again, the results are scaled by DOP values to remove the effect of non-optimal satellite geometry.
Table 5. Single burst location accuracy. (Data: Authors)
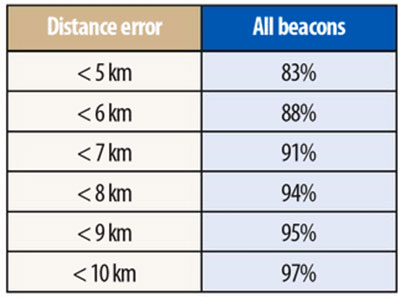
More insight into this performance can be gained by examining the single burst location accuracy distribution as a function of distance error, as shown in TABLE 6. It can be seen that, for these beacons, computed locations are within 9 kilometers of the actual location 95 percent of the time. Again, the expectation is that having a full constellation of satellites available would improve this performance. For instance, having more satellites to choose from might allow the system to select data from satellites with stronger or less noisy links.
Table 6. Single burst location accuracy by distance error. (Data authors)
Conclusion
The promise of search and rescue instruments on each satellite in the large and well-managed GPS constellation will provide a significant advancement in the capabilities of the already highly successful COSPAS-SARSAT system. The new system will provide global coverage for satellite-supported search and rescue and provide capabilities for rapid detection and location of distress beacons while requiring fewer ground stations.
The DASS POC system has validated, by test, the predictions made by analysis during the definition and development phase. The DASS POC testing has demonstrated reliable detection and accurate location of beacons within five minutes of activation. Accurate locations are also produced after even a single burst of a newly activated beacon, which is a desirable feature of DASS, since an emergency situation does not guarantee that more than a single burst will be received.
The performance obtained using a reduced constellation of satellites equipped with a modified, existing instrument not only demonstrates the existing capability, but also confirms the improvements to come with the operational system. In fact, the success of DASS is being emulated by the European Union in the design of their future Galileo GNSS constellation and the Russians in an upgraded GLONASS GNSS constellation, all of which will be interoperable by international agreement.
DASS will contribute to NASA’s goal of taking the search out of search and rescue. Achieving this goal will not only improve the chances of rescuing people in distress quickly, which is critical to their survival; it will also reduce the risk to rescuers who often put themselves in dangerous situations to affect a rescue. That is why the motto of the Search and Rescue Office is “Saving more lives, reducing risks to search personnel, and saving resources.”
David W. Affens is the manager of the NASA Search and Rescue (SAR) Mission Office at the Goddard Space Flight Center (GSFC) in Greenbelt, Maryland, where he began working in 1990. He holds a degree in electronic engineering. Before joining NASA, he worked in various aspects of submarine warfare and intelligence gathering for the U.S. Navy over a span of 21 years.
Roy Dreibelbis is a consultant who has worked in rescue-related jobs since 1957, including helicopter rescue missions in Vietnam. As an officer in the U.S. Air Force, he was the director of Inland SAR at rescue headquarters for the coterminous 48 states, was commander of the 33rd Air Rescue Squadron, and served as deputy chief of staff for rescue operations at rescue headquarters from 1979 until 1981. Upon retirement from the Air Force, he was employed by the State of Louisiana as flight operations director and chief pilot. In 1987, he accepted employment with contractors in the District of Columbia area that supported NASA and NOAA SARSAT activities.
James E. Mentall is the NASA/GSFC Search and Rescue Instrument Manager. He has a Ph.D. in physics and has spent more than 42 years of his professional life at GSFC. For 15 of those years, he has been responsible for the integration and test of the Search and Rescue Repeater and the Search and Rescue Processor on the NOAA Polar-orbiting Operational Weather Satellites. He has also served as the deputy mission manager for the Search and Rescue Mission Office and played a significant role in the procurement of the DASS antenna system and ground station.
George Theodorakos is the chief staff engineer for MEI Technologies, Inc. He received his B.S. summa cum laude and M.S. degrees in electrical engineering from the University of Maryland, College Park, Maryland, in 1978 and 1987, respectively. Since 2002, in his role as chief staff engineer at MEI, he has provided technical management support to the Search and Rescue Mission Office at GSFC.
FURTHER READING
• Distress Alerting Satellite System (DASS)
“Distress Alerting Satellite System (DASS)” on the NASA Search and Rescue Mission Office website, Goddard Space Flight Center, Greenbelt, Maryland.
• Search and Rescue Satellite-Aided Tracking (SARSAT)
“Search and Rescue,” Chapter 6 in Review of the Space Communications Program of NASA’s Space Operations Mission Directorate by the Committee to Review NASA’s Space Communications Program, Aeronautics and Space Engineering Board, Division on Engineering and Physical Sciences, National Research Council, published by the National Academies Press, Washington, D.C., 2007.
“Overview of MEOSAR System Status” by J. King, a presentation at BMW-2009, Beacon Manufacturers Workshop, St. Pete Beach, May 8, 2009.
“MEOSAR to the Rescue” by J. King in Channels, the EMS SATCOM Quarterly, published by EMS Technologies, Inc., January 31, 2007.
• Nuclear Detonation (NUDET) Detection System
“Detecting Nuclear Detonations with GPS” by P.R. Higbie and N.K. Blocker in GPS World, Vol. 5, No. 2, February 1994, pp. 48–50.