Tag: NOAA

  • GPS data release to boost space-weather science

    GPS data release to boost space-weather science

    Today, more than 16 years of space-weather data is publicly available for the first time in history. The data comes from space-weather sensors on board the nation’s GPS satellites.

    The newly available data gives researchers a treasure trove of measurements they can use to better understand how space weather works and how best to protect critical infrastructure, such as the nation’s satellites, aircraft, communications networks, navigation systems and electric power grid.

    A feature article providing an overview of the data that have been released was published today in Space Weather, a journal of the American Geophysical Union.

    “Space-weather monitoring instruments developed at Los Alamos have been fielded on GPS satellites for decades,” said Marc Kippen, program manager at Los Alamos National Laboratory in New Mexico, which developed the space weather sensors. “Today, 23 of the nation’s more than 30 on-orbit GPS satellites carry these instruments. When you multiply the number of satellites collecting data with the number of years they’ve been doing it, it totals more than 167 satellite years. It’s really an unprecedented amount of information.”

    An image illustrating the six orbital planes in which GPS satellites (“navigational satellites,” or ns) fly around Earth. This configuration shows the orbits just before the start of this solar cycle’s biggest geomagnetic storm, which occurred on March 17, 2015. The darkest orbital lines indicate the position of the satellites in that moment; the lightest lines indicate where they were 12 hours prior. (Credit: Los Alamos National Laboratory)
    An image illustrating the six orbital planes in which GPS satellites (“navigational satellites,” or ns) fly around Earth. This configuration shows the orbits just before the start of this solar cycle’s biggest geomagnetic storm, which occurred on March 17, 2015. The darkest orbital lines indicate the position of the satellites in that moment; the lightest lines indicate where they were 12 hours prior.
    (Credit: Los Alamos National Laboratory)

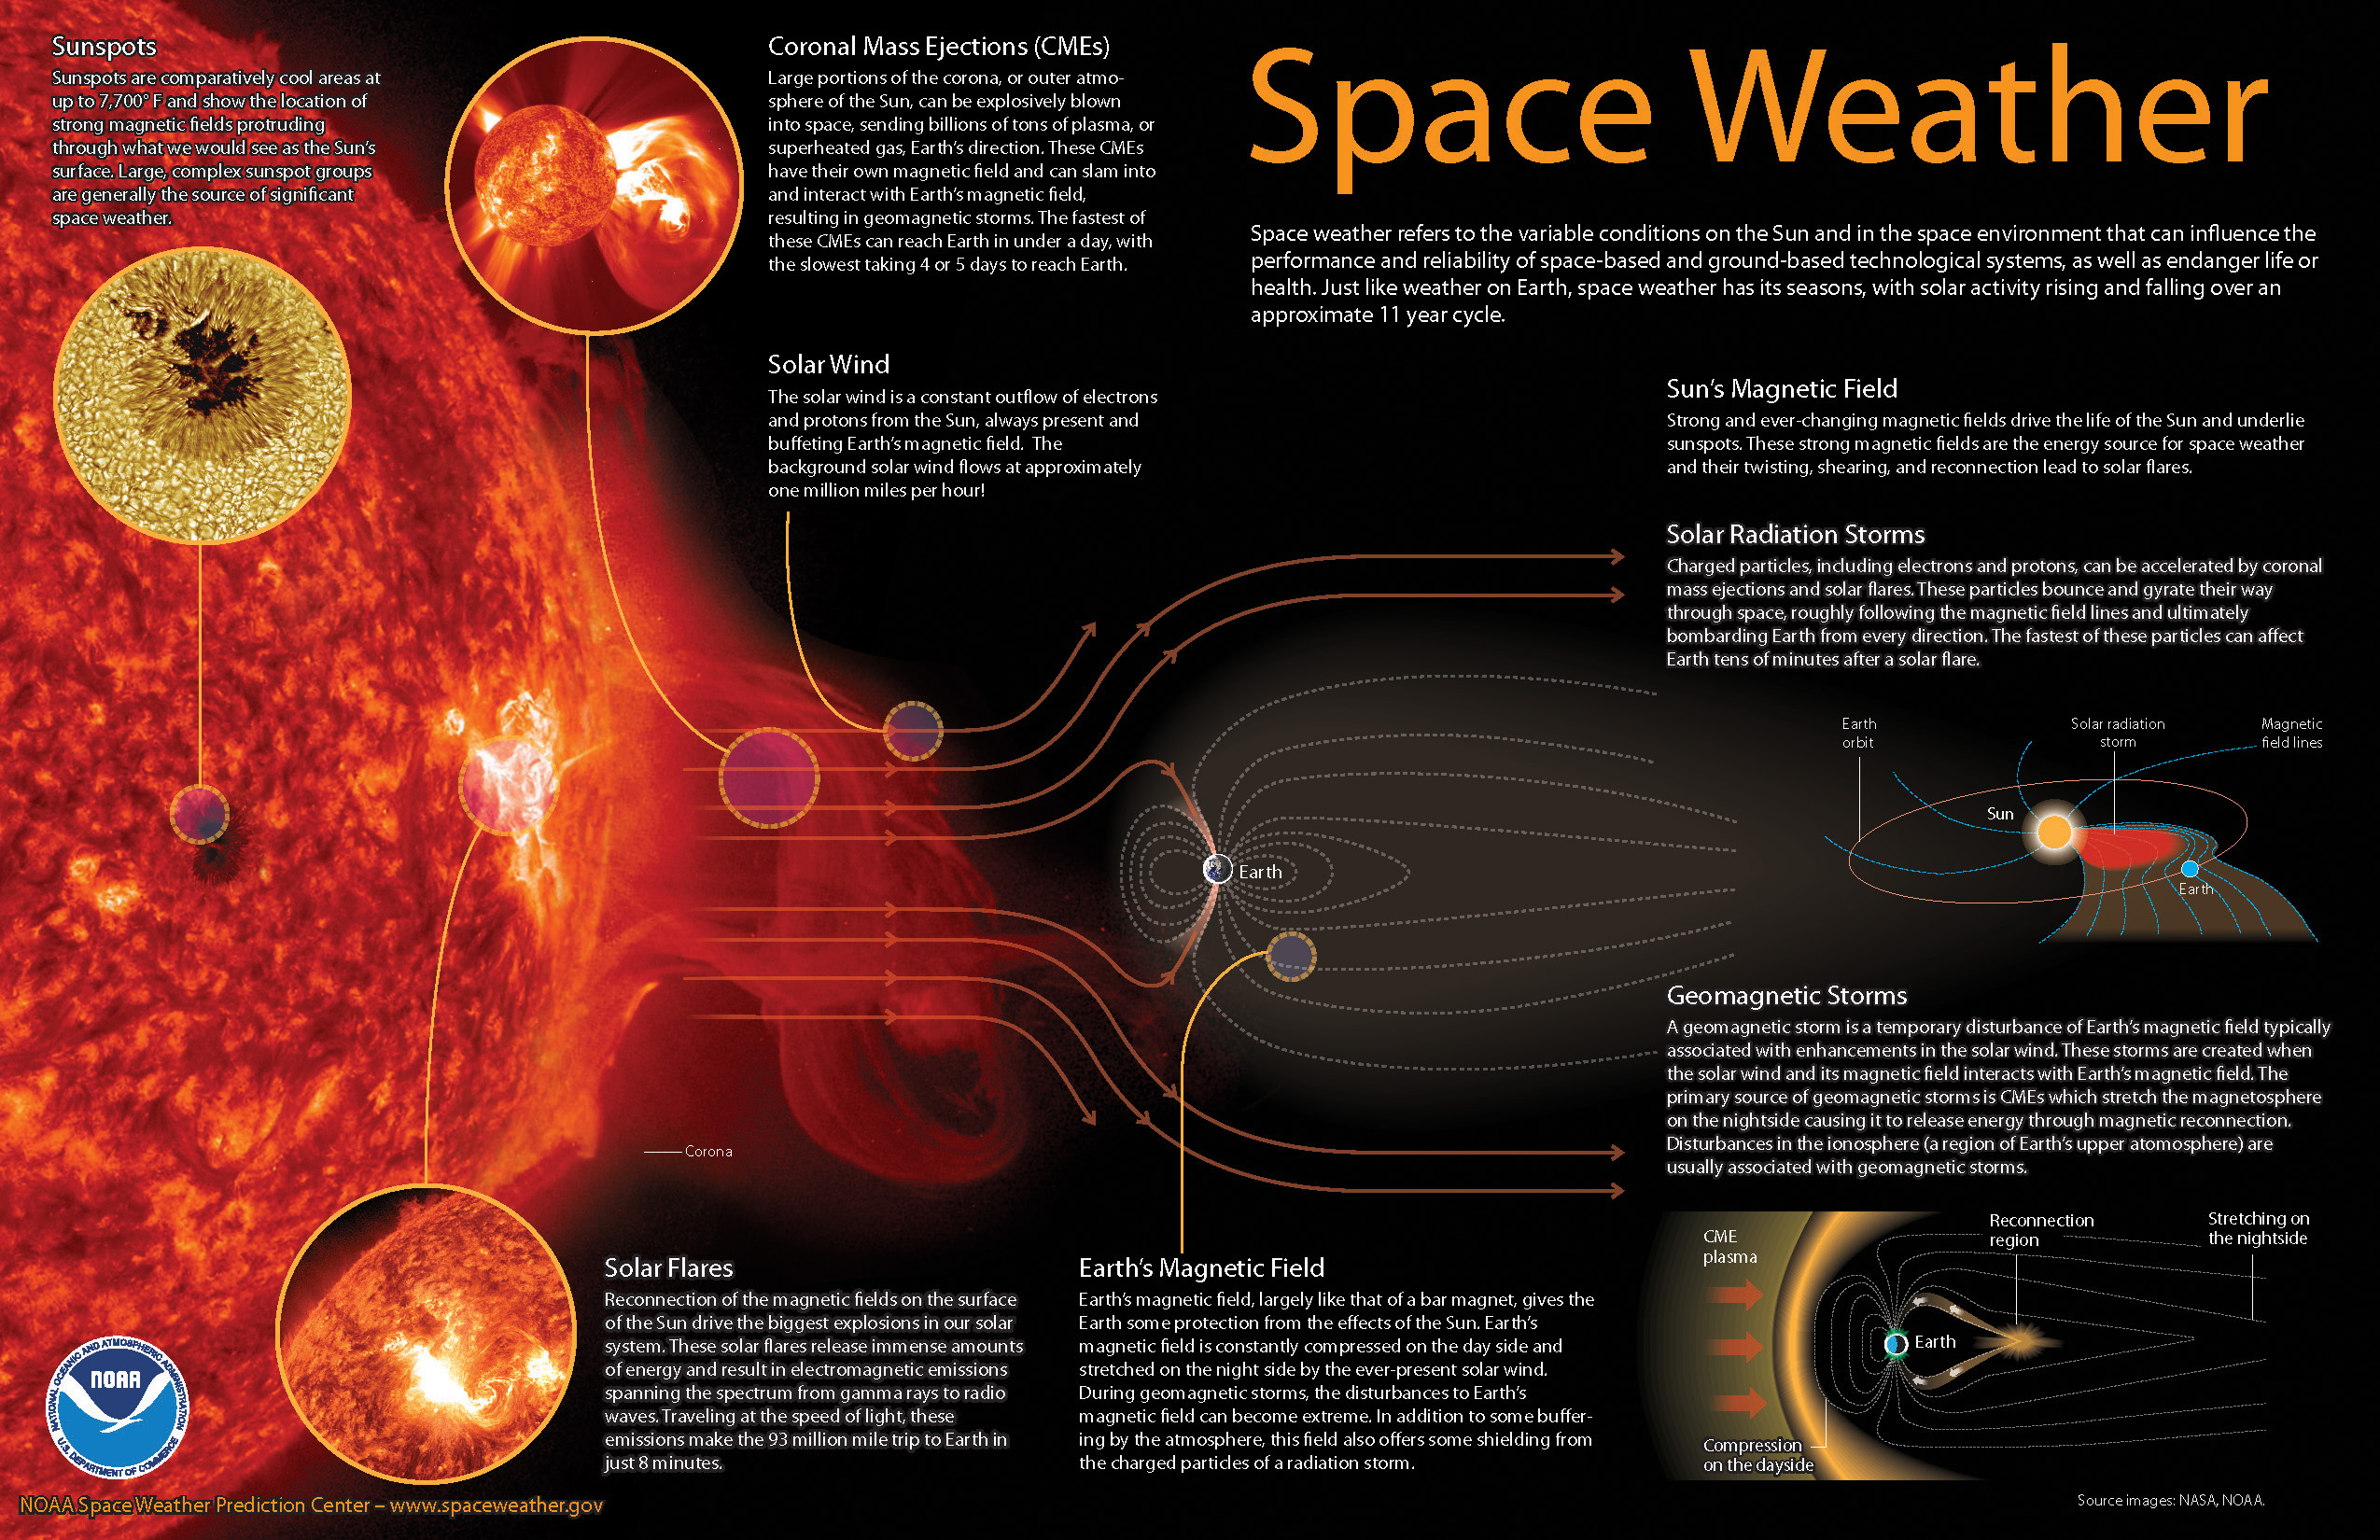
    Extreme space-weather events have the potential to significantly threaten safety and property on Earth, in the air, and in space.

    For example, the hazard of increased radiation exposure from charged particles released during a large solar flare could require that flights be diverted away from a polar route.

    Similarly, sudden bursts of plasma and magnetic field structures (coronal mass ejections, or CMEs) from the sun’s atmosphere and high-speed solar wind could significantly disable large portions of the electric power grid. The resulting cascading failures could disturb air traffic control, disrupt the water supply, and interfere with life-saving medical devices.

    In space, the charged particles measured by the Los Alamos-GPS sensors are the primary limit on how long a satellite can operate in space before succumbing to the damaging effects of radiation.

    In extreme events those particles can cause malfunction of satellites or even catastrophic failure of entire satellite systems.

    For example, in April 2010, a large magnetic disturbance resulted in a communications failure, causing a satellite to uncontrollably drift in space and presenting a hazard to nearby satellites.

    Currently, scientists are unable to predict when these extreme events will occur, how strong they will be, or how severe the effects will be. The release of Los Alamos-GPS data enables new studies that will help answer these questions.

    The Los Alamos-GPS sensors continuously measure the energy and intensity of charged particles, mainly electrons and protons, energized and trapped in Earth’s magnetic field. These trapped particles form the Van Allen radiation belts, which are highly dynamic—varying on time scales from minutes to decades. From GPS orbit (roughly 12,600 miles above Earth), satellite-borne sensors probe the largest radiation belt—consisting mainly of energetic electrons.

    Each of the 23 sensors in the current GPS constellation makes detailed measurements of the belts every six hours. Together the sensors provide 92 complete measurements of the belts every day. The newly released measurements constitute a nearly continuous global record of the variability in this radiation belt for the past 16 years, including how it responds to solar storms. The data provides an invaluable record for understanding radiation-belt variability that is key to developing effective space-weather forecasting models.

    Los Alamos has been anticipating greater awareness of the nation’s vulnerability to space weather since the 1990s, when it began aligning its space-weather research activities with its critical-infrastructure program. “This led to an awareness that we could expand the utility of our space-weather data to programs beyond the specific requirements they were designed for,” said Kippen, a co-author of the feature article.

    The public release of GPS energetic-particle data was conducted under the terms of an October 2016 White House Executive Order. It culminates years of work between the Office of Science and Technology Policy and the National Security Council to coordinate interagency efforts aimed at improved understanding, prediction and preparedness for potentially devastating space-weather events. The specific goal of releasing space-weather data from national-security assets such as GPS satellites is to enable broad scientific community engagement in enhancing space-weather model validation and improvements in space-weather forecasting and situational awareness.

    “The US DoD, the Office of Science Technology Policy, and the broader space weather enterprise deserve our support and thanks for this data release,” Delores Knipp, editor-in-chief of Space Weather, wrote in a blog post accompanying the feature article. “This cache of data will likely drive fundamental new developments in geospace research. The data release should be emulated by other nations as they invest in space-based global and regional navigation satellite systems.”

    The Los Alamos-GPS sensor data is hosted by the National Oceanic and Atmospheric Administration (NOAA) at https://www.ngdc.noaa.gov/stp/space-weather/satellite-data/satellite-systems/, or by searching for “GPS Energetic Particles” at https://data.gov. The sensors are supported by the Department of Energy’s National Nuclear Security Administration.

  • USGS reveals 6 new California seafloor, coastal maps

    MontereyCanyon_Geology-F

    The U.S. Geological Survey (USGS) released six new sets of publicly available maps that show the diverse and complex range of seafloor habitats along 80 miles of the central California coast from the Monterey Peninsula north to Pigeon Point, according to a news release form the organization.

    The new USGS publications, products of the California Seafloor Mapping Program, combine new and legacy data to reveal offshore bathymetry, habitats, geology and seafloor environments in high resolution. Environments range from the rugged granitic bedrock along the coasts of the Monterey Peninsula, to the bedrock reefs that form the surfing point breaks on the Santa Cruz County coast, to the smooth sand and mud in a large delta bar at the mouth of the Salinas River, and to the steep walls and sinuous channels of one of the largest underwater canyon systems in the world.

    “The new high-resolution datasets and maps are stimulating research – scientists are excited,” said Sam Johnson, the USGS project lead. “Our stakeholders like to say that you can’t manage it, monitor it or model it if you don’t know what the ‘it’ is. Our seafloor mapping provides that important ‘it’ to the entire coastal community.”

    Seamless onshore-offshore geologic maps incorporating subsurface data document the location and geometry of the San Gregorio fault and show how different strands of the fault extend through Carmel Canyon — across the continental shelf west of Santa Cruz and Davenport — and combine to uplift Año Nuevo State Park and Año Nuevo Island. A separate fault system to the east in Monterey Bay is part of an actively deforming wedge of the Earth’s crust caught between the converging San Andreas and San Gregorio faults, the organization said. The six new sets of California maps are Offshore of Pigeon Point, Offshore of Scott Creek, Offshore of Santa Cruz, Offshore of Aptos, Offshore of Monterey Canyon and Vicinity and Offshore of Monterey.

    Each publication includes 10 map sheets, a pamphlet and a digital data catalog with web services. The web services are a new addition to the publications and all previous products in the map series, and can be viewed on smartphones. The USGS said the maps and data provide:

    • A foundation for assessing marine protected areas and habitats.
    • An understanding how marine species such as bull kelp, rockfish, crabs and sea otters use the seafloor.
    • Baselines for monitoring coastal change and sea-level-rise impacts.
    • Critical input data for modeling and mitigation of coastal flooding.
    • A framework for understanding coastal erosion and developing regional sediment management plans.
    • Contributions to earthquake and tsunami hazard assessments.
    • More accurate data for safer navigation.
    • Essential information for planning, siting or removing offshore infrastructure.

    “These new seafloor maps – used in partnership with the USGS – will give us an additional tool to protect Californians, as well as fish and wildlife,” said John Laird, California’s secretary for natural resources and OPC chair. “The new maps will be used to analyze offshore faults and earthquake hazards. They will also help us identify sources of sand to replenish beaches – and will help establish a scientific baseline to track changes in habitat near shore over time. This investment will pay off for Californians in ways that we cannot even imagine now.”

    The California Seafloor and Coastal Mapping Program is supported by the USGS, the California Ocean Protection Council, National Oceanic and Atmospheric Administration, California State University at Monterey Bay, Moss Landing Marine Laboratories and other government, academic and industry partners.

    (Click on the images to enlarge them.)

    Maps: USGS

  • Coyote howls into the wind

    NOAA, Raytheon deploy UAS for hurricane research

    A team from the National Oceanic and Atmospheric Administration (NOAA) and Raytheon has successfully demonstrated advancements of the Coyote Unmanned Aircraft System (UAS), verifying new technology that improves Coyote’s ability to collect vital weather data on hurricanes.

    Coyote drops out of a P-3 weather surveillance plane, spreads its wings and flies straight at a hurricane, braving violent winds and punishing rain to gather weather data and beam it back to meteorologists.

    Drew Osbrink and Eric Redweik of Sensintel and NOAA hurricane researcher Joe Cione monitor data from the Coyote as it flies into Hurricane Edouard in 2014. (Photo: NOAA)
    Drew Osbrink and Eric Redweik of Sensintel and NOAA hurricane researcher Joe Cione monitor data from the Coyote as it flies into Hurricane Edouard in 2014. (Photo: NOAA)

    Coyote solves a problem that has limited forecasters’ ability to tell how hard a hurricane will hit. The secret behind the storm’s punch lies in what is known as the “boundary layer” — a low-altitude area that includes the surface of the ocean. Because hurricanes are fueled by warm ocean water, information collected at the interface of atmosphere and ocean is vital to the understanding and prediction of a storm’s strength.

    “That’s where the energy is extracted from the ocean to the atmosphere,” said Joe Cione, a NOAA hurricane researcher. “Unfortunately, it is too difficult for us to go with manned aircraft to fly down there.”

    The Coyote can maneuver in the most violent regions of a hurricane.Traditional weather instruments parachute from a plane and grab only a snapshot of humidity, wind speed and other factors, but Coyote’s winged design enables it to linger and return to certain areas for more measurements.

    “Coyote will gather data specifically in the eye wall where it can provide information for forecasters to predict intensity from a safe distance,” said John Hobday, Raytheon. “This is a significant difference for researchers: instead of providing a snapshot of data, it’s a full-length movie.”

    Source: GPS world staff
    The Coyote after a successful flight on Jan. 7. (Photo: NOAA)

    Operational Upgrades

    In a Jan. 7 test, the Coyote was released from NOAA’s Hurricane Hunter P-3 aircraft and flew over the Avon Park Air Force Range in Florida, to measure the transmission range of upgraded technologies. It set a new distance record for flight control and data transmission to the P-3, and provided hurricane forecasters with real-time data on atmospheric air pressure, temperature, moisture, wind speed and direction as well as surface temperature.

    Data collected will help improve the accuracy of forecasts. “Here at the National Hurricane Center (NHC), we are keenly interested in obtaining measurements from the Coyote of the strongest winds near the center of the storm,” said Chris Landsea, science operations officer at NHC. “Coyote could help us paint a better picture of current storm intensity for our storm updates.”

    In 2014, NOAA deployed four of the Coyote planes into Hurricane Edouard, a Category 3 storm, at controlled altitudes as low as 400 feet. Scientists on board the P-3 received meteorological data in both the eye of the storm and the eye wall.

    However, the P-3 had to fly 5 to 7 miles from the Coyote to pick up its signal. So engineers at Raytheon and the NOAA Aircraft Operations Center upgraded Coyote’s sensor systems and improved its communications package to allow it to talk to the plane over longer distances. Now, Coyote can fly for 50 miles away from the launch aircraft, which will be free to continue its own mission.

    Coyote also was outfitted with an upgraded instrument package that includes an infrared sensor to measure sea surface temperature, which will help scientists understand how a hurricane extracts energy from the ocean — and how it might intensify or change. The team also is working toward optimizing battery life.

    The test flight verified the Coyote’s ability to transmit the data collected from its instrument package to operators aboard the P-3 as well as at the NHC, where personnel monitor storms and develop forecasts.

    Source: GPS world staff
    NOAA scientist Paul Reasor demonstrates the Coyote. (Photo: NOAA)
  • Track Cat 5 Hurricane Patricia as It Nears Mexico

    Hurricane Patricia — “Extremely Dangerous” Category 5 Hurricane — Is the Strongest Storm Ever Recorded.

    Esri is providing a continuously updated hurricane map that shows the projected paths, storm surge, weather warnings and precipitation of Hurricane Patricia, the “strongest hurricane ever recorded.” In addition, the real-time effects of the storm can be seen via social media posts. The website, Hurricanes & Cyclones, is part of the Esri Disaster Response Program.

    Hurricane Patricia became the most powerful tropical cyclone ever measured in the Western Hemisphere on Friday morning as its maximum sustained winds reached an unprecedented 200 mph (320 kph).

    The National Oceanic and Atmospheric Administration (NOAA) is offering updates through its National Hurricane Center (NHC).

    Hurricane Patricia is heading toward Mexico’s west coast, and is expected to make landfall near Puerto Vallarta. “Confidence is high that Patricia will make landfall in the hurricane warning area along the coast of Mexico as an extremely dangerous category 5 hurricane this afternoon or evening,” according to a Friday morning forecast discussion from the National Hurricane Center.

    It will then cause massive rainfall in Texas after it hits landfall. “The global models continue to depict the development of a cyclone near the Texas coast over the weekend. This system should be non-tropical in nature. However, this cyclone is expected to draw significant amounts of moisture from Patricia’s remnants, and could result in locally heavy rainfall over portions of the northwestern Gulf of Mexico coastal area within the next few days,” according to the NHC discussion.

    Patricia-hurricane-O

  • Track Hurricane Joaquin with Maps, Social Media

    Hurricane-Joaquin-Esri-O

    Esri is providing a continuously updated hurricane map that shows the projected paths, storm surge, weather warnings and precipitation of Hurricane Joaquin. In addition, the real-time effects of the storm can be seen via social media posts. The website, Hurricanes & Cyclones, is part of the Esri Disaster Response Program.

    The National Oceanic and Atmospheric Administration is offering updates through its National Hurricane Center.

    Hurricane Joaquin strengthened into a Category 4 storm on Thursday as it moved through the eastern Bahamas, and could grow more intense as it nears the U.S. East Coast.

  • Track Wildfires Across Western U.S. with Interactive Maps

    Esri has published an interactive Wildfire Public Information Map and a 2015 California Wildfire Activity Map.

    Wildfire Public Information Map

    The Wildfire Public Information Map provides continuously updated information about wildfires and their perimeters from the U.S. Geological Survey and other agencies. It provides live weather warnings and wind information from the National Oceanic and Atmospheric Administration, as well as live weather radar from AccuWeather. A local perspective on events is available by turning on geotagged social media from Twitter, YouTube and Flickr on the Layers tab.

    2015 California Wildfire Activity

    This story map provides a detailed look at 15 active fires throughout California. As you scroll through the map, you can view fire perimeters and hot spots for each active fire, and get up-to-date statistics about each blaze, including total acreage, percent containment and damage caused.

  • Highest Peak in North America to be Surveyed

    Highest Peak in North America to be Surveyed

    At 20, 320 feet, Mount McKinley is North America’s highest peak. (Photo courtesy of Todd Paris, UAF).
    At 20, 320 feet, Mount McKinley is North America’s highest peak. (Photo courtesy of Todd Paris, UAF).

    A new GPS survey of Mount McKinley, the highest point in North America, will update the commonly accepted elevation of McKinley’s peak, 20,320 feet. The last survey was completed in 1953.

    The USGS, along with NOAA’s National Geodetic Survey (NGS) and the University of Alaska Fairbanks (UAF), are supporting a GPS survey of the Mount McKinley apex. Surveying technology and processes have improved greatly since the last survey and the ability to establish a much more accurate height now exists, the USGS said.

    The Mount McKinley survey team, and their equipment, are expected to face temperatures well below zero, high winds and frequent snow. Current forecast, courtesy of NOAA. (Photo courtesy of Todd Paris, UAF).
    The Mount McKinley survey team, and their equipment, are expected to face temperatures well below zero, high winds and frequent snow. Current forecast, courtesy of NOAA. (Photo courtesy of Todd Paris, UAF).

    An experienced team of four climbers, one from UAF and three from CompassData, will start the precarious trek to the summit with the needed scientific instruments in tow, in the middle of June. They plan to return on or before July 7 and begin work with the University of Alaska Fairbanks and NGS processing the data to arrive at the new summit elevation.

    With the acquisition of new elevation (ifsar) data in Alaska as part of the 3D Elevation Program, there have been inquiries about the height of the summit. The survey party is being led by CompassData, a subcontractor for Dewberry on a task awarded under the USGS’ Geospatial Products and Services Contract (GPSC).

    Using modern GPS survey equipment and techniques, along with better gravity data to improve the geoid model in Alaska, the partners will be able to report the summit elevation with a much higher level of confidence than has been possible in the past.

    According to CompassData, the survey equipment includes two Trimble R10 antennas and one Trimble Net-R9 with a Zephyr-2 antenna. Also being taken up the mountain is a 10-meter specialized glacier avalanche probe and a Ground Penetrating Radar (GPR), courtesy of the University of Alaska Fairbanks.

    It is anticipated the newly surveyed elevation will be published by the National Geodetic Survey in late August.

    Climbing Mount McKinley, North America’s highest peak, is a daunting task for even the most experienced mountaineers at Denali National Park in Alaska. (Photo courtesy of National Geographic).
    Climbing Mount McKinley, North America’s highest peak, is a daunting task for even the most experienced mountaineers at Denali National Park in Alaska. (Photo courtesy of National Geographic).

  • Down in the Flood with GPS

    Image from flood.firetree.net, using Google Earth.
    Image showing projected Florida flooding, from flood.firetree.net, using Google Earth with NASA data. Image from flood.firetree.net, using Google Earth.

    Surveyors, prepare to get your feet wet. Global warming is about to hit you in the job list. By 2050, a majority of U.S. coastal areas are likely to be threatened by 30 or more days of flooding each year. This according to a December report in Earth’s Future, a journal of the American Geophysical Union.

    [Parenthetically, the next issue of Survey Scene, in May, will be written by an actual geodesist. Until then, you have to put up with GPS World’s editor in chief — by no means a surveyor. Patience.]

    The study used data from National Oceanic and Atmospheric Administration (NOAA) tide gauges to show the annual rate of coastal floods has accelerated in recent years. These are now five to 10 times more likely today than 50 years ago — and getting worse.

    Mitigation decisions could range from retreating further inland to coastal fortification or to a combination of “green” infrastructure using both natural resources such as dunes and wetland, along with “gray” man-made infrastructure such as sea walls and redesigned storm water systems. And that’s not even mentioning such basics as redrawing property lines. Any way you look at it, surveyors are going to be involved.

    “As communities across the country become increasingly vulnerable to water inundation and flooding, effective risk management is going to become more heavily reliant on environmental data and analysis,” said Holly Bamford, NOAA acting assistant secretary for conservation and management.

    The recent U.S. Hydro 2015 conference in National Harbor, Maryland — an area particularly called out for vulnerability to the oncoming floods — naturally found a lot to talk about in this and related areas of interest for surveyors, with session tracks including: Effects of Climate Change on our Oceans and Waterways; Coastal and Ocean Mapping Initiatives; Advances in Unmanned System Technology, and several more.

    Some of the papers presented that GPS World found of interest, and hopes to present or encapsulate in some form in the near future, include:

    • Resolving Systematic GPS Interference from Aeronautical Distance Measuring Equipment during Mission-Critical Shallow Water Multibeam Surveys
    • GPS Water-Level Buoy for Hydropgraphic Survey Operations
    • Examining the Uncertainty Associated with the Establishmenbt of an Ellipsoid to Chart Datum Separation Surface Using GNSS Buoys
    • Comparison of Horizontal and Vertical Resolvable Resolution between Repetitive Multibeam Surveys Using Different Kinematic GNSS Methods.

    And those just came from the poster sessions. In the technical sessions, Jack Riley from the NOAA Coast Survey’s Hydrographic Systems and Technology Program presented a GPS Buoy Water Level Uncertainty Case Study.

    Data from on High

    Since you can’t get at a coastline from all angles — with any degree of stability, that is — data from overhead, sometimes far overhead, proves invaluable. Such as that provided by aerial digital imagery, LiDAR, and increasingly, satellites.

    Because digital aerial images are already in electronic form, they can quickly be processed and made available to users. Most of the special cameras in use nowadays provide direct georeferencing capability, which allows camera position and orientation to be determined automatically using GPS and inertial measurement equipment. An entire mini-industry has grown up around integrating aerial data with that taken from ground surveys.

    Light detection and ranging (LiDAR), a remote sensing system, became available for commercial topographic mapping in 1993. An airborne laser scanning system paired with a kinematic GPS receiver and an inertial navigation system can calculate and produce a highly accurate spot elevation. It is possible to obtain point densities that would likely take months to collect using traditional ground survey methods. The National Geodetic Survey (NGS) is currently implementing LiDAR into their shoreline mapping production process.

    Our Record So Far

    Coverage of these salty issues has been sparse in GPS World and associated newsletters, but not entirely absent. In 2006, the May issue featured “GPS Buoys Nautical Measurement.”

    In 2008, Richard Langley edited an Innovation column on “Tsunami Detection by GPS,” featuring work for which co-author Attila Komjathy eventually won a GPS World Leadership Award in 2013. And in 2010, Langley brought forth an Innovation column on “Monitoring Water Level with GNSS.”

    And way, way back in 2005, we published “Abreast of the Waves: Open-Sea Sensor to Measure Height and Direction.” This was prior to our digital era, so until we can scan a paper copy into here, we’ll simply give the abstract: “Accurate and timely information on open-sea wave conditions can help in preventing large-scale maritime disasters. This article describes a new, low-cost Global Positioning System (GPS)-based sensor that measures wave height with an accuracy of several centimeters and direction with an accuracy of 5 degrees. The receiver is mounted on a buoy, and a high-pass filter is used to extract the movement of the buoy and thus minimize GPS positioning errors. The data provided by the sensor is intended to improve wave prediction models. In addition, since this GPS-based sensor transmits only analyzed ocean wave data, it reduces the volume of data and leads to lower operating and acquisition costs. The article describes the concept of the GPS-based wave sensor, algorithms that are used for filtering and extracting wave data, as well as the results of open-sea trials.”

    So there’s more to come. Watch this space. In the meantime, we leave you with Bob Dylan’s prophetic words, circa 1967.

    Well, it’s sugar for sugar
    And salt for salt
    If you go down in the flood
    It’s gonna be your own fault.

  • Esri Maps Track Massive Snow Storms Poised to Hit Northeastern U.S.

    Esri’s interactive Severe Weather Public Information Map and U.S. Snowfall Forecast Map enable users to see winter storms, including the massive storm that’s about to hit the Northeastern United States. Here are the two maps.

    Severe Weather Public Information Map

    With the Severe Weather Public Information Map, users can view continuously updated weather reports and warnings from the National Oceanic and Atmospheric Administration (NOAA) and the National Weather Service, along with live weather data from AccuWeather.

    Users can also explore geotagged social media from Twitter, Flickr, and YouTube related to the storms.

    U.S. Snowfall Forecast Map

    This map shows the projected accumulation of snowfall across the U.S. for the next 36 hours, using data from National Weather Service Digital Forecast Database. Users can step through projections in six-hour increments for a more accurate view of when and where snowfall is expected to be most severe.

  • Severe Weather Study Shows Potential of GNSS-RO Satellites

    Severe Weather Study Shows Potential of GNSS-RO Satellites

    Constellation Roll-Out to Begin This Year

    GeoOptics, a satellite-based environmental data services company, in cooperation with Atmospheric and Environmental Research (AER), an environmental research and development company, has announced the initial results of an Observing System Simulation Experiment (OSSE) showing the reliability of radio occultation data in improving predictions of severe weather and flash flood events.

    Using weather prediction models and data assimilation techniques, AER evaluated the potential benefit of observing Earth’s atmosphere with a vast future constellation of many hundreds of orbiting GNSS – Radio Occultation (GNSS-RO) receivers. As a case study, the model used the convective system that brought severe weather to Oklahoma in 2013, which included an Enhanced Fujita Scale-3 tornado and heavy rains.

    “The improved characterization of moisture in the lowest 4-5 km of the atmosphere is very significant and, working with our colleagues at AER, we believe quite a rigorous scientific conclusion,” said Conrad Lautenbacher, GeoOptics CEO. “We see commercial provision of GNSS-RO as a valuable complement to public sector systems and a reliable, low-cost way to achieve the levels of scale tested. We are very excited by the results.”

    Through collaboration begun in 2014, the two companies set out to assess the impact of vastly increased numbers of GNSS-RO profiles on regional weather forecasting within the context of a global weather satellite system. Oklahoma was the region of focus of the study, an area with a history of severe weather phenomena. Today’s total global GNSS-RO profiles number approximately 1,800 per day, of which 0.64 profiles per day are readings taken over Oklahoma.

    In the study, AER and GeoOptics modeled from 50,000 to 2,000,000 global profiles per day through the deployment of the planned CICERO satellite constellation. Such large scale would correspondingly increase the profiles per day over Oklahoma to between 17 and 700.

    GPS World discussed the use of GPS for radio occultation in its March 1994 Innovation column, “Monitoring the Earth’s Atmosphere with GPS,” by Rob Kursinski.

    “We see commercial remote sensing and particularly the GNSS-RO technology as a paradigm change in developing and maintaining a cost-effective, next-generation operational observational infrastructure for environmental prediction,” said AER President Ron Isaacs. “The superb GNSS-RO technology knowledge base at GeoOptics provides an ideal and exciting complement to AER’s decades-long experience in today’s operational remote sensing and weather prediction practices, which include the current use of GNSS-RO sensing.”

    GNSS-RO profiles provide measurements of atmospheric temperature, moisture, and pressure with a precision unrivaled by other space-based techniques. The RO sensor gathers this information by precisely observing perturbations imposed on ubiquitous GPS radio signals as they pass through the atmosphere. Today, nearly 3,000 organizations in more than 80 countries use RO data in Numerical Weather Prediction (NWP) and research. NOAA’s own studies show that more accurate mid- to long-term forecasts can be made up to 15 hours sooner using the data collected from the current limited set of experimental GPS-RO sensors.

    GeoOptics plans to launch an array of powerful GNSS-RO sensors on its CICERO constellation of low-Earth-orbiting satellites. The rollout of the constellation will begin in the third quarter of 2015 and will deliver more than 50,000 global profiles per day when fully deployed. As demand grows, the 24-satellite CICERO constellation will be expanded to carry additional and complementary instruments, such as scatterometry and gravity sensors.

    “GeoOptics will advance a small satellite observing model that starts with GPS radio occultation,” Lautenbacher added. “We believe an integrated private company like ours can deploy such systems for a fraction of current costs to the government.”

    Figure 1. "Nature Run" atmospheric water vapor at about 4,000 feet above the ground.  The yellow-to-red color scale (bottom of figure) indicates how much water vapor is present, i.e., yellow is dry and red is moist.  This realization of atmosphere moisture during an Oklahoma severe weather outbreak in May 2013 is the yardstick against which our assimilation experiments are compared for realism.  It has a horizontal resolving power of about 1 1/4 mile (i.e., 2 km).
    Figure 1. “Nature Run” (the truth reference) atmospheric water vapor at about 4,000 feet above the ground. The yellow-to-red color scale (bottom of figure) indicates how much water vapor is present, i.e., yellow is dry and red is moist. This realization of atmosphere moisture during an Oklahoma severe weather outbreak in May 2013 is the yardstick against which our assimilation experiments are compared for realism. It has a horizontal resolving power of about 1 1/4 mile (i.e., 2 km).
    Figure 2. Atmospheric water vapor analysis using conventional observing system.  Valid time, vertical level and color scale are the same as in Figure 1.  Note that the data fusion experiments use a bigger grid than the Nature Run (Figure 1) with a horizontal resolving power of about 11 miles (i.e., 18 km).
    Figure 2. Atmospheric water vapor analysis using conventional observing system. Valid time, vertical level and color scale are the same as in Figure 1. Note that the data fusion experiments use a bigger grid than the Nature Run (Figure 1) with a horizontal resolving power of about 11 miles (i.e., 18 km).
    Figure 3. Atmospheric water vapor analysis using conventional observing system + CICERO radio occultation observations.  The distribution of water vapor in this analysis is much closer to the Nature Run (Fig. 1) in pattern and magnitude than the Control result (Fig. 2).
    Figure 3. Atmospheric water vapor analysis using conventional observing system + CICERO radio occultation observations. The distribution of water vapor in this analysis is much closer to the Nature Run (Fig. 1) in pattern and magnitude than the Control result (Fig. 2).


  • Mercury Rising: When to Expect the Warmest Day of the Year

    US-Warmest-Day-of-the-Year-Map

    Following the first official day of summer, many areas in the United States are approaching their highest temperatures for the year. To give people a better idea of the warmest time of year for their area, the National Climatic Data Center (NCDC) has created a new “Warmest Day of the Year” map for the contiguous United States.

    The map is derived from the 1981–2010 U.S. Climate Normals, NCDC’s 30-year averages of climatological variables including the average high temperature for every day. From these values scientists can identify which day of the year, on average, has the highest maximum temperature, referred to here as the “warmest day.”

    Although the amount of solar radiation reaching the Earth peaked at the summer solstice on June 21 in the Northern Hemisphere, temperatures for most of the United States tend to keep increasing into July. The temperature increase after the solstice occurs because the rate of heat input from the sun during the day continues to be greater than the cooling at night for several weeks, until temperatures start to descend in late July and early August.

    But, this isn’t the case everywhere. The “Warmest Day of the Year” map shows just how variable the climate of the United States can be. For instance, the June values in New Mexico and Arizona reflect the North American Monsoon, a period of increased rainfall affecting the Southwest United States. Because these areas tend to be cloudier and wetter from July through September, the temperature is highest on average in June. Similarly, the persistence of the marine layer along the Pacific Coast leads to cool temperatures in early summer with the warmest days on average later in the season.

    Temperature Normals are important indicators that are used in forecasting and monitoring by many U.S. economic sectors. Knowing the probability of high temperatures can help energy companies to prepare for rising electricity demand and farmers to monitor heat-sensitive crops. They are also useful planning tools for the healthcare, construction, and tourism industries. You may want to check the Normals before planning your next event or vacation.

    While the map shows warmest days of the year on average throughout the United States, this year’s actual conditions may vary widely based on weather and climate patterns. For prediction of your actual local daily temperature, and to see how it matches up with the Climate Normals, check out a local forecast at Weather.gov.

  • Blast from Sun Unsettles Earth’s Magnetic Field, but No Storming

    Blast from Sun Unsettles Earth’s Magnetic Field, but No Storming

    Image of the sun on Tuesday, Jan. 7, 2014, from the Solar X-Ray Imager on NOAA's GOES satellite, taken just after the maximum emission of a solar flare. The eruption came from the middle of the sun and is directed toward Earth. This is the largest solar flare so far this year.
    Image of the sun on Tuesday, Jan. 7, 2014, from the Solar X-Ray Imager on NOAA’s GOES satellite, taken just after the maximum emission of a solar flare. The eruption came from the middle of the sun and is directed toward Earth. This is the largest solar flare so far this year.

    Forecasters at NOAA’s Space Weather Prediction Center said the sun’s coronal mass ejection (CME) that reached Earth on Jan. 9, unsettled the geomagnetic field but did not cause storm conditions to be reached due to the weak magnetic field. While there is still a chance we could see some geomagnetic storming, that threat is greatly diminished. The Space Weather Prediction Center is a division of the U.S. National Oceanic and Atmospheric Administration.

    The sunspot in Region 1944 that produced the eruption at 1:32 p.m. EST Tuesday, January 7, has had no significant additional flaring and shows signs of decay.

    How space weather affects real-time technology

    Economies around the world have become increasingly vulnerable to the ever-changing nature of the sun. Solar flares can disrupt power grids, interfere with high-frequency airline and military communications, disrupt GPS signals, interrupt civilian communications, and blanket the Earth’s upper atmosphere with hazardous radiation.

    Monitoring and forecasting solar outbursts in time to reduce their effect on space-based technologies have become new national priorities. And NOAA’s Space Weather Prediction Center (SWPC), part of NOAA’s National Weather Service, is the nation’s official source of space weather forecasts, alerts, and warnings.

    Space weather explained (source: NOAA).
    Space weather explained (source: NOAA).

    Monitoring the Sun

    To monitor events on the sun, SWPC staff  utilize a variety of ground- and space-based sensors and imaging systems to view activity at various depths in the solar atmosphere. A worldwide network of USAF-sponsored optical observatories also provides space weather forecasters with detailed, plain-language information about activity in and around sunspot groups, as well as other areas of interest on the sun.

    Space weather forecasters also analyze the 27-day recurrent pattern of solar activity. Based on a thorough analysis of current conditions, comparing these conditions to past situations, and using numerical models similar to weather models, forecasters are able to predict space weather on times scales of hours to weeks.

    With effective alerts and warnings, NOAA is helping to minimize the hazards of space weather on technology. For example, satellite operations can be adjusted, power grids can be modified, and polar flights can be rerouted.

    For more information, visit the NOAA Space Weather Prediction Center or follow space weather on Facebook.