Esri has announced that Geoloqi, a platform for next-generation location-based services (LBS), will merge its staff and product capabilities into Esri’s existing geospatial platform and launch a new Esri Research and Development (R&D) Center in Portland, Oregon, where Geoloqi is headquartered. Terms of the agreement were not disclosed.
“We are excited to have the team at Geoloqi and its technology become part of the Esri family,” said Jack Dangermond, president of Esri. “Geoloqi’s capabilities and relationships with the developer community will build on Esri’s already impressive suite of ArcGIS products to create more dynamic mobile and web applications.”
Geoloqi’s platform enables rapid development of cross-platform, geography-based applications using a single API in any development language. Geoloqi provides specialized algorithms that help preserve battery life while location runs in the background or at stated intervals.
“It’s the perfect fit,” said Amber Case, CEO of Geoloqi. “Our tools and platforms are very complementary. We’ve seen a lot of other companies and start-ups try to work on only one piece of the location equation, but location doesn’t work with just one element. The entire system has to work together to add value, and Esri has just that.”
Geoloqi’s service for existing developers will not be interrupted. The Esri R&D Center in Portland will be focused on developing new tools and functionality to create improved, integrated products that accentuate the strength of a combined platform.
Rand McNally today introduced the RVND 7720, a 7-inch RV GPS device with Wi-Fi connectivity allowing for real-time weather information and display, and new hardware with rugged casing, video input, and brighter screen.
The new device — shipping now to stores, online retailers, and RV dealers and distributors — joins Rand McNally’s line of RVND GPS devices for RVers. Rand McNally pioneered RV-specific navigation by launching the first GPS device designed specifically for RVers and campers, the company said.
RV-specific navigation is necessary to route large vehicles and towables around road restrictions, low bridges and other physical hazards. However, like all Rand McNally RV GPS devices, the RVND 7720 can be used as a car GPS by changing a simple setting.
One of the key new features of the RVND 7720 is Wi-Fi connectivity, which enables the transmission and display of weather as well as other real-time information. With updated weather information, RVers will be able to anticipate delays and make plans by viewing current and predicted conditions displayed on the map and along the route, the company said. Besides weather, other RV-specific connected services will be coming soon for this device.
The RVND 7720 has a new hardware platform as well, with a rugged design with ridged casing for added protection, a brighter screen that adjusts for low and strong light, and video input compatible with a range of back-up and rear-view cameras, Rand McNally said.
The base maps and overlaying content, such as campgrounds, parks, RV service and other RV points of interest, also have been updated for the RVND 7720.
The new device ships with Lifetime Maps, so owners will be able to update their devices at no additional cost.
The RVND 7720 GPS includes the following additional new features:
Fully updated road data, including RV-specific information such as speed limits, legal and physical restrictions, and all Rand McNally proprietary RV data
Fully updated points of interest necessary for safe and convenient routing, including travel centers and RV parking information at rest stops, exits, and other locations
Fuel logs, which are accessible from the Virtual Dashboard or via RV Tools; the feature enables drivers to record fuel purchases for a trip
Additional routing options such as “Avoid State or Province” and “Avoid Smaller Roads”
Address book icon enhancement, which enables unique icons to be created by group and shown on the map for imported locations; address book items can be sorted by name, distance from current location or date added
Text-to-speech alert details for user-imported custom points of interest, such as red light cameras, to reduce driver distraction
The RVND 7720 also has these features: Virtual Dashboard; junction view with lane assist; free downloads of Rand McNally’s proprietary construction information and software updates; Exits Quick View, which shows RV parking and amenities at exits; RV Tools, RV amenities and locations such as campgrounds, RV services, and dumps; Woodall’s Campground information with searchable amenities; Rand McNally exclusive pre-planned trips with photos and video; and routing for 11 types of RVs as well as for cars.
By Ruizhi Chen, Yiwu Wang, Ling Pei, Yuwei Chen, and Kirsi Virrantaus.
A simple and flexible smartphone-based 3D navigation solution uses geocoded images that require neither 3D modeling nor real-time rendering of 3D scenes, making it energy-efficient and cost-effective. Real-world images can be also replaced with screen snapshots of the 3D scenes rendered from existing 3D models. Field tests demonstrate energy efficiency, consuming roughly half the power of a model-based solution with real-time rendering of 3D scenes.
After the September 12 launch of the Apple iPhone 5, which comes equipped with Apple’s own Maps application, users soon found their efforts to navigate thwarted by mislabeled cities, misplaced landmarks, lack of’ transit directions, and strange satellite imagery.
Today, Apple Inc. Chief Executive Tim Cook apologized to customers for the flaws in the Maps app in a letter posted on Apple’s website. The Maps app replaced Google Maps as the standard iPhone mapping application, but Cook is now suggesting customers use the online Google Maps or download other mapping applications while Apple works to fix its application. Google Maps was standard on previous versions of the iPhone. Apple’s newest mobile operating system, iOS 6 doesn’t support Google Maps, so users would have to use that application through the Internet.
Here is the text of Cook’s letter:
To our customers,
At Apple, we strive to make world-class products that deliver the best experience possible to our customers. With the launch of our new Maps last week, we fell short on this commitment. We are extremely sorry for the frustration this has caused our customers and we are doing everything we can to make Maps better.
We launched Maps initially with the first version of iOS. As time progressed, we wanted to provide our customers with even better Maps including features such as turn-by-turn directions, voice integration, Flyover and vector-based maps. In order to do this, we had to create a new version of Maps from the ground up.
There are already more than 100 million iOS devices using the new Apple Maps, with more and more joining us every day. In just over a week, iOS users with the new Maps have already searched for nearly half a billion locations. The more our customers use our Maps the better it will get and we greatly appreciate all of the feedback we have received from you.
While we’re improving Maps, you can try alternatives by downloading map apps from the App Store like Bing, MapQuest and Waze, or use Google or Nokia maps by going to their websites and creating an icon on your home screen to their web app.
Everything we do at Apple is aimed at making our products the best in the world. We know that you expect that from us, and we will keep working non-stop until Maps lives up to the same incredibly high standard.
Dentsu has released a social app for location-based food search for iOS devices. FoodKing enables searching for a particular food item of interest, such as an omelet or pasta, based on the user’s location. Users can also “like” and “comment” on reviews and gather points to become a King of an individual food ranking.
This app was released globally enabling users to communicate internationally through food reviews. Dentsu says it will be adding new food categories every month. Currently the app supports English and Japanese in the interface, and reviews in all languages. More languages are planned.
Researchers from Rice University unveiled a new multi-antenna technology that could help wireless providers keep pace with the voracious demands of data-hungry smartphones and tablets. The technology aims to dramatically increase network capacity by allowing cell towers to simultaneously beam signals to more than a dozen customers on the same frequency.
Details about the new technology, dubbed Argos, were presented at the Association for Computing Machinery's MobiCom 2012 wireless research conference in Istanbul. Argos is under development by researchers from Rice, Bell Labs and Yale University. A prototype built at Rice this year uses 64 antennas to allow a single wireless base station to communicate directly to 15 users simultaneously with narrowly focused directional beams.
Thanks to the growing popularity of smartphones and other data-hungry devices, the demand for mobile data is expected to grow 18-fold within the next five years. To meet demand, wireless carriers are scrambling to boost network capacity by installing more wireless base stations and shelling out billions of dollars for the rights to broadcast on additional frequencies.
In tests at Rice, Argos allowed a single base station to track and send highly directional beams to more than a dozen users on the same frequency at the same time. The upshot is that Argos could allow carriers to increase network capacity without acquiring more spectrum.
"The technical term for this is multi-user beamforming," said Argos project co-leader Lin Zhong, associate professor of electrical and computer engineering and of computer science at Rice. "The key is to have many antennas, because the more antennas you have, the more users you can serve."
Zhong said the theory for multi-user beamforming has been around for quite some time, but implementing technology has proven extremely difficult. Prior to Argos, labs struggled to roll out prototype test beds with a handful of antennas.
"There are all kinds of technical challenges related to synchronization, computational requirements, scaling up and wireless standards," he said. "People have really questioned whether this is practical, so it's significant that we've been able to create a prototype that actually demonstrates that this works."
Argos presents new techniques that allow the number of antennas on base stations to grow to unprecedented scales. The Argos prototype, which was built by Rice graduate student Clayton Shepard, uses an array of 64 antennas and off-the-shelf hardware — including several dozen open-access test devices called WARP boards that were invented at Rice's Center for Multimedia Communications. In tests, Argos was able to simultaneously beam signals to as many as 15 users on the same frequency. For wireless carriers, that performance would translate to more than a six-fold increase in network capacity. Zhong said the base-station design can be scaled up to work with hundreds of antennas and several dozen concurrent users, which would result in much higher capacity gains.
"There's also a big payoff in energy savings," Shepard said. "The amount of power you need for transmission goes down in proportion to the number of antennas you have. So in Argos' case, we need only about one-sixty-fourth as much energy to serve those 15 users as you would need with a traditional antenna."
Zhong and Shepard said Argos is at least five years away from being available on the commercial market. It would require new network hardware and a new generation of smartphones and tablets. It might also require changes in wireless standards. Those are big hurdles, but Zhong said the potential benefits of multi-user beamforming technology make it a very likely next big step for the wireless industry.
"The bandwidth crunch is here, and carriers need options," Zhong said. "They're going to pay close attention to any new technologies that may allow them to serve more customers with fewer resources."
Research co-authors include Hang Yu and Narendra Anand, both of Rice; Li Erran Li and Tom Marzetta, both of Bell Labs; and Yang Richard Yang of Yale University. The research was supported by the National Science Foundation, Bell Labs, Alcatel Lucent and the Air Force Office of Sponsored Research.
With drive navigation nearing maturity, companies are scrambling to develop new offerings. Nokia and others are quickly building indoor mapping arsenals. We are edging closer to the LBS vision that early on defined the market: walk by a Starbucks and get a mobile coupon for a cuppa Joe. Qualcomm’s new Gimbal platform will not only speed the production of more sophisticated personalized apps, but will enable advertising that fits the immediate interests of the end user. Google wants to protect mobile advertising streams and has instituted rules to keep it consumer friendly.
Qualcomm has released Gimbal, a software developers’ kit that will help developers create personalized content, including sophisticated use of location. The platform will create a rush of apps that will utilize end users’ interests, location, and device sensors to create content that responds to an individual’s real-time situation and preferences. The industry is salivating over the type of marketing/advertising opportunities that platforms like Gimbal create. Contextual ads have been demonstrated to be much more effective than generic ads. There are uses beyond advertising, for instance, a reminder to pick up dry cleaning when in the vicinity, or bread when in a market. The Gimbal library is extensive and includes low-power, geofence-based location awareness, image recognition, privacy management, and other features.
In a move to further broaden Nokia, the company is focusing on indoor mapping and now claims more than 4,600 venues in 38 countries, a fast ramp-up from its Destination Maps launch at CTIA in 2011. These maps are more detailed than some others in the market and include escalators, floor levels, ATMs, and restrooms. Dynamic content such as movie listings, flight times, or transit schedules can be added for further value to end-users.
Nooking an LBS. As Apple and Google elbow for mapping dominance, Barnes & Noble has quietly launched maps and navigation for the Nook eReader and opened the door for location-based apps. The company is using the open-sourced OpenStreetMap database via Skobbler to enable developers to create location-based applications for the Nook. OpenStreetMap is a Wikipedia-like open source mapping project that could be the spoiler in the map race between Google and Apple. The Nook utilizes Wi-Fi, but lacks 3G, 4G, or GPS. I’m surprised that Amazon didn’t load the Kindle Fire’s Android version with Google maps.
Samsung Well Located. Leading handset maker Samsung has acquired the handset connectivity and handset location business of CSR for $310 million plus an added $34 million investment in the remaining CSR business. The details of the deal seem to indicate that Samsung has only purchased the technology license for GPS, not indoor location, said Liam Quirke of IMS Research. “If correct, this means CSR is free to sell its indoor location technology to other handset OEMs, and the reverse means that Samsung is not able to do this,” he adds. This is another move by Samsung to vertically integrate its business to cut costs.
CSR acquired Sirf Technology, a pioneer of commercial GPS technology, in 2009. Kanwar Chadha, founder of Sirf and a leader at CSR, has resigned. Chadha has been a cheerleader and visionary for the location industry.
Buy a $60 Massage for $30? Nokia is integrating Groupon daily deals into Windows Lumia device series. Users searching Nokia maps will be shown relevant deals alongside traditional search results. Microsoft’s forthcoming Windows Phone 8 operating system overhaul will install Nokia Maps as the default mapping experience. “Scale is critical to our growth,” says Michael Halbherr of Nokia. “That’s why the horizontal nature of the Windows Phone deal is critical.”
Ads that Leave a Bad Taste. Google is trying to rein in the most annoying and sometimes deceptive mobile advertising. Android apps available in the Google Play marketplace will need to follow new rules. The company has introduced stringent new mobile advertising restrictions as well as clarified payment, subscription billing, and spam policies. The new rules aim to stop misleading notifications or warnings that impersonate system notifications. The regulations also target apps that make changes to the functioning of the user’s device, outside of the advertisement. Google ads that force a user to click on ads or submit personal information for advertising purposes is strictly prohibited, and Google states that consumers must be able to dismiss an ad without penalty.
Not First to Know. Did you get the “Mitt’s VP” app so you’d know his choice before the media? “Mitt’s VP” smartphone app for iOS and Android promised to be the first place Romney would publicly announce his selection, but a news leak spilled the beans. The Romney campaign hoped the app would recover a stronger mobile presence after the release of “With Mitt” in May went awry. “With Mitt” contained an unfortunate typo that promised, “A Better Amercia.” An immigration issue?
Save the Date. I’ll be moderating a panel debate, “Opening up the Indoors for Location Services,” at MforMobile’s Location Business Summit 2012, being held in San Jose October 16-17. TheWhereBusiness and NFC Insight are now MforMobile.
Google announced on its official blog that it has released more than twenty popular U.S. museums to its collection of over 10,000 indoor maps that they launched in November: the de Young Museum in San Francisco, the Philadelphia Museum of Art, Cincinnati Museum Center, the Indianapolis Museum of Art, the American Museum of Natural History and 17 Smithsonian museums and a zoo.
American Museum of Natural History, New York City
National Air and Space Museum—Smithsonian Institution, Washington, D.C.
Google reports that to access the floor plans, simply open Google Maps on your Android phone or tablet and zoom in on the museum of interest. To find the museum, either search for it by name using the magnifying glass icon or, if you’re already there, use the “My location” feature to orient yourself. With the “My location” feature enabled you can even get indoor walking directions.
According to the announcement, more museums are adding their floor plans to Google Maps for Android soon, including the SFMOMA, The Phillips Collection, the Nelson-Atkins Museum of Art and the National WWII Museum in New Orleans. If you’re interested in getting your museum’s floor plan included in Google Maps, visit the Google Maps Floor Plans tool.
Skyhook, a location information, context and intelligence company, has announced that two new Kindle Fire apps have integrated Skyhook to provide location services on this device. The applications include Happy Hour Finder and Scope. They join a list of other apps using Skyhook for location services on the Kindle Fire, including MapQuest, KAYAK, deCarta, and TweetCaster.
Happy Hour Finder is a local search app that shows the nearest bars and restaurants with discount happy hours. Scope is an aggregated social media app that organizes all of a persons social networks in one place.
"Location check-ins are a valuable piece of the complete social picture Scope provides of your friends' activity," said Anit Kumar, CEO of Scope. "We knew we couldn't launch the app on Kindle Fire without location, and wanted to ensure all of our Android versions were the same, so Skyhook was necessary."
"Developers are increasingly concerned with Android fragmentation," said Maggie Taylor, marketing manager of Skyhook. "Our system provides consistent location functionality and protects developers from this problem, so apps are built once and will work across the board."
Happy Hour Finder and Scope are both free and available today in the Amazon App store for download. Skyhook provides an SDK for developers across most platforms.
Flurry has announced Flurry Ad Analytics, an analytics-powered service for mobile app marketers to measure the effectiveness of traffic acquisition campaigns across ad networks. The service enables app marketers to track the quality, follow-on behavior, and return on investment of traffic sourced from campaigns across major mobile ad networks including Apple iAd, Google Admob, Millenial Media, InMobi, Jumptap, and Flurry AppCircle.
“Flurry estimates that during 2012 app marketers will spend over one billion dollars worldwide on app traffic acquisition without the ability to measure user quality, assign attribution or easily determine ROI,” said Simon Khalaf, Flurry president and chief executive. “Flurry Ad Analytics empowers app marketers to change the way they think about acquisition and focus on quality not just quantity.”
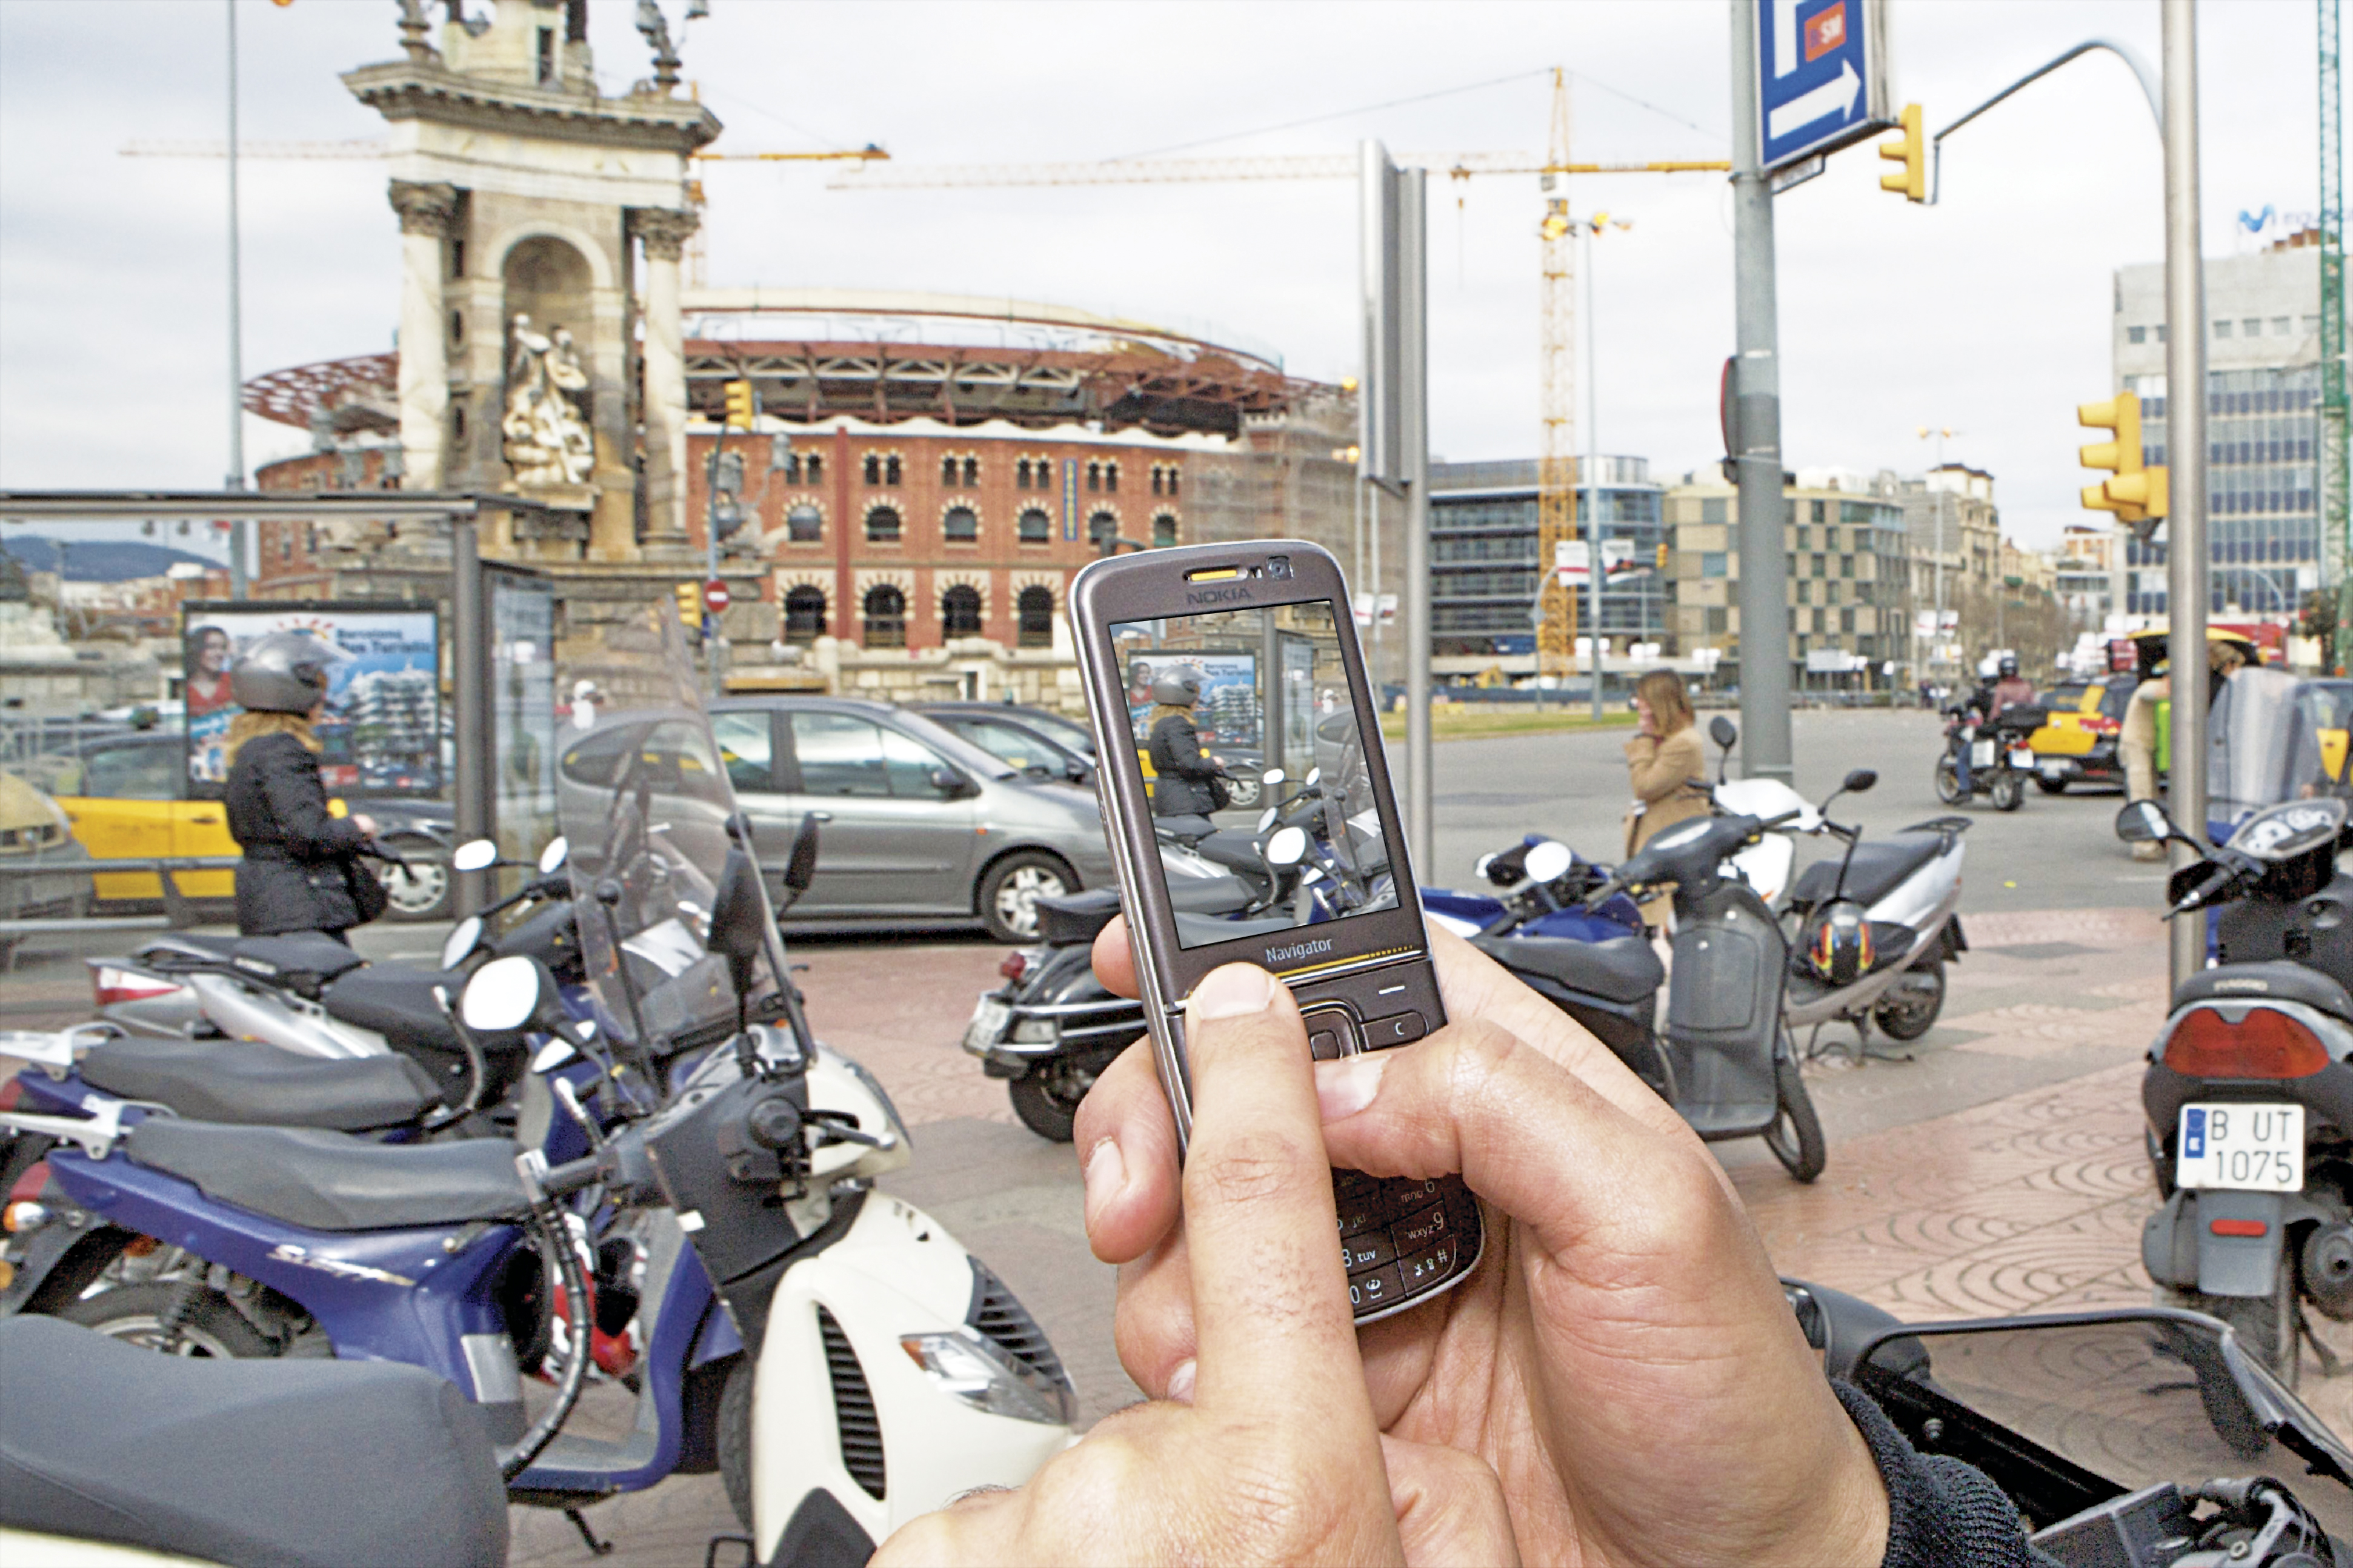
Shadow matching. The two GNSS mobile phones beside the middle one show additional possible user positions referenced by the along-street component of the standard point positioning (SPP) solution.
By Paul D. Groves, Lei Wang, and Marek K. Ziebart
GNSS positioning in dense urban areas is unreliable, with accuracy particularly poor in the cross-street direction. One solution is shadow matching, a new positioning technique that uses 3D building models to predict which satellites are visible from different locations and compares this with the measured satellite visibility to determine position. This article presents test results of a preliminary shadow-matching algorithm in a London urban canyon and discusses the practical implementation of the technique
Poor GNSS positioning accuracy is common in urban canyons where tall buildings block the direct line-of-sight (LOS) signals from many, sometimes most, of the satellites, effectively casting GNSS shadows over the adjacent terrain. Without direct signals from four or more satellites, an accurate position solution cannot be determined. Sometimes, a degraded position solution can be obtained by using signals that can only be received by reflection off a building, known as non-line-of-sight (NLOS) signals.
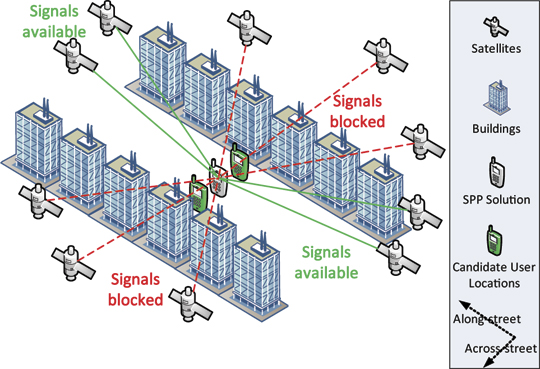
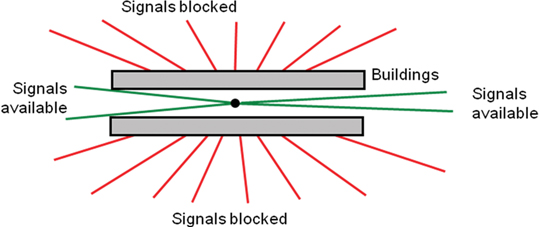
Using GLONASS in addition to GPS considerably enhances direct signal availability, and the ongoing deployment of Galileo and Compass will enhance it further. However, an urban canyon affects the geometry of the available GNSS signals as well as their number. Signals with lines of sight going across the street are much more likely to be blocked by buildings than signals with lines of sight going along the street (see Figure 1). As a result, the signal geometry, and hence the positioning accuracy, will be much better along the direction of the street than across the street. For example, for a building-height-to-street-width ratio of three and direct signals from four GNSS constellations, the cross-street position uncertainty can exceed 20 meters, while the along-street uncertainty is within 5 meters.
Figure 1. Signal geometry of GNSS satellites in an urban canyon (aerial perspective).
This level of accuracy is good enough for some applications but not others. Knowing which side of the street a pedestrian on is useful for visitor guidance and location-based advertising, while it is critical for guiding the blind and visually impaired and for augmented-reality applications. Similarly, lane-level positioning is important for advanced intelligent transportation systems that can direct individual vehicles in order to maximize traffic flow and prioritize emergency vehicles.
Improving GNSS positioning in urban canyons requires lateral thinking. If it’s not possible to calculate a sufficiently accurate position solution using the visible satellites, why not use the nonvisible satellites as well? This is exactly what shadow matching does. If you know where the buildings are and how big they are, you can deduce positional information from the knowledge that certain signals are blocked.
This requires a 3D model of a city’s buildings. These are becoming more accurate and widely available and have already been used to predict GNSS signal availability and multipath interference.
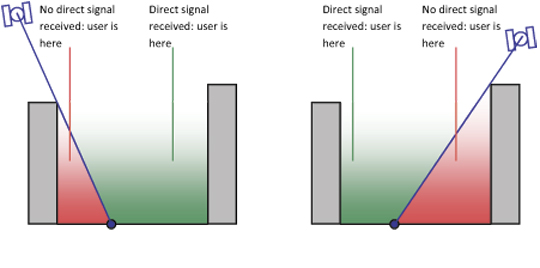
The principle of shadow matching is simple. Due to obstruction by buildings in urban canyons, signals from many GNSS satellites will be receivable in some parts of a street, but not others. Where each direct signal is receivable can be predicted using a 3D city model. Consequently, by determining whether a direct signal is being received from a given satellite, the user can localize their position to within one of two areas of the street. Figure 2 illustrates this. By considering other satellites, the position solution may be refined further, producing a much more accurate cross-street position solution than available from conventional GNSS positioning in this environment. Thus the observed signal shadowing is matched with the predicted shadowing to determine position.
Figure 2. The shadow-matching concept: using direct signal reception to localize position.
This concept of shadow matching, has been proven by mathematical modeling. Satellite visibility predictions using a 3D city model of London have been validated with real-world observation, demonstrating the practical potential of shadow matching. Here, shadow matching is brought from proof of concept one step further to practical demonstration. A preliminary but complete implementation of shadow matching has been developed and tested in London using real-world GPS and GLONASS measurements. The algorithm is described first, followed by the test results. We then discuss dealing with different types of signal propagation that occur in urban areas. and how to implement shadow matching in real time on a platform such as a smartphone.
Shadow-Matching Algorithm
A basic shadow matching algorithm may be broken down into four steps:
Perform standard point positioning (SPP) using GNSS pseudo-ranges to obtain an approximate user position.
Define the search area for the shadow-matching position solution, generating a set of possible user positions close to the approximate position solution.
Predict satellite visibility at each candidate position using the 3D city model.
Evaluate the similarity between predicted and observed satellite visibility at each position. The candidate position with the best match is deemed to be the shadow-matching solution. This process can be conducted epoch by epoch, so the GNSS user can be either static or dynamic.
Conventional Positioning. In the first step, SPP using GNSS pseudo-ranges is conducted to acquire an initial user position. In an urban environment, the accuracy will often be poor, partly due to contamination by NLOS signals. Consistency checking may be used to identify the NLOS signals and, where possible, remove them from the position solution.
Candidate Position Determination. As discussed earlier, signal geometry and hence positioning accuracy will be much better along the direction of the street than across the street. Therefore, in this preliminary shadow-matching algorithm, the along-street component of SPP solution is used as a reference to generate a set of possible user positions that vary in across-street direction only (shown by the two mobile phones beside the SPP solution on the opening page of this article).
A more advanced shadow-matching algorithm would also consider candidate positions in the along-street direction and would vary the size of its search area based on an assessment of the quality of the SPP solution. The smaller the search area, the more efficient the shadow-matching algorithm will be. However, the search area must be large enough to contain the true position. Further research is needed to determine the optimum search area.
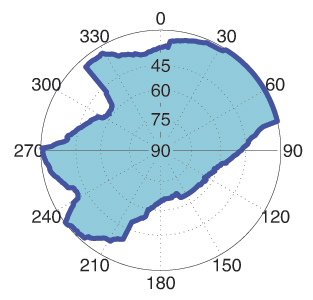
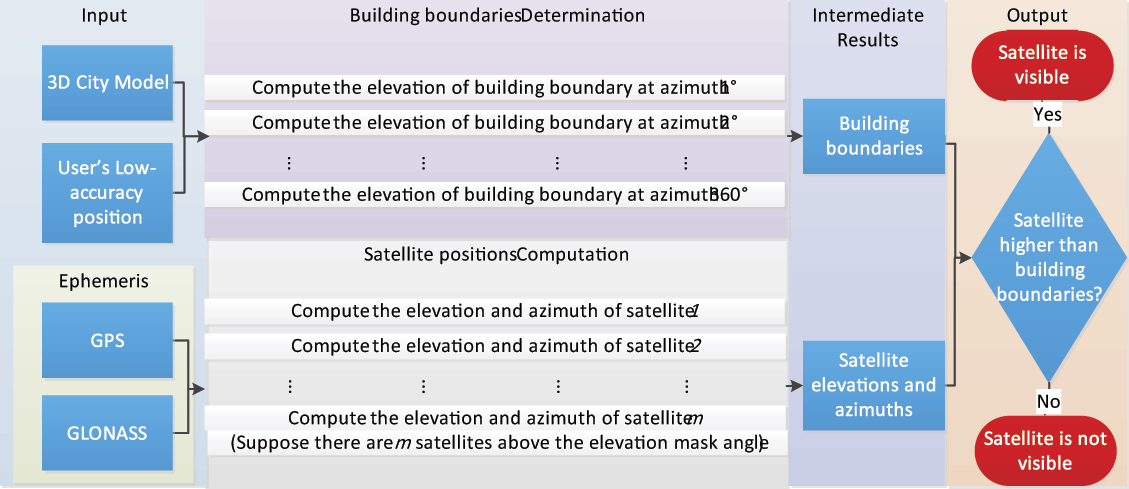
Satellite Visibility Prediction. At each candidate position, the two-step building boundary method predicts satellite visibility from the 3D city model. First, a building boundary from a GNSS user’s perspective is determined for each azimuth (from 0 to 360°) as a series of elevation angles. The results from this step show where the building boundaries are located within an azimuth-elevation sky plot. Figure 3 shows an example of a building boundary computed from a possible user location. Once the building boundary has been computed, it may be stored and reused.
Figure 3. Example of a building boundary as azimuth-elevation pairs in a sky plot. (The centre of the plot correspond to a 90º elevation or normal incidence).
Next, each satellite elevation is compared with the building boundary elevation at the same azimuth. The satellite is predicted to be visible if it is above the building boundary. If the satellite is just within the building boundary, a potentially diffracted signal can be predicted. However, this feature was not included in the preliminary shadow-matching algorithm described here. A software toolkit for determining satellite visibility was developed in C++.
Figure 4 shows the relationships between its processes.
Figure 4. The process of satellite visibility prediction. (Click to enlarge.)
The building boundary approach is efficient where a great number of satellite visibility tests are performed at the same location. For real-time visibility determination, building boundaries may be pre-computed over a grid of possible user locations and stored. However, there is an alternative. Instead of computing building boundaries, each satellite LOS can be directly compared with the city model to determine if it is blocked by buildings. This single LOS method is more efficient overall where only a few satellite visibility tests are performed at a given location. However, for real-time, it imposes a much higher processing load than using pre-computed building boundaries.
In practice, either method may be employed, depending on the situation. For real-time shadow matching, the trade-off is between a higher processing load for the single LOS method and greater data storage for the building boundary method. For non-real-time visibility determination, the trade-off depends on the number of tests required at each location.
Matching Prediction and Observation. The final step, evaluating the similarity between predicted and observed satellite visibility at each position and identifying the best match as the shadow matching solution, comprises three functions: satellite matching, position scoring, and position comparison.
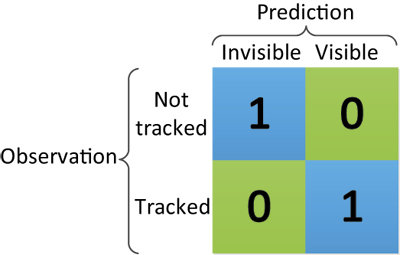
Satellite matching determines for each satellite the degree of similarity between the predicted satellite visibility and the real observation. Figure 5 shows the simple satellite matching function deployed for this study. For each satellite above a pre-set elevation mask angle, if the prediction agrees with the observation, the score is one; otherwise, the score is zero.
Figure 5. Scoring matrix giving the score for each satellite in shadow matching.
Future research will be conducted to extend the matching function so that different scores are produced for signals predicted to be in the diffraction region and signals observed with low and medium signal-to-noise levels.
Position scoring evaluates the overall degree of match between predicted and observed satellite visibility for each possible user position, summing up the satellite matching scores for each candidate position to give a position score.
Finally, position comparison selects the candidate position with the highest overall score and outputs this as the position solution. However, sometimes there is more than one candidate. Further research is needed to find the optimum way of determining a positioning solution with associated error bounds from a grid of shadow-matching scores.
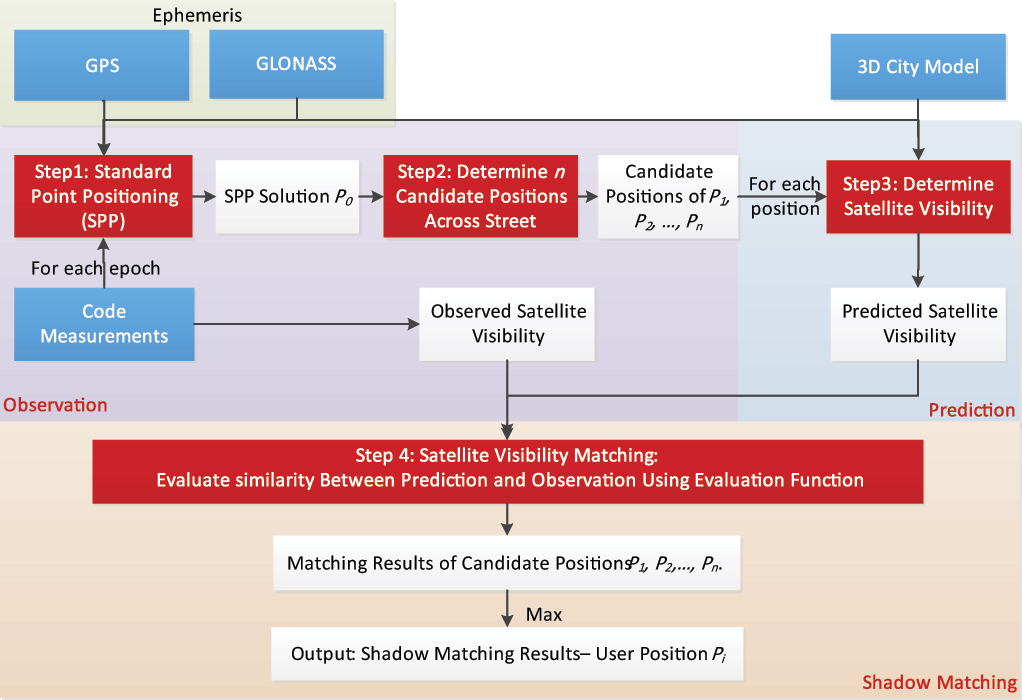
Figure 6 summarizes the shadow-matching process.
Figure 6. The shadow matching process. Blue denotes input data, red denotes main process steps, and white denotes intermediate or final results. (Click to enlarge.)
Experimental Verification
We used a 3D city model of the Aldgate area of central London to test shadow matching. The model has a high level of detail and decimeter-level accuracy.
The software toolkit developed for this study stores and processes 3D city model data using Virtual Reality Modeling Language (VRML), an international standard format. Model data in other formats can be transformed to VRML. Buildings in VRML format are represented by structures, which in turn comprise polygons (normally triangle meshes).
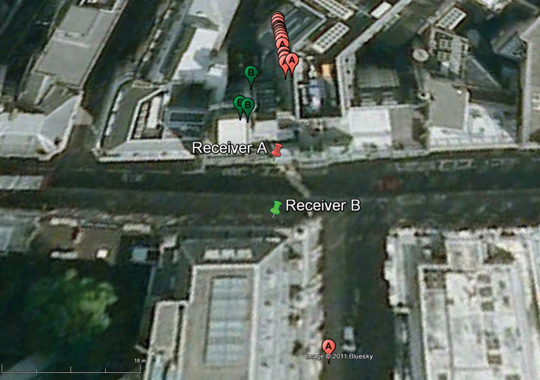
Methodology. Experimental data were collected in a highly built-up area in central London, using two multi-constellation survey-grade GNSS receivers, logging 1 Hz data simultaneously (note that shadow matching does not require two receivers). As shown in Figure 7, they were set up on the north and south sidewalks of Fenchurch Street.
Figure 7. True position of receivers against conventional standard point positioning (SPP) solution. Pins show the true positions and bubbles the SPP solutions; the numbers and colors indicate the receiver.
For the first step of shadow matching, software was used to conduct SPP processing using GPS and GLONASS signals. Only L1 pseudo-ranges were used to acquire an initial user position. It can be seen in Figure 7 that the conventional SPP solutions have significant offsets from the true positions (16–31meters for receiver A and 18–24 meters for receiver B). As receiver B suffers more signal blockage from buildings, it has fewer epochs with four or more satellites in view, so fewer successful SPP GNSS solutions were obtained. Although they have significant offsets in the across-street direction, they are consistent and agree much more with the receivers’ true positions in the along-street direction. This result verifies the assumption made in the shadow-matching algorithm that the accuracy of the along-street SPP positioning solution is much better than in the across-street direction.
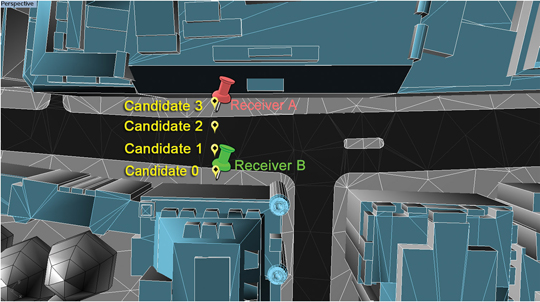
Four candidate user positions were selected using the common along-street position of the conventional SPP solution. They are distributed across the sidewalks and vehicle lanes, on both sides of the street. Figure 8 illustrates this. Note that candidate 3 is the true position of receiver A and candidate 0 is the true position of receiver B.
Figure 8. Candidate user positions (in yellow) and true receiver positions (in red and green) in the shadow matching experimental verification.
Satellite visibility was predicted individually for each of the four positions. Then each was compared with the real data observed from the two GNSS receivers. Figure 8 shows part of the architectural city model of London used to predict the satellite visibility.
Results. The experimental results are shown in three stages: the satellite visibility comparison between prediction and observation, the candidate position scoring function, and the success rate for each candidate location. The primary success criterion is whether the algorithm is able to determine the correct side of the street. A secondary aim is to test whether the algorithm can distinguish between the sidewalk and vehicle lane on the same side of the street.
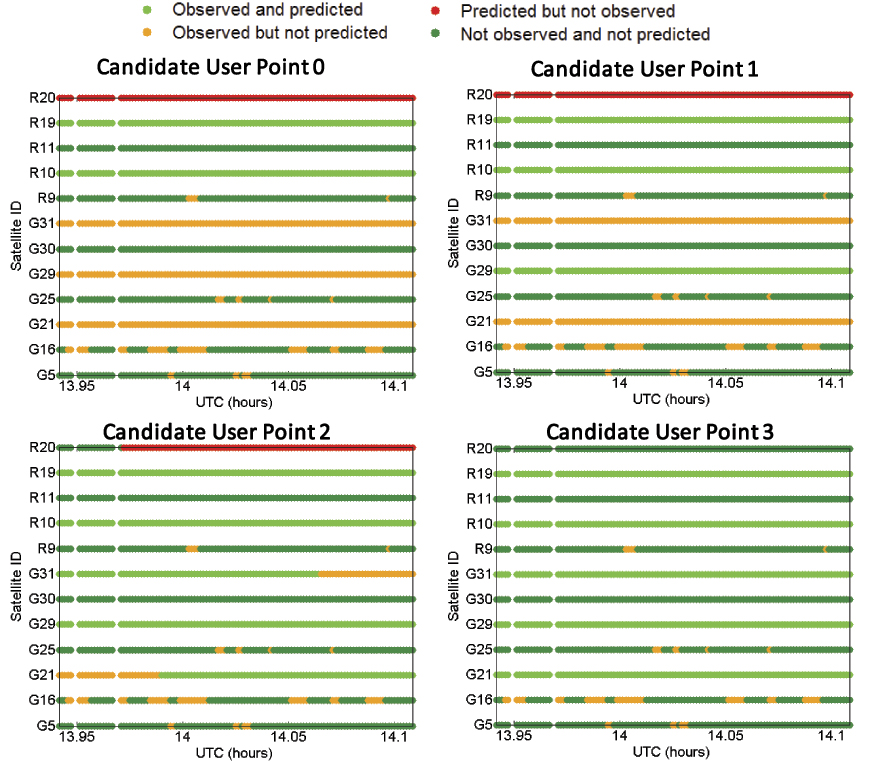
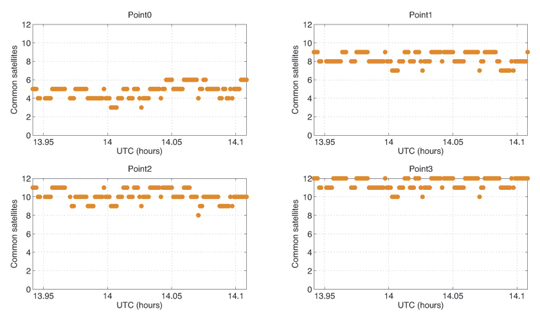
To show the degree of agreement or disagreement between the predicted and observed satellite visibilities, time series for each of the four candidate positions are compared with each of the two receivers’ experimental data. The results are shown in eight graphs. Figure 9 compares data from receiver A for each of four possible user locations. Figure 10 shows the same comparison for receiver B. The time window was from 13:56:30 to 14:06:30 (UTC). G denotes GPS satellites and R refers to GLONASS satellites.
In Figure 9, the green and blue dots indicate an agreement between prediction and observation for the candidate user position, while the orange and red colors represent their disagreement. Thus, a larger number of cases of green and blue indicate a better match between the candidate user location and the observations. Therefore, such a candidate is more likely to be close to the receiver’s true position.
Figures 9 and 10 clearly show that the closer the candidate position is to the true position, the greater the agreement between predictions and observations.
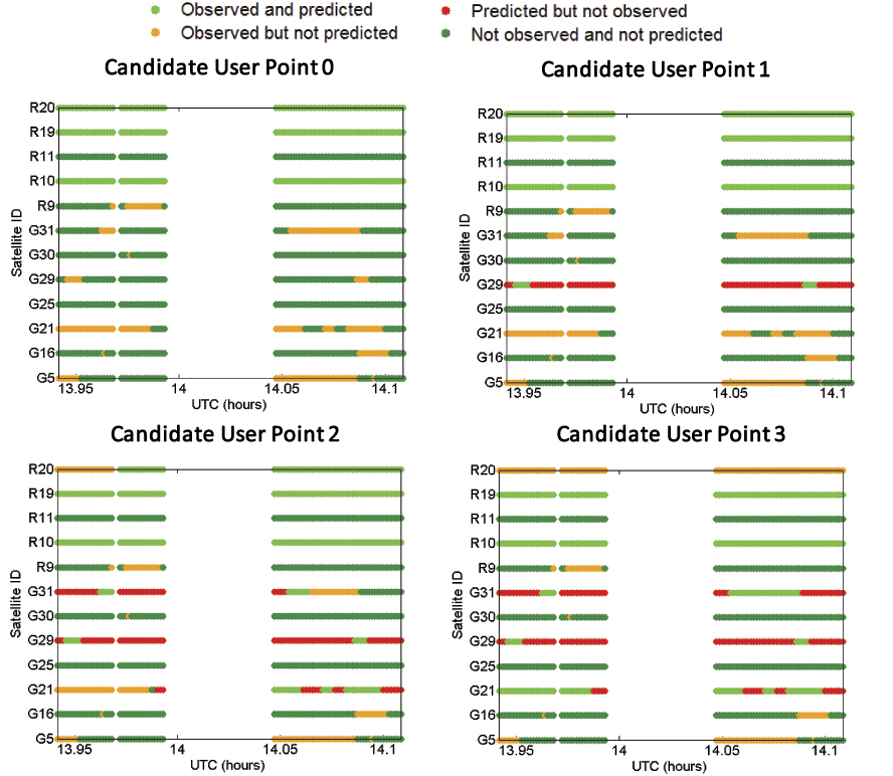
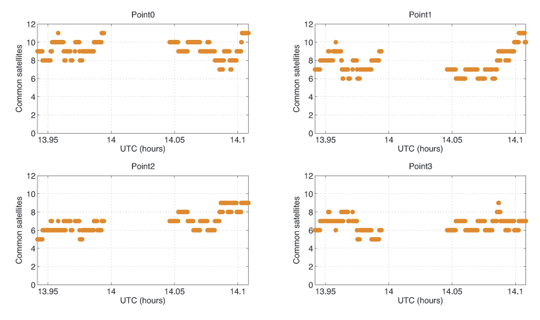
Figure 9. Comparison of satellite visibility between receiver A and candidate user locations (candidate user point 3 is the true position). (Click to enlarge.)Figure 10. Comparison of satellite visibility between receiver B and candidate user locations (candidate user point 0 is the true position). (Click to enlarge.)
Even at the correct candidate location, there is not complete agreement between the observations and predictions. A number of signals were observed but not predicted. These had signal-to-noise levels 8 dB or more lower than the predicted signals and are most likely due to reflection and/or diffraction.
However, shadow matching does not require complete agreement in order to work. In this test, no signals were predicted but not observed at the correct location.
To complete shadow matching, we evaluate each candidate position by summing up the number of satellites common to both the predictions and real observations. Figure 11 and Figure 12 show the results of the summation for receivers A and B, respectively.
Figure 11. Evaluation of similarity — number of common satellites in view between each candidate user point and receiver A.Figure 12. Evaluation of similarity — number of common satellites in view between each candidate user point and receiver B.
It is clear from Figure 11 that among four possible user positions, point 3 is the one with the highest agreement score with the observations from receiver A. As shown in the right-bottom graph, for about half the epochs, visibility predictions for all 12 satellites above the masking angle match the real observations.
As shown in Figure 12, for receiver B, the time series of the agreement score is generally better at the true location (Point 0) than at other points. However, the level of agreement between predictions and observations is not as good as at receiver A‘s location.
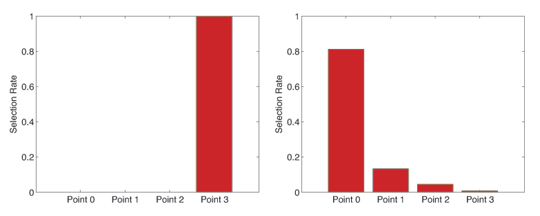
To judge the performance of shadow matching, the selection rate of each of the four candidate user positions for each of the two receivers was computed by dividing the number of times that position was selected by shadow matching by the number of epochs. Where the same score was attained for two or more positions, each position was considered partially selected. For example, if two positions have the same score, then each of them is considered half-selected.
The selection rate results are shown in Figure 13. For receiver A, the shadow matching algorithm correctly indicated the true position among the four candidates 100 percent of the time. This means the algorithm successfully distinguished between the two sides of the street, and further distinguished between a user on the sidewalk and a user in the vehicle lane. For receiver B, the algorithm identified the correct side of the street (Points 0 and 1) 94.65 percent of the time, and the correct location among the four candidates in 81.29 percent of the epochs evaluated.
Taking the average of the two test sites, the correct side of the street was identified 97.3 percent of the time and the correct position from the four candidates 90.6 percent of the time.
Figure 13. Candidate position selection rate for receiver A (left) and receiver B (right).
Practical Implementation
The basic shadow-matching algorithm operates under the assumption that GNSS signals are either directly visible or blocked by a building. However, in reality, signals can also be received via indirect paths due to reflection or diffraction. This was observed at both locations during the tests. As shadow matching seeks the position with the best match, rather than looking for a perfect match, it can tolerate a certain number of these signals and still identify the correct position.
These tests were performed using survey-grade user equipment with a relatively high tracking threshold, so the weakest signals are not observed. Furthermore, the antenna has strong polarization discrimination so exhibits a low gain for reflected signals. However, for shadow matching to be practical, it should also work on a smartphone, which typically combines a high-sensitivity receiver with a linearly polarized antenna, which does not distinguish between direct and reflected signals. Consequently, a smartphone receiver is likely to observe more reflected and diffracted signals.
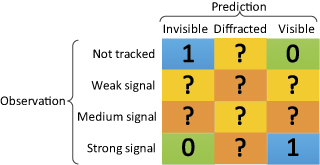
NLOS reflected and diffracted signals are weaker than directly-received signals, so the shadow-matching algorithm could be modified such that only signals received above a certain signal-to-noise threshold are classified as observed. However, this would introduce a new problem: signals received via a direct LOS path but attenuated by a person’s body would be classified as not observed, even though they would be predicted to be visible at the correct location. The same problem would occur where the LOS coincides with a direction in which the antenna is weak. Consequently, to get the best performance from shadow matching, several different categories of observed signal should be considered in the scoring matrix.
Diffraction occurs when the LOS is just inside the building boundary. Therefore, the 3D city model can be used to predict when a diffracted signal may be received. However, it cannot easily be used to predict the signal-to-noise level of that signal because diffraction patterns are complex. Therefore, shadow matching can potentially be improved by adding a third prediction category for diffraction. Figure 14 shows a posssible optimized scoring matrix with values between 0 and 1 for the new categories to be determined empirically, possibly as functions of the measured signal-to-noise. Different scoring matrices may be suited to pedestrian and vehicle applications and to different user equipment designs.
Directly-received signals are also affected by multipath interference. However, this will not normally impact shadow matching as it does not affect whether a signal is received or not.
Shadow matching has been demonstrated using both GPS and GLONASS measurements. The more signals available for shadow matching, the better the expected accuracy and reliability. Thus, the addition of Galileo, Compass, and regional systems, including SBAS, should improve performance. However, further research is needed to determine whether shadow matching using GPS alone is viable. Combining data from multiple epochs should also improve shadow matching performance, particularly where the user is moving.
A practical shadow-matching algorithm must be implementable in real time on a mobile device. Three models maybe considered.
A network-based solution, whereby GNSS measurements are transmitted to a server, which stores the building boundary data, computes a solution and then sends it to the user.
A handset-based solution, where the shadow-matching algorithm is run on the handset, which also stores the building boundary data.
A hybrid model, whereby the shadow-matching algorithm runs on the handset, but the building boundary data is streamed from a server as and when required.
Using stored or streamed building boundaries, fewer than fifty comparison and addition operations are required to calculate an overall shadow-matching score for one candidate position with two GNSS constellations. Therefore, shadow matching may be performed in real time on a mobile device with several hundred candidate positions, where necessary.
Without any data compression, about 300 bytes are required to store a building boundary with a 1° resolution. If a 2×2 meter grid spacing is used for the candidate positions, a 1-kilometer long, 20-meter wide street will contain 5000 grid points, requiring 1.5 MB of data storage. By exploiting the similarities both between neighboring azimuths in the same building boundary and between building boundaries at neighboring grid points, substantial data compression should be achievable; possibly up to a factor of ten.
Therefore, a standard 4 GB flash drive could store building boundary data for 2,500–25,000 kilometers of road network. For comparison, the Greater London metropolitan area contains about 15,000 km of road. However, as shadow matching is only useful in streets where conventional GNSS positioning is poor, the database need only contain building boundary data for these streets, maybe 10 percent of the total. Therefore, it should be practical to preload a mobile device with shadow-matching data for several cities, which could be kept up-to-date via the internet.
An alternative model is to download the building boundary data from a network server as required. A conventional GNSS position solution or Wi-Fi fix should be able to localize position to within 1,000 grid points, requiring 30–300 kB of building boundary data to be downloaded in order to perform shadow matching. This takes less than two seconds using a 3G mobile phone connection with an average data rate.
In practice, shadow matching, would be implemented as part of a wider intelligent urban positioning system. This shadow-matching algorithm assumes that the user is outdoors. Indoor operation, if viable, would require a different approach. It is necessary to determine the error bounds of the conventional GNSS position solution, not only to determine the search area for shadow matching, but decide whether shadow matching should be performed at all. For example, in a completely open-sky environment, shadow matching will fail, but a good position solution will be obtainable conventionally.
There are other ways in which 3D city models could be used to improve GNSS positioning. For example, they could aid identification of NLOS and multipath-contaminated signals and, in principle, even correction of NLOS ranging measurements. Intelligent urban positioning can also incorporate additional sensors, such as odometers on cars and cell phone signals, WiFi and inertial sensors for pedestrian users.
Next Steps
Three potential future lines of research stem from this work: improving the initialization from conventional GNSS positioning, improving of satellite visibility predictions with ambiguous observations, and optimizing the position determination from the shadow-matching scores. In addition, performance will be evaluated over a wider range of environments.
Acknowledgments
The authors gratefully acknowledge Kimon Voutsis for his support with the experiments. This work has been jointly funded by the University College London Engineering Faculty Scholarship Scheme and the Chinese Scholarship Council. This article is based on a paper presented at the 2011 European Navigation Conference in London, organized by the Royal Institute of Navigation.
Manufacturers
The tests used two Leica Viva GS15 GNSS receivers. Leica Geo-office software performed SPP processing of GPS and GLONASS signals. ZMapping Ltd. supplied the London 3D model.
Paul Groves is a member of the academic faculty at University College London (UCL), where he leads the Space Geodesy and Navigation Laboratory’s program of research on robust navigation and positioning. He is also author of the book Principles of GNSS, Inertial, and Multisensor Integrated Navigation Systems.
Lei Wang is a Ph.D. student at UCL. He received a Bachelor’s degree in geodesy and geomatics from Wuhan University in 2010. His current research interests are GNSS-based positioning techniques for urban canyons.
Marek Ziebart is professor of space geodesy, director of the Space Geodesy and Navigation Laboratory, and vice dean for research of UCL Engineering.
In the next two to four years, mobile device location platforms will be able to provide positioning performance that enables emergency call (E911) and location-based services (LBS) with excellent accuracy (5–10 meters) in all locations. We call this accurate everywhere location, and it will be a significant enabler of indoor navigation applications and for even wider adoption of consumer LBS.
In fact, we may eventually forget how we ever lived without it. This technology can enhance our lives by enabling our mobile devices to know precisely where we are at all times. Armed with this information, our devices can behave in a way that suits our specific situation, and they can do this without us having to do anything other than keep the phone with us.
Text and images will get significantly bigger while driving or walking. Facebook notifications can be automatically disabled while at work. Shopping lists can be automatically displayed when approaching a store that has an item on the list. The potential benefits are endless — provided that the privacy issues associated with location are handled appropriately.
GNSS is the superior technology when a mostly unobstructed sky is available, but it can’t deliver accurate position fixes in all environments — at least not at a cost and in a form factor that works for consumer mobile devices. Accurate everywhere location requires some form of advanced hybrid location technology. Because its definition is constantly evolving, the term hybrid can mean different things to different people. This article aims to clear that up.
Here is an overview of the hybrid positioning technology currently used in mobile devices, as well as what is coming in the next two to four years that will enable accurate everywhere location:
GPS + GLONASS. Multiple GNSS technologies are starting to be more common in new chipsets aimed at mobile devices, and assisted-GPS (A-GPS) + A-GLONASS is right around the corner. The benefit from this hybrid GNSS approach is that with more satellites in the sky, devices are likely to receive more line-of-sight signals in challenging environments where a significant portion of the sky is obstructed (like urban canyons). While this might improve performance on a street in downtown Manhattan, it does not help when you are in the middle of a building or in the subway.
Cellular Multilateration + A-GNSS. Mobile devices with CDMA cellular radios have supported hybrid A-GPS + advanced forward-link trilateration (AFLT) for more than a decade. This concept is now being applied to long-term evolution (LTE) devices, with support for A-GNSS + observed time difference of arrival (OTDOA) being written into the 3GPP standards. Both AFLT and OTDOA are forms of cellular multilateration, which means that devices can make measurements of relative timing offsets between multiple downlink cellular signals, and those measurements can be used in a hyperbolic multilateration formula to compute a position (one signal acts as reference and hyperbolic intersection of 2+ signals are used for position).
Does this sound familiar? It happens to be very similar to GNSS location computation, so it is possible to combine measurements from cellular signals and measurements from GNSS satellites to compute a hybrid position. For example, 2 satellites + 2 cellular measurements can be combined to compute a position, which makes this technique very attractive. Although it is used for both E911 positioning in North America and LBS worldwide, this technology will become even more widespread as LTE adoption increases.
A-GNSS + Wi-Fi Positioning + eCID. Many popular smartphones today support Wi-Fi positioning and enhanced cell ID (eCID) in addition to A-GNSS. This hybrid solution allows coarse positioning in indoor environments where A-GNSS does not work. Solutions for Wi-Fi and eCID positioning are currently very fragmented and proprietary. However, this is the reason you are able to get a semi-accurate position fix on your Android or iOS mobile device when GNSS satellites are impossible to measure (many other devices support this as well). These technologies are going to provide more accurate information as time goes on, but we don’t believe they will achieve accurate everywhere location on their own.
A-GNSS + Wi-Fi Positioning + Cellular Positioning + Sensors. You might have guessed it, but we think accurate everywhere location will be enabled by a combination of all the above hybrid techniques plus one more important technology: sensors. Integrated sensors like accelerometers, magnetometers, and barometers enable devices to sense changes in direction, orientation, and elevation. Given an accurate starting location (for example, GNSS position fix), sensors can track location accurately for several minutes (and this will continue to get better). Location error will accumulate over time, but this can be minimized when Wi-Fi, cellular, and GNSS positioning are used in conjunction to constrain the error. Furthermore, barometers can be used to track elevation changes, thereby allowing devices to know exactly what floor of a building a user is on. Other technologies, or signals of opportunity, may be used in the future to further improve performance, but we think this mix of A-GNSS, Wi-Fi, cellular, and sensor positioning is the key to accurate everywhere location in mobile devices.
With substantial R&D dollars being spent now, and standardized testing for hybrid positioning emerging this year, our best estimate is that the accurate everywhere technology will become commercially widespread by 2015.
Brock Butler is director of Spirent’s Wireless Location Technologies, part of a team that has made major contributions to development of the LBS standards in the 3GPP: Spirent filled the editor and rapporteur roles for the TS 51.010 and TS 34.171 A-GPS Terminal Conformance Specifications, as well as the editor role for the Enabler Test Specification for SUPL in the OMA. Butler holds a BSc in electrical engineering from Villanova University.