Tag: personal navigation

  • Qualitative Motion Analysis: INS/GNSS in Care-Giving Applications

    By Pere Molina, Ismael Colomina, Markus Troger, Bernhard Hofmann-Wellenhof, and Carmen Aguilera

    A pocket tracker for elderly people and Alzheimer’s patients consists of a smartphone using GNSS, WLAN, RFID, and GSM for basic positioning, communication channels, and an accelerometer triad for collapse and motion detection. It seeks to determine not only the quantitative where but the qualitative how: has the user lost balance, fallen, or ceased moving?

    Accidents involving senior citizens and handicapped people have increased dramatically over recent years. Elderly people, especially those with Alzheimer’s disease, often get in situations where they need assistance due to disorientation or after a physical collapse. The Infrastructure Augmented Galileo/GNSS Receiver for Personal Mobility (IEGLO) project incorporates seamless indoor and outdoor positioning and emergency call services for healthcare applications.

    Positioning is very important in such applications, but this target group has another key requirement: 30 percent of elderly people fall at least once per year. Furthermore, falls are responsible for 70 percent of accidental deaths in persons more than 75 years old. 71 percent of falls had physical consequences: 7.7 percent caused broken bones, and 21.7 percent needed medical aid. Moreover, 64 percent of fallers feared of falling again.

    IEGLO seeks to establish automatic and reliable fall detection, through a personal device that can indicate a loss of balance of the carrier. This navigation enhancement — traditional orientation plus information about the personal behavior — has been called qualitative motion analysis (QMA).

    System Overview

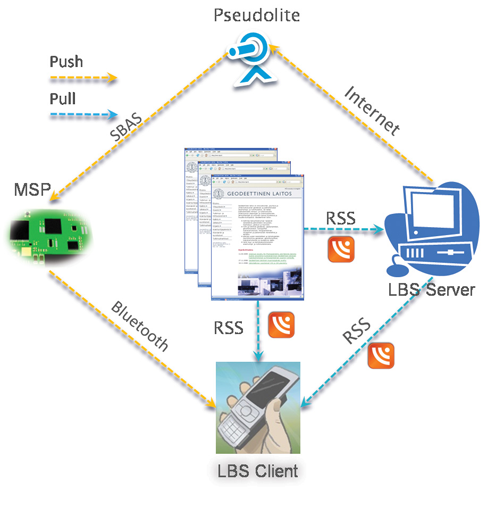
    The IEGLO system concept, shown in Figure 1, consists of three parts: a mobile unit with an external sensor unit; a communication gateway/positioning server (CG/PS), and a service center.

    figure_col_1. Pere Molina, Ismael Colomina, Markus Troger, Bernhard Hofmann-Wellenhof, and Carmen Aguilera
    Figure 1. Overview of Infrastructure-Augmented Galileo/GNSS Reciever (IEGLO) system concept.

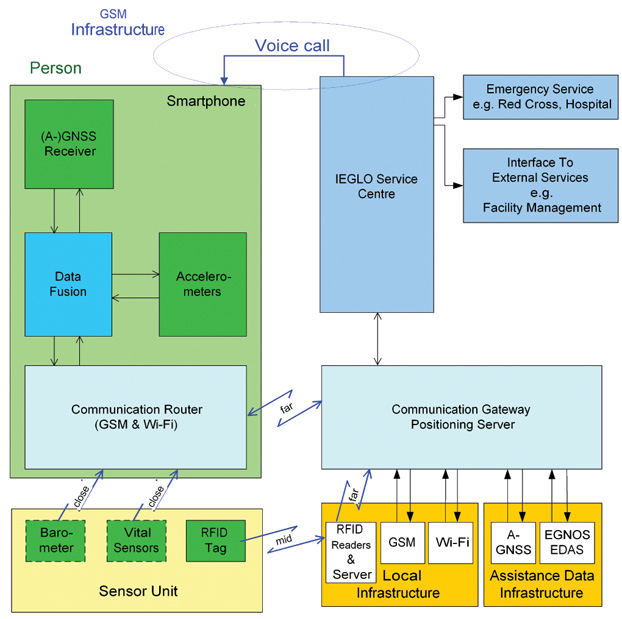
    A commercial-off-the-shelf smartphone with integrated sensors and an RFID transponder represent the components of the mobile unit located at the monitored person. The mobile device cannot be fixed to the body in an precise initial attitude, but must move along with the person in order to capture his/her movements. Distress situations are detectable and alert messages can be generated manually or automatically at the mobile unit.

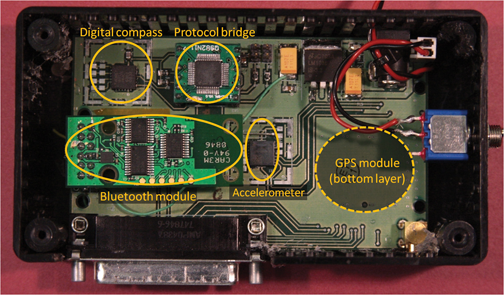
    The mobile unit includes a GPS receiver able to process assisted-GPS data. A Wi-Fi adapter provides additinal communication when Wi-Fi access points are available, or if a determined access point is self-monitored. However, the main communication function in the mobile unit is provided by the GSM module. Both Wi-Fi adapter and GSM module, are also used for positioning purposes. An orthogonal accelerometer triad is integrated in the device and provides accelerometer measurements. For near-field communication, a Bluetooth interface is available. Through it, other sensors such as barometers or vital-signs sensors could be polled.

    The RFID transponder forms together with the smartphone the mobile unit. RFID information including the transponder ID is sent to an RFID reader when the person passes by an RFID gate. Several pieces of RFID data are gathered on an RFID server, which sends the information necessary for positioning to the CG/PS.

    The CG/PS is responsible for the position calculation. Through a TCP/IP interface, it recieves sensor data from the mobile device and processes it with additional reference information from Wi-Fi, GSM, and RFID positioning. A filter/fusion module calculates one integrated IEGLO position from the different determined positions. That position, together with quality information, is transmitted to the service center. The CG/PS also instantly forwards alarm and status messages from the mobile device to the service center.

    The service center forms the interface between IEGLO operator and users. It stores databases of position information and personal information. The geo-database contains all information about the positions of the monitored person. The personal database contains user information, emergency contacts, and nursing staff.

    The user interface at the service center is Internet-based. A standard desktop PC with web browser relays alarm messages from the different mobile devices and manages user data and nursing staff information. In cases of alarm, the event is instantly displayed via the user interface. Information such as body behavior, position, and location of the user are visualized for the operator, who can then start the alarm chain, which includes as a first measure contacting the mobile user. As further measures, emergency services can be contacted and guided to the person in distress.

    Quantitative and Qualitative Nav

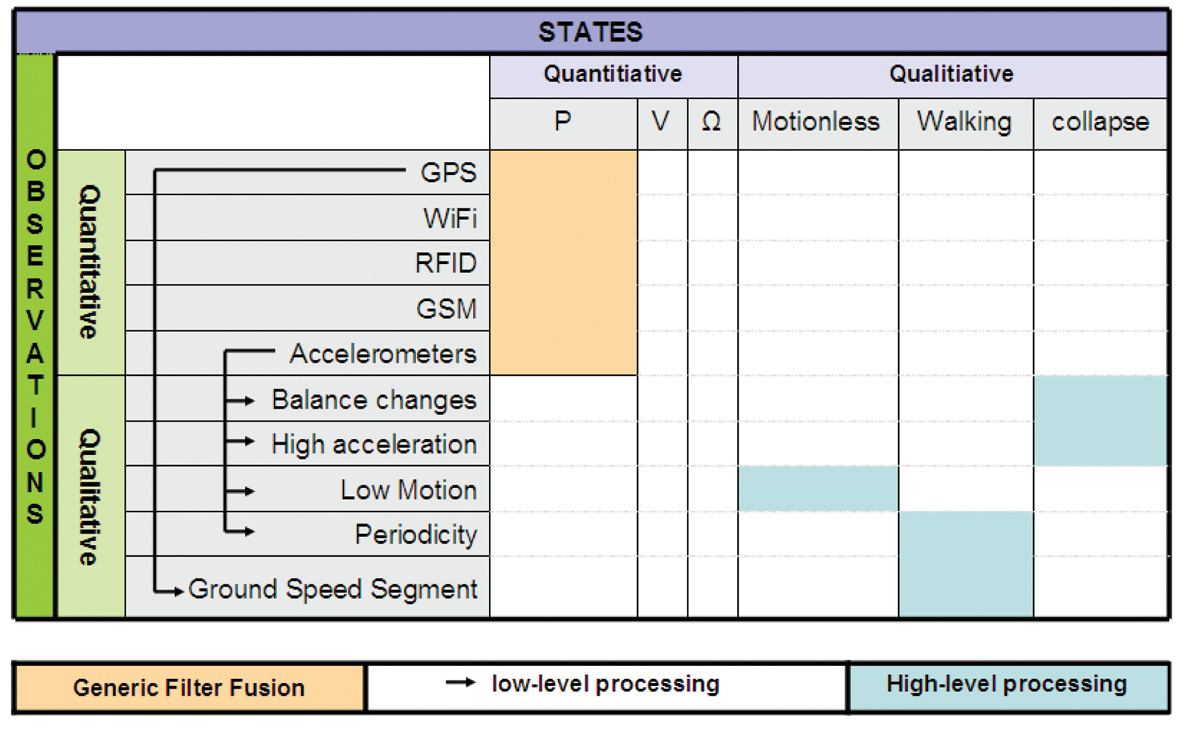
    In this article, non-conventional INS/GNSS integration refers to classical, or quantitative navigation, combined with what we have named qualitative navigation. Roughly speaking, quantitative navigation provides the where, while quantitative navigation furnishes the how. Qualitative navigation was a key requirement for IEGLO, as the patient’s primary information of interest is her or his safety status. Figure 2 summarizes the relationships between quantitative and qualitative observations.

    Source: Pere Molina, Ismael Colomina, Markus Troger, Bernhard Hofmann-Wellenhof, and Carmen Aguilera
    Any type of navigation, particularly quantitative navigation, is characterized by a navigation space. For example, in INS/GNSS navigation the navigation space N or state space is P × V × Ω (the set of position, velocity and attitude vectors) and the navigation function

    T → P×V×Ω

    t → (p,v,ω)

    maps the time t into a particular navigation state (p(t),v(t),ω(t)). Typically,

    T ⊂ R, P = R3, V = R3 and Ω = [0,2π]3. It is well known that there are various choices for the navigation space, from the simple point navigation where N = P to the complex N = P × V × Ω × B, where B includes time-dependent calibration and other ancillary states.

    Qualitative navigation differs from classical quantitative navigation in the navigation space and, clearly, in the navigation function T → N. To illustrate the idea, let us compare and describe the classical quantitative navigation space P × V × Ω with one possible P′ ×V′ × Ω′ qualitative navigation space. While for quantitative navigation we have

    tT ⊂ R,

    p = (x,y,z) ∈ P ⊂ R3

    v = (vx , vy , vz) ∈ V ⊂ R3

    ω = (ωx, ωy, ωz) ∈ Ω = [0,2π]3,

    for qualitative navigation we might have

    tT ⊂ R,

    p′P′ = {hospital, home, park}

    v′V′ = {not moving, walking, running}

    ω′ ∈ Ω′ = {standing, lying, sitting}.

    Quantitative navigation is not just about providing estimations of the navigation states; the stochastic figures describing the precision of the estimated states are also provided. Thus, quantitative and qualitative navigation spaces are extended in dimension to include the precision space component, namely ΣP ×V ×Ω and ΣP ×V ′ ×Ω′ .

    Navigation theory claims that navigation states might be estimated from observations through the appropriate dynamic and static models (differential and ordinary stochastic equations). Such a statement applies for both proposed navigation approaches, quantitative and qualitative. Thus, the relation model-observation-parameter can be written as l → h(l, X ) for the quantitative case, where:

    • the quantitative observations l are usually obtained by performing the navigation sensor measurements (INS, GNSS, and so on).
    • X P × V × Ω × ΣP×V×Ω
    • h represents the model that relates l with X (INS mechanization equations, GNSS position models, and so on)

    and for the qualitative case, the relation can be written as f → q(f,M), where:

    • the qualitative observations f are obtained from quantitative observations by performing low-level processing.
    • MP′ × V′ × Ω′ × ΣP′×V′×Ω′
    • q represents the model that relates f with M, based on high-level processing.

    In the IEGLO project, this theoretical approach has been materialized by defining the appropriate quantitative and qualitative observation and navigation spaces.

    Quantitative Navigation

    Quantitative navigation in IEGLO is based on positioning; thus, no quantitative velocity or attitude determination is performed. This leads to a very specific navigation space:

    tT ⊂ R

    p = (x,y,z) ∈ P ⊂ R3,

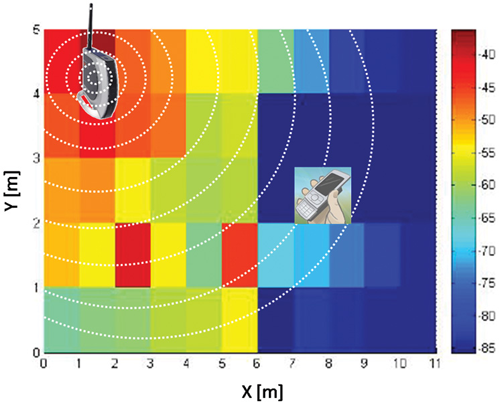
    IEGLO uses different positioning technologies for indoor and outdoor positioning; GPS serves as the main positioning method outdoors, while Wi-Fi and RFID are used primarily for indoor positioning.

    A GPS position augmentation service has been developed to augment GPS-only position solutions using European Geostationary Navigation Overlay Service (EGNOS) information acquired via the local area network and the Internet. The augmentation service is useful for receivers which are not capable of processing EGNOS data, but also for receivers which cannot receive EGNOS signals due to signal shadowing by urban canyons or the like. In this case, the GPS-only position is transmitted to the augmentation server, which corrects the position solution and retransmits the EGNOS Data Access System/signal-in-space through the Internet (EDAS/SiSNeT)corrected position. Figure 3 shows the functional modules of the augmentation server. EDAS provides access to the wide-area differential correction of EGNOS. SiSNeT is a free service that provides EGNOS widea-rea differential corrections and integrity information over the Internet.

     Figure 3. Position augmentation server functional modules.  Source: Pere Molina, Ismael Colomina, Markus Troger, Bernhard Hofmann-Wellenhof, and Carmen Aguilera
    Figure 3. Position augmentation server functional modules

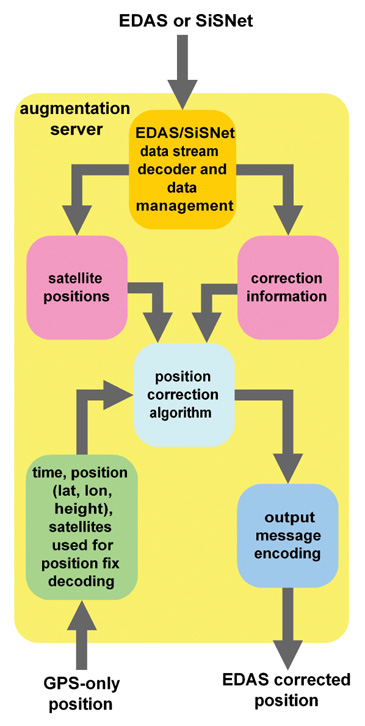
    The augmentation server accesses EGNOS information from EDAS or SiSNeT, decodes the data, and stores it in a database. As a backup solution, if EDAS cannot be accessed, the augmentation server can also interface to an EGNOS receiver to decode the EGNOS signal in space. The augmentation server is provided with ephemeris and ionospheric information from EDAS/SiSNeT. The GPS position is received from the correction requesting unit together with its time and used satellites. It is corrected at the augmentation server and retransmitted back to the requesting unit.

    From the mobile device, sensor information is transmitted to the CG. The sensor data is processed into positioning messages with additional reference information for Wi-Fi, RFID, and GSM positioning. A generic filter method determines a reliable IEGLO position from the different determined positions, which is transmitted to the service center together with the accuracy and time information. The choice of the position depends on its accuracy and its age.

    Qualitative Navigation

    Positioning is, indeed, the main navigation component in IEGLO. A main goal of the project is to be able to contact a person in case of an emergency anytime, anywhere, and thus position is sufficient. But beyond this sufficiency, a broader navigation concept can be developed using two of the available sensors in the IEGLO system: the GPS receiver and the 3-axial accelerometer. As described earlier, these two sensor measurements (quantitative observations) would yield some motion features of the person (qualitative observations) with which to estimate the motion context of the person (qualitative states). This is a two-step processing: low-level and high-level.

    Low-Level Processing: from quantitative to qualitative observations. As depicted in Figure 2, the qualitative observations used in IEGLO are: ground speed segment, balance changes, high accelerations, low motion, and periodicity. These qualitative observations are low-level processed in two steps. First, robust and non-robust statistical estimators (based in order statistics like the median, median absolute deviation normalized (MADN), α-trimmed mean and deviation, or least-squares like the mean, standard deviation, respectively), and deterministic analyzers (such as the fast Fourier transform (FFT), velocity transformation (VT), equidistant maxima search (EMS) are applied to estimate some intermediate values, like the first and second statistical moments, maximum and minimum values, and FFTs. Secondly, these intermediate quantities are evaluated using propositional calculus to decide if a situation is finally detected. All the qualitative observations’ extraction in IEGLO are described as follows.

    On one hand, GPS positions are used to compute the ground speed segments of the device. That is, given a sample of GPS positions P = {(ti , pi )}Ni=1 , the ground speed sample is extracted through a finite difference-based technique called velocity transformation (VT). Thus, a speed sample S = {(ti, si = ||pi − pi-1||ground)}Ni=2 is obtained. In addition, this sample is statistically through robust and non-robust estimators yielding E(S) and, thus, deriving the person’s ground speed profile.

    On the other hand, accelerometers are the key sensors to enable qualitative observation computation to later derive a qualitative attitude, that is, the detection of a collapse. Accelerations are involved in the computation of four types of qualitative observations, and its use is based on the following three statements:

    • Independence of any initial attachment or placement of the device on the body is fundamental to ensure a loose and easy start-up of the device.
    • Independence of any sensor error-calibration should not be an issue.
    • Balance is the key observable to perform collapse detection.

    First, balance changes are extracted from accelerometers as they sense the gravity vector projection on each axis, and any change on these projections is interpreted as balancing the device. Indeed, balance is not exactly attitude: the gravity vector defines a normal plane, called equilibrium plane, which is a 2-degree-of-freedom object. Nevertheless, the left degree-of-freedom not sensed in this approach corresponds to the heading changes, which do not contribute to collapse situations. Therefore, given a 3-axis acceleration sample AN = {(ti , aix , ai sup>y , aiz)}Ni=1, an analysis is performed using robust and non-robust statistical estimators, as monitoring the first and second statistical moments of this sample enables detection of variations on the gravity distribution among the axes. Finally, thresholding is performed on the propositional calculus to obtain balance change extraction.

    Second, given an acceleration sample AN , high accelerations are extracted using the distance operator di = || aiE {AN} || and a threshold-based propositional calculation.

    Third, accelerations are also used for low-motion detection. Given an acceleration sample, AN, first and second moments of the acceleration norm sample (E( || AN || )) and V ar(AN ) = E(( || AN || − E( || AN || ))2)) are computed and evaluated through threshold-based propositional calculations to detect norm-wise low-acceleration profiles.

    Finally, accelerations are the key observations to perform periodicity detection. Given a set of accelerations AN, two deterministic analyzers are used to extract periodicity patterns: EMS and FFT. The first technique enables computing j local maximum values, one for each sub-sample ANj, j = 1…m, where AN = Umj=1 ANj. Evaluating the j local maximum values interdistance along time against some thresholds enables periodicity detection. The FFT analysis complements the periodicity detection achieved by the EMS technique.

    In addition to the extraction itself, a figure of merit (FOM) is computed for each qualitative observation. Consisting of a rational number between 0 and 1, it is an empirical magnitude describing how many extractions have been done for a certain observation in relation to the maximum possible amount of extractions. This figure enables a reliability computation similar to a discrete probability function. Nevertheless, at this stage of development we do not claim completeness and therefore do not state that FOM computation is a discrete probability function.

    High-Level Processing: from qualitative observations to qualitative states. So far, one may think that the navigation requirements are already fulfilled: a person can be localized, in a seamless indoor and outdoor way, and thus can be feasibly reached if needed. But IEGLO seeks to enhance this navigation concept to provide contextual information about the person, and eventually activate automatic warning messages in case of undesired motion behavior. To do this, the qualitative navigation concept has been developed by analogy of the quantitative navigation: [qualitative or quantitative] observations are used to estimate [qualitative or quantitative] states.

    The qualitative states in IEGLO are:

    t ∈ R

    V′ ∈ {motionless, walking}

    Ω′ ∈ {collapse}

    This particular choice of the navigation state is fully driven by the user requirements. With the estimation of the collapse and motionless states, IEGLO can provide the user with an automatic distress detection system. These two states specially represent the type of undesired behaviors that IEGLO seeks to detect and respond to. In addition to the distress states, walking is useful to support the pedestrian navigation concept, which is based on single point navigation.

    As can be seen in Figure 2,

    • collapse estimation is performed by means of the balance change and high-acceleration qualitative observations
    • motionless estimation is performed by means of the low-motion qualitative observation
    • walking estimation is performed by means of the ground-speed segment and periodicity qualitative observations

    In all cases, the weighted combination of the qualitative observation FOMs is performed to determine the qualitative state FOM, as a degree of truth. The role of the FOMs is crucial when generating automatic alarms in case of eventual distress situations. The more accurate the FOM, the fewer false alarms are generated.

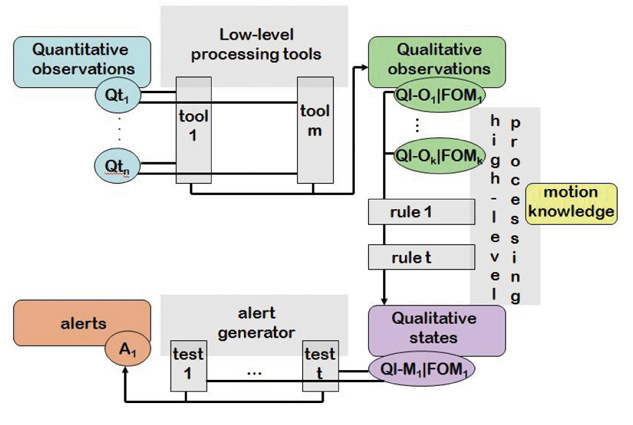
    Note that in this high-level processing approach, every model q(f,M) must be fed by values that are external to the process. These values help to fine-tune the adjustment of the model to the user carrying the device. In pedestrian navigation, values like step strength and time-to-step play a role in the walking model and fully depend on the individual’s way of walking. In IEGLO, the knowledge of the individual user is a key piece to properly perform qualitative-state estimation. The IEGLO approach is implemented architecturally to allow to input and removal of data about a specific individual’s motion habits. Figure 4 depicts the architecture of the kinesic behavior detection (KBD) module, the software platform where these qualitative navigation concepts have been implemented.

    figure_col_6  (Source: Pere Molina, Ismael Colomina, Markus Troger, Bernhard Hofmann-Wellenhof, and Carmen Aguilera)
    Figure 4. IEGLO KBD module architecture.

     Position Augmentation Tes

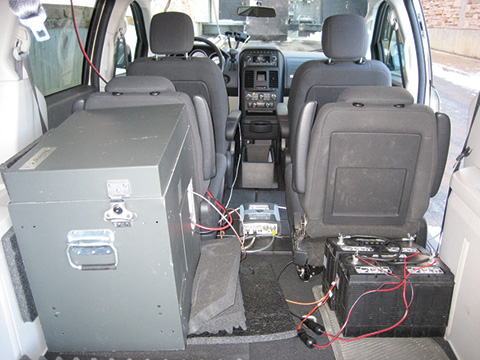
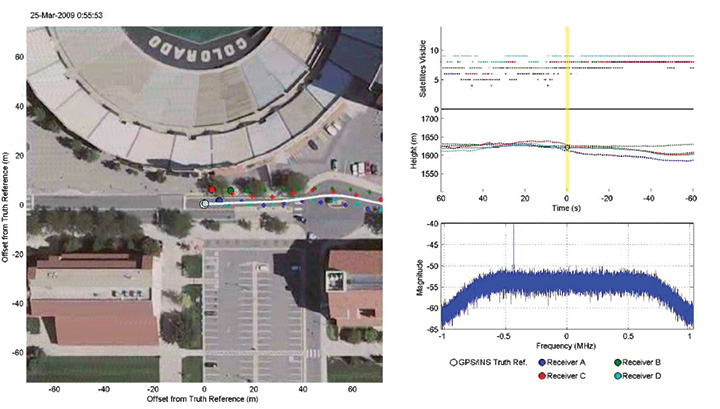
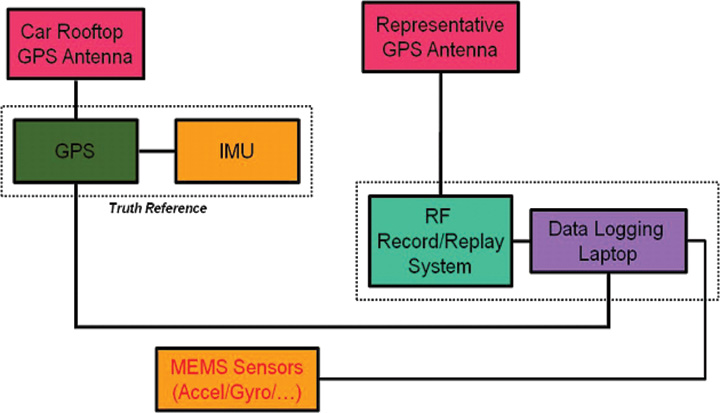
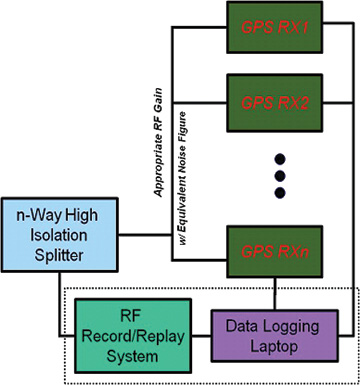
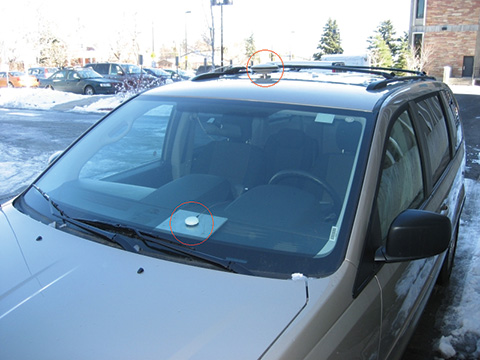
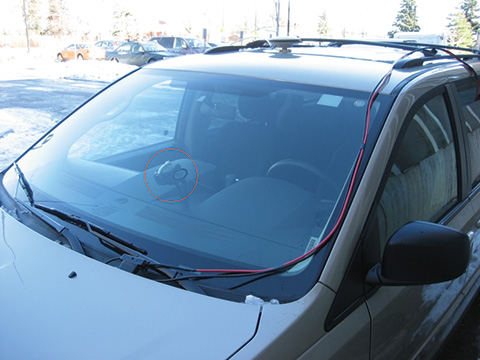
    To test the augmentation service, a test user terminal (TUT) has been specified and assembled. The TUT uses two identical GPS/EGNOS receivers, interfaces directly with the augmentation server, and processes the position response. One receiver has been configured to output GPS-only position information, the other to use EGNOS corrections for the position computation. The position of the GPS-only receiver was forwarded to the augmentation server. The EDAS/SiSNeT corrected position information was routed to the EDAS file database. In this manner, three different calculated positions of one point per epoch are available: GPS-only, GPS/EGNOS, and GPS/EDAS/SiSNeT (see Figure 5).

     Figure 5. Modules of Test User Terminal.   (Source: Pere Molina, Ismael Colomina, Markus Troger, Bernhard Hofmann-Wellenhof, and Carmen Aguilera)
    Figure 5. Modules of Test User Terminal.

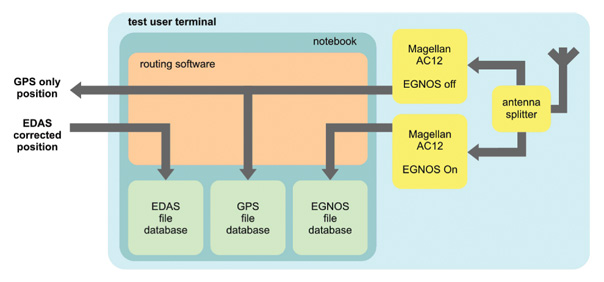
    A low-cost patch antenna providing single-frequency (L1) output was used for the tests, connected to an antenna splitter. A notebook computer provided an interface to a GSM/GPRS module and to the receivers.

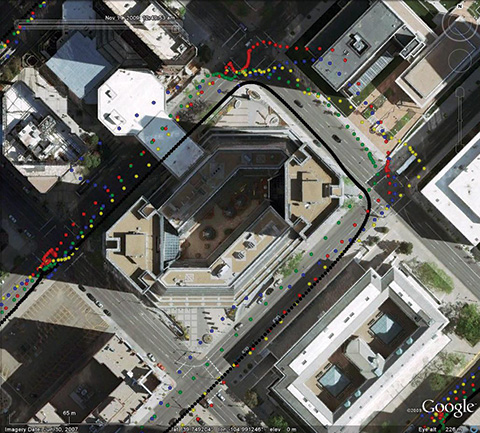
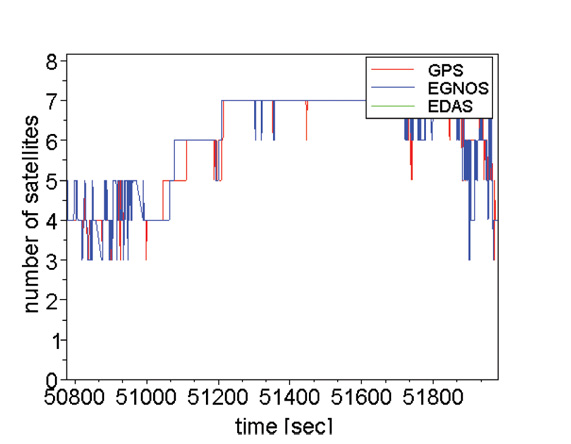
    An April 2010 test was conducted in the area surrounding an assisted living home. Figure 6 shows the number of satellites used for positioning during the measurement campaign. The area around the building was very hilly, so satellite signals were exposed to shadowing effects at the beginning and at the end of the measurements. The middle of the campaign had good satellite visibility.

     Figure 6. GPS/EGNAS/EDAS: Number of satellites.   (Source: Pere Molina, Ismael Colomina, Markus Troger, Bernhard Hofmann-Wellenhof, and Carmen Aguilera)
    Figure 6. GPS/EGNAS/EDAS: Number of satellites.

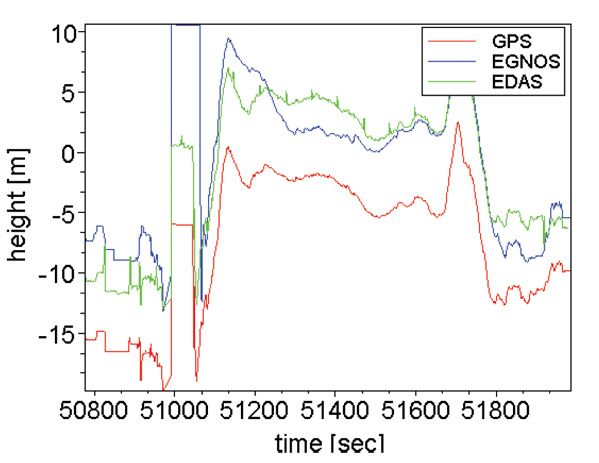
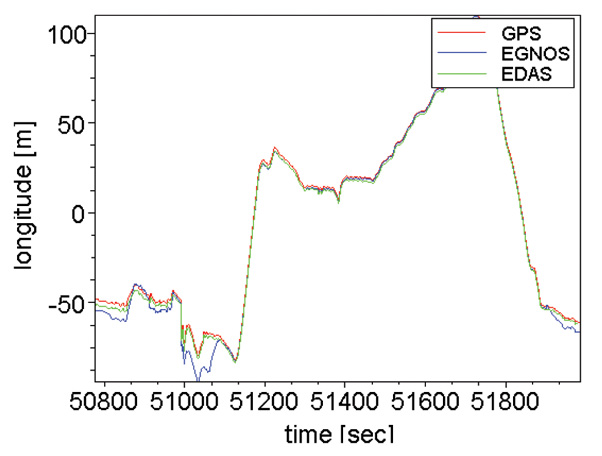
    Figures 7–11 show the user trajectory during the dynamic measurement. For better readability, longitude, latitude, and height values were reduced by the mean value of the corresponding coordinate. Therefore, the zero line in the y-axis of each plot symbolizes the mean value of the whole measurement. The same configuration is used for the five plots.

    Figure 7 demonstrates the good performance of the augmentation server concept regarding the height solution. The ionospheric delay, which can be corrected with the EGNOS signal, particularly influences the height component of the position. Thus, the potential of the EDAS/SiSNeT-based correction is seen in the height plot.

    Figure 7. GPS/EGNOS/EDAS: Height plot.   (Source: Pere Molina, Ismael Colomina, Markus Troger, Bernhard Hofmann-Wellenhof, and Carmen Aguilera)
    Figure 7. GPS/EGNOS/EDAS: Height plot.

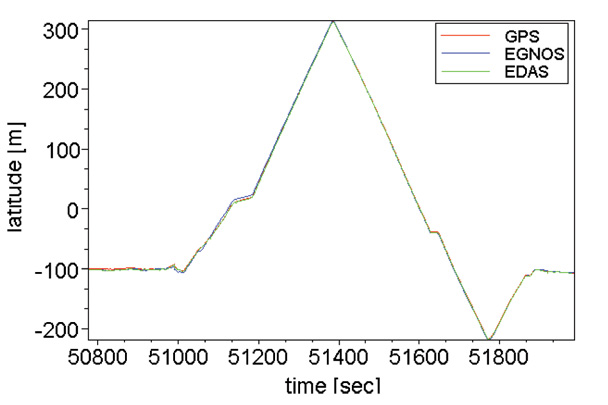
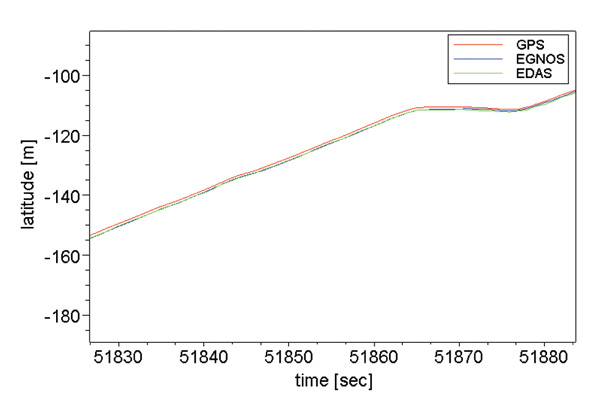
    Figures 8 to 11 show the longitude and the latitude of the different solutions. Two plots of each coordinate were used: the first one shows the coordinates during the whole measurement, and the second one emphasizes the time interval between second 51820 and second 51890. Here, the EGNOS and EDAS/SiSNeT solution are very similar. In some other parts of the measurement, the EDAS/SiSNeT solution is closer to the GPS-only solution.

     Figure 8. Longitude overview for the GPS, GPS-EGNOS and GPS-EDAS position solutions.   (Source: Pere Molina, Ismael Colomina, Markus Troger, Bernhard Hofmann-Wellenhof, and Carmen Aguilera)
    Figure 8. Longitude overview for the GPS, GPS-EGNOS and GPS-EDAS position solutions.
     Figure 9. Longitude zoom for the GPS, GPS-EGNOS and GPS-EDAS position solutions.   (Source: Pere Molina, Ismael Colomina, Markus Troger, Bernhard Hofmann-Wellenhof, and Carmen Aguilera)
    Figure 9. Longitude zoom for the GPS, GPS-EGNOS and GPS-EDAS position solutions.
    figure_col_12   (Source: Pere Molina, Ismael Colomina, Markus Troger, Bernhard Hofmann-Wellenhof, and Carmen Aguilera)
    Figure 10. Latitude overview for the GPS, GPS-EGNOS and GPS-EDAS position solutions.
     Figure 11. Latitude zoom for the GPS, GPS-EGNOS and GPS-EDAS position solutions.   (Source: Pere Molina, Ismael Colomina, Markus Troger, Bernhard Hofmann-Wellenhof, and Carmen Aguilera)
    Figure 11. Latitude zoom for the GPS, GPS-EGNOS and GPS-EDAS position solutions.

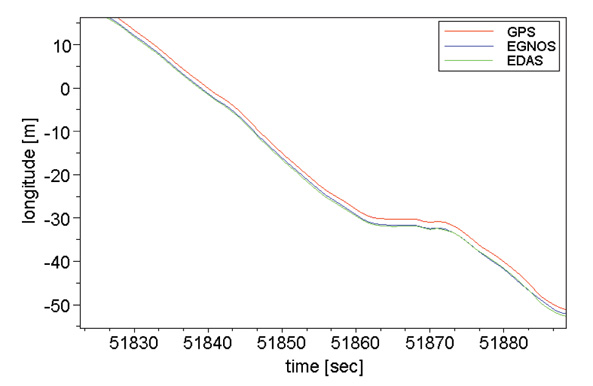
    Note that during the whole test, the EDAS/SiSNeT solution was determinable, meaning that even during blockage of the EGNOS signal-in-space, a position augmentation was possible. However, the quality of position augmentation always depends on the quality of the GPS-only position. The test shows a diverse image of the performance of the augmentation server.

    • The functionality of the augmentation server could be shown.
    • All positions transmitted to the augmentation server have been processed and transmitted back in corrected form.
    • Some measurements clearly show the benefit of position correction of the augmentation server, where the EDAS/SiSNeT solution tends to the EGNOS solution
    • Some measurements show a better height solution than the GPS solution (Figure 7).
    • The quality of the augmented position strongly depends on the quality of the GPS-only position.
    • Any receiver only capable of processing GPS but not of EGNOS would benefit from the augmentation server concept.

    Collapse, Motionless, Walking Tests

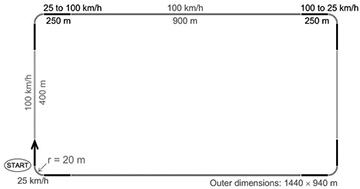
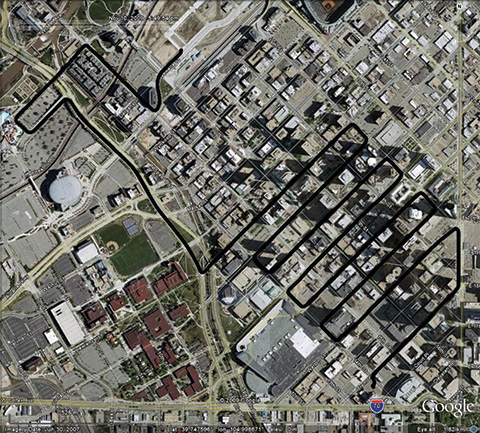
    To validate the proposed qualitative navigation approach proposed, a test pattern was specially designed to test the KBD module for two different purposes. On one hand, and by definition, the test pattern should represent all the situations in which detection must be tested, that is, the defined qualitative states: collapse, motionless, and walking. At the same time, the test design should provide means to prove the KBD module resilient against these issues:

    False alarms: Users of similar systems have stated that false-alarm generation is the key problem of automatic-detection-based systems of any kind. False alarms are generated when a situation is misunderstood and treated as a undesired situation, causing the system to generate an alarm. In the IEGLO case, some situations such as sitting, walking up or down stairs, or picking up the phone are, motion-wise, similar to the collapse situation. Therefore, the test design includes sitting and picking up the phone, to assess KBD module robustness against false alarms.

    Initial Attitude. Many pedestrian navigation systems are constrained by the initial placement and/or attachment to the user. Some systems integrates gyroscopes, and therefore their initial attitude with respect to a person-relative frame needs to be known quite precisely. Other systems based on step detection and gait analysis rely on foot-mounted or hip-mounted accelerometers. The IEGLO approach, driven by the user needs of elderly people and Alzheimer’s patients, cannot assume such constraints. An inconspicuous, yet at the same time, familiar system is desired, and no specific initial attitude is required. Therefore, carrying the phone in a pocket (which turns out to be a preferred placement) shall be sufficient, and its actual initial attitude shall not be relevant.

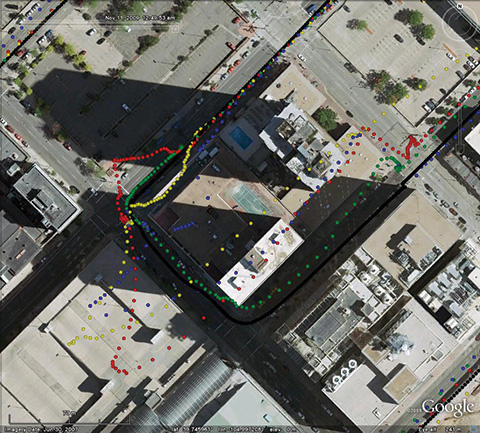
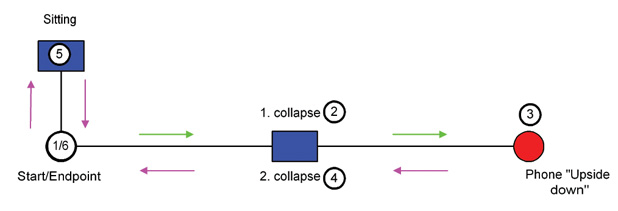
    The test design shown in Figure 12 therefore consists of walking to Point 2, where a collapse situation and a motionless period lying on the floor are performed. After standing up, those actions are duplicated to reach Point 3. There, after standing up, the phone is taken out of the pocket and replaced upside down with respect to the previous attitude. The sequence is repeated to return to the start. Finally, the design leads to Point 5, where a sitting action is performed. After standing up, the end point is reached, and the phone is taken out of the pocket.

     Figure 12. Sample correlation function showing two peaks.   (Source: Pere Molina, Ismael Colomina, Markus Troger, Bernhard Hofmann-Wellenhof, and Carmen Aguilera)
    Figure 12. Sample correlation function showing two peaks.

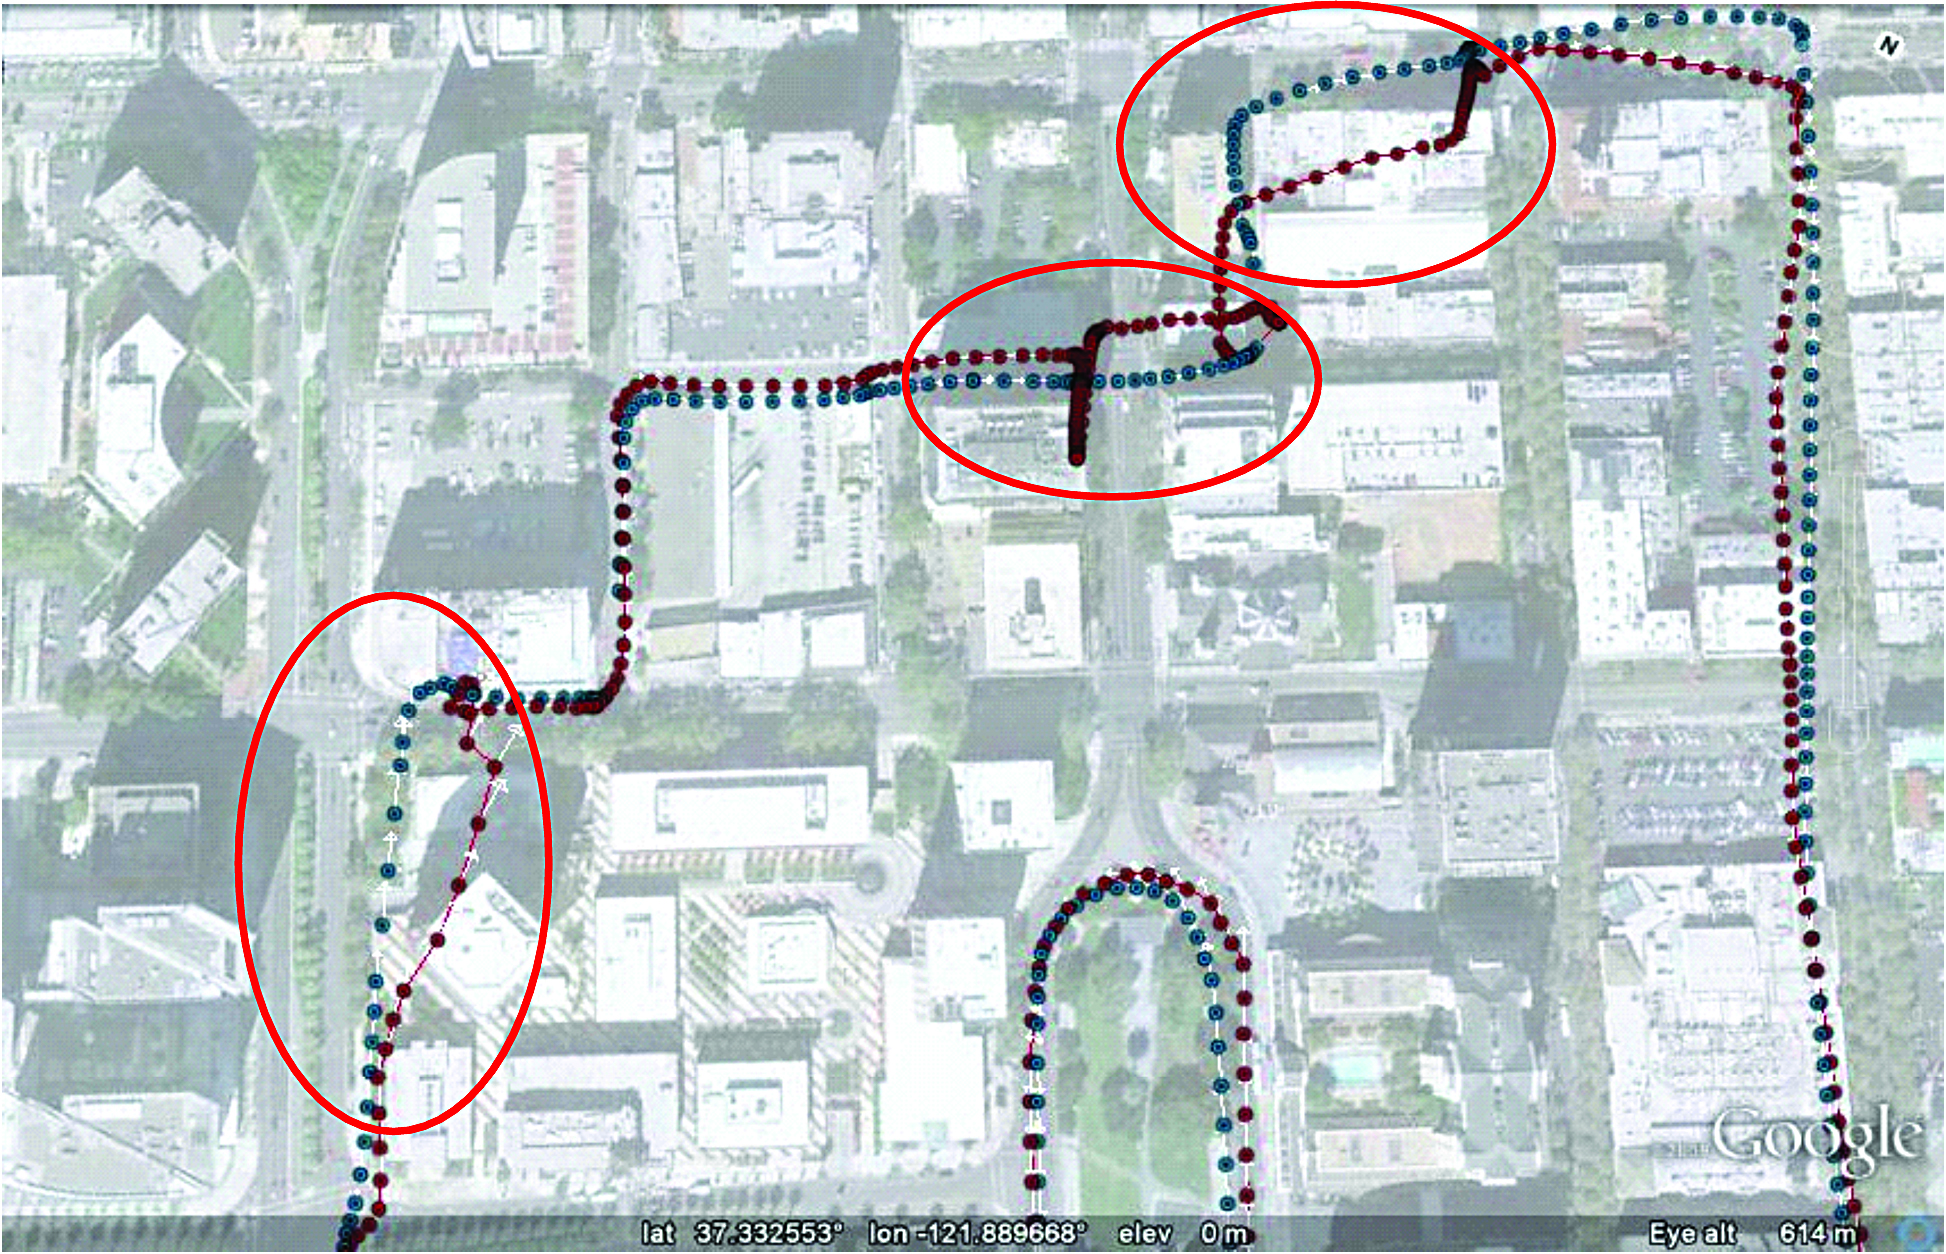
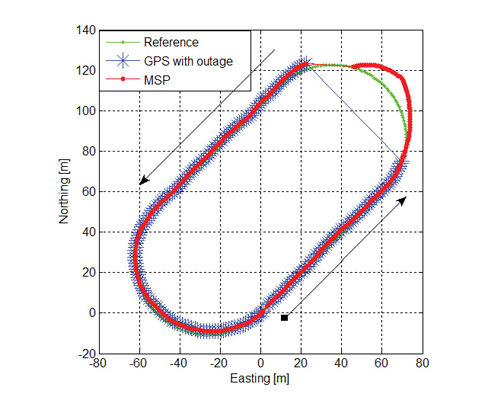
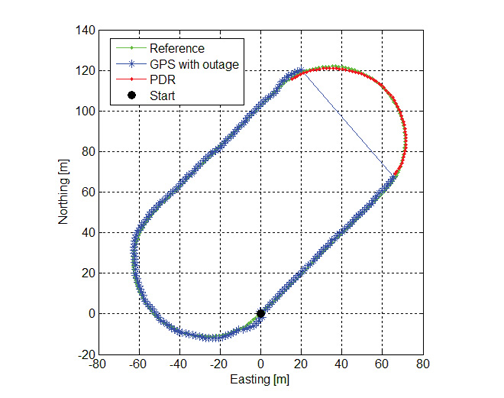
    Data was collected on four tests. Basically, the inputs of the IEGLO KBD module show that the GPS trajectories are quite discontinuous and different among them. Different visibility conditions, eventual multipath, low-cost receiver performance, and phone position in the pocket are just some examples of causes for the GPS trajectories’ discontinuities. But in any case, these are the conditions that pertain in real use, and therefore draw a very realistic test frame.

    Estimation of Qualitative States. Each data acquisition is composed of 16 different possible qualitative states: two collapses, four motionless periods, five walking periods, and five other misleading situations (sitting, taking the phone out of the pocket).

    The KBD module estimates the collapse and motionless states perfectly; that is, there were no missed detections (thus no risk on the user’s side) and no false alarms (no risk on the system side) were generated during the execution of the KBD module in the four tests.

    For walking detection, two modalities were tested: the accelerometer-only detection and the combined accelerometer/GPS combination. The first mode used qualitative observations only, derived from accelerations, and the second mode used qualitative observations derived from both accelerations and GPS positions. In the first mode, 66 percent of the walking time was properly detected, with 2 percent of false alarms, and 32 percent of missed detections. The acceleration-only approach seemed to work well in very evident walking situations, but at the start or end of walking action, when there is a increase or decrease of motion, the approach was not able to capture a proper walking situation. Nevertheless, when GPS-based observations were used, the results improved up to 80 percent, and missed detections were reduced to 18 percent. Note that the walking state was the only non-distress situation. Therefore, missed detections in that case were definitely not critical for personal safety.

    Conclusions and Next Steps

    IEGLO uses GNSS technology as the main positioning method in caregiving applications. As healthcare assistance is not a core GNSS application, this potentially expands GNSS adoption.

    The combination of indoor/outdoor location technologies using mass-market off-the-shelf devices was the key innovation of the project. Different localization methods were used to obtain a reliable user position.

    During the project phase, the position augmentation server was used to enhance the GNSS positions on the server side. If signal blockages occurs or if the mobile units are not able to receive and process the EGNOS signal-in-space, position corrections can be still accomplished. Tests showed that augmented positions provide higher accuracies in the majority of measurements, particularly in the vertical dimension.

    With respect to qualitative navigation, the KBD module enhances the navigation domain to gauge user context in addition to user position. Some qualitative states were selected for the KBD as of particular interest for u
    ser requirements: collapse, motionless, and walking situations. Results show nearly perfect detection of the first two qualitative states and an 80-percent correct detection of the third.

    Further research on qualitative navigation should address the personal signature issue: it is of the utmost importance to determine the biometric characteristics of each user. Customizing the KBD for each user, can provide a deeper analysis of user motion and behavior, such as fatigue, leading to proactive prevention of distress situations.

    We may also anticipate GPS receiver improvements in smartphones, as navigation technology gets cheaper, smaller, and better. Potential improvements in walking detection may thus occur through reduction in the number of missed detections. Finally, it is of great interest to investigate other scenarios in which the KBD makes sense: indeed, motion analysis is of interest for many applications such as videogames and personal safety. User requirements must be gathered to contextualize such concepts and to determine KBD software modularity and extendibility.

    Acknowledgments

    This research received funding from the European Community’s Seventh Framework Programme (FP7/2007-2013) under grant agreement n226971.

    The authors thank all IEGLO consortium partners (OECON GmbH, Germany; PIAP, Poland; Tele+ Italia S.A.S, Italy) for their contributions, and a special mention to M. Eulàlia Parés for her work on the qualitative navigation concept and general support.

    Manufacturers

    The Magellan AC12 served as the GPS/EGNOS receiver in the tests.

    Pere Molina is a research assistant at the Institute of Geomatics in Barcelona, where he obtained an MSc in airborne photogrammetry and remote sensing.


    Ismael Colomina is the director of the Institute of Geomatics. He holds a PhD in mathematics from the University of Barcelona and is a mem-ber of the Editorial Advisory Board of GPS World.

    Markus Troger works for TeleConsult Austria GmbH as system engineer and project manager in positioning and navigation. He received a master’s degree in geomatics science from Graz University of Technology, Austria.

    Bernhard Hofmann-Wellenhof received his Dipl.- Ing. and doctoral degree from Graz University of Technology, where he is a professor of navigation and satellite geodesy. He is a founder and managing director of TeleConsult Austria GmbH.

    Carmen Aguilera is market development officer at the European GNSS Supervisory Authority. She holds a masters degree in telecommunication sciences.

  • Down and Deep

    More Satellites, More Sensors Take Urban Navigation Downtown and Deep Indoors

    By Frank van Diggelen

    As we all know, GPS is practically perfect in every way — as long as it’s outside and unobstructed. Even cell phones can now produce meter-level accuracy under open sky. There are still many deficiencies in state-of-the-art location, particularly in deep urban canyons and inside large buildings. Which technologies will lead personal navigation into the future?

    As we all know, GPS is practically perfect in every way . . . so long as it’s outside and unobstructed. Even cell phones can now produce meter-level accuracy under open sky. And, with Assisted GPS (A-GPS), those cell phones have mitigated the two great deficiencies of the original GPS: slow time to first fix (TTFF), and outdoor-only operation. A-GPS receivers can produce TTFF as fast as one second after a cold start, and (sometimes) work indoors.

    However, there are still many deficiencies in the state of the art of location, particularly in deep urban can yons and inside large buildings. In the latter you will soon notice that even if your A-GPS operates in your house, it does not operate everywhere. The term “indoor GPS” is rather like “off-road vehicle”: your four-wheel drive may let you cruise down the beach, but you certainly cannot use it to climb every mountain nor ford every stream. Similarly “indoor GPS” denotes the presence of a capability — not the absence of all limitations.

    And so what is the future of urban and indoor navigation, and which technologies will prevail? The short answer is: more satellites and more sensors. In this article we’ll look at the technologies that will move us from the era of GPS-only into the future of GPS-plus.

    Source: Frank van Diggelen
    This is Manhattan.
    Source: Frank van Diggelen
    This is Manhattan on Wi-Fi.

    Other GNSS

    The most likely addition to GPS will be the other global navigation satellite systems, and all GPS receivers will be replaced by true, multi-system, GNSS over the next two to three years. Not because this will ever fully solve indoor location, but because of the outdoor problem in deep urban canyons.

    When asked why he wanted to climb Everest, George Mallory famously said “because it is there.” Of the various GNSS systems, those with the most influence in the next few years will be GLONASS, because it is there, and QZSS because (as Mallory might have added) it is high. The first QZSS satellite recently began functional transmission. So let’s use QZSS as an example of why extra satellites are so important in the deep urban canyon.

    Figure 1 shows Shinjuku, Japan, a typical deep urban canyon and a terrible place for GPS. The blue dots show the positions of a GPS receiver. The white and orange lines show the actual line-of-sight vectors to the GPS satellites. The white lines are to GPS satellites in direct view. The orange lines are to satellites behind buildings. However, the high-sensitivity A-GPS receiver tracks all these satellites, by acquiring and tracking reflected signals. Thus the whole concept of GPS — of measuring distance by time-of-flight — breaks down. The reflected measurements are inaccurate because of the extra path length. And even if the receiver could somehow tell orange lines from white, the horizontal dilution of precision (HDOP) of the white-only lines is 58 in this real-life example. Now add two high-elevation satellites, shown by green lines, and things are much better. The green lines show the location of two QZSS satellites, and the HDOP of the five green + white satellites is 3.

    Figure 1 shows the problem of the deep urban canyon, and the value of extra satellites. The problem is that there are not enough satellites in direct view. This puts receiver designers in an insoluble dilemma: Track only strong satellites, and you will not have enough; or track weak satellites, and you will measure reflections with large measurement errors because of the extra path length of the reflection. Moreover, the reflected signals can be indistinguishable from direct signals in their characteristics, especially in mobile phones where the antennas are poor, and directional — so that signal strength is not a reliable indicator of whether a signal is direct or not.

    This example should put to rest the false notion that extra high satellites will not improve HDOP. In this case the HDOP improves by about 20 times, from 58 to 3. It is easy to find many similar examples using GPS + GLONASS or any other GNSS combination. More often than not, extra satellites improve the situation significantly.

    The QZSS system uses inclined geostationary orbits to provide high elevation coverage above Japan (and, as a by-product, neighboring regions.) In this respect it is unique amongst the major GNSS: it is exclusively designed to provide good urban coverage of its home region. Compass has a similar component, but ultimately it, like GPS, GLONASS, and Galileo, has global ambitions.

    Some other satellite systems, such as satellite radio, use inclined geostationary orbits like QZSS. With QZSS providing an alternative example of a new GNSS, European taxpayers might well ask why Galileo should provide medium-Earth orbit satellites that spend more time over America and Asia than over Europe. As a U.S. taxpayer, I’m all in favor of the current Galileo plan — after all, the United States has been sending GPS satellites over Europe for the last 30 years, so a little reciprocation seems only fair.

    Figures 2 and 3 show how the three satellites of QZSS provide better high-elevation coverage over Tokyo (and neighboring regions), than all of the 30 GPS satellites combined.

    QZSS-capable chips are already found in mobile phones and tablets available in the Asian market. As this article was being written, a Broadcom BCM4751 chip in Tokyo was computing the first-ever GPS+QZSS position.

    Source: Frank van Diggelen
    Figure 2. Elevation above horizon of the QZSS satellites, as seen from Tokyo. Note that the inclined-geostationary orbits of the QZSS system have been designed so that there is always one satellite above 70°.
    Source: Frank van Diggelen
    Figure 3. Elevation of GPS satellites as seen from Tokyo. About half the time none of the 30 GPS satellites is above 70° elevation, a quarter of the time one GPS satellite is above 70°, a quarter of the time two GPS satellites are, and for half an hour three GPS satellite are. The three satellites of the QZSS constellation provide better high-elevation coverage in Tokyo than the 30 GPS satellites.

    Wi-Fi

    After GNSS, the second-leading location technology is wireless local area networks, commonly known as Wi-Fi. Wi-Fi location works by using a database of media access control (MAC) addresses and locations. When a mobile device senses a Wi-Fi access point, the MAC address and database give the location of the access point (AP). A simple average of many APs gives position accurate to tens of meters.

    Wi-Fi location is already tightly integrated with GPS in many smartphones. Wi-Fi location accuracy is good enough that it is often mistaken for GPS, especially in cities where the density of APs is large. In Manhattan, for example, there are more than 25,000 APs per square kilometer (see opening figure.)

    Several major companies, including Apple, Broadcom, and Google, have worldwide databases of Wi-Fi AP

    locations that are used in mobile devices, especially smartphones and tablets.

    MEMS, Accelerometers, and Gyros

    The micro-electromechanical systems (MEMS) technique etches the silicon on a chip to exploit its mechanical and electrical properties. A MEMS chip, such as a chip-level accelerometer or rate gyro, thus has tiny moving parts that can sense acceleration or rate of turn, respectively. Both sensors are already common in smartphones, where they are used to set the correct screen orientation (portrait or landscape), and for gaming. Because they are already there, they are a natural addition to location technologies, and many companies are moving rapidly to integrate motion sensors with GPS for improved accuracy indoors and in urban canyons.

    As an example of the benefits of MEMS motion sensors, Figure 4 shows a test case where GPS was deliberately degraded by denying it the high direct-view satellites discussed earlier, and then adding nothing but low-cost MEMS sensors.

    Source: Frank van Diggelen
    Figure 4. GPS-only positions and GPS + MEMS. The red circles show where poor GPS-only performance was dramatically improved by the addition of low-cost MEMS accelerometers and rate-gyros such as those already found in certain smartphones and PNDs.

    Magnetic Compasses

    Like accelerometers and gyros, magnetic compasses are already found in many smartphones. The technology is rapidly evolving, and different techniques are used by different suppliers to determine magnetic north, including Hall effect sensors, fluxgate compasses, and MEMS. Performance is dramatically affected by nearby metal and severely affected by magnets. You may not think that you are surrounded by magnets, but you are — especially in your car where every speaker of your sound system is a magnet — and the better the speaker, the larger the magnet. Thus magnetic sensors alone are not a reliable location technology, but integrated with other sensors, such gyros or accelerometers, they can be and are very useful, especially for pedestrian applications.

    Altimeters

    Altimeters are another MEMS technology. Typically a hermetically sealed cavity on the chip is used to measure change in atmospheric pressure — the surface of the cavity is deformed as the outside pressure changes, and the deformation can be measured using piezoelectric strain gauges. The integration of altimeters with GPS is already well established for such applications as hiking receivers. Similar integration is likely in other consumer devices, especially smartphones.

    AFLT, MRL, and Cell-ID

    The three cellular-wireless technologies of AFLT, MRL, and Cell-ID are all components of A-GPS.

    AFLT (Advanced Forward Link Trilateration) is a technique used in CDMA phone systems, where the cell towers are precisely synced to GPS time. Because of this precise time synchronization, one can use the cellular signal to measure range from the cell tower, using time-delay just like GPS. CDMA phones with GPS are usually using AFLT when providing position indoors.

    MRL (Measured Results List), is the UMTS analogy of AFLT for non-synchronized systems. The MRL provides a list of neighboring cell towers and received power. Received power is used to estimate range, and from this, position. Accuracy is not nearly as good as AFLT, but can be decent, especially in cities where accuracy may be better than 100 meters, good enough for emergency location applications such as E-911.

    Cell-ID is simply the technique of looking up location in a cell ID database. This is analogous to Wi-Fi location, but not nearly as accurate since cell tower ranges are much greater than Wi-Fi. However, although perhaps the least exciting, this technique is the foundation of many important technologies. The AFLT and MRL techniques require Cell-ID as a necessary component. A-GPS usually uses Cell-ID for providing the assistance position, a necessary component of the high sensitivity that A-GPS provides. And Cell-ID alone is necessary for E-911 location, when A-GPS fails.

    Digital TV and Radio

    Location from digital TV works by measuring ranges from DTV towers, analogous to GPS and AFLT. However, DTV towers are not precisely synchronized to each other, and so DTV location requires the build out of fixed site infrastructure to deal with individual tower clock offsets.

    DTV location is in a way the opposite of Cell-ID. While Cell-ID is intellectually boring, the technique is practically very important and widely used. DTV, by contrast, is an exciting idea, because it can be accurate like GPS but with much more powerful signals. However, it has been a commercial failure.

    DTV location, or related technologies, may enjoy a resurgence in the future once mobile TV or digital radio (HD Radio and DAB — digital audio broadcasting) become more widely adopted.

    Pseudolites

    Well known to precison-location cognoscenti, pseudolites provide GPS-like signals from ground-based transmitters. They typically use a transmit frequency that is offset from GPS, but otherwise their signals are like GPS so that they can be used with a receiver with the same baseband as GPS.

    Pseudolites can be very accurate, as good as five centimeters when using carrier-phase measurements. They require local, fixed transmitters which are fairly sophisticated (since they must maintain time and phase coherency to work properly.) This makes them prohibitively expensive for widespread applications. However, pseudolites are highly valued and widely used in niche markets, and will probably remain so.

    IMES and Local Beacons

    IMES stands for indoor measurement system, and it, or something like it, could be the most interesting new location technology of all. IMES is a local-beacon system — it works by providing a very weak signal that is exactly like GPS, but is meant for data-transmission only, not ranging. Thus it is fundamentally different from pseudolites, which are designed for ranging. The power of each IMES transmitter is so low (0.1 to 0.4 nanowatts) that it can only be acquired within about 10 meters of the transmitter. The signal is modulated with a PRN code (PRN numbers 173 to 182) and data: the data contains the location of the transmitter. The system technology may be summarized as “if you can hear me, here you are.” And the accuracy is inherently about 10 meters.

    A fascinating detail of the IMES data message is that it contains (in message type 000): latitude, longitude and floor number.

    IMES is designed to work with any GPS receiver that can decode PRNs 173 through 182. And, because they are not intended for ranging, the transmitters do not have to be precisely synchronized with GPS or with each other. This makes them cheap to build and install. However, they do still need to be deployed in large numbers (at least one every 10 meters), and will require a government-sized effort to become reality. Interestingly, they might just get it: The IMES system is defined in an annex to the QZSS interface specification from JAXA, the Japan Aerospace Exploration Agency. But it is not clear how much funding is available for IMES, or if there is any mass deployment schedule.

    Even if IMES is never deployed, other, similar local-beacon systems may emerge. They will require a government-level (or similar) effort for the mass deployment required to make a system a reality for consumers.

    Thus IMES or similar local-beacon technology may amount to nothing, or it may be a complete game-changer, depending on how the game is played and how the cards fall.

    Summary

    We have seen that GPS is practically perfect, when outdoors. And because A-GPS has worked so well over the last decade, it has become the predominant location technology in consumer platforms such as smartphones and tablets. But, precisely because of this success, GPS is more challenged than ever as consumers expect it to work where it was never meant to: indoors, in deep urban canyons, and with very small, cheap, antennas.

    These challenges have led us to other technologies, in particular more satellites, sensors, and other wireless location techniques. The most prevalent and valuable additions to GPS in the next few years will be GLONASS and QZSS, as well as MEMS technologies, magnetic sensors, Wi-Fi, and cellular wireless technologies.

    Roughly speaking, the 1960s and ’70s were the decades of GPS conception, the 1980s the decade of development and delivery, and the 1990s the introduction to the world. Since 2000 we have had the decade of mass-market adoption, and the 2010s will be the decade of GPS-plus: other GNSS and other sensors.


    FRANK VAN DIGGELEN is senior technical director for GNSS, and chief navigation officer of Broadcom Corporation. He is the author of the bestselling textbook A-GPS: Assisted GPS, GNSS and SBAS, and holds more than 50 U.S. patents on A-GPS. He received his Ph.D. in electrical engineering from Cambridge University and is a consulting assistant professor at Stanford University.


  • Multi-Sensor, Multi-Network Positioning

    Multi-Sensor, Multi-Network Positioning

    By Ruizhi Chen, Heidi Kuusniemi, Yuwei Chen, Ling Pei, Wei Chen, Jingbin Liu, Helena Leppäkoski, Jarmo Takala

    Currently, no single technology, system, or sensor can provide a positioning solution any time, anywhere. The key is to utilize multiple technologies. We are now exploring a multi-sensor multi-network (MSMN) approach for a seamless indoor-outdoor solution. Its hardware platform is described in the previous article. The digital signal processor (DSP) is embedded in the GPS module. All sensors are integrated to the DSP that hosts core software for real-time sensor data acquisition and real-time processing to estimate user location. A smartphone handset provides wireless network measurements.

    Positioning Algorithms

    The multi-sensor positioning platform enables a positioning solution with a combination of GPS and reduced inertial navigation system (INS), or GPS and pedestrian dead reckoning (PDR). The reduced INS consists of a 3D accelerometer and a 2D digital compass, as a low-cost alternative to augment GNSS positioning. The reduced INS combined with GPS uses a loosely coupled Kalman filter for data integration, while the combination of PDR and GPS uses algorithms for estimating the position change with pedestrian step-length estimation.

    PDR. The PDR solution uses human physiological characteristics, implemented in a local-level frame, with equations:

    M-e1

    where k denotes the current epoch, Y is the coordinate in East direction, X is the coordinate in North direction, S is step length, and φ is the heading.

    The PDR positioning algorithm includes step detection, step length estimation, determination of heading, and positioning.

    To achieve an accurate heading, compass measurements are corrected with an empirical online estimated error model, which requires some training data.

    WLAN and Bluetooth. Figure 1 describes the basic concept of the WLAN or Bluetooth locating solution using a fingerprint database approach. The circles around the access point (AP) in the figure represent the radio coverage area and the color the signal strength. This radio map is a simplified example representing measurements from just one AP.

    FIGURE 1. Sample WLAN or Bluetooth fingerprint map, in meters.
    FIGURE 1. Sample WLAN or Bluetooth fingerprint map, in meters.

    For the fingerprinting approach, the received signal strength indicators (RSSIs) are the basic observables. The whole process consists of a training phase and a positioning phase. During the training phase, a radio map of probability distribution of the received signal strength is constructed for the targeted area. The targeted area is divided into a matrix of grids, and the central point of each grid is referred to as a reference point. The probability distribution of the received signal strength at each reference point is represented by a Weibull function, and the parameters of the Weibull function are estimated with the limited number of training observation samples. Based on the constructed radio map, the positioning phase determines the current location using the measured RSSI observations in real time.

    Given the observation vector M-e3, the problem is to find the most probable location (l) with the maximized conditional probability M-e4, maximized by Bayesian theorem as:

    M-e2

    We applied an assumption of Hidden Markov Models (HMM) to represent the pedestrian movement process. The locating problem is then translated into finding such a state sequence (locations) that is most likely to have generated the output sequence (the measured RSSIs) assuming the given HMM model. The Viterbi algorithm typically solves these kinds of problems efficiently. This study also utilizes the Viterbi algorithm to trace the user trajectory.

    MSMN. The general integration scheme combining the GPS output, sensor measurements, WLAN, or Bluetooth output, and their variance estimates is depicted in Figure 2. A simplified representation of the central filter combining different input sources can be described with typical Kalman filter equations. The measurement model is zk= Hkxk+vk where the state estimate vector isM-e5 ,

    with X, Y, and φ as previously defined, and S the user horizontal velocity (speed). The measurement vector is given as

    M-e6

    where g refers to GPS, W to WLAN/Bluetooth, acc to accelerometer, and dc to digital compass. The matrix Hk is the design matrix of the system and the vector vk is the measurement error vector.

    FIGURE  2. Integration scheme for multi-sensor, multi-network positioning approach
    FIGURE  2. Integration scheme for multi-sensor, multi-network positioning approach

    The recursive sequence includes prediction and update steps. The prediction step includes the typical equations of

    M-e7

    and

    M-e8

    while the update step includes

    M-e9

    Indoor Test Results

    A field test has been carried out on a sports field, described in the accompanying article (see Going 3D). An indoor test was carried out in an office-building corridor, but the test started and ended in an outdoor terrace area. During the test, the indoor corridor was covered with eight WLAN and three BT APs.

    Figure 3 shows the positioning results of the GPS-only (red), Bluetooth-only (black), and WLAN-only (magenta) solutions; Figure 4 shows that of the integrated multi-sensor multi-network (MSMN) solution (blue) for an outdoor-indoor-outdoor test. A reference trajectory is in green in both figures and building outlines in grey. The position update rate achievable by the WLAN and Bluetooth fingerprinting approach is only 0.1 Hz whereas the GPS-only and the integrated MSMN solutions are obtained every second and thus have a higher availability.

    FIGURE  3. Pedestrian test results with GPS-only, BT-only, and WLAN-only positioning approaches with respect to a reference trajectory
    FIGURE  3. Pedestrian test results with GPS-only, BT-only, and WLAN-only positioning approaches with respect to a reference trajectory
    FIGURE 4. Pedestrian test result with the multi-sensor multi-network positioning approach with respect to a reference trajectory
    FIGURE 4. Pedestrian test result with the multi-sensor multi-network positioning approach with respect to a reference trajectory

    Figure 5 shows the horizontal errors obtained with the different positioning solutions over time in the indoor test. A mean horizontal error of 2.2 meters was achieved with the WLAN solution. The Bluetooth solution is not as accurate as the WLAN solution, due to the smaller amount of BT APs; it achieved a mean horizontal error of 5.1 meters. When moving inside the corridor, the GPS solutions are used for the MSMN integration only with very low weights due to their poor quality. GPS is mainly used as a source of location outdoors where the test starts and ends. The mean horizontal error of the GPS-only solutions during the whole test is 8.4 meters. WLAN- and Bluetooth-derived locations and the self-contained sensors are the main sources used inside the building for the MSMN positioning solution: the mean horizontal accuracy o
    btained with MSMN is 2.7 meters with a solution availability of 1 Hz.

    FIGURE 5. Horizontal errors of GPS-only, BT-only, WLAN-only and the MSMN positioning approaches with respect to time in the pedestrian indoor test
    FIGURE 5. Horizontal errors of GPS-only, BT-only, WLAN-only and the MSMN positioning approaches with respect to time in the pedestrian indoor test

    The MSMN solution obviously performs much better than a GPS-only solution indoors. The track of the pedestrian walking inside the corridor can be identified clearly, which is not the case with typical approaches of GPS-only or GPS/low-cost sensors. WLAN fingerprinting provides good position accuracy indoors, but the MSMN solution provides the best result when taking into account positioning accuracy and the solution availabilities in both time and space domains.

    Conclusions

    Further development is needed for indoor areas to be able to obtain fully seamless outdoor-to-indoor location, though GPS initialization followed by sensor and WLAN/BT combination already provide very good initial results. Additional sensors and more refined pedestrian-specific algorithms will be added to further improve the positioning accuracy.

  • Going 3D

    Personal Nav and LBS

    To enrich user experience of location-based services and personal navigation, three-dimensional models such as those used in urban planning are added to a smartphone platform, without the requirement of additional hardware.

    Most current map applications for smartphones and other devices providing location-based services (LBS) are based on two-dimensional maps. Three-dimensional (3D) city models are widely used in applications such as engineering design, environmental modeling, and urban planning. Adapting such models for use in smartphones would make it possible to render 3D scenes in real time, enriching contents and user experience for personal navigation and LBS. A delimited yet large-scale event such as the upcoming 2010 World Exposition in Shanghai provides a promising area for system development and testing.

    3D visualization consumes a large amount of computing power, and most of the current successful applications run in a PC environment, as does the Google Earth 3D application. It is still a very challenging task to implement 3D visualization in an embedded system such as a smartphone.

    This article presents an entire 3D personal navigation system based on a smartphone platform, the Nokia S60 platform. The study covers the following aspects:

    • 3D personal navigation and LBS service in a smartphone
    • 3D city modelling, and
    • multi-sensor positioning.

    The objectives of the work include prototyping an entire handset-based 3D personal navigation and LBS system utilizing WLAN/Bluetooth positioning technologies, handset built-in GPS/AGPS, and 3D modeling and visualization (basic demonstration scenario), as well as presenting a multi-sensor positioning (MSP) platform in addition to the handset software (advanced demonstration scenario).

    3D Personal Navigation and LBS

    No additional hardware is added to the Nokia Series 60 (S60) smartphone platform to achieve the 3D visualizations or other functions in the software. Figure 1 demonstrates the functionalities and features available in the 3D viewing of the LBS software. Figure 2 shows the general architecture of the software.

    FIGURE 1.  Functionalities of the 3D LBS software
    FIGURE 1. Functionalities of the 3D LBS software
    FIGURE 2.  General architecture of the 3D personal navigation and LBS software
    FIGURE 2. General architecture of the 3D personal navigation and LBS software

    The software development work focuses on the UI layer, framework layer, and component layer. The software mainly includes the following components:

    • the 3D visualization engine based on OpenGL ES,
    • the route plan component,
    • the locator component,
    • the LBS client component, and
    • UI and framework.

    Most of the challenging tasks are included in the development of the elements in the component layer, especially in the development of the 3D visualization engine based on the OpenGL ES API that is available from the S60 platform SDK (Software Development Kit). The high-level 3D visualization engine architecture covers the interface layer, the core engine layer, and the data management layer. The first one is responsible for cross-component functional communication, request handling, and data exchange. It provides users with the 3D scene visualization functionalities to access the core engine layer via a single class called NaviSceneControl, which includes all the operations of the 3D visualization: scene zooming, view angle rotating, scene and cursor moving, and selecting route planning and virtual navigation.

    The core engine layer takes care of the 3D scene visualization computation and model object management. To enable the 3D visualization for a large region, the objects in the scene are classified into two categories in this layer. One is the 3D models like buildings, trees and poles, while the other is texture of land surface, which consist of ortho-rectified digital aerial photos. All the objects are processed as tiles according to the incoming parameters from the interface layer. Therefore only a small subset is loaded dynamically instead of the whole data.

    The data management layer accesses the 3D models and ground-texture images persistent on the flash disk of the mobile phone through an independent thread. To reduce the data size of the 3D models, the original .3ds file created from 3D Max Studio software is compressed to fulfill the requirements of the mobile device.

    A simple route plan component is implemented in the software to enable to the user to find and view the route to his or her destination. In order to be able to show the entire route, the calculated route will be displayed on top of a 3D view with a downward camera at a high altitude. The 3D scene in this case looks like an orthoimage. An orthoimage shows objects in the perpendicular view to the projection plane of the objects.

    The locator component aggregates the positioning information either from the built-in positioning sensors in the smartphone, a GPS receiver, and a WLAN (Wireless Local Area Network) or a Bluetooth chip, or any external positioning device, such as also the multi-sensor positioning (MSP) device developed in this project. It forwards the positioning information including the location and heading information to the route plan component and the 3D visualization engine to accomplish the navigation functions.

    The purpose of the LBS client component in the handset software is to access the LBS server.

    Figure 3 shows the overview of the mechanism for delivering the location-based services. The services are classified into two categories: the static services and the dynamic services. The static services include those services that are not changing in time. For example, POIs (points of interest) belong to this category of service. The static services are stored in a database that can be downloaded from the Internet by the users in advance. The users can store the database in the memory card of the phone before running the 3D personal navigation and LBS software. With this approach, it saves the data transmission fee for the end-users when accessing the LBS. The dynamic services cover those services that change in time. For example, a piece of real-time news is one of the typical dynamic LBS. For accessing the dynamic LBS, the Really Simple Syndication (RSS) technology is adapted in our implementation.

    FIGURE 3. Mechanism for delivering location-based services and information
    FIGURE 3. Mechanism for delivering location-based services and information

    The LBS client component is implemented so that the handset will pull automatically the news in the background in real time via a widget reader embedded in the LBS client component. Whenever new information is uploaded to the LBS server or to the registered web pages, mobile users will be notified.

    In addition to RSS technology, another approach to broadcast LBS information is considered in the system: to disseminate the LBS information via an SBAS (satellite-based augmentation system) pseudolite. The dynamic LBS information (e.g., a short message) can be first encoded into a user-defined SBAS message. The message encoded is then sent to a pseudolite from which the message is broadcast. The corresponding SBAS message can, in fact, be received by any SBAS-enabled receiver located within radio coverage area of the pseudolite. However, the encoded LBS message can be decoded only with the receiver that has a special firmware, developed in this case by the Finnish Geodetic Institute (FGI). Having received and decoded the LBS messages transmitted from the pseudolite with a dedicated receiver, for example the MSP device part of the more advanced demonstration scenario of the project, the content of the message is then encoded to a user-defined NMEA (National Marine Electronics Association) message and transmitted to a mobile phone in the vicinity via a Bluetooth connection as shown in Figure 3. This solution of LBS data distribution is available only to a very limited number of users with receivers carting a special firmware developed by FGI.

    3D City Modeling

    Due to the memory limitations of a mobile phone, there are certain requirements for the 3D models applied. In our study, a test scene for model reconstruction is focused on a street in Espoo, Finland, in an ordinary residential area. A vehicle-borne mobile mapping system ROAMER (see photo) developed by FGI performed the data acquisition. It consists of a carrying platform, a positioning and navigation system, and a 3D laser scanner system. With the ROAMER system, visible objects can be measured with an accuracy of a few decimeters with a maximum vehicle speed of 50–60 km/hour, and the data for the desired objects can be collected within the range of several tens of meters.

    ROAMER vehicle-based mobile mapping system
    ROAMER vehicle-based mobile mapping system.

    A large amount of data is produced from the system, and noise and outlier points are needed to be removed. Valid data is classified into different point groups using an automatic algorithm developed by FGI. These point groups include buildings, trees, roads, and poles. Models are then reconstructed based on these classified point groups.

    Modeling methods are developed to meet the application requirements of personal navigation: small model size, high accuracy, and good visual appearance. Small model size is achieved by simplified object geometry and reduced texture resolution. Model accuracy is controled by extracting building outlines from a classified point cloud and overlapping with the final 3D model. The model completeness is checked by comparing the resulting model with original images. Good visual effect is realized by applying photo-realistic texture. Photo-realistic texture provides rich information for the 3D scene reconstructed. Figure 4 presents the total process of the 3D modeling, in which only the individual object texture and the final model constructions require manual editing. Figure 5 shows the raw data retrieved and Figure 6 presents the final 3D models of the test area.

    FIGURE  4. The process of 3D modeling
    FIGURE  4. The process of 3D modeling
    FIGURE  5. Raw data retrieved from the test area with FGI’s ROAMER system
    FIGURE  5. Raw data retrieved from the test area with FGI’s ROAMER system
    FIGURE  6. Reconstructed 3D scene of the test area
    FIGURE  6. Reconstructed 3D scene of the test area

    To import the final 3D models to a mobile phone, the size of an individual model is restricted to less than 100 kb. To optimize model size, a row of buildings is divided into several building blocks.

    Multi-Sensor Positioning

    As long as open-sky satellite-signal conditions are available, there are no problems to locate a mobile user with the built-in GPS receiver of a smartphone with a positioning accuracy of a few meters. However, most popular location-based services occur in GNSS-degraded environments such as in indoor environments and urban canyons. Locating a mobile user seamlessly any time anywhere under any circumstance is still a very challenging task, especially to implement such an indoor/outdoor positioning solution in a digital signal processor (DSP) platform.

    FGI is now developing a DSP-based multi-sensor positioning platform to approach a seamless indoor/outdoor locating solution. The platform consists of a GPS module, a 3D accelerometer, and a 2D digital compass (Figure 7). A DSP is embedded in the GPS module. All sensors are integrated to the DSP that hosts a core software for real-time sensor data acquisition and real-time processing to estimate user’s location.

    FIGURE  7. Hardware platform
    FIGURE  7. Hardware platform

    The multi-sensor platform provides opportunities to investigate the positioning solutions with a GPS/Reduced-INS (Inertial Navigation System) combination or GPS/PDR (Pedestrian Dead Reckoning) combination. The Reduced-INS combination is defined as a combination of a 3D accelerometer and a 2D digital compass, and is a very low-cost approach of sensor augmentation. The GPS/Reduced-INS implementation is implemented in a loosely coupled Kalman filter, while the GPS/PDR algorithm is based on pedestrian-targeted dead reckoning, with heading error and step length estimation methodology.

    Preliminary tests analyzing both GPS/Reduced-INS and GPS/PDR solutions have been carried out in a sports field on a 400-meter running track. In order to simulate a GPS outage situation, the GPS measurements were ignored for one minute. During this one minute “outage,” the traveling trajectories are estimated with the Reduced-INS solution and the PDR solution. Figure 8 shows the trajectory of the Reduced-INS solution, while Figure 9 shows that of the PDR solution.

     FIGURE  8. Trajectory estimation for the 1-minute GPS outage using Reduced-INS approach
    FIGURE  8. Trajectory estimation for the 1-minute GPS outage using Reduced-INS approach
    FIGURE  9. Trajectory estimation for the 1-minute GPS outage using the PDR approach
    FIGURE  9. Trajectory estimation for the 1-minute GPS outage using the PDR approach

    The Reduced-INS approach provides a reasonable result with a positioning accuracy of about 20 meters at the end of the forced 1-minute GPS outage. The PDR approach provides a better prediction in this case, resulting in only a couple of meters of error after the 1-minute outage of absolute location input from the GPS, because the heading errors are modeled carefully utilizing previous training with data from a previous run along the same track as well as accurate step detection estimation.

    Conclusions

    The prototype system will be tested and demonstrated at the 2010 World Expo in Shanghai, implemented with a smartphone software package: anyone with a Nokia phone (S60 with built-in GPS and WLAN/BT) can experience the 3D personal navigation and LBS service in the Expo area by downloading and installing the 3D models. The prototype has so far met these challenges: the high performance required of real-time 3D visualization in a smartphone; high positioning availability with acceptable accuracy in indoor and outdoor environments; and the demanding requirements of the 3D models for a small phone, including small model size, high accuracy, and good visual appearance.

    Manufacturers

    The multi-sensor positioning platform consists of a Fastrax iTrax03 GPS module, a VTI SCA3000-D1 3D accelerometer, and a Honeywell HMC6352 2D digital compass. The ROAMER mobile mapping system consists of a Faro LS 880HE80 terrestrial laser scanner, two AVT Oscar F-810C cameras, and a NovAtel SPAN geo-reference system.


    RUIZHI CHEN is a professor and head of the Department of Navigation and Positioning at the Finnish Geodetic Institute, where Heidi Kuusniemi is a specialist research scientist, Juha Hyyppä is a professor and head of the Department of Remote Sensing and Photogrammetry, Risto Kuittinen is director general, Yuwei Chen is a specialist research scientist, and Ling Pei, Lingli Zhu and Jingbin Liu are senior research scientists.

    JIXIAN ZHANG is a professor and president of the Chinese Academy of Surveying and Mapping, where Yan Qin and Zhengjun Liu also work as the director of the Department of Research and Development and the group leader in the Institute of Photogrammetry and Remote Sensing, respectively.

    JARMO TAKALA is a professor and head of the Department of Computer Systems at Tampere University of Technology in Finland, where Helena Leppäkoski is a researcher.

    JIANYU WANG is a professor at the Shanghai Institute of Technical Physics, Chinese Academy of Sciences.


  • CSR and SiRF Complete Merger

    CSR plc of Cambridge, UK, and SiRF Technology Holdings Inc., of San Jose, California, on June 26 completed the merger between SiRF and a wholly owned subsidiary of CSR. The merger resulted in “creating a provider of connectivity and location platforms and a company with the scale, technology, and strategy to enable its customers to address the exciting and emerging opportunities in mobile markets,” according to a company statement.

    The company said that customers of the enlarged CSR group will be able to deliver new user experiences of connectivity and location technologies in a diverse range of devices such as mobile phones, personal navigation devices, in-car navigation and telematics systems, laptop and netbook PCs, mobile internet devices, digital cameras, gaming machines, cellular accessories, and consumer electronic devices.

    “In bringing together the combined capabilities and broad range of CSR and SiRF technologies and platforms, we have created a new force in the industry and a world-class organization with the commercial, technical and operational scale to build on CSR and SiRF’s existing customer relationships and deliver the next generation of connectivity and location enabled products,” said Joep van Beurden, CEO of CSR. “Our strategic goal is to address the existing and emerging needs of our combined customer base for connectivity and location technologies. The potential applications and benefits to the end user of connectivity plus location are only just starting to open up, and these exciting new opportunities will be driven by our unique combination of leading location technologies and connectivity solutions.”

    “CSR and SiRF have a shared vision of using innovation to bring the benefits of wireless connectivity and location to mainstream consumers and enterprises and to enable new and exciting user experiences”, said Kanwar Chadha, co-founder of SiRF and newly appointed board member and chief marketing officer of CSR. “We believe that through this merger, our customers and consumers will derive benefits from a much stronger player whose focus is on delivering best in class connectivity and location platforms.”

    “Technology innovation represents the foundation for both CSR’s and SiRF’s success in the market place,” said James Collier, co-founder, board member and Chief Technology Officer of CSR.  “We look forward to combining the complementary expertise of our teams to take innovation to the next level in our multifunction radio and system platforms to address emerging customer and market needs.”

    For CSR’s customers, the merger with SiRF means CSR’s Connectivity Centre products are augmented by GPS technologies that are well respected and enjoy widespread adoption, the company said, while SiRF brings to CSR a strong IP portfolio in GPS and assisted GPS (A-GPS), dead reckoning, and location centric platforms. 
The enlarged CSR group will have its global headquarters in Cambridge, UK, with SiRF’s headquarters in San Jose becoming CSR’s U.S. headquarters.

  • The Business: SiRF, CSR to Merge; Kanwar Chadha’s Perspective

    » MASS MARKET OEM

    SiRF, CSR to Merge; Kanwar Chadha’s Perspective

    SiRF Technology Holdings, Inc., of San Jose, California, and CSR plc, formerly Cambridge Silicon Radio, headquartered in Cambridge, United Kingdom, will merge in a stock-for-stock transaction to create a new company, which will automatically assume a competitive, leading position in global connectivity and location markets. The companies expect the transaction to close in the second quarter of 2009.

    “Financially, strategically, and commercially, this is a compelling transaction,” said Joep van Beurden, CEO of CSR — and analysts would almost universally agree. SiRF has been under the financial microscope since troubles surfaced in Q1 2008, and speculation about an acquisition had been rife.

    Further, SiRF has been locked in a patent battle with Broadcom, the latter involved through its July 2007 acquisition of Global Locate.

    CSR has made its mark in the Bluetooth connectivity sector, combining multiple connectivity technologies, while SiRF has long pioneered GPS location with multifunction system-on-chip (SoC) location platforms for consumer handhelds and cell phones. In January 2007, CSR purchased GNSS software receiver innovator NordNav.

    Chadha Says. “From a strategy viewpoint,” SiRF founder and vice president of marketing Kanwar Chadha told GPS World, “multi-function radios is something we have been talking about for two years. Market opportunities became much larger in the last six months, with Nokia driving loction into every mobile phone.

    “When you see a market opportunity in front of you, it’s better to combine best-of-class than to build a solution from scratch.

    “We have a strong customer base in automotive and PNDs, while we are expanding into wireless. CSR is compelementary: strong now in wireless, and so on.

    “In easy times, you can build your own solution. In tough times, trying to build an additional platform of technology, if we start from scratch, that may take four to five years to prove out; that’s very difficult. Both of us tried to do that, by the way. They need GPS, we need Bluetooth.

    “Now, our multimode AGPS with their EGPS, and the economies of scale enjoyed by a now close to a billion-dollar company, we feel very good about that. Bluetooth in hands-free mobile phones, that has a 50 percent penetration in handsets. It is much deeper than GPS today, although GPS is catching up.

    “Their [CSR’s] world is very mobile-phone centric. We are more location-platform centric, more diverse in our view. It will be very interesting. GPS-Bluetooth-FM: for our customers, the handset vendors, this is their most requested combination. There are two ways to integrate these function: integrate GPS with a modem, as Qualcomm does, or integrate it into  what CSR calls a connectivity center, of short-range wireless technologies.”

    Lines Drawn. A significant market battle continues between the big four in the mass market OEM GPS chip sector: Broadcom, Qualcomm, CSR, and TI, formerly Texas Instruments — with Sony and Panasonic quietly going about their own business, making GPS chips for brand devices, but in a position to supply others, if they are not doing so already. The new ST-NXP Wireless joint venture with Ericsson (see story page 18) will also play in that arena.

    Chadha does not expect to see competition from manufacturers in Taiwan and China, at least not immediately. “These are complex radio technologies, not simple digital technologies.”

    Brand. “The SiRF brand won’t go away, it’s very strong,” he concluded. “We’ll continue to build on it. the location platform will be our recognizable art of the new company , and of course we’ll continue applying our expertise there.”

    On a pro forma basis, the two companies combined would have had 2008 sales of approximately $927 million. The combination will create the single largest pure-play provider of integrated connectivity and location platforms and will be one of the top 10 fabless semiconductor companies in the world, according to a joint statement. Customers include four of the top five handset makers, the top five PND makers, the top two auto-telematics suppliers, and other leading electronics providers. CSR and SiRF will have design and customer-support centers around the world.

    On closing of the transaction, SiRF stockholders are expected to own 27% and CSR shareholders are expected to own 73% of the combined company. CSR’s board will add SiRF interim CEO Dado Banatao and Chadha. The combined company, with CSR’s Van Beurden as CEO, will be based in Cambridge, and San Jose will serve as U.S. headquarters.

    » TELECOMMUNICATIONS

    Ericsson and STMicro Complete Mobile Merger

    STMicroelectronics and Ericsson have closed their agreement merging Ericsson Mobile Platforms and ST-NXP Wireless into a 50/50 joint venture. The deal was completed on the terms originally announced on August 20, 2008.

    The new company is designed for long-term stability and to become an industry leader in product research, as well as design, development, and the creation of mobile platforms and wireless semiconductors. The joint venture begins as a major supplier to four of the industry’s top five handset manufacturers, who together represent about 80 percent of global handset shipments, as well as to other industry leaders.

    Ericsson contributed $1.1 billion net to the joint venture, out of which $0.7 billion was paid  to STMicro. Before the closing of the transaction, STMicro exercised its option to buy out NXP’s 20 percent ownership stake of ST-NXP Wireless.

    Alain Dutheil, CEO of ST-NXP Wireless and chief operating officer of STMicroelectronics, will lead the joint venture as president and chief executive officer.Employing about 8,000 people — roughly 3,000 from Ericsson and 5,000 from STMicro — the new wireless technologies company is headquartered in Geneva, Switzerland.

    » MILITARY & GOVERNMENT

    Honeywell T-Hawk Micro Vehicle Heads for U.K.

    Honeywell received an order for six T-Hawk micro air vehicle (MAV) systems from the U.S. Navy, the contracting agency for the U.K. Ministry of Defence (MOD) for the T-Hawk MAV system procurement, in a contract valued at USD $5.7 million.

    The new U.K. order comes in addition to the Navy’s existing T-Hawk contract with Honeywell, announced in November 2008, for 90 systems. The T-Hawk MAV will be used by joint force EOD (Explosive Ordinance Device) units in Iraq and Afghanistan, among other locations.

    The circular vehicle, weighing 17 pounds and 14 inches in diameter, can fly down to inspect hazardous areas for threats without exposing warfighters to enemy fire. The T-Hawk MAV can take off and land vertically and fly more than 40 minutes, at more than 40 knots of airspeed, operating at altitudes of more than 10,000 feet.

    An eye-in-the-sky for battlefield surveillance, the Honeywell MAV carries video cameras to relay real-time data and a GPS device. It identifies improvised explosive devices (IEDs) and can inspect suspected bomb sites in areas inaccessible by ground robots.

    » MASS MARKET OEM

    Epson, Infineon Develop Tiny Single-Chip Receiver

    Seiko Epson Corporation of Tokyo, Japan, and Infineon Technologies AG of Neubiberg, Germany, have developed a GPS single-chip design, the XPOSYS, which is optimized for mobile devices for the consumer market — especially cellular phones with navigation features.

    Compared to existing solutions in the market, the XPOSYS, which is manufactured in a 65-nanometer process technology, provides increased performance and new levels of user experience, the companies said.

    Sensitivity has been increased from -160 dBm to -165 dBm, allowing for pinpoint positional accuracy when indoors or in urban canyons. Power consumption has been reduced by 50 percent, increasing the battery life of products in which it is included. The footprint has been reduced to 2.8 x 2.9 millimeters, which the companies claim is 25 percent less than the smallest GPS chip available elsewhere.

    u-blox Launches Cards for Mobile Computers

    A GPS PCI Express Mini card from u-blox (Thalwil, Switzerland) enables next-generation laptop, netbook, mobile internet device and Ultra Mobile PC OEMs to provide GPS and location-based services (LBS) such as personal navigation, services and people finders, and geo-tagging.

    “With the explosive potential of next-generation GPS applications and services for mobile PCs, it is the right time to introduce a robust PCI Express mini card supporting location-based services,” said Thomas Nigg, Vice President Product Marketing at u-blox.Sales of mobile PCs with integrated GPS are projected to grow from 3 million units in 2007 to 45 million units in 2011, according to u-blox.

    Qualcomm Launches Chipset for Low-Cost Smartphones

    Qualcomm, Inc., has launched the Mobile Station Modem MSM7227 chipset designed to enable high-performance, sub-$150 smartphones. The MSM7227 chipset features integrated Bluetooth 2.1 and GPS, a 600-MHz applications processor with a floating point unit, 320-MHz application DSP, 400-MHz modem processor, hardware-accelerated 3D graphics, 8-megapixel camera, and 30-fps WVGA video encode and decode and display support.

    The MSM7227 chipset is designed to provide advanced processing and multimedia while using HSDPA/HSUPA for broadband data speeds over 3G networks. It also can support all leading mobile operating systems including Android, Symbian S60, Windows Mobile and BREW Mobile Platform, according to the company.

    The MSM7227 chipset has a 12 x 12 millimeter footprint and lower power consumption than previous MSM7xxx-series chips. It is sampling now, and commercial smartphones based on the chip are expected to launch later this year.

    Broadcom Combos GPS, Bluetooth, and FM Radio System-on-Chip

    Broadcom Corporation of Irvine, California, has released BCM2075, a new, integrated GPS, Bluetooth, and FM radio in a single-chip design, targeting location-based services (LBS) applications. The processor reduces the host and application processing required by competing combo solutions, enabling greater adoption in mass market handsets, according to the company.

    The BCM2075 integrates four radios (Bluetooth, GPS, FM receive, and FM transmit), enabling the radios to operate simultaneously and with minimal interference.

    The company expects the chip to drive key handset applications that network operators and consumers are looking to adopt, furthering the cause of LBS and advanced multimedia available on mid-range mobile phones. The GPS core uses a host-based integration architecture that splits the processing duties between the BCM2075 and the host CPU system and provides low GPS power, delivering a reported 50 percent better power performance compared to other chips, the company said. Broadcom’s GPS technology, stemming largely from its July 2007 purchase of Global Locate, enables a fast time-to-first-fix and provides integrated support for other positioning technologies, such as Wi-Fi positioning.


  • ITC Upholds Broadcom Claims, Issues Order Against SiRF

    The U.S. International Trade Commission (ITC) has issued an exclusion order against certain SiRF GPS chips and products containing those chips imported into the United States, as well as cease-and-desist orders against SiRF and four specific SiRF customers.

    This comes after the commission affirmed an ITC administrative law judge’s initial determination that SiRF infringes on three additional GPS patents held by Global Locate Inc., a wholly owned subsidiary of Broadcom. This latest ruling brings the total number of Global Locate GPS-related patents that SiRF has been found to infringe up to six.

    In 2008, an ITC administrative law judge found that SiRF infringed on all six patents asserted by Global Locate/Broadcom and subsequently recommended an import ban within in the United States; SiRF appealed the finding. The full ITC Commission subsequently upheld the administrative law judge’s finding on three patents, while holding off on a final determination on the other three pending further review. On Thursday, January 15, the commission issued both its Final Determination on those patent issues and orders regarding the appropriate form of remedy.

    “We are optimistic that the ITC orders will become effective after a 60-day statutory review period so that U.S. Customs may begin enforcement and prevent any further patent infringement,” said David Rosmann, Broadcom’s vice president for intellectual property litigation.

    The six patents at the center of the dispute are United States patents 6,417,801; 6,937,187; 6,606,346; 7,158,080; 6,704,651; and 6,651,000 — relating to extended ephemeris assistance, calculating time in GPS receivers, enhancing sensitivity in assisted GPS systems, and implementing hardware structures for parallel correlation, according to Broadcom. These patents involve several SiRF products, including SiRFstarIII and SiRFInstant devices.

    For its part, however, SiRF said that the impact of the ITC’s decision is minimal, as the products involved are legacy products. It also hinted that it could still file an appeal in federal court.

    “We are pleased that the commission followed the Federal Circuit’s Kyocera ruling, which significantly limits the impact to our customer base,” said Kanwar Chadha, founder of SiRF in a statement. “While disappointed with the commission’s ruling as it relates to its patent infringement findings regarding SiRF’s earlier products, we continue to work closely with the named customers to conform with the commission’s ruling and enable them to maintain uninterrupted product delivery to market.”

    Chadha was referring to a federal circuit court’s October 14, 2008, decision that ITC limited exclusion orders only affect parties named in an investigation involving Kyocera. Other than the four named customers in the investigation, all other SiRF customers are not affected, the company said. Those four customers have not been named publicly.

    SiRF further noted that following the 60-day presidential review period it has the option to appeal the case to the U.S. Court of Appeals for the Federal Circuit, but did not specifically say it would pursue this option. Broadcom and SiRF are already duking it out in federal district court over patent disputes; that trial is scheduled to begin in November 2010.

  • GNSS Receiver Evaluation

    Record-and-Playback Test Methods

    This article addresses how best to quantify “which navigation system performs best” in a realistic testing scenario. The methodology focuses on land vehicles navigating in urban environments, but applies equally well to pedestrian navigation and can be adapted for testing assisted-GNSS implementations. During a drive test, the truth-reference system and RF recording system log samples to disk, with no need for the receivers under test to be included during the actual drive. 

    By Eric Vinande, Brian Weinstein, Tianxing Chu, and Dennis Akos, University of Colorado, Boulder

    FIGURE 1. Traditional in-vehicle receiver testing.
    FIGURE 1. Traditional in-vehicle receiver testing.

    Radio frequency record-and-playback systems (RPS) have recently become commercially available. These systems sample the RF environment and store it to disk during a drive test and can replay it through receivers back in the lab environment. Here we explore the improvements in dynamic testing methodology created by these units.

    RPS test system installation.
    RPS test system installation.

    RPS constitute a stark contrast to more traditional signal simulators that use pre-defined trajectories and mathematical models to determine appropriate RF output. Signal simulators attempt to reproduce environmental error factors such as multipath, inertial aiding system errors, and building and vehicle obstructions. They rely on mathematical models to simulate these various error sources. In some cases they do a reasonable job of reproducing these errors, but the dynamic urban environment is so complex (for example, rapidly varying/fading signal strength(s), multiple multipath signals, short/long duration obstructions of multiple layers) that even a sophisticated mathematical model can not replicate all effects completely. Some simulators include software that enables the user to define a trajectory and a limited amount of urban scenario details. Again, only so much realism can be created in a simulation environment. Existing testing standards are simulator-based, and as such, are circumscribed by the signal simulator limitations in representing a dynamic environment.

    Positioning performance of a satellite navigation receiver under test (RUT) is coupled with its RF front-end system and local oscillator quality. Because of the variation in RF components between RUTs, some likely have superior RF interference (RFI) immunity. RFI can be a serious issue in certain land vehicles due to on-board electrical systems or because of external interference sources.

    This article describes a testing method applicable to all receiver types, and complementary to that described in the December 2009 GPS World article by Mitelman and colleagues, “Testing Software Receivers,” regarding validation testing within a production environment. Added elements include taking into account truth-system uncertainty and a repeatability verification of the RF playback process through non-deterministic hardware receivers.

    We present here the dynamic testing approach currently used at the University of Colorado in Boulder for receiver evaluation and comparison in the urban environment. The approach also includes the ability to assess the effect of sensor augmentations (for example, inertial, environmental) on positioning performance.

    Truth Reference. Comparison with a truth reference system is essential for evaluation of satellite navigation receivers. For dynamic testing, this typically includes a survey-grade receiver coupled with a tactical-grade (or better) inertial measurement unit (IMU) and associated carrier-phase differential post-processing software. This software is filter-based and provides a positioning-error estimate in various components. Truth reference systems provide a continuous position estimate whose quality can vary depending on factors experienced in the urban environment, including length of full/partial satellite signal outage. In this study, we subtracted the 99th-percentile horizontal positioning error estimate of the truth system from the nominal RUT positioning error at each reporting epoch, as shown in Figure 2.

    If the RUT position happens to lie within the truth-system position uncertainty, it is not considered to have any position error.

    We focus here on a method to evaluate and compare mass-market, consumer-grade receivers to survey-grade receivers. One difference between these two receiver types is the way they handle the trade-off between accuracy and availability. Consumer receivers strive to provide the user with the highest availability, whereas survey receivers’ goal is to maximize accuracy. As a result, consumer-grade receivers will produce more regular position updates in harsh signal-tracking conditions, but must sacrifice accuracy to do so.

    FIGURE 2. RUT position error calculation
    FIGURE 2. RUT position error calculation

    Current Testing Standards

    Currently accepted A-GPS standards such as those used by the 3rd Generation Partnership Project (3GPP) provide very limited dynamic testing in simulated urban conditions, being mainly designed to evaluate the first position calculation achieved in a particular simulated scenario. High-sensitivity receivers that pass or greatly exceed the 3GPP tests, in our opinion, are not guaranteed to have superior navigation performance in urban areas. Also, local oscillator performance is not specified. The trajectory dynamics imposed can actually be much smaller than the clock dynamics of a very low-cost local oscillator. A GPS receiver cannot tell the difference between the two and must track the effective Doppler variation.

    The 3GPP defines five independent tests for A-GPS receiver certification. They include tests in the areas of: sensitivity with coarse/fine time assistance, nominal accuracy, dynamic range, multipath performance, and moving scenario/periodic update performance. The last three tests include elements that ostensibly pertain to the urban environment. These tests specify discrete, constant signal power levels for implementation in a hardware signal simulator. The discrepancy between the 3GPP-prescribed signal levels and those observed during actual drive testing is detailed as follows.

    The 3GPP moving scenario/periodic update performance test trajectory is shown in Figure 3.

    FIGURE 3. 3GPP dynamic testing trajectory (van Diggelen, A-GPS: Assisted GPS, GNSS, and SBAS, Artech House)
    FIGURE 3. 3GPP dynamic testing
    trajectory (van Diggelen, A-GPS: Assisted
    GPS, GNSS, and SBAS, Artech House)

    This test profile calls for the simulation of five satellites with a constant signal strength of 2130 dBm while the vehicle travels around the racetrack trajectory. In contrast, during an actual drive test in an urban area, a receiver reported the distribution of carrier-to-noise-density values for all tracked satellites as shown in Figure 4. This more accurately shows the range of signal strengths that should be expected in urban conditions.

    FIGURE 4. Drive-test C/N0 distribution
    FIGURE 4. Drive-test C/N0 distribution

    The 3GPP moving test is considered passed if positions are reported regularly, and 95 percent of them are within 100 meters of the true position. This is not a particularly difficult test for a RUT to retain signal lock through, as the linear acceleration is about 0.15 g and the centripetal acceleration is about 0.25 g.

    It is difficult for independent third parties to carry out a receiver evaluation following 3GPP guidelines as several of the tests require receiver restarts, which in turn requires testing automation. Depending on the receiver-evaluation hardware availability, restart commands may not be available to to an independent evaluator.

    3GPP receiver testing results are quoted as pass or fail over a large number of short evaluations. For the dynamic environment, the system performance over continuous time is required to make a proper comparison between evaluated receivers.

    In general, evaluating the GPS engines embedded within cell phones or other devices is difficult. Most are not made to interface with an external antenna, and the mere act of adding an antenna connection can significantly alter performance. The output format is not always documented, if it is even available to an end user. To allow fair across-the-board comparisons, GPS chipset manufacturers should make available development kits that have external antenna connections and well-documented message output formats.

    Drive-Test Configuration

    Current live dynamic testing requires multiple systems to be operating in a moving vehicle (see opening Figure 1). A truth-reference system, usually a high-grade GPS/INS device along with post-processing, provides the basis to which all other RUT are compared. This system requires a dedicated vehicle rooftop antenna with the best possible sky view, separate from a lower-grade test antenna located within the vehicle. Each RUT is connected to the representative consumer-grade antenna located in the vehicle through a high-isolation splitter that suppresses inter-receiver interference. It is important at this point that the gain be set appropriately for each RUT, depending on the front-end expectations while maintaining an equivalent noise figure across all receivers.

    Visualization Methods

    In addition to quantitative methods, we have created a qualitative visualization to assist with interpretation of the raw data. The same parsed data sets that provide the statistical script input are fed into a viewer script along with the post-processed truth reference data. With the truth-reference system data plotted in the center of the screen, each RUT is then plotted the correct distance and direction away, based on the distance and direction of error compared to truth. The receiver plots are overlaid onto Google Earth images centered on the truth-reference location. Plots of number of satellites utilized (top right of Figure 5) and elevation (middle right) as reported by each receiver and the sampled RF spectrum (lower right) are also included.

    For each reporting epoch, based on the data frequency of the truth-reference system, a frame is generated with the aforementioned characteristics. These frames are gathered and encoded into a movie clip which can then be used as a quick and simple qualitative tool for receiver comparison. Figure 5 shows an individual movie frame. A forward-looking camera capability is also being added to this movie so the test environment can be documented from multiple angles.

    FIGURE 5. Movie visualization screenshot
    FIGURE 5. Movie visualization screenshot

    While observing this movie, variations in the sampled RF spectrum from interference or blockages can be associated with the current landscape. Locations of RFI sources can be identified and avoided (or included) in future testing. These RFI and significant blockage locations are of interest for receiver RF component and navigation filter development. The next three figures show spectrum snapshots during various parts of a drive test. In Figure 6, the cumulative GPS spectra rises above the noise floor and is visible during open sky conditions. While below ground level, Figure 7 shows only the front-end filter shape (and relatively minor RFI). Figure 8 shows an example of severe RFI when near a specific parking garage location.

    FIGURE 6. Open-sky spectrum (centered on 1575.42 MHz)
    FIGURE 6. Open-sky spectrum (centered
    on 1575.42 MHz)
    FIGURE 7. Spectrum while below ground level (centered on 1575.42 MHz).
    FIGURE 7. Spectrum while below ground
    level (centered on 1575.42 MHz).

    FIGURE 8. Spectrum near interference source (centered on 1575.42 MHz).
    FIGURE 8. Spectrum near interference
    source (centered on 1575.42 MHz).

    Record/Playback Concept

    To overcome the limitations of hardware signal simulators and repeated vehicle drive testing, the RF record/playback testing method is utilized at the university. Commercially available equipment, capable of recording and playing back an RF signal, has recently become available. Equipment options exist for between $10,000–100,000, with 1–16 bit sampling and 4–25 MHz front-end bandwidth.

    Figures 9 and 10 show the concept of “record once, playback many times.” During a drive test, the truth-reference system and RF recording system log samples to disk. There is no need for the RUT to be included during the actual drive test.

    FIGURE 9. Recording mode block diagram.
    FIGURE 9. Recording mode block diagram.
    FIGURE 10. Playback mode block diagram
    FIGURE 10. Playback
    mode block diagram

    In the laboratory, the logged RF samples are replayed through a splitter to all RUT. The effect of receiver configuration changes can be evaluated without having to repeat the drive test. At a later time, additional receivers can also be tested using the same stored RF sample file.

    During separate record and playback phases, testing considerations and methods discussed previously are implemented.

    Since the recording process can only obviously capture current conditions, additional drive-test collections are required if different satellite geometry is desired, or if additional representative antennas need to be evaluated.

    Repeatability of RPS Testing

    To validate that the playback signal levels were not significantly different from live signals, we conducted an urban, dynamic evaluation. Figure 11 shows that there is typically not more than a 1 dB difference in reported C/N0 between live and playback modes when testing a receiver that only reported integer values. The two dropout instances were excursions into parking garages.

    FIGURE 11. Live and playback C/N0 values
    FIGURE 11. Live and playback C/N0 values

    Figure 12 compares the navigation statistics between replays, using the same five playbacks as in Figure 11. The playbacks show a 1-sigma horizontal position solution spread under 1 meter for approximately 83 percent of the test.

    FIGURE 12. Playback Horizontal Position Error Spread.
    FIGURE 12. Playback Horizontal Position Error Spread.

    These two figures verify the repeatability of the RPS testing method and solidify it as an alternative to both signal-simulator testing and live testing of satellite navigation receivers.

    Denver Testing Method

    To evaluate the RPS concept, we conducted tests in three locations: Boulder, Denver, and Interstate Highway 70, all in Colorado. The Boulder and Denver locations were urban collections, while the Interstate 70 location was a natural canyon with significant elevation change. The collection at each location was repeated with two different representative antennas (patch and cell phone) at nearly the same sidereal time in order to keep the overhead satellite constellation similar.

    We examine here the November 11 and 16 Denver tests. The November 11 test used a patch antenna that places nearly all its gain in the upward direction, making it more immune to interfering sources below and to its sides. Figure 13 shows the patch antenn
    a location on the van, as well as the truth-system antenna location utilized for testing on both days.

    FIGURE 13. Patch antenna (dashboard) and truth-system antenna (rooftop) locations.
    FIGURE 13. Patch antenna (dashboard) and
    truth-system antenna (rooftop) locations.

    The November 16 test used a cell-phone GPS antenna that does not have a preferential gain direction, making it more susceptible to interfering sources below and to its sides. This antenna type is representative of the typical low-cost antenna (in some cases as simple as a piece of wire) found in consumer cell phones. Figure 14 shows the cell-phone antenna suction-cup mounted to the front window of the testing van. The representative antenna mounting location was chosen to minimize locally-generated RFI effects while also being representative of a typical vehicle-use case.

    FIGURE 14. Cell-phone antenna location.
    FIGURE 14. Cell-phone antenna location.

    The required equipment and connections are minimal when performing RPS drive testing, as no RUTs are included. The inset to Figure 1 at the beginning of this article shows the RPS unit in the rear of the van, mounted on layers of foam to reduce vibration, which, if not properly addressed, can cause errors in mechanical hard drives writing data at high rates. Also visible are the truth receiver on the center of the van floor, and the car batteries for powering it and the IMU. The IMU is mounted to the vehicle frame and is not shown.

    The test drive trajectory through Denver on November 11 and 16 as reported by the truth system is shown in black in Figure 15 and is also repeated in Figures 16 and 17. The test lasted approximately 40 minutes on both days. It started in the upper left part of Figure 15 and continued zig-zagging through downtown to the lower right.

    FIGURE 15. Truth trajectory for November 11 and 16 tests.
    FIGURE 15. Truth trajectory for November 11 and 16 tests.

    Figures 16 and 17 show particularly difficult blocks for the four receivers tested under the replay method. These receivers are denoted A (green), B (blue), C (red), and D (yellow).

    FIGURE 16. Difficult block #1 during November 11 test and truth system antenna (rooftop) locations.
    FIGURE 16. Difficult block #1 during November 11 test and truth
    system antenna (rooftop) locations.

    The horizontal positioning error statistics for two receivers on the November 11 test are shown in Figures 18 and 19. The left side shows horizontal error in two different zoom levels. The right side shows a histogram and cumulative distribution of errors, and several reporting metrics over the entire test. Even though receiver A in general outperformed receiver B, from the error time histories there are noticeable periods where both receivers simultaneously had positioning difficulties.

    FIGURE 17. Difficult block #2 during November 11 test.
    FIGURE 17. Difficult block #2 during November 11 test.

    Table 1 summarizes the horizontal positioning statistics for all receivers during both tests. Positioning accuracy was severely degraded when replaying samples collected with the cell-phone antenna as compared to the patch antenna. Receiver A was the most accurate across both tests, while receiver B was the least accurate. The uncertainty of the truth system was subtracted out when producing the horizontal positioning results for all receivers.

    Table 1
    Table 1

    Conclusions

    The record-and-playback system testing approach, in our opinion, represents the best way to test hardware receivers. It overcomes the fidelity limits of simulator-based testing, especially when considering the difficult-to-model urban environment. During receiver development, it requires only a single drive test for each location, as sampled RF data can be replayed from disk.

    FIGURE 18. Receiver A horizontal positioning error statistics (November 11 test).
    FIGURE 18. Receiver A horizontal positioning error statistics (November 11 test).
    FIGURE 19. Receiver B horizontal positioning error statistics (November 11 test).
    FIGURE 19. Receiver B horizontal positioning error statistics (November 11 test).

    Having demonstrated that RPS testing is repeatable, we have produced a library of RF sample files representing real-world conditions for continued receiver development and testing purposes.

    • Eric Vinande is Ph.D. student at the University of Colorado studying GPS/MEMS inertial sensor integration and urban RFI aspects.
    • Brian Weinstein is a BSEE student participating in the Undergraduate Research Opportunity Program for GNSS receiver testing at the University of Colorado.
    • Tianxing Chu is a visiting researcher at the University of Colorado from Peking University where he is a Ph.D. student.
    • Dennis Akos is an associate professor within the Aerospace Engineering Sciences Department at the University of Colorado with concurrent appointments at Stanford University and Luleå University of Technology.

    Manufacturers

    Development of the methodology described here used two different RPS systems, one from LabSat (RaceLogic) and one from Averna. The test data come from the Averna system.

  • ITC to Review SiRF/Broadcom Patent Imbroglio

    The U.S. International Trade Commission (ITC) has said it will review the determination of one of its administrative law judges that previously found that SiRF Technology infringed on patents held by Broadcom subsidiary Global Locate.

    The ITC judge ruled in August that certain SiRF products, including SiRFstarIII and SiRFInstant GPS architectures, infringed upon six Global Locate/Broadcom patents; the judge later recommended to the ITC that it issue a ban on the import of related SiRF chips into the United States.

    Both SiRF and ITC staff filed appeals independently of one another seeking a review of the ruling. Now, the ITC has said it will review claims on three out of the six patents, according to SiRF.

    The commission has requested written submissions from the parties involved to address the form of remedy, if any, that should be ordered. According to the notice, if the commission contemplates some form of remedy, it must consider the effects of that remedy upon public interest, SiRF noted.

    The final ITC ruling, slated for December 2008, is further subject to a 60-day presidential review period and can then be appealed to the Federal Circuit Court of Appeals.

    SiRF, Qualcomm Play Nice

    Apparently SiRF and Qualcomm want to avoid the legal snafu in which SiRF and Broadcom are currently embroiled. SiRF also announced that it and Qualcomm have signed a mutual Patent Non-Assertion Agreement covering each party’s patent portfolio.

    “We believe that this agreement between leading innovators of A-GPS enabled location technology will help expand the market for location-enabled products, services and content, while enabling each of us to compete in the marketplace based on product merits,” said Kanwar Chadha, SiRFs founder and vice president of marketing.

    It’s been a busy week for SiRF; on Wednesday it took the wraps off its SiRFlinkIII, a single chip that combines a GPS RF front end with a Bluetooth 2.1 + EDR controller.

  • ITC Upholds Ruling in SiRF/Broadcom Patent Dispute

    The U.S. International Trade Commission (ITC) has denied the request of SiRF Technology to review its initial determination that found that Broadcom subsidiary Global Locate Inc. didn’t infringe two SiRF GPS patents.

    ITC Administrative Law Judge Paul Luckern had previously ruled that two of SiRF’s GPS patents were not infringed by Global Locate and that the asserted claims of one of the patents were invalid, following a six-day trial last March, according to Broadcom. SiRF had already dismissed two additional patents from the case before trial.

    This ITC case is separate from a case in which an ITC judge ruled earlier this month that certain SiRF Technology products, including SiRFstarIII chipsets, infringe six patents related to improving GPS processing and sensitivity held by Global Locate.

    Broadcom and SiRF have been battling on multiple fronts over patent infringement claims in federal court, the ITC, and before the U.S. Patent and Trademark Office. The August 8 ITC ruling against SiRF caused the company’s stock to take a pounding on Wall Street.

  • ITC Says SiRF Infringes Six Broadcom Patents

    A U.S. International Trade Commission (ITC) judge has ruled that certain SiRF Technology products infringe six patents related to improving GPS processing and sensitivity that are held by Global Locate Inc., a wholly owned subsidiary of Broadcom.

    The infringement findings cover a range of SiRF products, including those incorporating the SiRFstarIII and SiRFInstant GPS architectures, according to Broadcom.

    The ruling came Friday, August 8, just a day after SiRF said it had asked the U.S. Patent and Trademark Office reexamine four patents that are the subject of an infringement suit Broadcom has brought against SiRF in federal court. Furthermore, In June the ITC rejected claims by SiRF Technology that Global Locate infringed upon two of its patents, and also found that SiRF’s asserted claims on one of the patents at issue were invalid.

    The ruling Friday followed a trial earlier this year. Broadcom said it expects a final determination by the full six-person commission by early December.

    The six patents that SiRF was found to infringe are U.S. patents 6,417,801; 6,937,187; 6,606,346; 7,158,080; 6,704,651; 6,651,000 — relating to extended ephemeris assistance, calculating time in GPS receivers, enhancing sensitivity in assisted GPS systems, and implementing hardware structures for parallel correlation, according to Broadcom.

  • SiRF Requests Reexamination of Broadcom Patent Ruling

    SiRF Technology Holdings, Inc. of San Jose, California, has completed filing with the U.S. Patent and Trademark Office official requests for reexamination of each of the four patents that Broadcom recently asserted against SiRF in the Santa Ana, California, federal district court.

    SiRF seeks review and invalidation of all four of the Broadcom patents named in the lawsuit, through its requests for ex-parte reexamination and in view of what it terms “substantial new questions of patentability raised by prior art not previously considered by the Patent Office,” according to the company.

    SiRF also intends to seek a stay of the federal district court case.

    SiRF and Broadcom have been engaged in an ongoing legal battle over patents held by their respective companies, both claiming patent infringement. In late June, SiRF Technology petitioned the International Trade Commission (ITC) to review part of a ruling that found that Broadcom didn’t infringe upon two of its patents as the company alleged.

    A ruling in Broadcom’s six claims of patent infringement against SiRF before the ITC is expected any day. The trial took place in April.