The mobile mapping market size is expected to be worth more than $40 billion by 2024, according to a new research report by Global Market Insights.
The mobile mapping market is propelled by the increasing adoption of mobile devices such as smartphones and tablets across the globe. Smartphone users are extensively using mapping applications on their devices for navigation and driving assistance, the report said.
Furthermore, they are also leveraging on the GIS and GPS applications to access geo-referenced data for searching nearby restaurants, cinema halls and other landmarks. This is encouraging the technology companies to commence mapping across the globe to acquire accurate GIS data and provide an enhanced customer experience.
High initial investment is a major factor limiting the growth of the mobile mapping market. Currently, the market comprises a few major players with a long-standing expertise in location-based technologies. High initial investments in developing mobile mapping systems and assembling major components have restricted the entry of new players in the market.
According to the report, the software market is anticipated to grow at a CAGR of 15 percent over the projected timespan. The growing demand for geo-referenced data acquisition and data analysis software among the organizations is driving the mobile mapping market growth. The software assists organizations in simplifying the data extraction process by combining the vital details. It retrieves geographic and spatial data captured by the positioning devices to develop maps and other graphic displays. This data is also used by enterprises to build effective decision support systems, which will drive the market demand.
The report includes key industry insights in 250 pages with 341 market data tables and 38 figures and charts from the report, “Mobile Mapping Market Size, By Component (Hardware [Imaging Device, Laser Ranging Device & Scanning Device, Positioning Device], Software [Mapping Data Extraction, Data Processing], Service [Consulting, Integration & Maintenance, Managed Service]), By Application (Road & Railway Survey, GIS Data Collection, Vehicle Control & Guidance, Asset Management), By End-User (Agriculture, BFSI, Government & Public Sector, Real Estate, Retail, Mining, Telecommunication, Transport & Logistics), Industry Analysis Report, Regional Outlook (U.S., Canada, the United Kingdom, Germany, France, Italy, Spain, Australia & NZ, China, India, Japan, South Korea, Brazil, Mexico, Argentina, GCC, Israel, South Africa), Growth Potential, Competitive Market Share & Forecast, 2018 – 2024.”
The mobile mapping technology is used for conducting road and rail surveys, collecting GIS data, and developing vehicle control and guidance systems and asset management systems. The road and rail survey market is expected to register a growth rate of over 17 percent during the forecast period. It is used to analyze the road and rail infrastructure and plan the engineering operations with minimum disruptions. The surveying authorities across the globe are using mobile mapping technology to create maps for the transportation department for road assessment purposes.
The agriculture sector is estimated to grow at a CAGR of 22 percent during the forecast timeline. The integration of the GPS and GNSS devices into the farming process to acquire geospatial data is the primary factor driving the mobile mapping market share. Furthermore, the ability of the mobile mapping technology to monitor the crop yield and land variability also augments the demand for the technology among the farmers.
The European region accounted for over 25 percent global mobile mapping market in 2017. The increasing investments by the government agencies have accelerated the adoption of mobile mapping technology in the region. For instance, in 2017, the U.K. government established the Geospatial Data Commission to frame a strategy for using the public sector location data to support the country’s growth.
The Asia Pacific region will grow at a rapid pace over the forecast timespan. The rapid urbanization of the region and the growing number of infrastructural projects have fostered the growth of the mobile mapping market in the region. Moreover, the widespread adoption of smartphones has also driven the market size.
Prominent players operating in the mobile mapping market are Phoenix LiDAR, Sharp Corporation, Teledyne Optech, TomTom International, Topcon Positioning Systems, MapJack, Mapquest, Navteq, NCTech, Microsoft, Mitsubishi, NovAtel, Phaseone industrial, Hexagon, EveryScape, Foursquare Labs and XIMEA.
The major companies in the market are collaborating with other expert companies in the market to develop new product offerings and conduct strategic acquisitions to gain a competitive advantage over its competitors.
For instance, in 2017, Garmin acquired Navionics, a provider of electronic navigational charts to the marine industry. This acquisition is aimed at combining the data from Navionics charts and Garmin’s blue charts to develop improved navigational services to its customers. Similarly, in 2017, Hexagon entered into an OEM partnership with Smart Guided Systems to develop new precision technologies for commercial applications.
The global mobile mapping market research report includes an in-depth coverage of the industry with estimates and forecast revenue in USD respectively from 2013 to 2024, for the following segments.
Mobile Mapping Market, By Component
Hardware
Imaging device
Laser ranging and scanner device
Positioning device
Software
Mapping data extraction
Data processing
Service
Consulting
Integration & maintenance
Managed
Mobile Mapping Market, By Application
Road & railway survey
GIS data collection
Vehicle control & guidance
Asset management
Mobile Mapping Market, By End-User
Agriculture
BFSI
Government & public sector
Real estate & infrastructure
Retail
Mining
Telecommunication
Regions and Countries
North America
U.S.
Canada
Europe
UK
Germany
France
Spain
Italy
Asia Pacific
ANZ
China
India
Japan
South Korea
Latin America
Brazil
Mexico
Argentina
MEA
GCC
South Africa
Israel
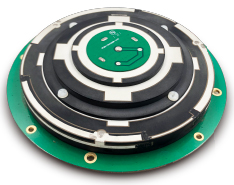
Real-time kinematic (RTK) integration usually uses separate antennas, which can lead to reduced efficiency because of electro-magnetic interference (EMI).
Image: HarxonImage: Harxon
Also, conventional antenna installation can result in unstable machine performance because of the problems of system compatibility between different antennas.
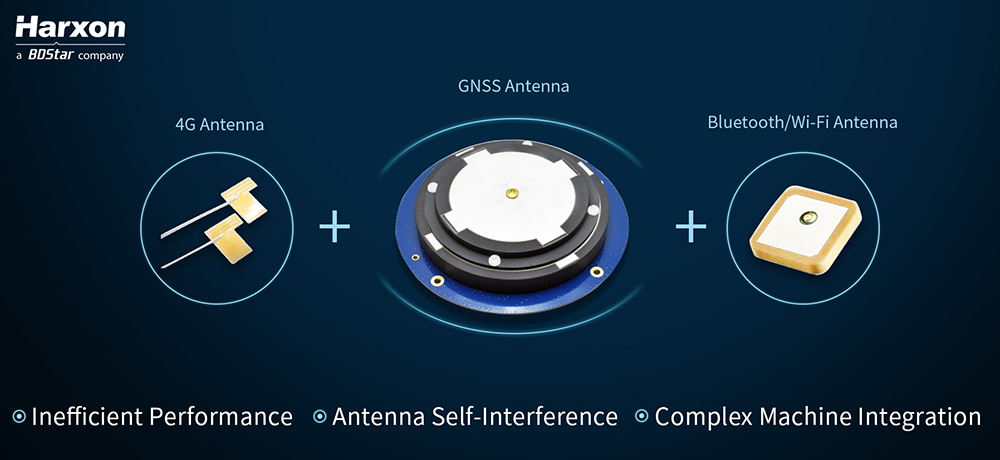
Harxon has overcome those difficulties with its integrated X-Survey antenna, a 4-in-1 OEM antenna for both navigation and communication in surveying applications.
It provides standard Wi-Fi, Bluetooth and 4G, plus multiple constellation signal reception for GNSS positioning.
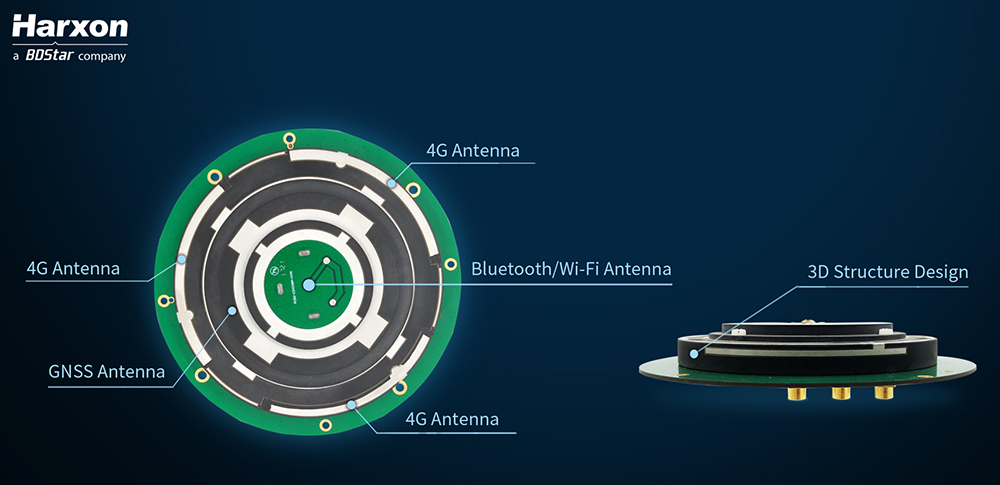
The high-gain and wide-beamwidth GNSS antenna features a multi-point feeding technology, ensuring a high phase-center stability and positioning accuracy, the company said. Moreover, the array-arranged 4G antennas enables more stable signals and longer communication distance at 360-degree direction, increasing the overall machine efficiency over conventional antennas.
The X-Survey antenna provides high isolation among each antenna to prevent self-interference, improving RTK system compatibility. RF coaxial connectors are designed for plug-and-use, keeping high efficiency and lowering the impact of EMI.
The antenna low-noise amplifier features excellent out-of-band rejection performance, which can also suppress the EMI, providing reliable GNSS signals.
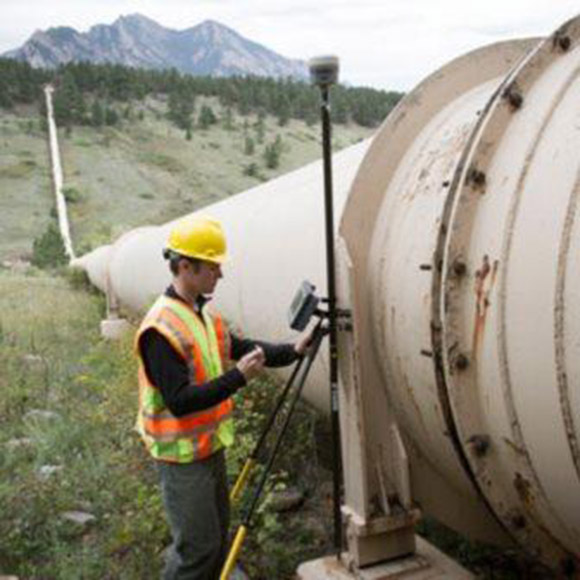
The unique structure design simplifies RTK integration, and minimizes the overall machine dimension. Harxon aims to bring system integrators high-efficiency performance of navigation and communication in surveying and precision agriculture applications.
4G bands can be customized according to different countries and regions, the company added.
A video featuring a South African veteran surveyor, telling his story of achieving 2 cm horizontal accuracy with Trimble CenterPoint RTX. Satellite-delivered, survey grade accuracy and no base station required!
The Trimble RTX GNSS corrections technology can now achieve horizontal accuracies of better than two centimeters, according to Trimble.
Start-up times, commonly referred to as convergence, have also improved.
(Photo: Trimble)
Users can now achieve full accuracy in less than 15 minutes, and as fast as one minute in select areas where RTX Fast network infrastructure is available, the company added.
This performance is achievable using Trimble’s premier correction service, CenterPoint RTX, delivering RTK-level accuracy outside traditional Virtual Reference Station (VRS) networks, considered the gold standard for high-accuracy corrections.
Trimble’s RTX network is available throughout most of the world, with the RTX-Fast network coverage available in select geographies in the U.S., Canada and throughout most of Europe when using Trimble RTX compatible GNSS receivers.
Trimble RTX provides a satellite-delivered correction source. In addition, corrections are available via an Internet or cellular connection, adding to its versatility.
With satellite-delivered Trimble RTX corrections, users can perform a variety of positioning fieldwork in some of the most remote locations, without relying on traditional ground-based VRS networks or a local RTK base station to receive high-accuracy positioning data.
By powering on an RTX-capable receiver or display, customers can start working quickly with only a minimal convergence period, Trimble said. As long as users have line of sight to the sky they can work freely without being constrained by the geographic boundaries of a VRS network.
Offering a suite of correction services, Trimble RTX provides users the flexibility to choose the level of accuracy to suit their application needs from meter to centimeter level. It is designed for a variety of applications including agriculture, survey, mapping, construction, automotive and any location-based service that could benefit from greater precision.
Trimble RTX also powers Trimble xFill technology, a feature that enables RTK and VRS users to continue working if their primary correction stream is not available. xFill, delivered via satellite, “fills in” for RTK corrections in the event of temporary radio or Internet connection outages. As a result, users can experience fewer interruptions and less downtime.
“Trimble RTX performance and reliability are changing the positioning game for users who never considered a satellite-delivered correction service for applications traditionally requiring RTK-level accuracy,” said Patricia Boothe, vice president of Trimble’s Advanced Positioning Division. “Trimble RTX offers a global solution delivering similar performance to VRS where terrestrial networks are not available.”
Subscriptions are available through Trimble’s Authorized Business Partners or Trimble’s online store.
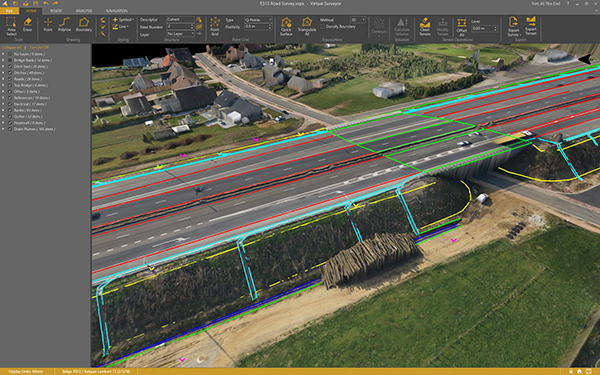
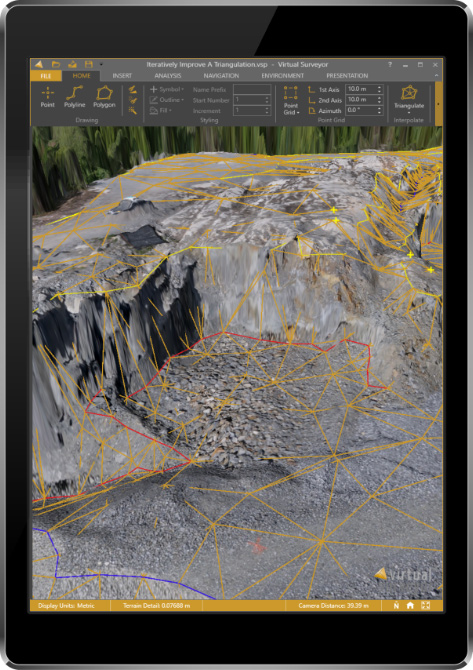
The newly released version 6 of the Virtual Surveyor drone surveying software offers a faster, more efficient workflow and better overall user experience in a more stable platform, according to the software maker.
Version 6 offers new capabilities, an improved licensing system and an extended free application.
“Surveyors who have used the Virtual Surveyor package in the past will be amazed at how easily they can manipulate data and how quickly the software renders results of even the most complex topographies,” said Tom Op ‘t Eyndt, managing director of Virtual Surveyor nv in Belgium.
Virtual Surveyor leverages the expertise and interpretation skill of a land surveyor and combines it with the computing power of the computer, the company said.The software generates an interactive onscreen environment through orthophotos and digital surface models, generated from the unmanned aerial vehicle (UAV), where the surveyor selects survey points and breaklines to define the topography.
Image: Virtual Surveyor
Virtual Surveyor enables land surveyors to complement traditional fieldwork with UAV imagery to generate highly accurate topographic products up to five times faster than otherwise possible. It bridges the gap between UAV photogrammetric processing software and engineering computer-aided design (CAD) packages.
“The focus of Version 6 development has been to streamline the workflow — from the importing of drone data to exporting topo information into CAD — to make the surveyor more productive,” Op ‘t Eyndt said.
Key enhancements in Virtual Surveyor 6 include the following:
Easier editing – The new editing functions allows users to quickly select, delete or move individual point and lines placed by the computer during the automated creation of elevation points. The associated Undo/Redo function allows reversing all edit operations.
Better CAD integration – The addition of Descriptor functionality means that point descriptions remain with the point during export to CAD, working the same way as the land surveyor collects data in the field.
3D geometry retained – All points, lines and other data imported into the software, either from a UAV or field surveyed data, retain elevation values and integrate seamlessly into the merged scene. This allows a surveyor, for example, to collect point values from a ditch bottom that may be obscured by vegetation in the drone image and have the bottom points accurately represented in the topography.
Improved drawing tools – Users can now densify (drape) lines and boundaries to map current surface conditions. Individual vertices are now adjustable in all directions and exact X, Y and Z locations can be specified as well. Sub-surface modeling is now possible with these new improvements. Created features can then be exported to CAD for profile or alignment creation.
Extended free plan – Referred to as the Valley version, the free Virtual Surveyor suite has added functionality, including the ability to import photogrammetric data.
Improved licensing – We better honor our principle: “The license follows the user”. With an improved licensing system based on a Virtual Surveyor Identity (email) the user will be able to work where he or she wants.
“The enhanced user experience will continue to appeal to professional land surveyors, who are our core client base,” said Op ‘t Eyndt. “And the seamless integration with CAD and advanced drawing tools will make Virtual Surveyor more attractive to design engineers.”
Virtual Surveyor is available in a free 14-day trial.
In the not-too-distant future, the following scenario may take place.
Image: Stockvault
A corporation owns an improved property in a large metropolitan city and has decided to sell it to a prospective buyer. Through a series of electronic messages and high-tech operations, the seller, buyer, their respective counsels, lending institutions and a title company are provided with documentation stating the condition of the site along with holograms and 3D digital models worthy of a science-fiction movie. In a matter of minutes, the deal is closed with monies and titles silently swapping places out in the ether.
Behind the scenes, the surveyor is a big part of this transaction. But how will the operation of the land title survey look in the future? Like everything else, artificial intelligence (A.I.) and blockchain technology will play a substantial role in surveying. I don’t profess to be the next Carnac the Magnificent, but it could look like this…
HOW IT ALL STARTS
The seller contacts their corporate attorneys to begin the contractual process. Requirements for the sale include acceptable and insurable conditions of the site and a clean title policy from a title insurance company, so the latest land title survey requirements will be held for site and title review. Once the seller and buyer are committed to a sale of the subject property, a blockchain is established in a transactional database to track every step of the sale.
Image: GSA
The attorney will consult with “Sheldon,” an artificial intelligence system built by a leading e-commerce company and designed to assist with business-to-business commerce. Sheldon will be used to secure the services of a land surveyor for the transaction. By researching available consultants based upon the information for the parcel contained within the blockchain, Sheldon contacts firms that could meet the criteria for this part of the transaction.
Once an appropriate firm is chosen by Sheldon, the data for the survey within the blockchain is uploaded to “Thomas,” a digital assistant designed specifically for surveyors. Thomas works with Sheldon and the blockchain to formalize an agreement, secure the necessary insurance requirements, and finalize a payment schedule for services.
ENTER THE SURVEYOR
Once the project is secured, Thomas creates a project file, downloads current satellite images, GIS data (including parcel, building and utility information), and recorded documents for the subject parcel. Among the information is parcel data for the project site. This data is based upon historical land surveys and converted into an accurate dataset in which most of the property and land corners are now included in the GIS database. All corners within the database have been installed or upgraded to contain an RFID chip imbedded within the top of the marker.
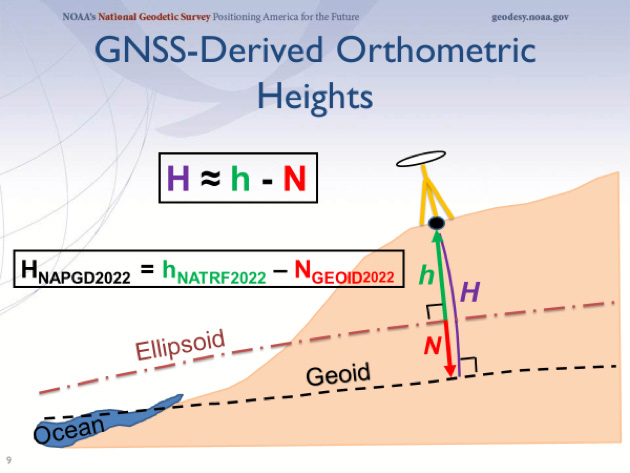
Image: NOAA
These GIS databases also take advantage of ongoing advancements of the North American Terrestrial Reference Frame of 2022 (NATRF2022). Beyond the initial implementation, the National Geodetic Survey has incorporated additional precision gained by improved L5 satellite reception and other nations’ satellite constellations in sub-centimeter location with most survey-grade receivers. Thomas compiles all site data into a comprehensive package for submission to the surveyor.
Because of the advancements with instrumentation and sensors in locating improvements both above and below the surface of the ground, the latest land title survey standard has moved all optional Table A items into required information to be provided on the plat. The standard also now requires a drainage analysis to be prepared to determine how the subject property relates to the adjacent parcels.
Thomas reviews the current backlog of project managers and assigns/transmits the project to the first available team. The chosen survey project manager receives the project information and creates an Ethereum blockchain file to work with the master blockchain and begin the survey process. By creating additional survey programming working in conjunction with the project blockchain, all parties involved in the transaction can monitor progress every step of the way.
The first responsibility of the survey PM is to work with Thomas to evaluate the existing data available for the project location. Current conditions from satellite imagery, improvement and utility information from existing governmental GIS databases, and parcel/easement information from recorded document sources are used to determine flight paths for UAVs utilizing multiple sensors, avoiding substantial obstacles. This process will also establish areas to be surveyed/verified by mobile methods where aerial data cannot be obtained.
All available information is processed by Thomas to establish the most efficient routes and methods of data collection for the parcel through software designed to compile and review spatial datasets. This software is specifically designed to review existing information for potential conflicts in flight and on-the-ground obstacles. Once completed, a flight plan for the UAV and route plan for the autonomous mobile vehicle will be reported with missed areas identified for manual data collection.
FIELD WORK ON STEROIDS
When the time arrives for field work to begin, a technician is dispatched in an autonomous electric truck pre-programmed to go directly to the site. The truck is loaded with various survey-grade instruments and equipment (all GNSS equipped): vertical take-off fixed wing and multi-rotor UAVs (both with lidar, photo, hyper-spectral, and GPR sensors), an autonomous mobile ground robot (with GPR/lidar sensors), and an RFID reader for boundary location.
The technician works with the equipment through a universal tablet computer controlling both aerial and ground data collection simultaneously, depicting the progress of the work in real time. This gives the technician time to locate the boundary points with the handheld GNSS receiver/RFID reader to verify the limits of the property.
Once the autonomous work is finished, the technician processes the data on site, and software compares collection coverage versus the initial site review. When processing is complete, the technician will utilize a handheld GNSS receiver with lidar sensor to obtain remote areas not collected by the other methods.
The remaining data is compiled with autonomous data and re-analyzed for overall coverage and approved by the software for completeness. Once the computer determines everything has been collected, the technician checks the complete box and leaves the site.
OFFICE WORK AND WRAP-UP
The final field data is uploaded to cloud servers as the technician leaves the site and the survey PM is notified by electronic message of the field task completion. Thomas, the digital surveying assistant, takes the lead and begins the final processing. The data is reviewed for completeness, parsed for any anomalies within the downloads, and compiled into one database for building a 3D model of the site.
Photo and lidar data are compared for accuracy, utilities are verified against existing records and easements, and building characteristics are matched against governmental records for zoning code compliance.
Once this analysis is complete, the final drafting takes place to create the final deliverable. While the data within the model contains attributes of each entity, labels are placed interactively throughout the site to help depict the site information. This model is also suitable for use by architects and planners to utilize in their B.I.M. design programs, so the quality in the modeling output is top notch.
The final deliverable contains an overall report documenting site conditions, drainage characteristics and physical conditions of various entities. This report will also detail potential site encroachments, possible drainage issues, and zoning/parking red flags. Thomas will report back to the survey PM that all final checks have been made and deliverables made for submittal to the client, leaving only the final transmittal left to do.
Once the deliverable is received by the client, Sheldon (the B2B automated assistant) recognizes the delivery and begins the process of payment to the surveyor. With standardized surveys, automated assistant/analyzation systems, and trackable processes through blockchain, the client gets a quality product at a market rate in an acceptable timeframe and the surveyor gets paid in a reasonable period.
THEN WE ALL WOKE UP TO REALITY…
Maybe this fictional situation for land surveyors won’t be a reality in my lifetime, but I’m not willing to bet against it. I look back at my short 30+ year career and still marvel at the technological advancements yet I acknowledge we are still turning a corner in computing power (see May’s column). I remember the introduction of laser scanners and lidar sensors as future data-collector saviors, gathering multitudes of precise and accurate data much faster than any mortal. Now we have UAVs that can soar above us with little interference and provide images and data at a reasonable cost, so technology does benefit us.
But what about data that is automated to the point it is beyond the control of the surveyor? And what does this do to our shrinking surveying workforce?
Some may say it is a godsend on both accounts. I personally won’t turn out a product or survey in which I don’t have a good understanding of what the data represents or how it was collected; that violates a code of ethics of practicing beyond my expertise. I also don’t think automation will eliminate our technicians, but the surveying profession will need to provide adequate training for our next generation.
“I’M SORRY, DAVE. I’M AFRAID I CAN’T DO THAT.”
We live in a world in which so many things are automated (Alexa, Siri and “Hey, Google”) to assist us with even the most mundane of tasks. Amazon recently introduced a store where the customer doesn’t stop at a cashier; just grab the items off the shelf and walk out. Apple introduced its latest iPhone that opens by recognizing your face. Automation is here to stay, whether we like it or not.
Image: MGM
An article by the Pew Research Center (“Automation is Everyday Life“) described in detail the amount of anxiety that automation instilled in Americans. Many felt that while there are opportunities to increase productivity and profitability in many sectors, that will be offset by lost jobs replaced by automation. Others were also troubled by automation becoming more prevalent in medical treatment of senior citizens.
For many, the thought of automation isn’t nearly as scary as the concept of “artificial intelligence.” While most of the processes involve machine learning (ML) and refining results based upon increasing datasets, computing power is increasing and introducing new methods including “deep learning.” The algorithms being produced by deep learning through neural networks are making smarter decisions as they use larger and more complicated datasets.
From a June article for The Atlantic, Henry Kissinger (yes, that Henry Kissinger) offered these thoughts on A.I.:
Henry Kissinger (Photo: The Atlantic)
Ultimately, the term artificial intelligence may be a misnomer. To be sure, these machines can solve complex, seemingly abstract problems that had previously yielded only to human cognition. But what they do uniquely is not thinking as heretofore conceived and experienced. Rather, it is unprecedented memorization and computation. Because of its inherent superiority in these fields, AI is likely to win any game assigned to it. But for our purposes as humans, the games are not only about winning; they are about thinking. By treating a mathematical process as if it were a thought process, and either trying to mimic that process ourselves or merely accepting the results, we are in danger of losing the capacity that has been the essence of human cognition. (June 2018)
He also makes a strong statement that the United States needs to develop a national vision for AI like other countries (i.e. China, Russia, India) to stay competitive in computing power.
TRANSLATING ARTIFICIAL INTELLIGENCE INTO SURVEYING
The point of this discussion wasn’t to be “doom and gloom” of technology. I look forward to enjoying many of the advancements of AI and blockchain advancements. Many of the advantages of both technologies have not been brought to the surveying forefront yet, but it will only be a matter of time.
My one big fear to automation attempting to overtake and regulate some functions of surveying leads back to boundary determination and the increasing use of holding technology/mathematics over monumentation, hence Kissinger’s comment regarding human cognition. The rules of construction will always hold true in my boundary analysis until there is a time and place where all parcels (original and retracement) are created in a mathematical vacuum.
I also don’t see a timeframe yet that reduces the amount of measurement error between survey practitioners utilizing differing methods and technologies. Survey equipment manufacturers are still refining ways to get more precision from their GNSS receivers, yet still put them on a pole with a bullseye bubble that needs constant checking. Even tribrachs and total stations aren’t checked as often as recommended, but we always seem willing to argue over who measures better.
Until we get more consistent in our overall measuring as a profession, I’ll hold off on worrying about artificial intelligence taking over.
In the meantime, let’s back off calling a corner monument off by 0.03’ just yet. Let’s hope that when A.I. does become more prevalent, the surveying profession will have its collective heads wrapped around our own intellect as well.
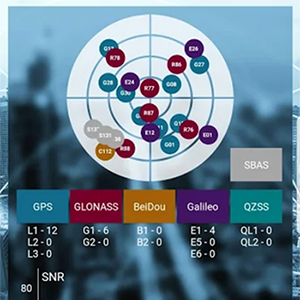
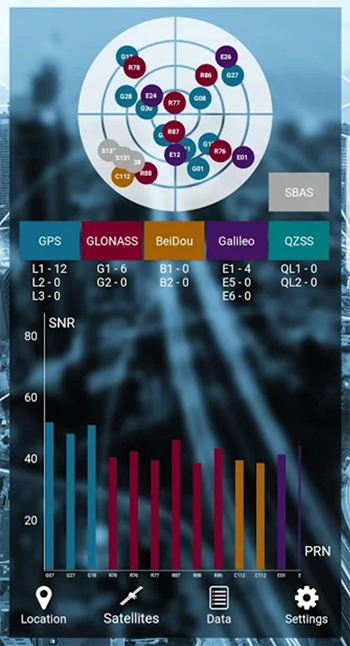
SXblue, also known as Geneq, has introduced its SXblue ToolBox, an Android application for SXblue GNSS receivers.
Using the SXblue ToolBox, receiver users can view and analyze the position data provided by the SXblue receiver and metadata related to its location. The user can send commands that enable or disable some features, including systems in use, mask angle or differential angle, and constellation in use, including GPS, GLONASS, Galileo, BeiDou and SBAS.
The SXblue ToolBox is also an NTRIP client capable of connecting to a NTRIP server for real-time kinematic (RTK) corrections and thus allow the receiver to issue very accurate location information. The application is able to record, save and transfer the raw data from the GNSS receiver, allowing post-processing activities on computers for surveying and geomatics professionals.
The application has been developed with special consideration for modern mobile device development and attention to user and dealer feedback, the company said.
The application includes a series of audible and visual alarms configurable by the user to determine the thresholds of the information provided by the SXblue GNSS receiver.
Main features of the SXblue ToolBox include:
Display of location information and quality of the position data
Skyplot of all-in-view constellations: GPS, GLONASS, Galileo, BeiDou, QZSS, SBAS
Log raw data
NTRIP/DIP client for receiving RTK corrections
Terminal to send commands and view the output data of the SXblue device
Audible and visual alarms
Activation of options and licenses via the application.
Measurement results become quicker and more accurate with the gps 70 T’s permanent tilt compensation, resistance to magnetic interferences and calibration-free usage.
With the iCON gps 70 T, construction professionals can measure and stake out points without having to keep the pole vertical to level the bubble. According to the company, it allows the user to look at the immediate environment — for other people, machines, excavations, motor vehicles and structures — rather than on the bubble.
The combination of the latest GNSS technology and inertial measurement unit (IMU) equips the gps 70 T with its true tilt compensation. The tilt compensation extends the measurement possibilities, improves quality and accuracy of the collected data, and reduces errors.
The iCON gps 70 series is seamlessly integrated into the version 4.0 of the iCON field software. By keeping the core central interface, users will benefit from the simple-to-use workflows that require less training and avoid costly downtime.
A roundup of recent products in the GNSS and inertial positioning industry from the April 2018 issue of GPS World magazine.
OEM
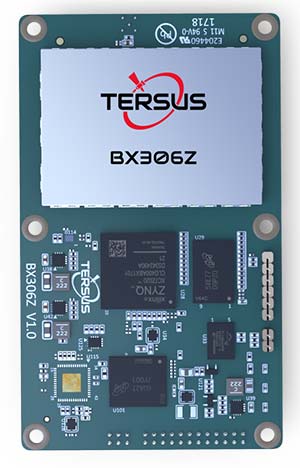
GNSS RTK Board
For OEMs, system integrators
The BX306Z GNSS real-time kinematic (RTK) board has powerful flexibility and compatibility to meet the needs of original equipment manufacturers (OEMs) and system integrators. The BX306Z is a cost-efficient board for positioning and raw measurement output. The board is a compact, multi-GNSS (GPS L1/L2, GLONASS G1/G2, BeiDou B1/B2) RTK module with centimeter-level accurate positioning capability. It is able to integrate with autopilots and inertial navigation units. Log and command is compatible with major GNSS boards.
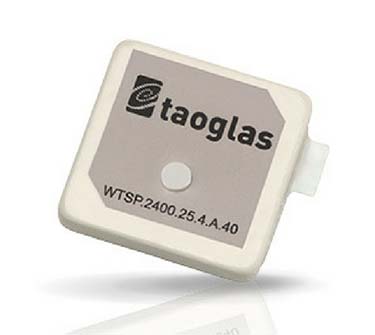
The Taoglas Terrablast antenna line is designed for UAVs and transportation. (Photo: Taoglas)
Rugged antennas
For automotive, drone markets
Terrablast polymer-based patch antennas are 30 percent lighter than their ceramic counterparts and extremely resistant to fracture upon impact. They are designed for the automotive and unmanned aerial vehicle (UAV) markets, where impacts are possible but antenna performance cannot be compromised. The 35-mm GPS/GLONASS/BeiDou patch antenna has high efficiency of more than 70 percent across all bands, improving time to first fix. All Terrablast antennas undergo rigorous temperature, vibration and impact tests, exceed ISO 16750 standards, and are manufactured in Taoglas’ purpose-built facilities in Taiwan and the United States.
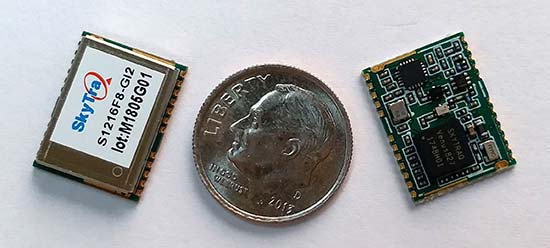
The S1216F8-GI2 is a NavIC + GPS/GAGAN receiver module for emerging intelligent transport systems (ITS) applications requiring NavIC/GPS capability in India. It integrates an L1/L5 RF front-end and baseband processor capable of receiving up to 14 L5 NavIC signals and up to 20 L1 GPS/GAGAN signals simultaneously. With six NavIC signals and three GAGAN signals, it offers 18–23 usable signals, providing improved accuracy in urban canyons. The S1216F8-GI2 is form-factor and pin-out compatible with 12 x 16-millimeter modules, enabling drop-in replacement. NavIC sub-frame data outputs broadcast warning messages for weather alerts and natural disasters. The S1216F8-GI2 is manufactured with ISO/TS 16949 automotive certification.
To meet stringent requirements in harsh environments
The automotive-grade MAX‑M8Q‑01A GNSS module measures 9.7 x 10.1 x 2.5 millimeters and has an operating temperature range from –40° C to 105° C. It is designed to meet the stringent requirements of the automotive market, providing superior positioning accuracy even in challenging environments such as urban canyons. Its temperature range ensures reliable performance in harsh environments, such as when mounted in a car‑roof antenna.
The Teseo APP receiver enables safer autonomous driving. The multi-frequency GNSS receiver chipset is suitable for safety-critical automotive applications and high-accuracy positioning at the decimeter and centimeter levels for precise point positioning (PPP) and RTK applications. By tracking satellites of all GNSS constellations simultaneously on at least two of the frequencies used by each system, ST’s automotive-quality Teseo APP (automotive precise positioning) receiver provides high-quality raw GNSS data for PPP and RTK algorithms, which allows accurate positioning and rapid convergence time worldwide. The receiver monitors the integrity of the satellite data to alert the system if accuracy is degraded for any reason. This permits Tier-1 manufacturers to certify safety-critical systems in accordance with ISO 26262.
Qinertia post-processing kinematic software has been designed to help surveyors get the most of their surveys. After the mission, Qinertia gives access to offline real-time kinematic (RTK) up-to-date corrections from more than 7,000 base stations in 164 countries. By creating a virtual base station near a project, the software delivers the highest level of accuracy without having to set up a base station. An advanced tight coupling algorithm delivers high accuracy and maximizes RTK availability. Trajectory and orientation are greatly improved by processing inertial data and raw GNSS observables in forward and backward directions, especially in challenging environments. With Qinertia, surveyors can quickly identify and solve issues such as mechanical installations or sensor alignment.
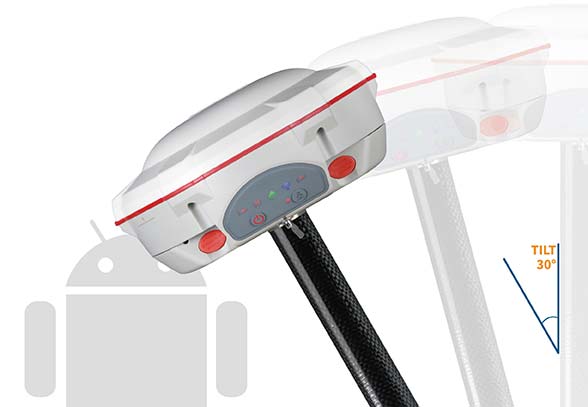
The T300 Plus GNSS receiver is designed for demanding surveying tasks, with full-constellation tracking capability, tilt compensation, 4G/Wi-Fi connection, 8-GB internal memory and an easy survey workflow with Android-based Survey Master Software. It is designed to make collecting accurate data easy and fast, whether done by a beginner or experienced professional surveyor. As an upgrade of the T300, SinoGNSS T300 Plus combines a GNSS board, Bluetooth and adjustable TX&RX UHF, Wi-Fi and 4G modem into one rugged device. Its built-in 4G modem ensures the T300 Plus works with all kinds of continuously operating reference stations (CORS) worldwide. A built-in tilt sensor supports maximum 30° pole tilt and keeps the compensation accuracy within 3 centimeters; the user can check the electronic bubble on the controller for fast surveys in the field.
Atlas-capable GNSS receiver for precision 3D applications
The Vector V1000 GNSS receiver is designed for precision marine applications, such as hydrographic and bathymetric surveys, dredging, oil platform positioning, buoys and other applications that demand the highest level 3D positioning accuracies. It provides high-accuracy heading, position, pitch, roll and heave data. The V1000 supports multi-frequency GPS, GLONASS, BeiDou, Galileo, QZSS and IRNSS (with future firmware upgrade and activation) for simultaneous satellite tracking. The receiver is powered by Hemisphere’s Athena real-time kinematic (RTK) engine and is Atlas L-band capable. Based on Hemisphere’s Eclipse Vector technology, the V1000 uses the most accurate differential corrections including RTK and Atlas L-band. It has an integrated display that can be conveniently installed near the operator. The V1000 has heading accuracy of better than 0.01 degree when using a 10-meter antenna separation.
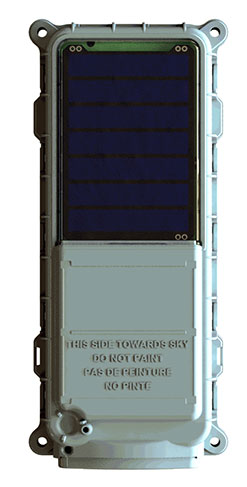
Machine-to-machine (M2M) and internet of things (IoT) device
The SmartOne Solar M2M/IoT device is solar-powered and offers Bluetooth Low Energy connectivity while addressing the growing global demand for reliable and affordable remote monitoring and automated data collection of assets located both within and beyond terrestrial networks. The SmartOne expands the market for remote connectivity to include assets that are otherwise difficult or expensive to reach for power replacement, and lowers the operating cost of monitoring assets being served by legacy SmartOne products. SmartOne Solar’s rechargeable batteries can deliver more than eight years of serviceable life. Without exposure to the sun, a fully charged unit can operate for many months while reporting twice daily. The product’s Bluetooth connectivity allows wireless device configuration and firmware upgrades in the field.
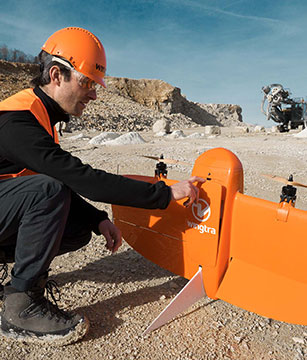
Designed for large-scale surveying and mapping projects
The WingtraOne post-processed kinematic (PPK) drone is the result of collaboration with Pix4D and Septentrio. It is able to deliver orthomosaic maps and 3D models with an absolute accuracy down to 1 centimeter (cm), offering broad coverage and high resolution with ultra-precise accuracy. The WingtraOne can cover 130 hectares (320 acres), equivalent to 240 football fields, in a one-hour flight, and deliver maps at ground sample distances below 1 cm/pixel. Vertical take-off and landing (VTOL) offers hands-free operation and a smoother ride for onboard sensors as well as greater coverage than comparable multi-rotor UAVs. PPK computes ultra-precise geolocations for each image by combining the GNSS data with correction data from a nearby reference receiver. It offers a root-mean-square (RMS) error of 1.3-cm horizontally and 2.3-cm vertically without any ground control points.
DroneHunter is a fully autonomous UAS airspace defense solution. The intelligent robotic aircraft is enabled with TrueView radar designed and engineered for physical remediation of intruder or threatening drones. DroneHunter is an autonomous UAS perimeter detection and protection solution designed to quickly detect, classify and secure against drones and other UAS. When an intruder drone is discovered, DroneHunter can engage autonomously via artificial intelligence (AI)-directed detection, tracking and guidance. Once the rogue drone is identified and the threat level analyzed, DroneHunter safely remediates the threat day or night, at a safe stand-off distance, with no collateral damage. DroneHunter supports multiple drone platforms based on use-case requirements.
By Simon Batzdorfer, Markus Bobbe, Martin Becker and Ulf Bestmann, Technische Universitaet Braunschweig
All images courtesy of the authors.
Autonomous vehicles equipped with different environmental sensors, such as optical or thermal camera or a lidar, performed a team survey controlled by a central ground station. The ground station serves as a user interface to define missions and tasks and also to visualize exploration task results online. 2D stitched orthophoto or lidar point clouds are transmitted for display and processing into 3D photogrammetry. Georeferencing data is gathered by an integrated GNSS/IMU positioning system.
In disaster scenarios such as fires, floods or search-and-rescue tasks, good situational awareness is indispensable for responders coping with a complex and often chaotic environment. In most cases, a prior known map data are outdated, and an efficient situational proceeding such as path planning or creation of a search pattern cannot be performed. This information can often only be gathered by manned exploration using ground or airborne systems, with limits on availability.
The research project Automated Navigation and Communication for Exploration (ANKommEn) seeks to create an automated unmanned system to close this gap by providing up-to-date scenario information while increasing the safety of human resources, using unmanned aerial (UAV) and ground-based (UGV) vehicles.
To provide up-to-date information of the desired destination area, all vehicles are equipped with identical positioning and communication hardware complemented by diverse sensors (RGB camera, infrared [IR] camera, lidar) for visual exploration. The visual sensor information is transmitted to a central ground station for visualization and/or analysis. To increase the advantages of the system, the unmanned systems should have a high grade of automation to reduce the workload of the operator so that only basic inputs have to be done by the operator. For example, just by marking a destination area and choosing a predefined task, the mission will be planned automatically, and after the corresponding waypoint-list has been transmitted to the vehicles, the mission will start.
Automated procedures of a UAV in particular require valid position information related to accuracy, availability and continuity. In exploration areas where the UAV operates in low altitude or using a UGV, the reception of the GNSS signal can be degraded by the topology (buildings and such). Using more than one GNSS can increase the availability of position information. Vehicle control, georeferencing environmental sensor data and exploration results all require high-frequency absolute position and attitude and heading information. This data is gathered by fusing GNSS and inertial measurment unit (IMU) data.
OVERALL SYSTEM DESIGN
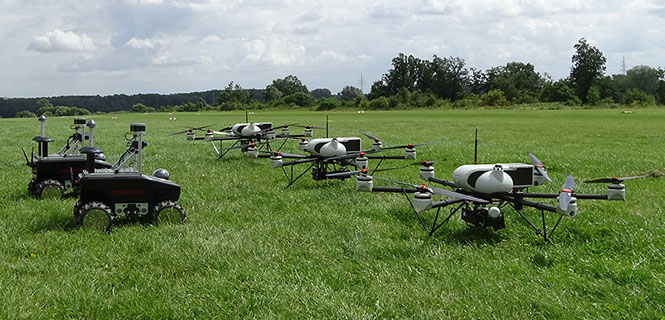
The overall system consists of three UAVs, two UGVs (Opening photo) and a central ground control station. The latter serves as a central human-machine interface to monitor and manage cooperative operation of the UAVs/UGVs by an operator. Based on a priori known map data, exploration areas and tasks are defined and assigned to the UAVs/UGVs and will be updated with actual information of the visual sensors while performing a mission.
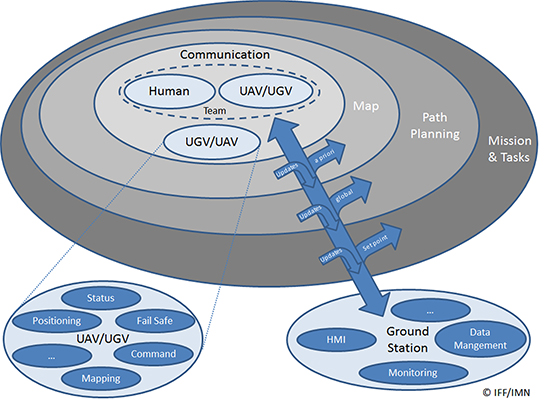
Figure 1 shows the interaction and information exchange between the different vehicles and sensors.
Figure 1. Diagram of interaction and information exchange.
All UAVs/UGVs are equipped with a navigation and communication unit (NAV/COM) and an environmental sensor payload (ENV) unit, including an RGB camera, thermal camera or a lidar respectively.
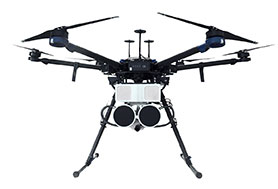
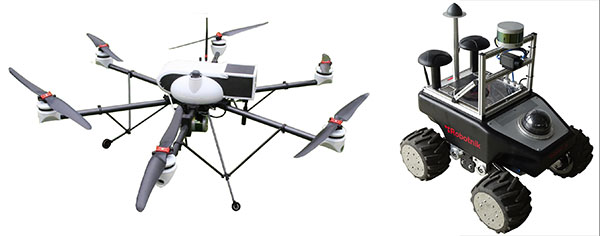
UAV/UGV and Sensor Hardware. The UAVs carry a payload of 2.7 kg (NAV/COM unit, mounted in the upper compartment, and ENV unit mounted under the UAV) and a flight time of up to 30 minutes (Figure 2, left). The payload sensors are carried and stabilized by a two-axis-gimbal. The environmental sensor payload unit is based on three different types of sensors, which are interchangeable between the different UAVs: RGB camera, lidar and IR camera.
For ground-based exploration, two four-wheel-drive UGVs carry a pan-tilt-zoom (PTZ) camera at the top of front chassis (Figure 2, right), and are equipped with a lidar and a thermal camera, or a stereo RGB camera, respectively.
Figure 2. UAV carrying a lidar (left) and UGV carrying lidar and IR camera (right).
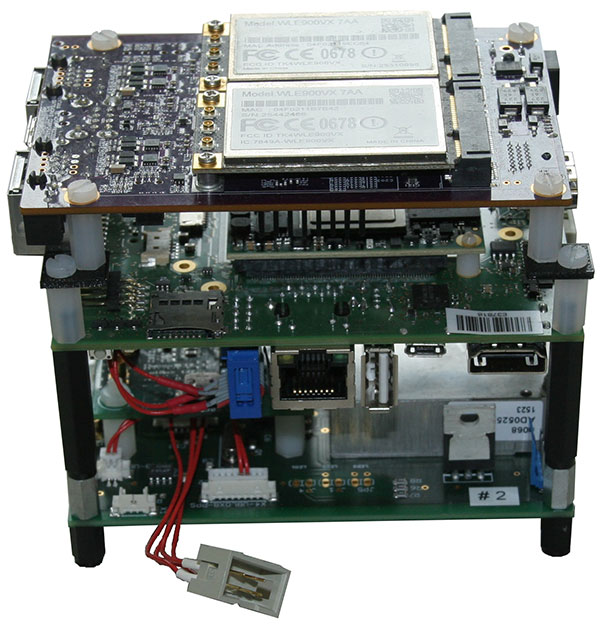
The navigation and communication unit mounted as a stack includes a network processor board for communication and data exchange between the UAV/UGV and the central ground and control station. An embedded processing board provides position calculation and GNSS-NTP-based time server. Data for the position calculation is provided by a custom-designed break-out-board (Figure 3).
Figure 3. Navigation and communication unit.
Data traced by these sensors cannot be sent directly to the ground station because of the huge data amount and the limited bandwidth of the communication link. Therefore, data from the sensors are preprocessed or compressed on a small form-factor personal computer and then transmitted to the ground station.
Ground Station. The ground station is the central device for command, control and visualization of the total system. It provides several options to display the data from the sensors and vehicles and a combination of them, and also provides automated path planning and calculation of the 3D reconstruction (photogrammetry) and online 2D stitched orthophoto.
Software Frameworks. The basic software for determining the vehicle’s state in 3D position, velocity, attitude and heading is established within a modular navigation software framework, with the option to process data of different sensors in real time as well as post-processing for data evaluation and development purposes. Several algorithms for sensor data fusion are implemented. The algorithm for IMU/GNSS fusion is based on an extended Kalman filter and also provides an IMU data-based state vector, stabilized by GNSS information, for the visual sensors. This state vector is published by using the robot operating system (ROS), a framework for inter-process communication based on a TCP or UDP publisher/subscriber concept. The visual sensors and embedded PCs subscribe to different ROS messages, for example, the state-vector-message or information of other sensors.
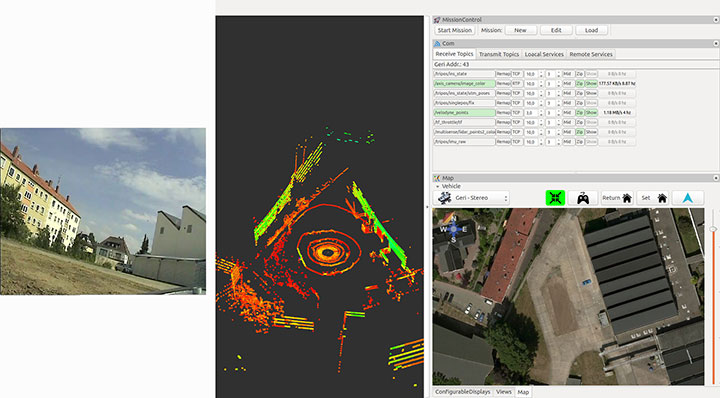
Figure 4 shows examples of the actual camera view from the UGV, and point cloulds and map generated by the UAV. The software layout can be customized by the user.
Figure 4. From left to right: the actual view by the PTZ camera onboard the UGV, the point cloud gathered by the UAV’s lidar, and the mission parameters and map of an aerial view.
POSITIONING OF UAV AND UGV
Automated operation of UGVs and UAVs requires valid position as well as attitude and heading information. In the case of using only one GNSS, signal quality and availability can be degraded by the environment (buildings) and can result in less precise or even a lack of position information.
GNSS Multi-Constellation. To overcome the risk of poor availability of GNSS-based position information, parallel usage of different GNSS can raise the number of received satellite signals: GPS, GLONASS, the evolving Galileo and BeiDou. When using a multi-constellation approach for positioning, one has to take care of several differing aspects between the GNSS. Each system uses a different geodetic reference frame and time basis. Measurements gathered from another GNSS system must be transformed into the reference frame of the desired system. The geometric distribution of the satellites is improved by using more than one GNSS constellation, indicated by a lower dilution-of-precision value.
The navigation software framework is designed for real-time computation and also for post-processing. In post-processing, the recorded sensor data is streamed to the software framework with the option of changing several parameters and settings for calculation. One option is to exclude satellites at low elevation from position calculation by changing the cut-off elevation for these satellites. This parameter will be changed to simulate environmental conditions that block receiving GNSS signals, like buildings within urban scenarios, to compare the availability of received GNSS signals for single- and multi-constellation-based position calculation.
Recorded data of a real-world test serves as the database for the post-processing with different cut-off elevation parameters. At the beginning of the field test, there was a short initialization period to boot the OS and to start basic processes for positioning. After that, a predefined mission was flown and the GNSS measurements have been saved for the described post-processing.
Post-processing has been performed with different cut-off elevation parameters of 5° up to 35°. In the case of 35°, the number of GPS satellites is reduced to the minimum for position calculation of four, in contrast to 5–7 available satellites for a multi-constellation based solution.
GNSS/IMU Fusion. Using the GNSS multi-constellation approach can increase availability of position information. For attitude and heading determination, an IMU is nevertheless indispensable. Additionally, the frequency of the pure GNSS-based positioning information is usually between 1 Hz to 5 Hz within the described hardware setup. Meaningful georeferencing of the environmental sensors requires much higher frequency position and attitude information.
The IMU provides high-frequency 3D measurements of accelerations and angular rates. Using common strapdown algorithm processing, high-frequency position, velocity, attitude and heading information is provided in real time. Due to the short time stability of pure inertial navigation, the GNSS positioning results are used for aiding purposes within the Kalman filter’s update step. To overcome the absence of GNSS aiding information even when using multi-constellations, there are mainly two options. First, a short coasting period is possible after the data fusion has reached a steady state.
Second, due to the highly modularly design of the navigation software framework, it is possible to use position or attitude increments from environmental sensor data processing for aiding the IMU.
The vehicle’s state vector is then distributed with high frequency within the system for georeferencing measurements of the environmental sensors, especially the RGB camera and the lidar for photogrammetry and simultaneous location and mapping (SLAM) applications.
PHOTOGRAMMETRY AND SLAM
In major fire scenarios, maps can be out of date. Therefore, techniques have been developed to gather a 2D overview based on several single RGB pictures taken and processed on board a UAV and transmitted to the ground station via data links. Additional processing of a 3D reconstruction of the scenario is an integrated feature within the ground station. Both approaches were implemented to get an automated rapid aerial mapping solution.
In the case of the 2D overview, SLAM algorithms, often used in robotic research, are adapted for this specific use case. These algorithms provide good results for a rapid aerial mapping solution to get an overview of the scenario, because the map is updated incrementally with every new image, but they are less precise, which can be compensated for by using the photogrammetric 3D reconstruction. The live mapping (SLAM) approach is based on the ORB-SLAM algorithm, and the photogrammetry-based approach uses commercially available photogrammetry software.
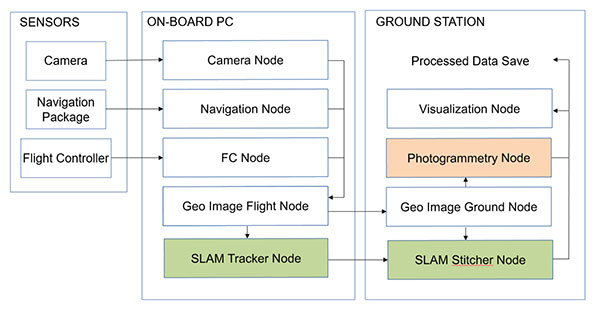
The systems, on the UAV for 2D and for 3D on the ground station, use the ROS framework for processing the visual sensor data and the described techniques for positioning, georeferencing and attitude determination. For data exchange between these frameworks, several software interfaces have been implemented. Figure 5 displays a flowchart of the implemented workflow.
The sensor/input data is received by corresponding nodes on the aerial vehicle. After adding the camera pose information to the image in the geo-image flight node, the image is sent to the geo-image ground node on the ground station. The SLAM process is separated into two parts. The SLAM tracker node calculates the transformation between images, and the SLAM stitcher node applies the transformations. The transformed images are displayed by the visualization node. The photogrammetry node receives the georeferenced images, stores the data, and initiates the photogrammetric processing once the survey is finished. The results can also be displayed by the visualization node and exported in a desired format.
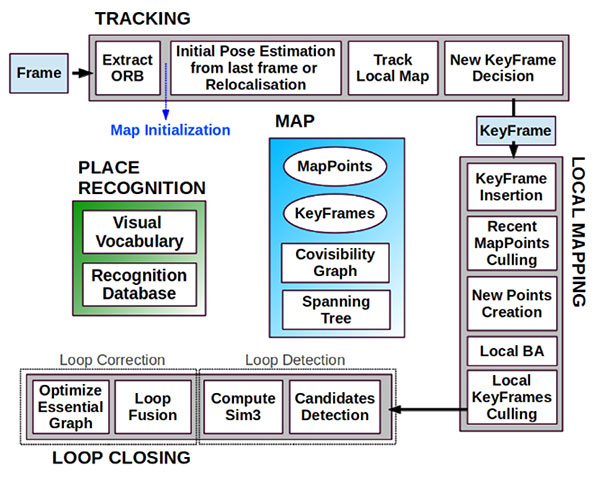
Visual SLAM. Computer vision-based algorithms have developed rapidly over the last few years. One method estimates a pose by using monocular image processing, known as parallel tracking and mapping (PTAM). This integrates a bundle adjustment and separates the tracking and the mapping procedure into different threads, leading to a real-time capable framework. These basic PTAM principles have been integrated into a robust loop-closing and another method of relocalization, known as Oriented FAST and Rotated BRIEF (ORB SLAM), shown in Figure 6. Here, tracking, local mapping and loop closing are separated into different threads (gray boxes), with the main map and place recognition in the middle.
Figure 6. ORB SLAM system overview [Mur-Artal, 2015].The tracking thread predicts the current pose from the last known position and movement by using a constant velocity model and performs a guided search of map points. If these points are found near the estimated position, the velocity model is valid and the tracking procedure continues. Otherwise, the tracking is lost and a relocalization in the global map starts by using a subset of features, which are increased after detection of corresponding features in other keyframes to optimize the camera pose and, finally, the tracking procedure continues. The last step of this procedure is to decide whether the current frame contains enough information to be inserted as a new keyframe for further calculations.
To mark a frame as a new keyframe, the frame must fulfill all of the following conditions:
More than minimum number of frames has passed.
Local mapping is on idle or condition 1 fulfilled.
A minimum number of 50 points is observed.
A maximum of 90% of the features is already observed by the other frames.
When a new keyframe is passed to the local mapping procedure and inserted as a node into a co-visibility graph structure, new correspondences are searched in the connected keyframes to triangulate new points. Based on the information accumulated during the tracking, a point culling keeps only high-quality points in the map as well as a culling of redundant keyframes.
Then a loop closing is performed. This is one of the main improvements compared to PTAM. If a loop is detected, the drift accumulated in the loop is computed, and both sides of the loop are aligned and visible points are fused. In a final step, a pose graph optimization is done to achieve global consistency.
This information of the 3D camera pose is used to generate a 2D orthophoto in real time while the vehicle is flying. To create a 2D orthophoto, a common reference frame is approximated, which is orthogonal to all camera measurements. The projection is performed by using a projection model based on a pinhole camera.
After the compensation and distortion, the whole image can be stitched to the current global map.
Photogrammetry. This approach uses off-the-shelf photogrammetric processing software. The processing is triggered automatically when the survey is completed and all images are transferred to the ground station via data link. For georeferencing of the images, the camera location and the inner camera geometry were written to the EXIF file of each image by the geo-image ground node (Figure 5). To ensure an acceptable compromise between orthophoto quality and the required processing time, an analysis regarding the impact of the most relevant processing parameters has been performed.
Figure 5. ROS node layout with SLAM (green) and photogrammetry workflow (red).
The photogrammetry process consists of four steps:
camera alignment (optimizing the homographic equation)
mesh creation by generated tie points
orthophoto creation (dense cloud or digital elevation model)
export.
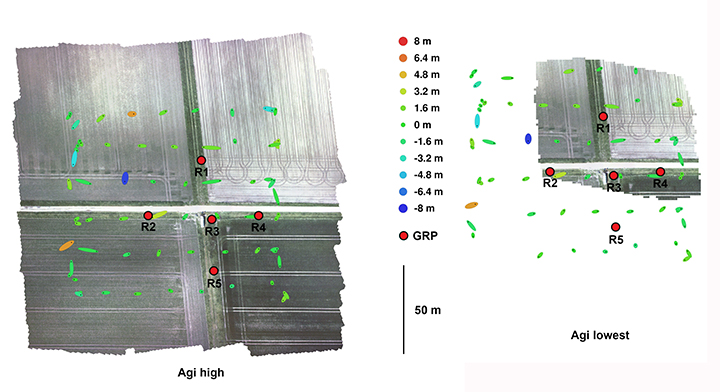
Analyses and Evaluation. To evaluate the correct workflow of both approaches of 2D live-stitching and the 3D photogrammetry, a real-world flight test above agricultural cropland has been performed. The results of both approaches are shown in Figure 7 and Figure 8. Generally, agricultural cropland and its mean textured surface pose a challenge for mapping processes because of the limited number of trackable features.
Figure 7. Orthophotos created with the profiles high and lowest (including ground reference points).Figure 8. Orthophotos created with 2D live stitching approach of cropland.
Four predefined profiles were used to cover the requirement of compromise between processing duration and quality of the generated orthophoto. Each profile level generates a corresponding level of alignment accuracy and mesh face count: lowest, low, medium and high.
To estimate the accuracy of the created maps by the different profiles, five ground reference points (GRPs) were distributed over the mission area. The location of the GRPs was determined using a RTK-GNSS system leading to a horizontal RMSE below 2 cm. To enable robust processing for this scenario, the overlap and the sidelap was chosen to be 70%. A ground-sampling distance (GSD) of 2 cm was needed to identify the GRPs. This resulted in a mission consisting of six times 100-meter (m) lines with a distance of 25 m in an altitude of 60 m over ground. During the flight time of 4.5 minutes, 271 images were taken.
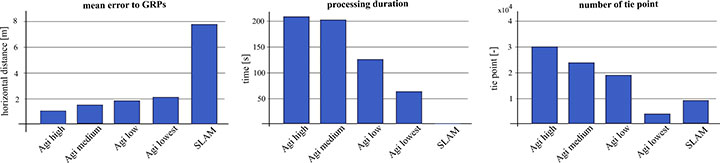
To compare the profiles, they were triggered one after another with the same set of images. The created results are shown in Figure 7. All profiles resulted in consistent solutions and were successfully georeferenced. The map based on the lowest profile could not recreate the complete area (Figure 7, right). The remaining profiles led to similar results without notable differences to visual inspection. The processing time varied between 1.2 and 3.6 minutes. A comparison of this and other criteria is given in Figure 9.
Figure 9. Evaluation and comparison of defined software profiles and visual SLAM.
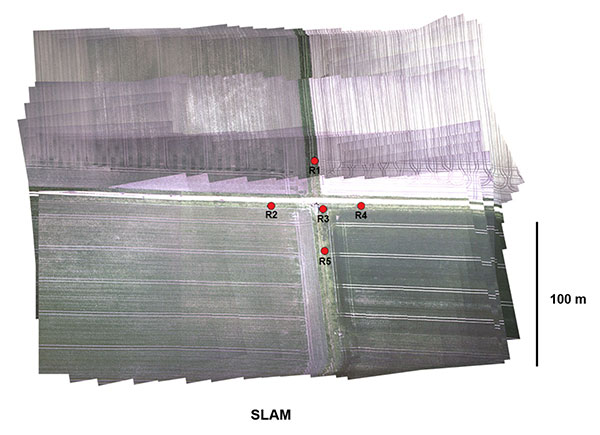
The created final image of the SLAM pipeline is shown in Figure 8. The image was updated with every new image and was therefore finished before the UAV landed. The mean location error measured using the reference points was about 8 m, significantly larger than the errors observed in the photogrammetry results. In Figure 9 the results are contrasted to the results of the photogrammetry approach.
While the mean error in the low profile is half as high as in the lowest profile, the calculated errors using the medium and high profiles are not enhanced significantly. The number of tie points created by the lowest profile is an order a magnitude lower compared to the other three profiles.
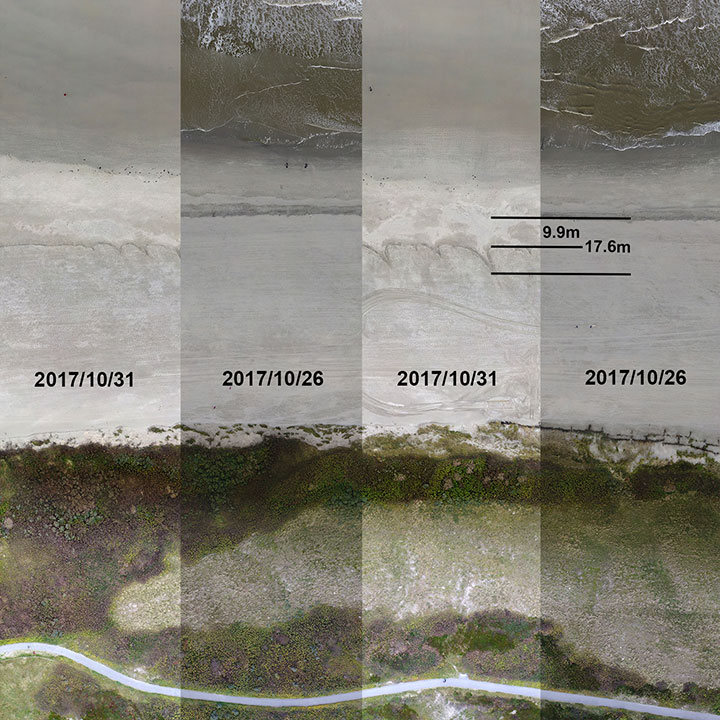
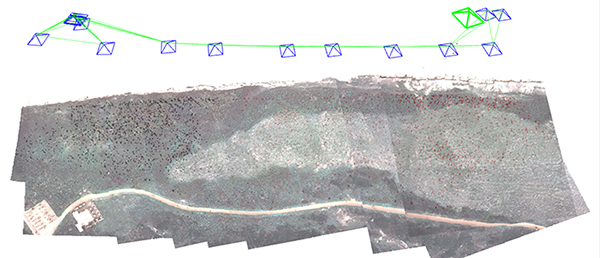
We conducted flight tests on Langeoog island in the North Sea, to gather information on efforts to protect the island’s coastline from water erosion. For this reason, sand was selectively washed up to the coastline by dredgers at the beginning of October 2017. Between Oct. 26 and 31, due to severe weather with a storm flood, a huge erosion of the washed up sand occurred, and the result is shown in Figure 10. The level of erosion was determined by comparison of the orthophoto of the same area. The dislocation averaged out to 9.9 m with some peaks up to 17.6 m.
Figure 10. Evaluation of erosion.
The 3D photogrammetry provides a more detailed image compared to the image of the 2D-live-stitching approach (Figure 11), but both approaches can provide the desired information of the area.
Figure 11. Result of the SLAM approach with camera poses and tracked features.
Both implemented approaches were successfully integrated to get the desired fully automated rapid aerial mapping solution. This also includes the basic tasks of the automated mission planning, camera control, image transport to ground station, automated processing and the visualization of the results.
CONCLUSION
The benefits of multi-constellation GNSS positioning have been demonstrated with a focus on UAVs and UGVs operating in catastrophic scenarios, especially where GNSS signal reception might be blocked. This position information is also used for georeferencing of images and visual reconstruction of the area. The overall system has demonstrated the capability of an automated orthophoto generation. Both implemented mapping methods — a 2D live stitching and a 3D photogrammetry — provided results that fulfill the requirements to get an instantaneous 2D overview and a contemporary 3D reconstruction of the area.
ACKNOWLEDGMENTS
This work was done within the joint research project ANKommEn, funded by the German Federal Ministry of Economic Affairs and Energy, administered by the Space Administration of the DLR (funding code: 50NA1518). Project partners are the Institute of Flight Guidance (IFF), the Institute of Mobile Machines and Commercial Vehicles (IMN) — both part of Technische Universität Braunschweig — and AirRobot GmbH & Co. KG, a German manufacturer of multirotor UAVs. The professional fire brigade of Braunschweig and the Lower Saxony Water Management, Coastal Defense and Nature Conservation Agency also participate as associated project partners.
SIMON BATZDORFER holds a Dipl.-Ing. in mechanical engineering and is a research engineer at the Technische Universitaet Braunschweig, Institute of Flight Guidance (IFF).
MARKUS BOBBE holds a M.Sc. in aerospace engineering and is a research engineer at the Braunschweig IFF.
MARTIN BECKER holds a Dipl.-Ing. in aerospace engineering and is a research engineer at the Braunschweig IFF.
ULF BESTMANN received his Dr.-Ing. in mechanical engineering from TU Braunschweig. He is head of the navigation department of the IFF. He co-founded the company messWERK GmbH, a service provider in flight testing and certification.
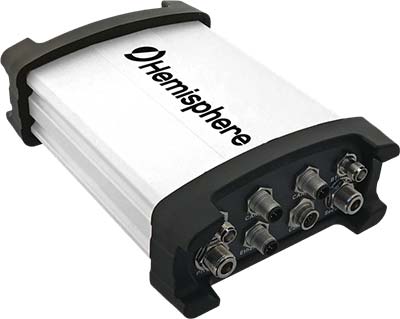
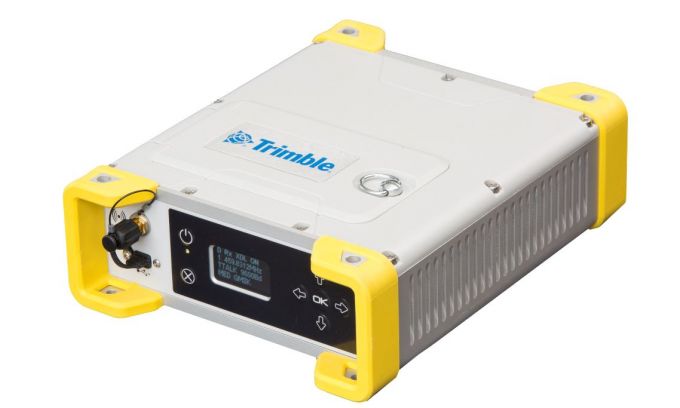
The MPS865 GNSS receiver is designed for marine positioning.
Trimble has debuted the MPS865 marine positioning system multi-frequency and multi-application GNSS receiver.
The Trimble MPS865 is a versatile, rugged and reliable GNSS positioning and heading solution for a wide variety of real-time and post-processing applications for marine survey and construction.
It features integrated communications options such as Wi-Fi, UHF radio, cellular modem for internet connectivity, Bluetooth and MSS satellite-based correction channels.
The patented GNSS-centric technology uses all available GNSS signals to deliver reliable positions in real time. The GNSS receiver provides for the connection of two GNSS antennas for precise heading.
With a modular form factor, the MPS865 is flexible and can be used as an integrated on-board rover receiver, a base station or a continuously operating reference station. According to Trimble, the built-in precise heading feature ensures the receiver is of minimal size, consumes less power and has less cabling, which are all benefits when on-board space it at a premium.
The MPS865 adds new features to improve usability in a congested marine construction site – multi constellations, cellular connectivity and beacon support. The multi-constellation option maintains productivity in marine sites or when antennas or satellites are partly obstructed.
At many sites, the receiver can use the free-to-air beacon support. When coupled with GA830 antennas, the MPS865 will receive the free-to-air beacon signals to deliver sub-meter accurate horizontal positioning in many parts of the world. It always delivers precise heading even when no GNSS corrections are received.
The marine receiver also has cellular, making it easier to use Internet Base Station Service (IBSS) and VRS corrections over the internet as well as communicate with the receiver via the internet and SMS messages. The receiver also can be used as a data access point on the vessel to download design files or for immediate remote support.
The MPS865’s design enables a broad range of mounting capabilities and built-in communication options. Features include an internal removable battery, internal memory and optional accessory kits for specific applications.
The receiver is also compatible with a variety of software solutions including the new Trimble Marine Construction software.
The weatherproof, high-impact-resistant moulded aluminium housing protects it in extreme marine conditions or base-station applications.
“With the addition of the MPS865 receiver to our portfolio, Trimble has introduced a new generation of rugged, compact and feature-rich GNSS, a solution the marine industry has been needing for some time,” said Scott Crozier, general manager of Trimble’s Civil Engineering & Construction Division. “This highly flexible and capable receiver can be combined with our marine construction software providing contractors with a market-leading solution for any marine survey or construction application.”
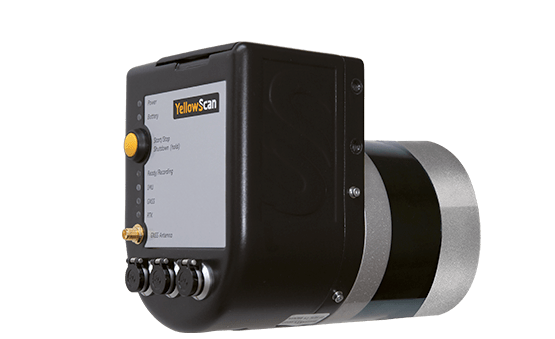
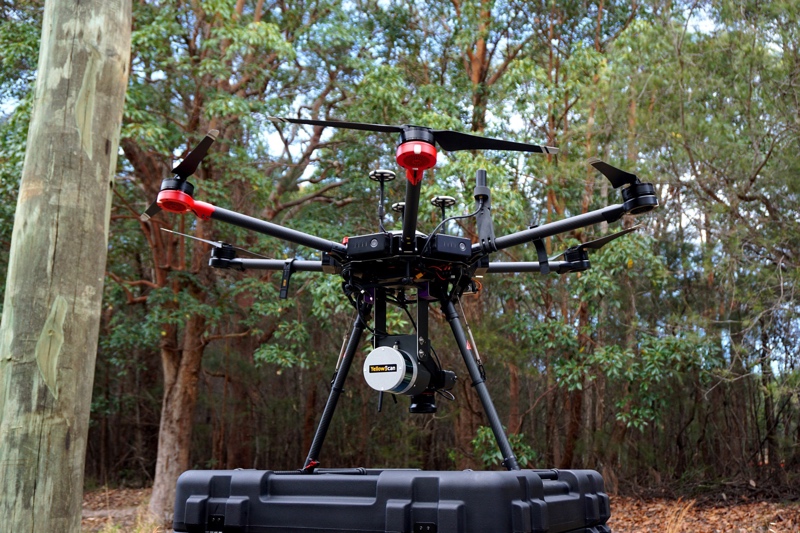
YellowScan has launched a new lidar system, the Surveyor Ultra. It integrates the Velodyne VLP-32C scanner and the Applanix APX-15 GNSS/inertial measurement unit (IMU).
With high density (600,000 shots per second), the system is suitable for high-speed UAVs and long-range needs (maximum range: 100 meters). Its light weight (1.7 kg) makes it easy to mount on any drone, including vertical takeoff and landing (VTOL) UAVs.
As for all YellowScan lidar systems, the Surveyor Ultra is a turn-key system fitted for under vegetation 3D modeling and fast data processing, the company said.
Applications such as forestry, archeology and environmental research will benefit from Surveyor Ultra, as they require long-endurance flights high above trees or over rocky mountains and rugged terrain.
“The Surveyor Ultra shows great potential to safely and efficiently operate lidar on lightweight fixed-wing UAVs,” said Tristan Allouis, YellowScan CTO. “The Surveyor Ultra completes our product line, including the successful Surveyor Lidar System (integration of the VLP-16 scanner from Velodyne).”