The non-profit 211 LA County and Slingshot Aerospace have unveiled an online mapping tool that allows users to quickly identify and locate more than 2,000 food resources within the county during and after the COVID-19 pandemic.
211 LA County is a non-profit organization providing the official information and referral source for health and human services in LA County. Slingshot Aerospace is a situational intelligence platform company,
The customized tool, called 211 LA FoodFinder, is powered by Slingshot Earth and is the biggest and only food map that allows LA residents to search for resources by location and view services specific to seniors, children and others, enabling individuals to find aid near them faster. Resources within the FoodFinder are free, with the exception of those with suggested donations or delivery service fees.
LA County residents will be able to identify different types of available food resources, such as child nutrition, meal services, groceries/food pantries, senior food needs and government food benefits programs.
The platform also provides location details, hours of operation and contact information for each of the services. 211 LA County is currently experiencing a tenfold increase in website traffic related to food resources compared to pre-COVID timeframes.
The organization anticipates the robust application to service nearly 30,000 LA County constituents over the next quarter, many of which may not have prior experience with food assistance.
“Food resources are the biggest need people are contacting us about since the COVID-19 pandemic hit LA County,” said Maribel Marin, executive director, 211 LA County. “With so many people out of work, the need for food is going to get progressively more intense, but people shouldn’t worry because there are lots of resources and ways to access them. Our custom Slingshot Earth food locator provides our community with a one-stop-shop for food resource information, helping to provide peace of mind to those who need food assistance during this unprecedented time.”
211 LA County’s customized Slingshot Earth mapping tool aggregates food resources and service data from multiple public and private sources so that individuals have the right information, at the right time, all in one place. The data is verified and updated regularly to ensure that Los Angeles County residents have the most up to date information as guidelines and offerings continue to evolve.
“This work to help 211 LA County provide critical food service information in our community is so meaningful to us because we are driven by a vision to create a safer, more sustainable world,” said Mel Stricklan, Co-Founder and Chief Strategy Officer, Slingshot Aerospace. “Our business was founded on the idea that information is power, especially in complex situations. The COVID-19 pandemic is uncharted territory for all of us, and we are happy to do our small part in navigating these tough times by providing essential information to those who need it most.”
SPH Engineering has launched a product designed to conduct bathymetric surveys of inland and coastal water.
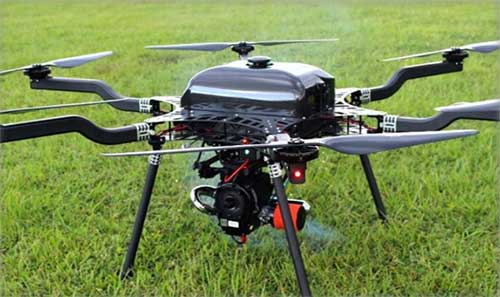
The system — an unmanned aerial vehicle (UAV) integrated with an echo sounder — is time- and cost-efficient, the company said. It is suitable for mapping, measuring and inspecting tasks as well as environmental monitoring.
The system allows field workers to collect data with high accuracy quickly. It is easily transported, quickly deployed and twice as cost-efficient as traditional methods.
The UAV/echo sounder system can be operated in hard to reach locations, and unsafe or hazardous environments. Locations not reachable by foot or that are dangerous for a human (steep coasts, mining pits, contaminated waters, terrain obstacles, etc.) as well as waters of ponds, lakes, and canals can be reached by the drone.
“Since autumn 2018 we have been getting bathymetry-related requests,” said Lexey Dobrovolskiy, CTO of SPH Engineering. “Analyzing about 150 inquiries, we have come to the conclusion that a drone-based solution could open a new business opportunity for drone service companies to do bathymetry surveys of coastal and inland water, especially those for industrial needs.
“Compared with a standard approach using a boat or an unmanned surface vehicle, a drone could save a lot for its user,” Dobrovolskiy said. “An echo sounder itself could be integrated into a client’s drone with no need to purchase additional equipment. Moreover, it is small and easy to transport and operate. At the same time, such research method guarantees data accuracy and employee safety.”
The new digital clinometer and attitude attribute type available in Touch GIS. (Image: Touch GIS)
Touch GIS has introduced a digital clinometer tool to assist field geologists in recording strike and dip readings.
Version 1.3 of the app also features a new “attitude” attribute type, which makes it easy to record and display these readings on the map.
“We’ve been testing these new features with a number of field geologists, and we’re excited to finally be launching it broadly,” said Joe Wilson, head of products at Touch GIS. “While Touch GIS is valuable for a wide variety of field data collection, we’ve found that it’s especially popular with geologists.”
As more and more field work is being done on mobile devices, it’s important to integrate them onto a single platform for collecting and sharing field data. Touch GIS has a mission to provide the most robust data collection featureset for mobile field mapping.
Touch GIS also features powerful file support for industry-standard types, offline mapping capabilities, and accurate drawing tools for points, lines and polygons.
Touch GIS has a free tier that allows users to explore a majority of its features. Premium subscribers can cache maps for offline use and export collected data.
GeoComm’s GIS Data Hub is being used by more than 1,500 jurisdictions across the country as a part of their public safety GIS data management processes. The GeoComm Data Hub allows users to measure progress toward development and maintaining public safety grade GIS.
According to the company, the system quickly validates GIS data and related data against industry standards, as well as provides GIS data insights through quality control and reporting processes. The system allows GIS data organizers to work in their native data schemas and, upon submission, transform disparate GIS datasets into a common schema.
In addition, it aggregates multiple GIS datasets into a seamless coverage area, prepares map packages for provisioning to 911 applications, and leverages and extends the current Esri GIS data environment.
“GIS Data Hub is an integral part of our monthly processes,” said Vanessa Feagins, GIS supervisor, Denco Area 911 District. “It creates a central location for cities (with GIS departments) in our district to submit their GIS data which is then returned to our office as a single dataset. GIS Data Hub helps our office and our partner agencies identify possible errors in our datasets, which helps our district prepare for next generation 911 deployment. This would have been a difficult task without GIS Data Hub.”
Founded in 1995, GeoComm provides county governments with turnkey emergency 911 development services.
Open space: the final frontier. These are the voyages of the professional surveyor and their crew. Their mission: to explore and survey strange new lands. To retrace old boundaries and to create new parcels and subdivisions. To boldly go where no one has gone before (unless it has been previously surveyed and platted…)!
With a nod to Star Trek fans (and apologies to Mr. Roddenberry), the surveyor has been the terrestrial version of the Captain Kirk and Science Officer Spock, exploring existing and uncharted territories. While most surveys completed in the modern day are retracements of previous parcels, there are still areas where surveyors are completing various tasks where no one has been before.
There are very few instances where a survey is performed near others. By this simple fact, one can argue that the surveyor is the original social distancer. The real question, however, lies within the determination of the value of the surveyor and if the work we perform is an “essential service.”
This article is not attempting to debate the value of the surveyor versus all the first responders, doctors, nurses, healthcare personnel and the hardworking employees doing their best to keep up with our basic needs. We are here to discuss the challenges faced by the surveyor and how technology has provided much-needed tools for crossing this abyss of doom and despair called COVID-19.
But first, let us talk about how we arrived at this extraordinary time for nearly everyone on the planet.
Photo: LeoPatrizi/E+/Getty Images
Worldwide upheaval or some close facsimile thereof
Every generation has a historical event, moment or era for which they remember exactly what they were doing:
“Greatest” generation (born before 1924): the Stock Market crash of 1929 and subsequent depression
“Silent” generation (born 1925-1945): Pearl Harbor and World War II
Baby Boomers (born 1946-1964): Korean War, the Kennedy assassination, the Moon landing and the Vietnam War
Generation X (born 1965-1980): Reagan assassination attempt, Challenger explosion, death of Princess Diana
Millennials (born 1981-1996): 9/11, Aurora and Sandy Hook shootings
Unfortunately, the series of events leading up to the nationwide shutdown because of the COVID-19 pandemic will unseat most of those events and eras. While previous pandemics (for instance, the Spanish flu of 1918) struck and killed many more people, the mobility of today’s population coupled with instantaneous media coverage provides a much different environment for this situation.
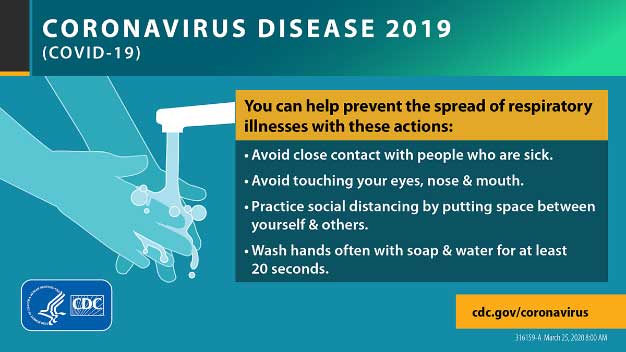
Image: CDC.gov
Obviously, we are not alone, and this virus has spared few countries and races. Different cultures across the globe have adapted for the pandemic in a variety of ways, and the U.S. has faced the same challenges across our diverse environments.
Depending on where one is located, they face a different set of challenges due to the pandemic. Several heavily populated urban areas are subject to a strict lockdown while states with mostly rural areas are less restrictive. One size does not fit all when dealing with limiting public exposure to others, but let us leave the debate of how much restriction is needed to the scientists and public officials. Many today do not agree with the rules we have been dealt with in going about with our lives. That is a discussion for another time and different forum.
Instead, let us discuss what we face going forward with our “new reality” of some form of social distancing and how the need for surveying and geospatial information remains for a large portion of this world. We must simply adapt to this situation with the adoption of new technologies and a revamped workflow.
Everything changes, whether we like it or not
The surveying profession is not unlike many other service-oriented and public-serving occupations, even with most of the field work being performed in solitude. We still deal with clients, governmental agencies, other consultants and the public.
The COVID-19 pandemic has changed the way we are now interacting with those outside partners with technological advances and modified communication conduits. Many of these methods existed well before this situation, but the rapid advancement of the pandemic forced many companies and employees into adapting very quickly.
Surveyors are no different, so let us run through the changes we have seen within the industry.
Project communication
The biggest challenge facing most surveyors in dealing with the pandemic atmosphere has been communication. Whether it is with employees, clients, government agencies or other consultants, communication has been affected mostly because of the elimination of face-to-face opportunities.
Technology to allow remote communication has existed for many years, but not many of us have taken advantage of it because of the convenience of in-person interaction. Who does not want to leave the office to meet with a client, shake their hand and close the deal? Or have the client come to your office and go over the intricacies of a complex survey?
Regardless of whether one is introverted or extroverted, human contact has always helped establish and solidify relationships. For most of us, this is how business has always been done, be it your client or your employees.
Obviously, the biggest area affected has been daily interaction with employees. Controlling workflow, handling projects and troubleshooting any situation is more difficult when the team is not physically in the same location. If a team member is overwhelmed, another one can immediate meet with them and help. Work is easily passed between teammates with little effort.
But working remotely? That takes more effort, consideration and technology to accomplish. Yes, video conferencing has been in place for many years, but mostly in large companies and only implemented it in a dedicated conference room. Not many employees were previously afforded a webcam, microphone and speakers along with the necessary software; all of these components are now standard issue. For many, programs like Zoom, Skype and Microsoft Teams are now a critical communication tool for timely and efficient sharing of information.
What about communication with field crews? Many would say that even a pandemic would not change how we stay in touch with field crews, but even these relationships have been affected. While there are survey companies operating with limited physical contact as a norm (large firms with projects regionally or nationwide), most surveyors still have a substantial amount of direct communication between field and office. This situation has forced many firms to take precautions, with crew members only handling specific pieces of equipment or performing a thorough cleaning if sharing during a project.
Project documents and files have typically been been handled manually with some electronic data files being transferred via email or internet. Depending on the size of the original document, having a full-size paper copy of a previous survey or subdivision plat has advantages to looking at a PDF image on a tablet or computer screen while in the field. Many companies outfit their field crews with 11 x 17-inch printers to be able to print larger detailed areas of bigger documents. Additional care must be taken if these items will still be used for field operations.
Image: Tim Burch
The transfer of data between office and field has become faster, more efficient and safer with technology. As data collectors have become more capable, direct connections via the internet to cloud storage is making transfer of project files and photos faster and more secure by providing immediate backup to guard against data loss. What used to take a trip to the office, connecting to a computer and downloading is now done in a matter of minutes without leaving the job site.
Field personnel are also benefiting from technology within our devices. Apps like FaceTime and programs like Microsoft Teams provide a gateway to video chatting so teammates can discuss projects in real time. Shared pictures, computer screens and face-to-face interaction provides an avenue to more effective communication and enhancing relationships between team members.
The pandemic has forced many surveyors to adapt and learn several new apps and programs to connect in new ways; however, this pandemic has also affected how we go about our field operations, too.
Enhanced data collection
Not many of the surveyor’s field activities are affected because of social distancing requirements, but the pandemic has forced our profession to be compliant with the new rules in case we are in proximity with others. Newer technology, using both terrestrial and aerial platforms, are now being utilized by more surveyors for their data collection needs.
Train employees now. As many companies have seen a slowdown in work due to pullbacks from projects moving forward, now is the time to get employees trained with the new technology and software to be better prepared for when the market comes back.
Using photogrammetry tools. Photogrammetry, lidar and laser-scanning systems are being purchased and implemented for everyday use and not just “special” projects with larger budgets. Not only are surveyors finding it keeps them further away from other people, it also allows for more efficient data collection and representation of existing conditions.
Flying unmanned aerial vehicles. UAVs continue to grow in popularity, and like the other technology discussed above, many firms are investing in becoming remote pilots and implementing aerial photography and lidar into their workflow. Previously, most surveyors (and the general public) would use Google Earth, Bing and other resources for aerial imagery to gain a better perspective on their project sites. Vendors are coming out with aerial products with more recent flights at a higher resolution, but do not offer the ability to extract reliable topographic data easily. In-house UAVs provide more flexibility and control over the information needed, and many are using their downtime to become familiar with aerial products.
Photo: GPS World
Dipping toes into remote sensing. Another sector of surveying equipment seeing increased use during this situation are new total stations with remote-sensing capability. Many surveyors may not have the need for a standalone laser or lidar scanner, so several manufacturers have introduced a total station that provides limited remote sensing for everyday use. While the built-in scanner is not nearly as robust as a traditional remote-sensing unit, it provides enough capability and accuracy for most users. This intermediate step of remote sensing helps a firm decide how much scanning they will produce and if an investment in a full function unit is right for them.
Upgrading GNSS receivers. We would be amiss if we did not mention that more surveyors are now upgrading their GNSS receivers to take advantage of more constellations, integration with IMUs and increased computing power of the latest data collectors. Some surveyors who are not as economically affected during this pandemic are taking advantage of great deals on new equipment and using this time to increase their capability and efficiency. As more satellite vehicles become available, the ability to gain accurate and precise locations is better than ever, so staying ahead of technology is still important in these times. We will continue to see more gains with L5 and L1C signals from the new GPS Block III satellites within the next few years, so staying current now is very important.
QA/QC — The electronic method
One trouble spot seen within the new paradigm is the ability to provide a thorough quality assurance/quality control (QA/QC) process on all surveying operations. Without the ability to print/plot original surveys at full scale, it becomes a more difficult procedure to review and analyze information on a computer screen.
The monitors used for drafting and calculations are getting bigger, but studies have shown the human eye will focus differently on an electronic screen compared to a survey on paper. There must be many other professions and occupations using similar technology who have yet to solve the QA/QC dilemma. Hopefully, our industry will find a way to help address this issue and provide guidance.
Image: Tim Burch
More connected than ever, yet still so alone
The COVID-19 pandemic of 2020 (let us hope that is all it encumbers) will be forever etched in our memories as frightening and unbelievable. More than 100 years has past since the last pandemic of this proportion has overwhelmed our population. We are much more advanced in our education of health, medicines and technology than the previous event, yet we were caught off-guard by the speed in which the virus spread throughout our lands. It taxed most of our health infrastructure beyond its limits and took its toll emotionally and financially to most of the population.
We were forced to adapt very quickly to a new norm of working remotely and independently of our co-workers and teammates. Did it hurt our productivity and profitability initially? Absolutely. Were our employees forced to learn new ways of doing their work and communicating by other means. Yes, they did. Was there a need for rapid troubleshooting of new procedures and task management? Of course. Has every transition of remote work been a success story? I doubt it, but it was not for lack of trying.
We are doing the best we can, and the surveying profession is rapidly trying to adapt. Like the rest of the world, the surveying profession will not be the same coming out of the restrictions placed upon us because of the pandemic. We have learned more about ourselves and how capable we are with tools we have. We also learned how we will transition with these skills into new technology not invented yet.
Surveyors are a tough bunch, so the social distancing and adaptation required to survive the COVID-19 pandemic of 2020 — while not easy by any stretch — has been handled with grace and professionalism. I would say to bring on the next one, but would rather this pandemic be in our rearview mirror quickly and not see anything like it ever again.
According to the company, Trimble Dimensions is the signature event for Trimble’s global user community spanning agriculture, construction, geospatial, transportation, utilities and more. The show highlights technology and how it transforms the way professionals work to achieve success.
“Unfortunately, the overwhelming concerns and ongoing impact of COVID-19 inhibit our ability to deliver a conference that meets the high standards of safety and excellence our attendees expect and deserve,” Trimble said in a press release.
The event was scheduled to take place Nov. 2-4 at the Gaylord Opryland Resort and Convention Center in Nashville, Tennessee. Trimble Dimensions is a biennial event.
New hyperlocal business directory ZoomBusiness designed to help Main Street businesses across North America engage with local residents
GIS Planning has launched an online tool that enables local businesses across North America to communicate with customers for free in real time.
ZoomBusiness, created in response to the COVID-19 pandemic, is an interactive, mobile-responsive mapping directory for communities that ensures customers can find open restaurants, stores and services in their region at no charge.
Businesses can list themselves for free on their local ZoomBusiness site, hosted by economic development organizations like cities, towns, counties or chambers of commerce. The businesses can provide customized details including websites, modified hours, delivery or curbside pickup options, promotions and gift card stimulus programs.
Residents can search for area businesses by categories, including grocery stores, pharmacies, banks, health facilities, hardware stores, pet stores and automotive shops, among others.
North America deployment
Local ZoomBusiness sites have already been deployed in more than 20 communities across North America during its soft launch, including regions of eastern Pennsylvania;, the City of Columbia, South Carolina; the state of Wyoming (which has listed more than 600 businesses on the directory); and Abbotsford, British Columbia.
“We created ZoomBusiness after realizing that small businesses need new, accurate ways to communicate that they are still open to their customers, given that social distancing requirements, product availability and operating hours are changing by the day,” said Pablo Monzon, managing director and co-founder, GIS Planning. “Our development team has created an intuitive tool to index and map business information across North America in real-time, and we believe it will be an enormous resource for the communities we serve.”
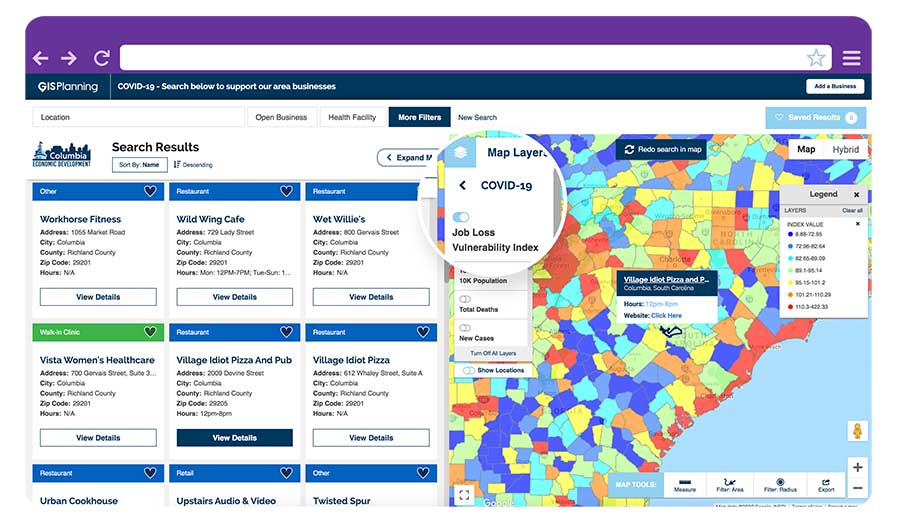
ZoomBusiness is a simple-to-use data tool, powered by Google Maps, using various layers for precise queries. Businesses are prompted to directly enter information on their current status and the content is verified by the organization hosting the GIS tool.
GIS Planning also added free map layers, including a COVID-19 case map updated daily by the New York Times, and a job-loss vulnerability index using recent employment data from Chmura.
Screenshot: GIS Planning
Columbia, South Carolina
The city of Columbia features 180 businesses on ZoomBusiness, helping residents discover delivery and curbside food options. That number is expected to quickly rise to more than 300 as business owners input data. Columbia will continue to promote safe and responsible “Shop Local” practices, Coleman added, in hopes that residents will take advantage of the service and support local businesses.
“Through our work with GIS Planning, we’ve been able to take our list of open restaurants and businesses and integrate it into the available properties map on our website,” said Ryan Coleman, director of the City of Columbia Office of Economic Development. “During this crisis, local businesses need every advantage we can give them, and this is another tool in their arsenal in helping to mitigate the negative impact of COVID-19.”
Abbotsford, British Columbia
The new solution has also made an impact in Canada, including the City of Abbotsford, British Columbia, which is promoting 130 businesses ranging from grocers to auto shops and medical suppliers.
“This is a resource that fills an urgent need. The long-term health and security of our businesses depend, in part, on the decisions we’re making right now,” said Kim O’Sullivan, City of Abbotsford’s economic development coordinator. “ZoomBusiness allows owners to communicate directly with their customers, many of whom would frequent these businesses, even online, if they knew they were able to do so.”
ZoomBusiness clients are given a unique link to their region which is then shared across organizational websites and social media to reach residents.
“Main Street businesses are truly the lifeblood of a community,” said Alissa Sklar, vice president of marketing for GIS Planning. “According to FEMA, up to 40% of small businesses never reopen after a major disaster. With ZoomBusiness, we want to help make sure the local restaurants, retailers and service providers that define local communities are still there to serve area residents when this pandemic is over.”
GIS Planning has made its ZoomBusiness tool free for its existing economic development clients (those using its investment attraction map, ZoomProspector); it is also available to new clients for a nominal fee. Prices are indexed to population size to keep them affordable for all communities. New clients can also be set up and ready to launch the tool within one day.
Following the COVID-19 recovery, data experts at GIS Planning forecast continued use of the directory to promote small and medium-sized businesses across North America.
Sand Studio, a mobile device management (MDM) solution provider, is offering AirDroid Business Geofencing, a location-based solution for businesses to monitor and track device location, automate tasks and receive notification alerts in one place.
With geofencing, organizations that have vehicles, personnel or valuable assets in the field can use tracking data and workflows to enhance security and optimize operational efficiency.
Geofencing integrates seamlessly with AirDroid Business’ easy-to-use yet powerful device management solution, enabling IT managers to apply different configurations to existing or newly created device groups at any time.
Adding to the existing location tracking feature, AirDroid Business Geofencing brings new capabilities like geofencing, path tracking, automated workflow, logs, and notification management.
Geofencing: Location-based technology where a customizable virtual fencing zone can be created for devices that are coming in and out of a predefined area on a map. Single devices or groups of devices can be added to multiple profile zones for different scenarios, which provides flexibility and more control over deployed devices.
Path Tracking: Admins can track a device and see its extensive path history. This allows for an in-depth analysis by combining time and location. For instance, admins can track a delivery truck and see if it has deviated from the assigned route, analyze the data, and improve operational efficiency.
Workflow, Logs and Notifications: Workflows work together with geofences. Triggered by a device entering or exiting a geofence, workflow will activate automated tasks such as device locking and factory reset. Working side-by-side with workflow is log management, where point of time, device activity, device status and events can be filtered to spot abnormal activities or insights for improvements.
“With mobile transformation continuing to take place in every industry, more businesses and organizations are deploying mobile devices in the field. However, they are also faced with the challenge of managing these devices,” said Anson Shiong, CEO of Sand Studio. “To help with this transition, AirDroid Business’ focus on remote device management and the new geofencing solution will help businesses maintain security and operational efficiency. These new features are designed to monitor and track remote devices with precision from anywhere in the world.”
Geofencing is beneficial to a range of industries such as medical and health institutions, public agencies who need to track people at risk in situations like the coronavirus outbreak, transportation and logistics companies that need specific details on fleet activity, corporations that disseminate company devices with confidential information, food delivery services and more.
The new tracking capabilities ensure consistent employee productivity levels as well as enhance security by knowing where the employees and devices are while also enabling confidential materials to be remotely wiped from a device when outside of the safety zone.
The National States Geographic Information Council (NSGIC) has released a joint statement on the value of GIS in the pandemic, alongside its partners the MidAmerica GIS Consortium (MAGIC), Open Geospatial Consortium (OGC), Urban and Regional Information Systems Association (URISA), and American Association of Geographers (AAG).
Joint Statement on the Value of GIS in the Pandemic
The spread and effects of COVID-19 can be best understood considering space and time.
As governments are responding to COVID-19, more leaders are recognizing the value of “knowing the where.” The importance of knowing where the outbreak is growing, where high risk populations are, where the hospital beds and important medical resources are, and where to deploy resources is essential. “Knowing the where” informs better decision-making.
In an effort to better understand the where, governments are recognizing the value of geospatial information and technologies and are engaging geospatial professionals to help them better understand the where to help them in their decision-making and response.
Geospatial professionals bring unique analytical and visualization skills to the table that help responders and decision-makers visualize where the pandemic is spreading more quickly and can make the important decisions regarding where response and resource needs need to be focused. The value of telling the story through a map coupled with a geospatial dashboard provides a view of the event not readily seen in a table such as a spreadsheet.
Beyond visualizing existing data, we can connect data from a location perspective, which enhances the value of the data sources being integrated. Equally important in this event is data on COVID-19 cases and testing packaged and shared in a way useful to scientists.
GIS (geographic information systems) is experiencing an unprecedented level of use. Historically, GIS was deployed following a disaster to help respond and recover. Today, GIS is used as a disaster is unfolding. The COVID-19 event is an outstanding example of how effective GIS is when robust data is available. Governments are realizing the value of investing in these systems and the people who run them.
The information necessary to empower all partners already exists.
Current nationwide models and response efforts may not benefit from the details of local geographic parameters. Local or statewide models and response efforts may not fully take advantage of the data from other areas of the country. Hospitals are surveyed by both federal and state agencies, and the results of those surveys are not readily available to the hospitals working together to care for patients. Nationwide geospatial data will empower a coalition of participants with a better understanding of the spread and impacts of COVID-19 and improve mitigation actions.
The same data can be made available in different forms to empower people playing different roles in the response. Researchers — epidemiologists — will benefit from nationwide COVID-19 testing data and data describing factors impacting the spread. This data needs to be as disaggregated as permissible under HIPAA and in a form readily digestible in models.
The case data could be aggregated to the same units of geography as a wealth of existing demographic data (Census tracts), which could explain and quantify local variances in the spread. Policy makers and those in emergency management can benefit from map and tabular dashboards, harnessing the power of the where by integrating data for analytics.
The emergency response, public health and geospatial communities must come together to understand COVID-19 in the U.S. and mitigate its spread and overall impact.
By geo-enabling public health and emergency response data, we can better:
understand the spread — with COVID case data, movements of people, and symptoms
understand the impact on individuals — with data including age, disease, obesity, and medical treatments
understand how to tailor outreach — by age, language, engagement with government, and lifestyle choices
understand the needs of the healthcare industry — by facility, day, bed capacity, type of care, ventilators, and PPE
understand the impact on the local economy — by county, day, unemployment, and bankruptcies
understand the societal impacts — by census tract, domestic violence, alcohol consumption, child abuse, animal abuse, elder abuse, mental health crises, 3-1-1 calls and firearm sales
We are committed to beginning the national conversation about leveraging the best available data to better understand the spread and impacts of COVID-19.
Over the last few weeks, many organizations have transitioned their workforce to remote work environments. At the same time, the demand for geographic information systems (GIS) products and skilled GIS professionals is high.
Esri announces that all of its instructor-led courses are available in its instructor-led online classroom, which is calls “an engaging learning environment that offers convenience and interactivity.”
The company lists these features:
Instructors and course attendees use the phone, chat, and virtual whiteboards to talk and collaborate in real time.
Group breakout sessions and content reviews support peer-to-peer learning and knowledge retention.
Attendees access all Esri software needed to complete course exercises through virtual machines.
“We understand that sustaining business operations and achieving your organization’s mission remains critical,” the Esri Training Team said in an email. “As always, we’re committed to helping you build the skills needed to apply ArcGIS best practices, fuel efficiencies and make the best decisions based on data.”
Esri offers the Esri Training Pass to streamline access to its online instructor-led classes. Users can pre-purchase training days to simplify training registration and approval processes throughout the year.
Enables building stakeholders to take accurate measurements based on point clouds
The latest release of the NavVis IndoorViewer 3D building visualization software features a new tool that lets building stakeholders take highly accurate measurements based on point clouds in the realistic 360° image view.
NavVis, global provider of indoor spatial intelligence technology and enterprise solutions, announces the release of NavVis IndoorViewer 2.6. This major software release includes a new measurement tool that lets users take highly accurate measurements based on point clouds in realistic browser-based digital buildings.
This release also makes additional features available to structured e57 point cloud files, including automatically generating highly detailed floor plans and routing.
NavVis IndoorViewer is a popular deliverable among building stakeholders without the technical expertise to work with point clouds and modeling software, thanks to the realistic digital buildings and intuitive interface.
One of the features that has proven to be useful among users across multiple industries is the measurement tool. It enables users to take measurements remotely on any device, saving time otherwise spent traveling to the site.
The release of version 2.6 of NavVis IndoorViewer marks a major advance in the accuracy of virtual measurement tools. The tool has been redesigned to overcome two of the biggest problems with virtual measurement tools – accuracy and usability.
On the one hand, point cloud measurements are quite accurate. But often these software tools are not accessible or even usable for a wide range of building stakeholders who lack the expertise in working with point clouds. If, on the other hand, the tool uses images or even meshes, which are much more user-friendly than point clouds, the tools are usually not reliable enough to produce accurate results.
The new measurement tool in NavVis IndoorViewer combines the best of both worlds, thanks to a patent-pending magnifying feature that appears when taking measurements in the realistic 360° view. The magnifying feature reveals the exact section of the point cloud behind the image and lets users pick the point cloud point as the basis for a measurement while benefiting from the intuitive interface of the fully immersive walkthrough.
“When redesigning the measurement tool in NavVis IndoorViewer, we wanted to make sure that a wide range of stakeholders in every industry that works with built environments could benefit from the accuracy of point clouds when taking virtual measurements,” said Georg Schroth, NavVis CTO. “We are confident that the new magnifying feature in NavVis IndoorViewer achieves our goal. Now even stakeholders that are unfamiliar with point clouds have an easy, intuitive way to take measurements based on this highly accurate real world data.”
In addition to making strides in the accuracy of remote measurements, the interface of the tool has also been fully redesigned. This includes a new slider function that lets users view the 2D floor plan and 3D walkthrough side-by-side or move from one view to the other.
The dual view provides an overview of the entire building so that users can easily locate an asset or area while also viewing the location in the realistic 360° view. The fully immersive walkthrough makes it possible to virtually move through the area being measured or inspect the asset, as if the user were on site. Measurements being taken show up in both views.
The release of NavVis IndoorViewer 2.6 also introduces new feature support for e57 point cloud files captured by static scanners. Previous NavVis IndoorViewer releases have included a popular feature that lets laser scanning professionals upload structured e57 point cloud files and automatically generate realistic, fully immersive 360° walkthroughs that can be published and shared with clients as a web-based link.
With the release of NavVis IndoorViewer 2.6, two popular features that were previously only compatible with scan data captured by NavVis hardware are now available for point clouds uploaded as structured e57 files. The first is the generation of a navigation graph, which makes it possible to turn static scans into a fully immersive indoor routing tool. The second is the automatic generation of highly detailed floor plans. Now point cloud files uploaded as structured e57 files can be turned into digital floor plans in a few clicks.
Kinetica simplifies active analytics with Kinetica Cloud
Kinetica, provider of the Kinetica Active Analytics Platform, has unveiled the Kinetica Cloud. Enterprises can use the full capabilities of the Kinetica platform in an optimal cloud environment, which includes historical data analytics, streaming data analytics, location intelligence and machine learning.
Kinetica Cloud was adopted by the San Francisco Estuary Institute (SFEI), which used the platform to detect trash in San Francisco Bay.
“The San Francisco Estuary Institute uses Kinetica Cloud for high-performance computing and to manage thousands of high-definition images of the landscape, which our machine learning algorithm studies to detect trash,” said Tony Hale, program director for Environmental Informatics, SFEI.
Photo: Thinkstock/Stockbyte/Getty Images
“With this more systematic way of monitoring when trash enters the landscape in uncontrolled ways, cities and governments that really care about the environment gain a remarkable resource to help them very quickly and effectively make decisions,” Hale said.
“With Kinetica Cloud, organizations across industries gain invaluable business flexibility and agility to direct their mission-critical initiatives,” said Paul Appleby, CEO, Kinetica. “Kinetica Cloud gives customers the ultimate flexibility in a hybrid, multi-cloud environment, empowering them to determine where it is optimal to deploy Kinetica.”
Organizations can use the Kinetica Active Analytics Platform on Kinetica Cloud without the complexity and wait times of deploying hardware systems and software.
“As customers adopt active analytics, they want to start their initiatives quickly to gain insight from their data,” said Karan Batta, senior director, Product Management, Oracle Cloud Infrastructure. “We are very pleased that Kinetica Cloud is available for Oracle Cloud, allowing organizations to shift their focus away from infrastructure and towards bringing smart analytical applications to market faster.”