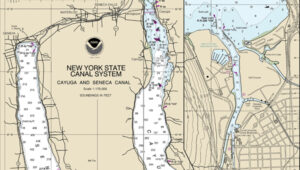
Built between 1817 and 1825, the Erie Canal provided a water route from Albany to Buffalo, New York, nearly 363 miles to the west. The Canal connected the Hudson River with the Great Lakes via parts of the Mohawk River, through various land cuts and natural lakes.
Photo: NOAA
Today, NOAA cartographers from the Marine Chart Division are converting paper nautical charts to a digital format and incorporating them into NOAA electronic navigational charts (NOAA ENC). NOAA created its suite of ENCs by digitizing its paper nautical charts. An ENC is a vector database that supports all types of marine navigation. Marine navigators can use the system to see their real- time position in relation to features on a chart.
Marine navigators using NOAA ENC. (Photo: NOAA)
By digitizing the paper Erie Canal charts, NOAA can now provide ENCs for the canal from Albany to Lake Ontario. As part of the digitizing process, NOAA cartographers standardized the chart scales covering the canal, moving away from the 64 irregularly shaped paper charts in chart 14786, New York State Canal System.
1:10,000 SCALE NOAA Custom Chart output near Waterford, New York. (Photo: USGS/NOAA)
The ENC is the primary nautical navigation product of the agency, which is ending the production and maintenance of its traditional paper and raster nautical chart products. The remaining paper charts are only being updated with critical corrections until they are fully canceled. Chart 14786 will be one of the last ones canceled, on Dec. 5, 2024.
Now, marine users are referred to the NOAA Custom Chart Application. It is an online map tool for users to create paper and PDF nautical charts derived from the official NOAA ENC.
Landscape of Badwater Basin salt flats, with halite textures under a vibrant pink sky during sunset or sunrise at Death Valley National Park. (Photo: StephenBridger / iStock / Getty Images Plus / Getty Images)
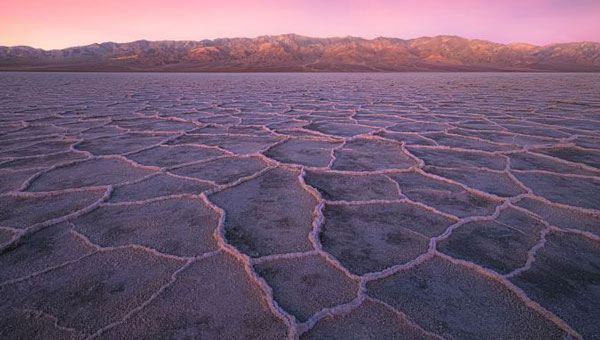
The U.S. Geological Survey (USGS) has commissioned Woolpert to collect Quality Level 1 lidar data and conduct ground control surveys throughout Southern California in support of the 3D Elevation Program (3DEP) and The National Map.
Overseen by the USGS National Geospatial Program, 3DEP provides the nation’s first comprehensive, high-resolution topographic elevation data integrated into The National Map. The data will be accessible to local, state and national agencies to consider when making decisions that affect the immediate safety of life, property and the environment, as well as for long-term infrastructure planning.
Woolpert will collect roughly 60,000 km2 of aerial lidar data throughout Inyo County, California, including parts of the Mojave Desert and Death Valley National Park, using a Leica TerrainMapper. QL1 data are collected at eight points per square meter.
“Woolpert has had the honor of supporting USGS’ 3D Elevation Program since its launch nearly a decade ago,” said John Gerhard, Woolpert vice president and program director. “Critical decisions that depend on accurate and available elevation data are being made every day, and we are incredibly proud to continue our support for the U.S. Geological Survey and its commitment to completing the nation’s first-ever baseline of consistent high-resolution elevation data.”
Gerhard added that the data acquired for this project will also support the USGS 3D Hydrography Program (3DHP). The project is underway, and data is expected to be acquired by fall 2024.
“Seen & Heard” is a monthly feature of GPS World magazine, traveling the world to capture interesting and unusual news stories involving the GNSS/PNT industry.
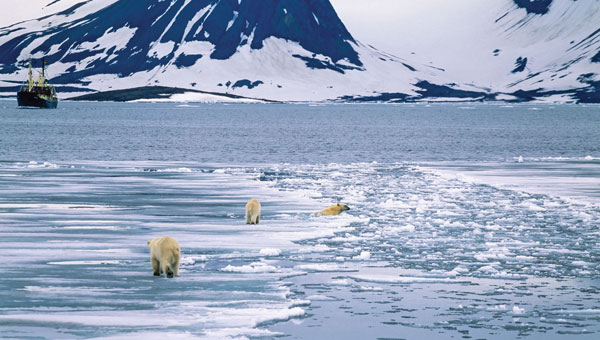
According to the 2023 Arctic Report Card by the National Oceanic and Atmospheric Administration (NOAA), new records have been documented showing that human-induced warming of the atmosphere, ocean and land is creating adverse impacts on people, ecosystems and communities across the Arctic region. The report states the Arctic is experiencing a faster rate of warming than any other part of the world. Overall, it was the Arctic’s sixth-warmest year on record. Sea ice extent continued to decline, with the past 17 Septembers now registering as the lowest on record.
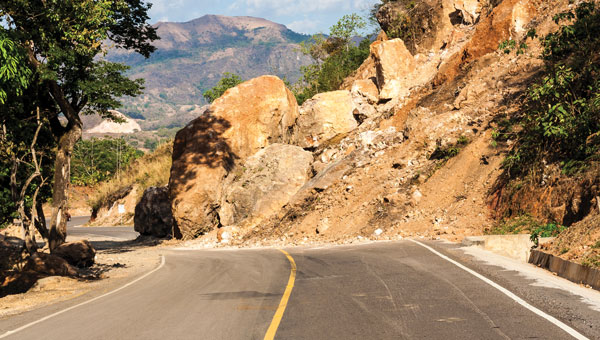
Researchers from Chang’an University in China have developed a new method of tracking landslides. The team combined GNSS precise point positioning (PPP) techniques with a cumulative sum control chart (CUSUM) method. Conducted at the Tengqing landslide in Liupanshui, Guizhou Province, Southwest China, the study aims to enhance the precision in tracking the movements of the landslides and improve the overall reliability of the monitoring results.
Crabs on the move
Image: United States Geological Survey (USGS)
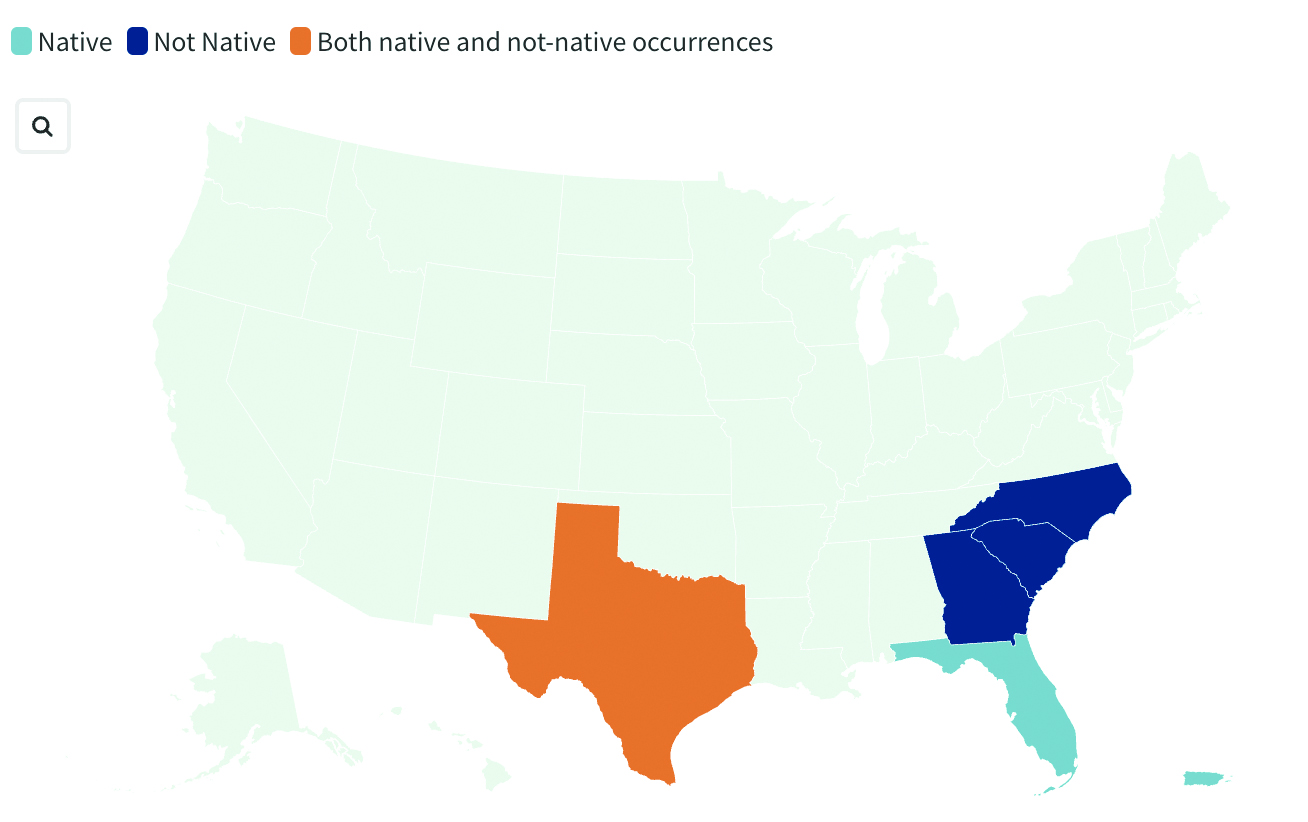
Georgia officials are asking the public for help in spotting non-native blue land crabs as they appear to be moving north in recent years, according to data collected by the United States Geological Survey (USGS). According to USGS, it is unclear whether this movement is driven by humans or by the crabs themselves, or if the crabs are breeding in their non-native homes. Officials worry about the damage caused by the crabs’ burrowing behavior. While scientists learn about how the species interacts with its new environment, several states are asking residents to report sightings.
India’s war on drugs
Image: evandrorigon / E+ / Getty Images
India’s border security force (BSF) has said it is battling an unprecedented UAV “menace” infiltrating the border with Pakistan, fueling the drug crisis in the state of Punjab and raising serious security issues, reported The Guardian. UAVs have dropped weapons such as pistols and Chinese-made assault rifles, as well as consignments of opium and heroin believed to be from Afghanistan.
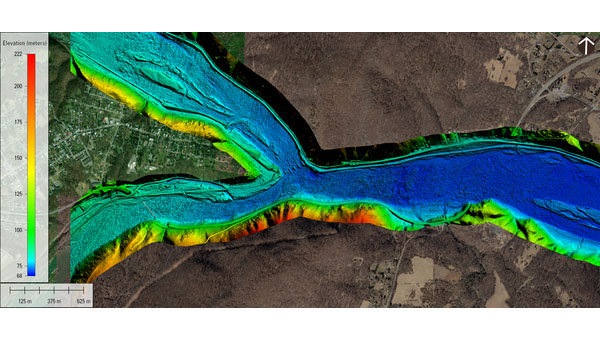
Topobathymetric digital elevation model of the confluence of the Potomac and Shenandoah Rivers at Harper’s Ferry, West Virginia. (Image: USGS)
The United States Geological Survey (USGS) and Dewberry, a privately held professional services firm, have jointly released a new topobathymetric lidar dataset for the Potomac River, extending from the Potomac Highlands in West Virginia to the Chesapeake Bay in Maryland.
The survey was conducted using Teledyne Optech CZMIL SuperNova lidar system, which allowed Dewberry to successfully survey a 55-mile (88.5km) stretch of the Potomac River, spanning from Hancock, Maryland to Shepherdstown, West Virginia. The survey resulted in the acquisition of 33km² of submerged topobathymetric lidar data.
Project deliverables included a 3D point cloud and topobathymetric digital elevation models (DEMs) for the surveyed river section. This project, the second for the Potomac River, builds on the first, which covered the area from Shepherdstown, West Virginia, to the Little Falls dam near Washington, DC. The generated maps are designed to serve as a valuable tool for predicting oil spill presence and movement in the Potomac River, supporting ICPRB’s mission to safeguard the waters and resources of the Potomac River basin through science, regional cooperation and education.
Conducted for the USGS’s 3D Elevation Program (3DEP), the lidar survey involved collaboration with the USGS Earth Resources Observation and Science Center (EROS), National Geospatial Program (NGP) and Eastern Ecological Science Center (EESC) programs, along with the Interstate Commission on the Potomac River (ICPRB).
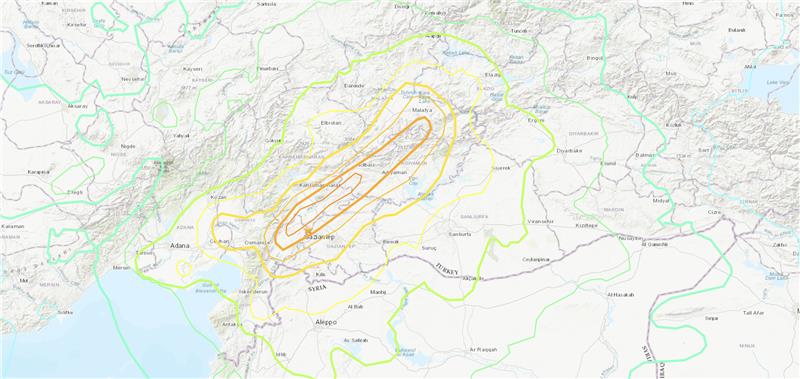
Three earthquakes of magnitude 6 or larger have occurred in Turkiye and northern Syria since 1970. The largest was a magnitude 6.7 earthquake in January 2020. (Credit: USGS)
On Feb. 6, a magnitude 7.8 earthquake struck Turkiye and northern Syria collapsing buildings and killing more than 2,000 people, followed by magnitude 6.7 aftershocks. The impact of the earthquakes was significant and ranks in the red for economic losses and orange for fatalities, according to the United States Geological Survey (USGS).
The USGS reports the earthquake resulted from strike-slip faulting at shallow depths. It appears to be associated with either the East Anatolia fault zone or the Dead Sea transform fault zone.
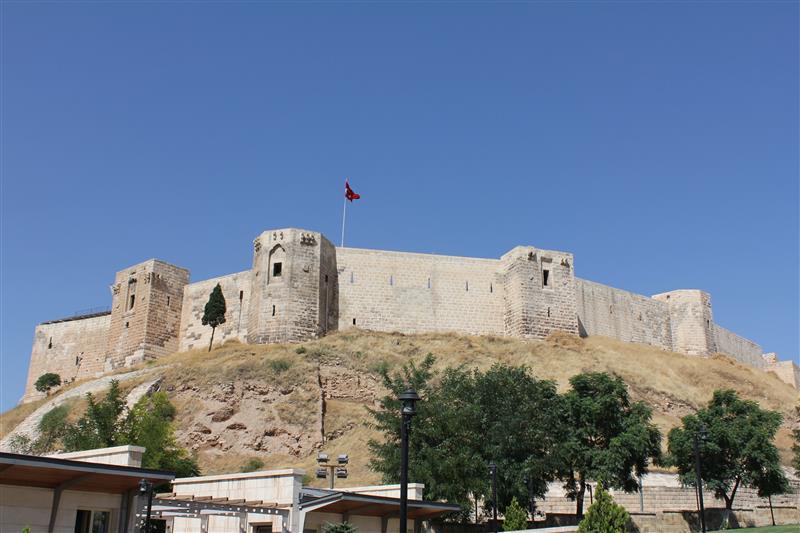
Historical buildings throughout Turkey have been severely damaged, including the Yeni Mosque and the Gaziantep Castle, which date back thousands of years.
War-torn Syria — specifically Aleppo, Hama and Latakia — have also sustained severe damage to infrastructure that was already fragile.
The effects of this earthquake were felt as far as Lebanon and Israel.
Parts of the historic Gaziantep Castle collapsed, as it lies close to epicenter of the magnitude 7.8 earthquake. (Image: JudyDillon/ iStock / Getty Images Plus/Getty Images)
Historical Gaziantep Castle’s east, south and southeast bastions collapse, leaving debris scattered on the road after major 7.4-magnitude earthquake struck Türkiye’s southeasthttps://t.co/5j2soYI6hCpic.twitter.com/1n6whCr2gY
Work supports climate change research, the 2020 Juneau landslide, and effects of the Exxon-Valdez oil spill
NV5 Geospatial marks its 65th year helping Alaska solve environmental and geospatial challenges, with new hydrospatial projects with the National Oceanic and Atmospheric Administration (NOAA), U.S. Geological Survey (USGS), Alaska Railroad Corporation, Alaska Department of Natural Resources, U.S. Fish and Wildlife Service and the U.S. Department of Agriculture.
“As climate change intensifies, so do the challenges that Alaska and its citizens face,” said Adam McCullough, NV5 Geospatial’s Alaska program manager. “From mapping the coastlines, to collecting lidar and imagery data to better understand geohazards and landslide risks, to mapping rivers, lakes and other surface water features, we are involved in critical projects across the state. We are proud to work side by side with national, state and local governments and agencies, as well as private corporations to facilitate climate-change informed decision making over the state’s valuable, unique resources.”
The following six projects provide a sampling of the work in which NV5 Geospatial has participated across the state:
Revillagigedo Topobathymetric Lidar and Imagery Mapping – NV5 Geospatial is working alongside state and federal partners on a multi-year program to map Alaska’s 66,000 miles of complex coastline. This work is part of a larger national shoreline mapping project being undertaken by NOAA to gather baseline data to update nautical charts, manage coastal resources, and define U.S. territorial limits.
The data collected also can support maritime trade and transportation, as well as wave and wind energy site selection. The data supports coastal resiliency efforts that include modeling sea-level change, storm surge, coastal flooding and pollution trajectories, as well as analysis and monitoring of critical habitats, developing land and marine GIS base layers.
The Alaska Railroad Corporation (AARC) Lidar Acquisition for Geohazards – AARC engaged Michael Baker and NV5 Geospatial to collect high-resolution topographic lidar and imagery data for analysis of geohazards, hydrology, engineering and landscape ecology across portions of its vast rail network in Alaska. NV5 leveraged its advanced combined low-altitude sensor solution (CLASS) mounted to a helicopter to simultaneously collect lidar, ortho-imagery and oblique images along the rail line that enables researchers to evaluate landslide and hydrological risks in areas of concern.
USGS 3DEP Juneau Landslide Lidar Study – In the aftermath of unprecedented rain events in Southeast Alaska in December 2020, the City and Borough of Juneau, along with Alaska Electrical Light & Power, partnered with the USGS to acquire and process 3DEP-compliant airborne topographic lidar data covering the Juneau landslide impact area. The USGS contracted NV5 Geospatial to perform the lidar survey that included acquiring extremely accurate lidar to USGS’s highest quality level specification.
The lidar data will support planning and landslide assessment to enable the reinforcement of critical infrastructure resources in the area. Project stakeholders are able to use this data along with existing lidar collected by NV5 Geospatial in 2013 to study how the landscape is changing in precise detail.
Alaska 3D Hydrography Program (3DHP) – The USGS, in partnership with state, local, and tribal governments and others, has embarked on a multi-year effort to enhance the mapping of rivers, lakes and other surface water features for the entire state of Alaska. Supporting that initiative, NV5 Geospatial has been repeatedly contracted by USGS to develop improved hydrography, covering 62,934 square miles to date.
NV5 Geospatial is leveraging the recently completed statewide interferometric synthetic aperture radar (IfSAR) coverage as the elevation data source to define drainages, impoundments and other hydrographic features in greater detail and accuracy. Once completed, the enhanced map data will be used to inform navigable waterways; conduct flood analysis; and delineate wetlands, fish habitat, recreational opportunities, coastal resiliency and more.
Exxon-Valdez Oil Spill, National Wetlands Inventory and National Hydrography Dataset – The U.S. Fish and Wildlife Service is leveraging grant funds to map wetlands and hydrography for areas affected by the 1989 Exxon Valdez oil spill. These areas include Kodiak Island, Afognak Island and the shorelines of Shelikof Strait in Alaska. Wetlands data are used by natural resource managers to promote the understanding, conservation and restoration of wetlands, while the hydrographic data supports scientific studies, cartography and natural-resource management associated with inland surface water features.
U.S. Department of Agriculture Aerial Orthoimagery Term Contract – NV5 Geospatial was awarded a large multi-year term contract to support aerial orthoimagery in Alaska. The contract has been used to acquire tens of thousands of square miles of high-resolution orthoimagery covering some of the nation’s largest national forests including Tongass and Chugach, as well as agricultural lands significant to the Natural Resource Conservation Service. These areas are in areas with some of the most challenging weather and terrain anywhere in North America and require aircraft on persistent standby to take advantage of the brief windows of opportunity to collect high-quality imagery.
125+ speakers and 50+ sessions are confirmed for the 2022 edition of Geo Week in Denver
Organizers of Geo Week, which brings together geospatial technologies and the built world, have announced its conference sessions and speakers for the 2022 event, which will take place Feb. 6-8 in Denver, Colorado.
The conference program features more than 125 speakers across 50 sessions with content that explores best practices in 3D capture, working in the built environment, gaining return on investment (ROI) from building information management (BIM), defining what’s possible now with lidar, and more.
The coming together of AEC Next Technology Expo & Conference, International Lidar Mapping Forum, and SPAR 3D Expo & Conference to form Geo Week reflects the increased integration between the built environment, advanced airborne/terrestrial technologies, and commercial 3D technologies.
Presenters represent Autodesk, Esri, USGS, The Beck Group, Hexagon Geosystems, GM, Caltrans, Velodyne Lidar, Draper, MLB and NASA. These experts will share their expertise on a range of topics. Sessions include:
Geo Week will have multiple tracks with content clearly identified as relevant to one or more of the audience groups feeding into Geo Week.
The International Lidar Mapping Forum (ILMF) audience has historically been comprised of precision measurement professionals in surveying and mapping who use airborne and terrestrial lidar and related remote sensing technologies.
The AEC Next audience has historically been comprised of professionals in architecture, engineering and construction that use technologies such as reality capture, automation, artificial intelligence and XR to bid and manage projects and improve workflows.
The SPAR 3D audience has historically been comprised of professionals who use 3D capture, scanning, visualization and modeling technologies across a variety of verticals.
“We’ve witnessed the growing convergence between geospatial and the built world,” said Lee Corkhill, group event director at Diversified Communications, organizer of Geo Week. “We believe the market is ready and eager for this next step of leveraging the confluence of technologies for improved collaboration, increased efficiency, and better outcomes. Much of the conference content and technology being showcased will reflect and support this increasing integration. At the same time, we recognize that individuals and organizations are at differing levels of adoption, and so there will be ample content more focused on what were traditional AEC Next, ILMF and SPAR 3D topics.”
Geo Week will provide education, technology and resources for professionals in industries including AEC, asset and facility management, disaster and emergency response, Earth observation and satellite applications, energy and utilities, infrastructure and transportation, land and natural resource management, mining and aggregates, surveying and mapping, and urban planning and smart cities.
More than 80 companies have confirmed booths on the Exhibition Floor with additional companies being confirmed every week and more than 100 associations and media companies are signed on as supporters.
Geo Week takes place Feb. 6-8, 2022, with conference programming and exhibits all three days. Additional features of the programming are vendor-delivered product reviews, exhibition theaters, workshops and programming hosted by ASPRS, MAPPS and USIBD. Visit www.geo-week.com for more information on attending or exhibiting. Register before Dec, 10 for early bird rates.
After 15 years of planning and development, the ShakeAlert earthquake early warning system is now available to more than 50 million people in California, Oregon and Washington, the most earthquake-prone region in the conterminous U.S.
ShakeAlert provides alerts to the general public through public alert systems such as TV, radio and mobile phones. It also slows down trains, opens firehouse doors, closing water and gas valves and
May’s addition of Washington State to the system completes the U.S. Geological Survey and partners’ West Coast rollout of ShakeAlert.
ShakeAlert first launched in California in 2019 and expanded to Oregon in March of this year. People in all three states can now receive alerts from FEMA’s Wireless Emergency Alert system, third-party phone apps, and other technologies.
The ShakeAlert system relies on sensor data from the USGS Advanced National Seismic System. ANSS is a USGS-facilitated collection of regional earthquake monitoring networks operated by partner universities and state geological surveys on the West Coast and throughout the nation.
Part of that data comes from GPS, which the USGS uses to measure crustal deformations over time. The USGS measures the precise position (within 5 mm or less) of GNSS stations near active faults relative to each other.
USGS works closely with ANSS partners and state emergency management agencies on the system’s development as well as public communication, education and outreach. “USGS science is the backbone of hazard assessment, notification, and response capabilities for communities nationwide so they can plan for, and bounce back from, natural disasters,” said David Applegate, associate director for Natural Hazards Exercising the Delegated Authority of the USGS Director.
“Systems powered by ShakeAlert can turn mere seconds into opportunities for people to take life-saving protective actions or for applications to trigger automated actions that protect critical infrastructure,” Applegate said. “An effort like this takes the dedication, ingenuity and hard work of dozens of partners with the same vision, and the USGS is proud to have been part of a collaborative team that made this robust public safety system available for millions of citizens on the West Coast.”
The ShakeAlert earthquake early warning system can save lives and reduce injuries by giving people time to take protective actions like drop, cover and hold on before potentially dangerous earthquake shaking arrives at their location.
In addition to supporting public alerts to mobile phones, ShakeAlert system data has, since late 2018, been used to develop applications that trigger automated actions. Automatic actions can be used to slow down trains to prevent derailments, open firehouse doors so they don’t jam shut and close valves to protect water and gas systems.
The technology will continue to improve over time with the addition of more seismometers to the network, by expanding alert delivery area and by improving messaging speeds.
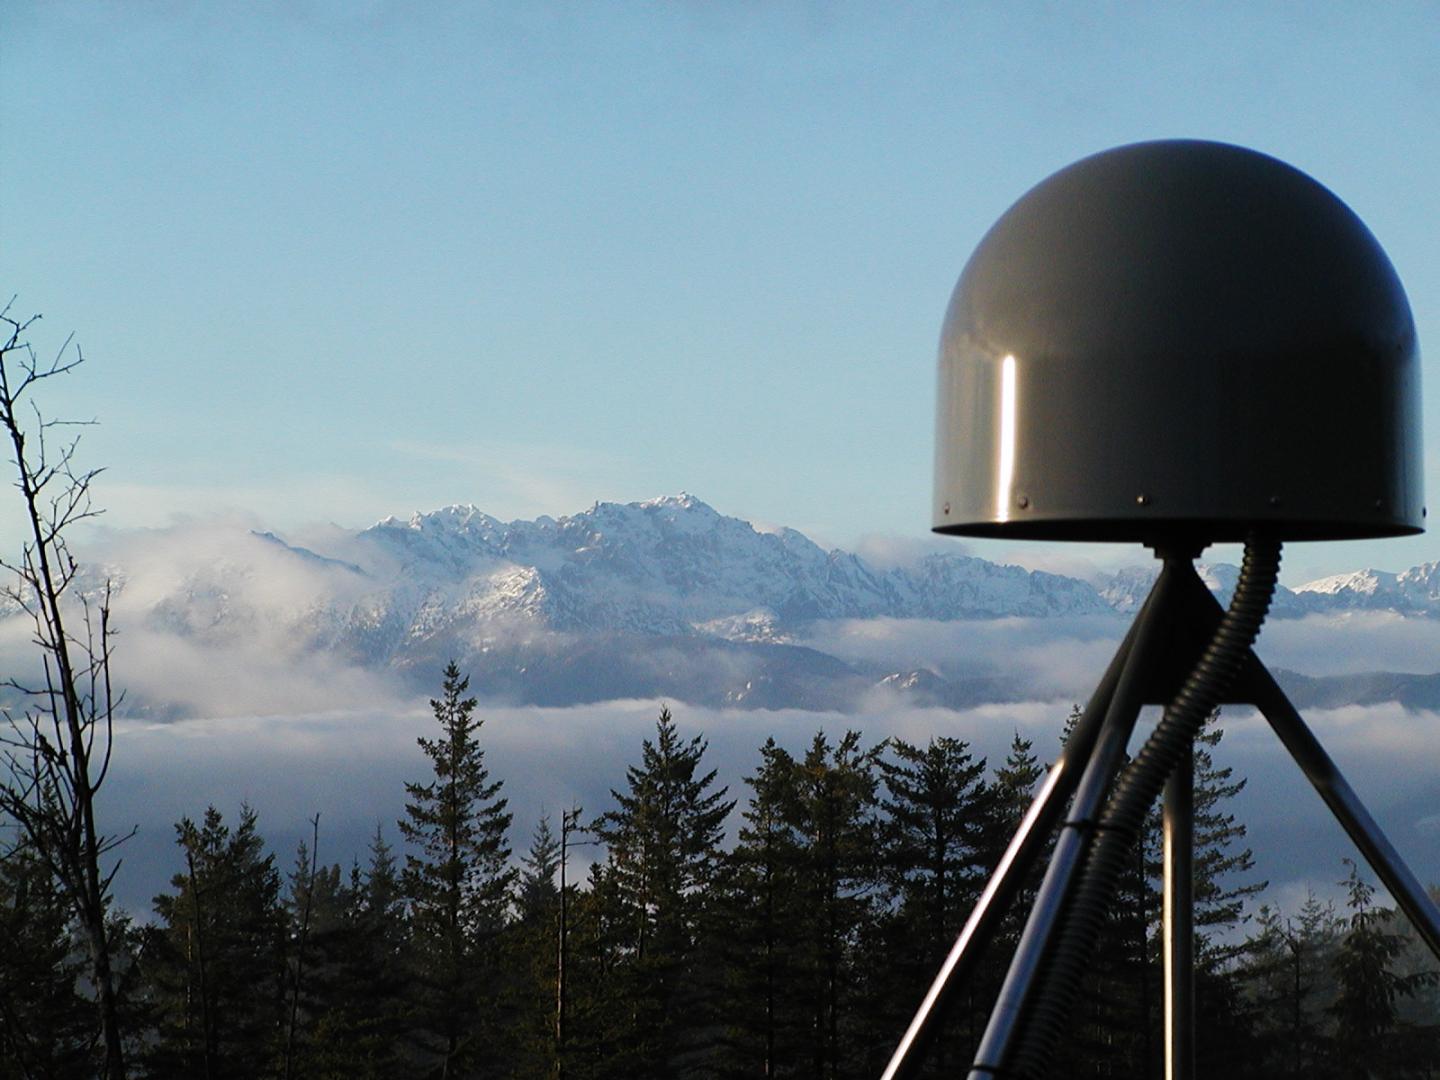
A GNSS station in the Pacific Northwest geodetic array. (Photo: Central Washington University)
Firm will provide geophysical surveying services across multiple states
Dewberry, a privately held professional services firm, has been awarded multiple task orders from the U.S. Geological Survey (USGS) under the Geospatial Products and Services Contract (GPSC) to perform airborne geophysical surveys in portions of Missouri, Illinois, Kentucky, Texas and New Mexico for the USGS Earth Mapping Resources Initiative (Earth MRI).
“Earth MRI is a play on words, as people are familiar with the use of magnetic resonance imaging (MRI) to image inside the human brain,” said Dewberry Project Manager David Maune. “Dewberry is excited to support USGS in its mission to assess critical minerals using airborne geophysical survey technology.”
Dewberry will perform very low-altitude magnetic and radiometric surveys from a fixed-wing aircraft and a helicopter with towed-array sensors to image subsurface geologic structures in search of undiscovered critical minerals and rare earth elements vital for the electronics industry.
These projects, which will be used to evaluate the potential for undiscovered critical mineral deposits contributing to an understanding of the major mineral systems for the two regions, are expected to be completed in early 2021.
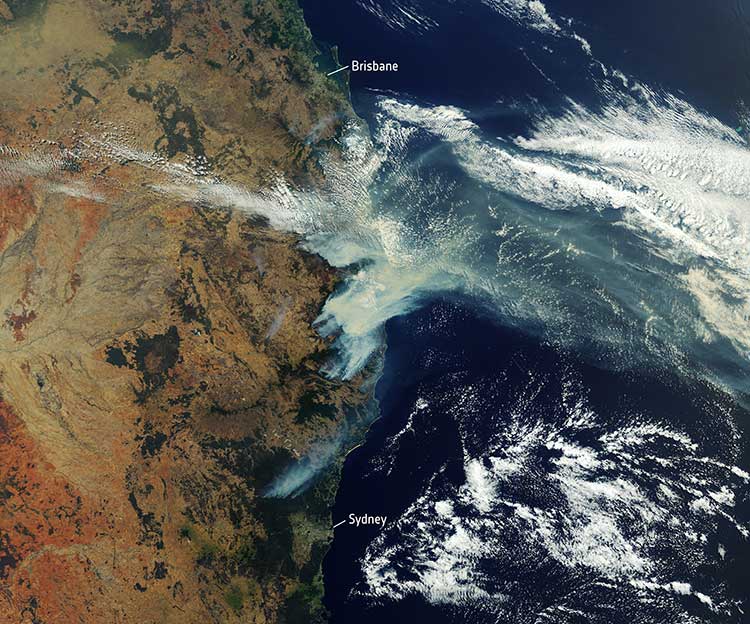
The months-long wildfires raging in Australia have killed at least 25 people. Millions — possibly 1 billion — animals have died. More than 2,000 houses have been destroyed. Around 150 fires are still burning in New South Wales and Queensland, with hot and dry conditions accompanied by strong winds fueling to the fires’ spread.
With this conflagration rocking the continent down under, satellite imagery has become important to understanding the scope of the disaster. Here are some of the recent captures.
As seen from the ISS
“Talking to my crew mates, we realized that none of us had ever seen fires at such terrifying scale,” European Space Agency astronaut Luca Parmitano tweeted on Monday, sharing photos taken from the International Space Station.
The astronaut posted images showing what he described as “an immense ash cloud” captured at the time the ISS was flying toward sunset.
An immense ash cloud covers Australia as we fly toward the sunset.
Another social media image, shared widely, was interpreted as a map showing the live extent of fire spread, with large sections of the populous eastern coastline molten red. Because of widespread misinterpretation, the original poster then explained that the image was a 3D visualization and not a photograph of Australia, and showed some areas where fires have been extinguished.
NASA and the U.S. Geological Survey’s Landsat 8 satellite imagery from Jan. 9 shows Kangaroo Island, home to nature reserves. The images were taken using the Operational Land Imager (OLI) on Landsat 8. Using natural-color observations, the images show burned land and thick smoke covering the island, of which at least 156,000 hectares have burned.
Photo: NASA/USGS
The U.S. National Oceanic and Atmospheric Administration (NOAA) satellites are also capturing images, including the resulting plumes of smoke.
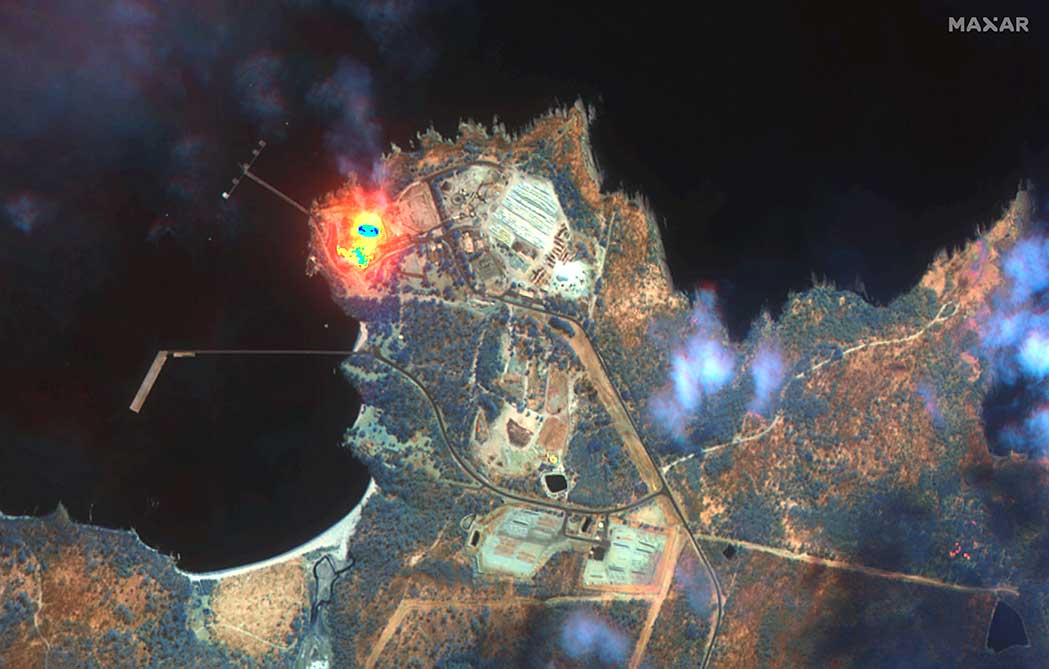
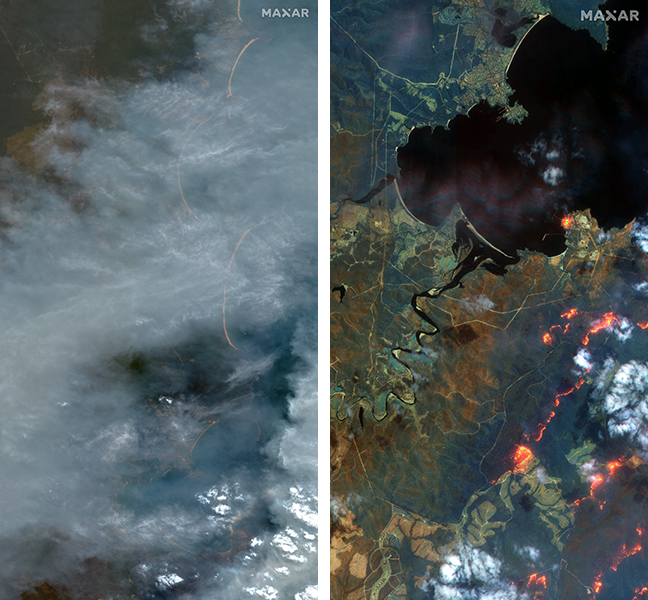
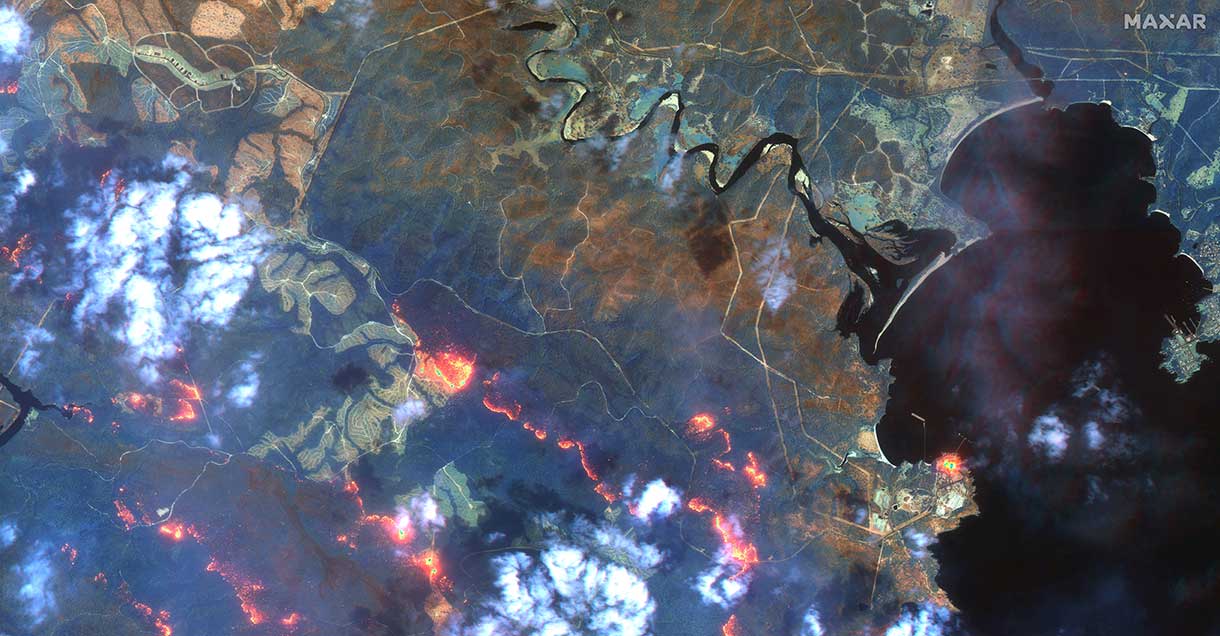
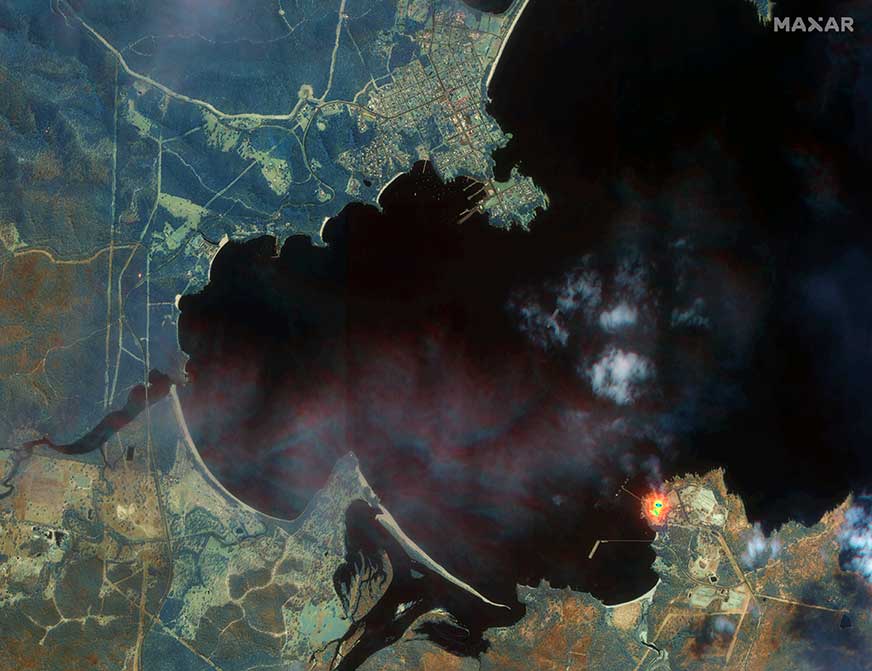
Maxar collected satellite imagery Jan. 12 of the wildfires in New South Wales (NSW). The imagery shown below focuses on the area near the town of Eden, and demonstrates the value of the shortwave infrared (SWIR) sensor.
In an image taken with Maxar’s normal RGB color imagery, the smoky air prevents a clear view of the fires and the hot spots. With Maxar’s WorldView-3 satellite, however, the team is able to penetrate through the smoke using its SWIR sensor for a detailed look at the fire lines and burned vegetation.
With SWIR imagery, burning areas are apparent and show up in a glowing orange-red. Healthy vegetation shows up in shades of blue, and burned vegetation appears in shades of brown.
Satellite Photo: :ESA
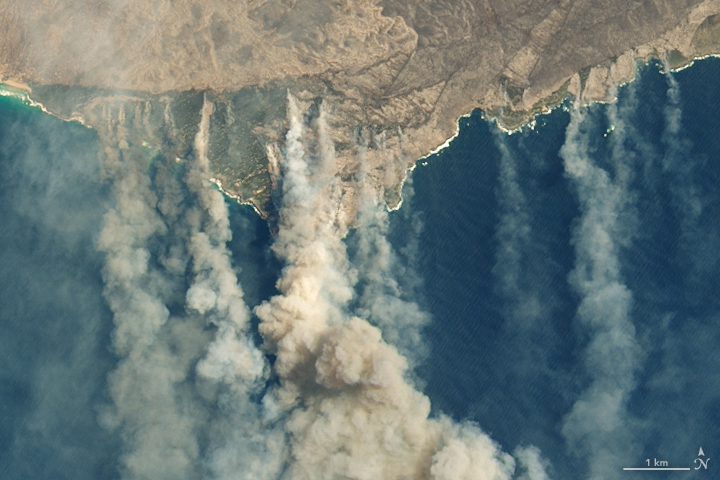
Copernicus Sentinel-3 imagery
Europe’s Copernicus Sentinel-3 mission has captured the multiple bushfires burning across Australia’s east coast.
In the above image, captured on Nov. 12, 2019, at 23:15 UTC (Nov. 13, 09:15 local time), the fires burning near the coast are visible. Plumes of smoke can be seen drifting east over the Tasman Sea. Hazardous air quality owing to the smoke haze has reached the cities of Sydney and Brisbane.
Flame retardant was dropped in some of Sydney’s suburbs as bushfires approached the city center, and many residents were evacuated. Firefighters continue to keep the blazes under control.
The Copernicus Emergency Management Service – Mapping was activated to help respond to the fires. The service uses satellite observations to help civil protection authorities and, in cases of disaster, the international humanitarian community, respond to emergencies.
Quantifying and monitoring fires is fundamental for the ongoing study of climate, as they have a significant impact on global atmospheric emissions. Data from the Copernicus Sentinel-3 World Fire Atlas shows that there were almost five times as many wildfires in August 2019 compared to August 2018.
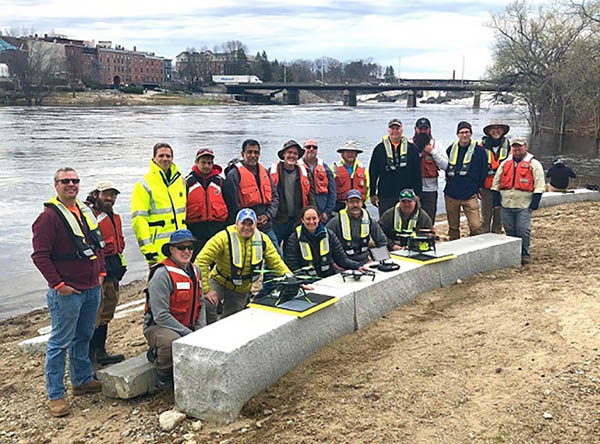
2019 Aquatic Airshow participants at Androscoggin River in Auburn, Maine, on May 1. (Photo: Mario Martin-Alciati, USGS)
The U.S. Geological Survey (USGS) and independent scientists gathered this month in Auburn, Maine, to evaluate the use of sensor-mounted unmanned aircraft systems (UAS) to gauge stream stage, velocity, bathymetry and discharge.
The technology is being evaluated and modeled to determine whether it will support the fast, accurate and safe measurement of rivers, especially when they are flooded or contain floating trees, ice or other debris.
Close to two dozen hydrologic, geospatial and scientific experts gathered in what has been dubbed the “2019 Aquatic Airshow” to assess the technology. They were led by John Fulton of the USGS Colorado Water Science Center, Jack Eggleston of the USGS Water Mission Area Hydrologic Remote Sensing Branch, and Joe Adams and Sandy Brosnahan of the USGS National UAS Project Office.
The USGS Water Mission Area works with partners to monitor, assess, research and report on a wide range of water resources and conditions, including streamflow, groundwater, water quality, water use and water availability.
The testing involved equipping drones with noncontact sensors, including ground-penetrating radar for measuring river depths, doppler velocity radar and cameras with velocimetric analysis for measuring water surface velocities and calculating mean-channel velocities; and high-resolution cameras for photogrammetric mapping of surface topography and vegetation structure.
All the evaluated sensors were equipped with GNSS receivers; some with RTK correction capability. Most of the drones used were equipped with a low-grade inertial measurement units (IMUs) for navigation.
Team members from the USGS Water Science Centers in Colorado, New England and Virginia collected ground-truth river monitoring data with acoustic doppler current profilers deployed from a boat and multiple other surveying techniques to verify the accuracy of the drone-based stream data.
Woolpert Chief Scientist Qassim Abdullah was one of two scientists from the private sector asked to participate in the airshow. Abdullah has more than 40 years of experience in analytical photogrammetry, digital remote sensing, and civil and surveying engineering.
For the event, Abdullah devised a process in which the data collected by the drones underwent Pix4D triangular adjustment to produce three-dimensional models of the water surface and river edges to assist the modeling of river velocity using the drone-based doppler velocity radar and large-scale particle image velocimetry.
USGS scientists are in the process of evaluating the data and modeling produced by this testing to conclude whether this technology will prove beneficial.
Abdullah said the airshow was a success due to the varied contributions from each member of the team, their diverse backgrounds and their shared focus on water research.
“This was a great example of how a public-private partnership can work together to activate and elevate necessary, groundbreaking technologies to address worldwide issues,” Abdullah said. “Airshow team members brought different perspectives, processes and applications to the testing, which not only proved essential for this project but will help with many others moving forward. I love working with this group and look forward to continuing to help advance these vital technologies.
In a rare historic moment, Congress understood geospatial technology’s important role would be key to support the new Department of Homeland Security.
Written by Nate Smith; edited and co-written by William Tewelow, GISP
If it doesn’t kill you it makes you stronger, but therein is the rub: You first have to avoid dying. Nothing sharpens the mind like trying to survive.
On Tuesday morning, Sept. 11, 2001, the United States suffered a near mortal wound. In order to recover, there was no margin for error. Surviving depended upon getting it right. Failing to “connect the dots” again could prove fatal.
The cause, in large part, were organizational silos in the intelligence and security agencies and no structure upon which intelligence data could be shared across the silos. With terminal lucidity at failure’s dire consequences, in a rare historic moment, Congress, seldom praised for innovative thinking, understood geospatial technology’s important role and would be key for supporting the agency’s mission.
Click for an overview presentation on the GMO. (Image: DHS)
The government had to be restructured and given new tools and technologies to ensure our safety. The Department of Homeland Security (DHS) was the centerpiece of this effort bringing a number of established security focused organizations under its umbrella.
The creation of DHS was an unprecedented task in the modern era. Many of Congress’ recommendations were codified in the founding of the Geospatial Management Office (GMO) established within DHS.
Connecting the Geospatial Dots. The GMO’s mission was to create community, infrastructure, and the sharing of data and ideas ensuring future dots get connected to anticipate trends and stay ahead of adversaries avoiding another shock to our nation.
The early GMO was modestly funded and staffed with employees on short-term assignments from other agencies in borrowed office space at Federal Emergency Management Administration (FEMA) headquarters.
The first geographic information officer, Ryan Cast, developed the work plan, putting emphasis on discovering what data and opportunities already existed and identifying activities that supported and enhanced the component agencies. Integrating the agencies capabilities and optimizing their interoperability was the focus of his leadership laying a strong foundation for future GIO’s to build upon.
Weathering Hurricane Katrina
The GMO was still finding its sea legs when Hurricane Katrina struck in 2004. Since expectations were low, they did not bear the brunt of the critics. The GMO, seeing the negative attention directed towards FEMA, created innovative partnerships with National Geospatial-Intelligence Agency (NGA, which was NIMA at the time) and the United States Geographic Survey (USGS) employing their prototype technology to assist the recovery and response community, who were looking for innovations to ensure wide access to data and tools.
Before and after Hurricane Katrina: Photos taken off the coast of Bay St. Louis, Mississippi, show how the storm surge, estimated to have exceeded 20 feet in Waveland, destroyed homes and left only foundations. Trees have been denuded of all vegetation. (Photo: USGS)Before and after Hurricane Katrina:In the top image, taken in 1998, notice the Deep South Motel to the left and the apartment building to the right. The bottom image shows the same location on Aug. 31, 2005, two days after Hurricane Katrina made landfall. A small portion of the motel is only structure left standing. (Photo: USGS)
A key partnership was established between FEMA and Louisiana State University to develop a geospatial data clearinghouse, which proved to be useful to many agencies and researchers.
iCAV. One technical innovation in response to Katrina was the DHS Infrastructure Critical Asset Viewer (iCAV) interactive mapping platform branded as GIS for the Gulf.
iCAV was built on technology borrowed from NGA’s Palanterra Common Operational Picture (COP) system, repurposed for the DHS mission, providing map-based situational awareness.
From this operational experience, additional design elements were identified for improvement, including symbology on the front end and data modeling on the back end. These became central aspects of development for the GMO.
USNG. Katrina also highlighted the need for a more universally accepted referencing framework to assist field operations, planting the seeds for the development of a U.S. National Grid system (USNG).
I personally experienced the need for a USNG, having lived on the Mississippi Coast at the time. GIS in the government, especially the use of it domestically at the federal level was almost non-existent, and with all the landmarks and road signs gone, the entire coastal area was uncharted territory.
More than once I helped a lost Red Cross supply truck return to the main road.
Hurricane Harvey Hits Hard
Fast forward to Aug. 25, 2017, when there was a brief, collective sigh of relief as the full destructive force of Hurricane Harvey’s eye wall missed the highly populated areas of the Texas coast. The pause was brief. Coming into focus through rainfall observations and numerical weather models meteorologists and emergency managers understood another peril was imminent.
Harvey had lost its steering winds and would linger in the Houston area dumping over 50 inches of rain in the coming days. In Houston, there was alarm as this deluge would likely far exceed the engineered capacities of the channels and reservoirs and an epic flood was in the making. This anxiety was shared with the regional FEMA office and in the Washington, D.C. headquarters.
FEMA’s geospatial experts in D.C., having recently demonstrated their successful impact analysis approach in Louisiana, felt assured they could quickly grasp the magnitude of this event with high confidence, but were concerned about another type of flood — the flood of data and tools, as well as inquiries distracting them from their primary focus.
Partnerships, capabilities and expertise. Events such as these attract well intentioned and ambitious researchers and vendors seeking the time and attention of response leaders to share their resources and gain access to FEMA’s data. Even short conversations consume critical time.
These secondary groups often contribute valuable resources and services playing key roles in community learning and development so their outreach efforts need to be balanced.
Rather than ignoring these efforts, FEMA contacted the GMO to leverage their partnerships, capabilities and expertise to facilitate these exchanges. In one day, the GMO developed a publicly accessible portal and assigned a team of geospatial experts the responsibility to catalog and make discoverable all geospatial data related to Hurricane Harvey.
Over the following two weeks, this response became a model of transparency, innovation and collaboration, and the site is still available supporting research and providing an example for future events. The site was a great example of government getting it right, but it came at a price, and still there are two long shadows cast by towers no longer there.
Conclusion
From Greater Manhattan to Katrina’s desolation and the floods of Harvey, significant advances were on the horizon and expectations were on the rise for the GMO. In Part 2, we will explore this growth and see how these lessons and the efforts of many led to the current state of geospatial preparedness and capability in the DHS’ geospatial shop.
Geospatial Management Office, established by Intelligence Reform and Terrorism Prevention Act of 2004 Title VII, Subtitle B, Section 8201, Homeland Security Geospatial Information – Implemented through DHS Management Directive 4030, 11/12/2004.
Guest author Nate Smith is an independent consultant who has worked for over 25 years advancing the adoption of geospatial technology to disaster management, humanitarian response and natural disaster risk reduction.